Zip Codes with the Highest Percentage of Population Carpooling to Work in Paterson, NJ
RELATED REPORTS & OPTIONS
Drive | Carpool
Paterson
Compare Zip Codes
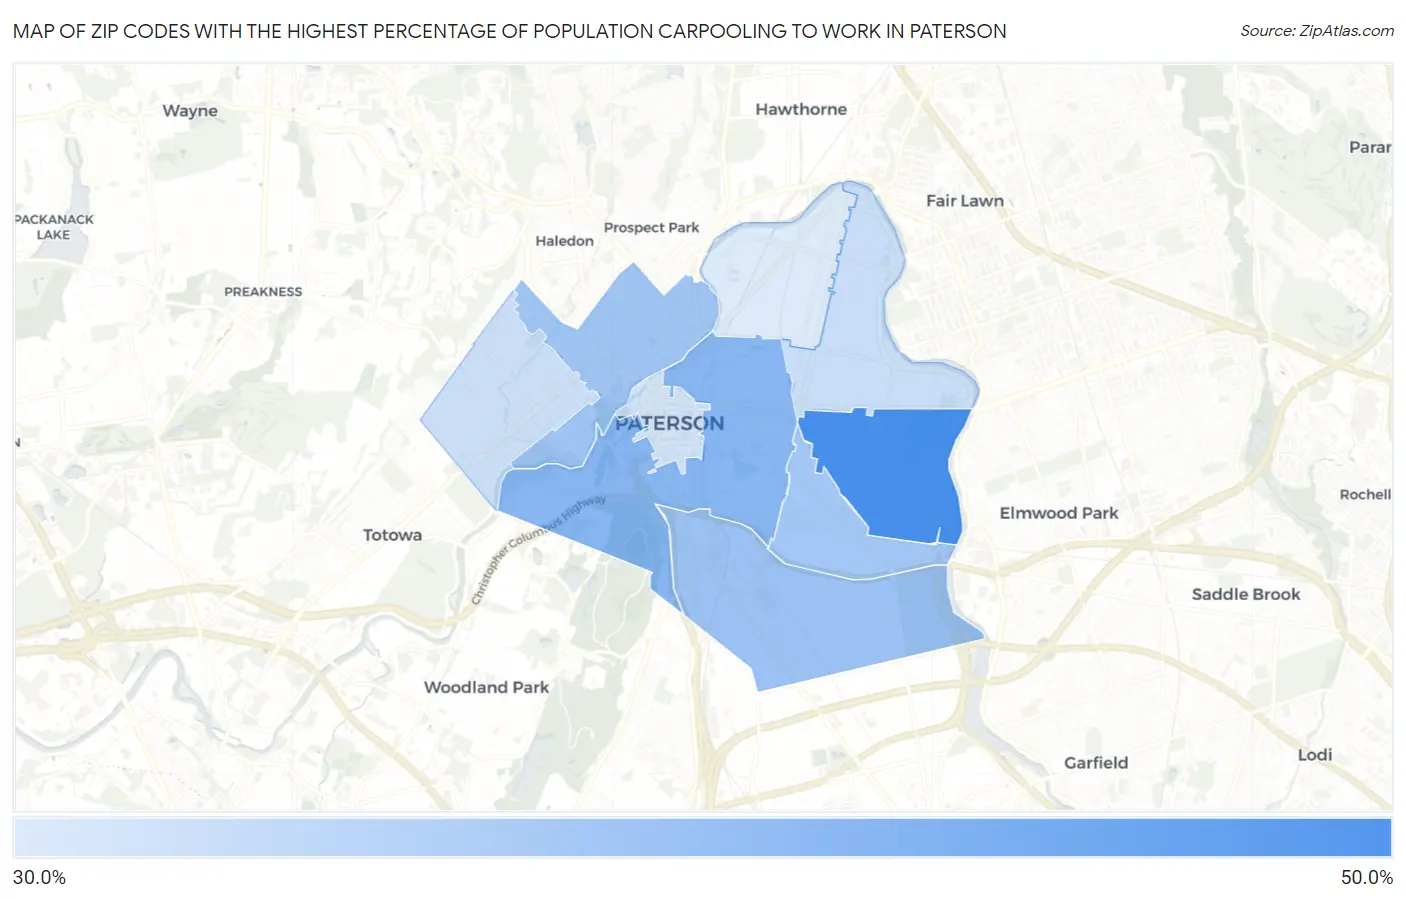
Map of Zip Codes with the Highest Percentage of Population Carpooling to Work in Paterson
35.7%
47.5%
Zip Codes with the Highest Percentage of Population Carpooling to Work in Paterson, NJ
| Zip Code | % Carpool | vs State | vs National | |
| 1. | 07504 | 47.5% | 40.8%(+6.70)#117 | 38.2%(+9.30)#4,051 |
| 2. | 07501 | 42.3% | 40.8%(+1.50)#234 | 38.2%(+4.10)#8,434 |
| 3. | 07503 | 40.6% | 40.8%(-0.200)#293 | 38.2%(+2.40)#10,534 |
| 4. | 07522 | 40.3% | 40.8%(-0.500)#308 | 38.2%(+2.10)#11,005 |
| 5. | 07513 | 40.1% | 40.8%(-0.700)#313 | 38.2%(+1.90)#11,298 |
| 6. | 07514 | 37.3% | 40.8%(-3.50)#393 | 38.2%(-0.900)#15,367 |
| 7. | 07502 | 37.0% | 40.8%(-3.80)#401 | 38.2%(-1.20)#15,747 |
| 8. | 07505 | 36.6% | 40.8%(-4.20)#409 | 38.2%(-1.60)#16,365 |
| 9. | 07524 | 35.7% | 40.8%(-5.10)#432 | 38.2%(-2.50)#17,579 |
1
Common Questions
What are the Top 5 Zip Codes with the Highest Percentage of Population Carpooling to Work in Paterson, NJ?
Top 5 Zip Codes with the Highest Percentage of Population Carpooling to Work in Paterson, NJ are:
What zip code has the Highest Percentage of Population Carpooling to Work in Paterson, NJ?
07504 has the Highest Percentage of Population Carpooling to Work in Paterson, NJ with 47.5%.
What is the Percentage of Population Carpooling to Work in Paterson, NJ?
Percentage of Population Carpooling to Work in Paterson is 40.0%.
What is the Percentage of Population Carpooling to Work in New Jersey?
Percentage of Population Carpooling to Work in New Jersey is 40.8%.
What is the Percentage of Population Carpooling to Work in the United States?
Percentage of Population Carpooling to Work in the United States is 38.2%.