Zip Codes with the Highest Percentage of Population Employed in Agriculture, Fishing & Hunting in Paterson, NJ
RELATED REPORTS & OPTIONS
Agriculture, Fishing & Hunting
Paterson
Compare Zip Codes
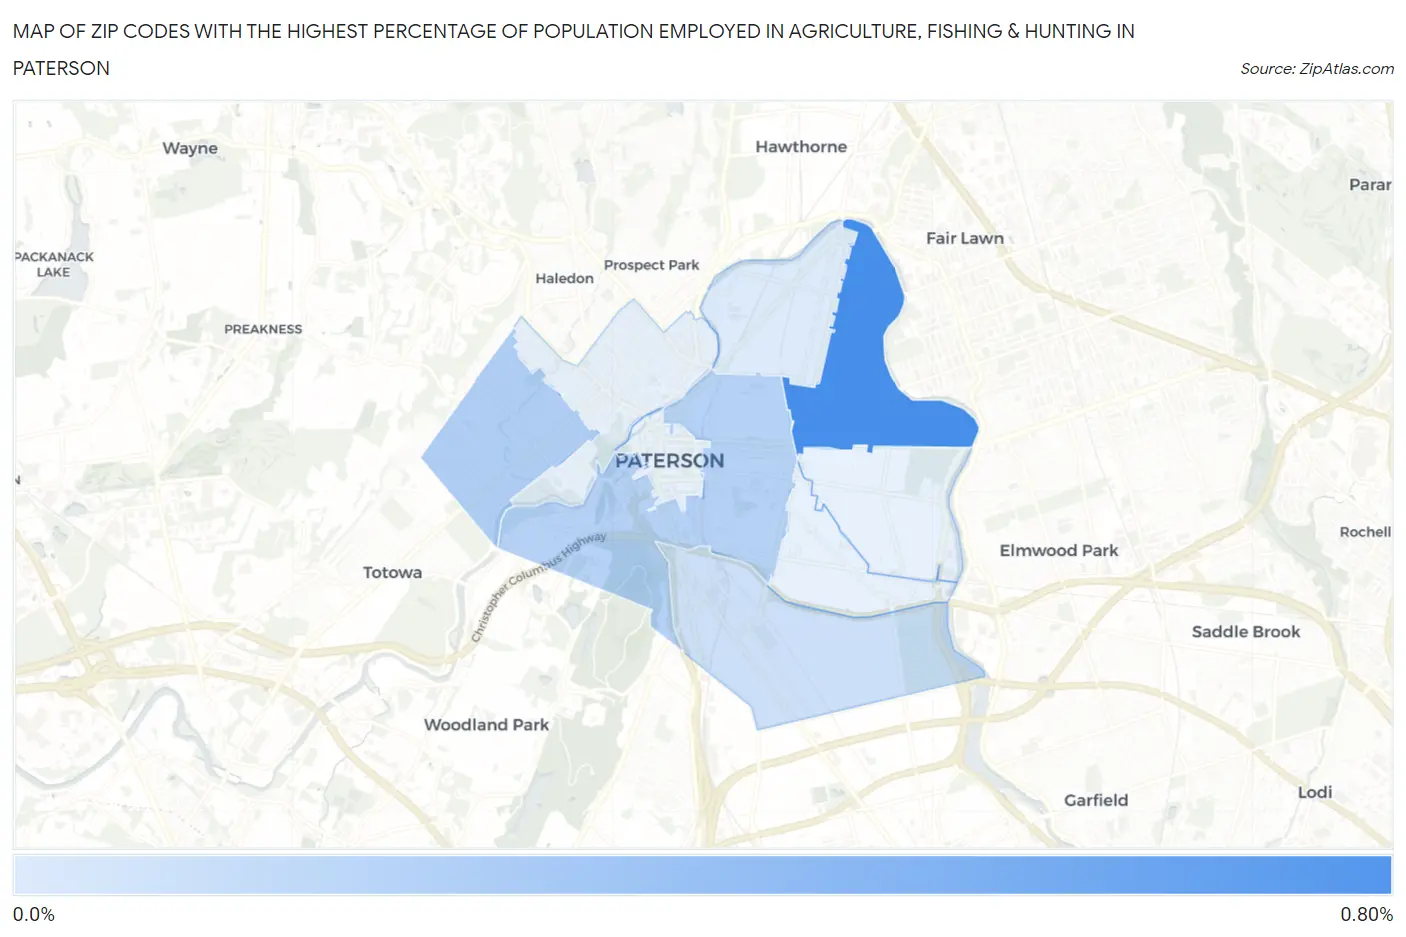
Map of Zip Codes with the Highest Percentage of Population Employed in Agriculture, Fishing & Hunting in Paterson
0.11%
0.75%
Zip Codes with the Highest Percentage of Population Employed in Agriculture, Fishing & Hunting in Paterson, NJ
| Zip Code | % Employed | vs State | vs National | |
| 1. | 07514 | 0.75% | 0.26%(+0.482)#79 | 1.2%(-0.454)#17,566 |
| 2. | 07502 | 0.29% | 0.26%(+0.028)#161 | 1.2%(-0.908)#21,264 |
| 3. | 07501 | 0.28% | 0.26%(+0.014)#167 | 1.2%(-0.923)#21,450 |
| 4. | 07503 | 0.18% | 0.26%(-0.087)#215 | 1.2%(-1.02)#22,646 |
| 5. | 07524 | 0.11% | 0.26%(-0.157)#260 | 1.2%(-1.09)#23,581 |
1
Common Questions
What are the Top 5 Zip Codes with the Highest Percentage of Population Employed in Agriculture, Fishing & Hunting in Paterson, NJ?
Top 5 Zip Codes with the Highest Percentage of Population Employed in Agriculture, Fishing & Hunting in Paterson, NJ are:
What zip code has the Highest Percentage of Population Employed in Agriculture, Fishing & Hunting in Paterson, NJ?
07514 has the Highest Percentage of Population Employed in Agriculture, Fishing & Hunting in Paterson, NJ with 0.75%.
What is the Percentage of Population Employed in Agriculture, Fishing & Hunting in Paterson, NJ?
Percentage of Population Employed in Agriculture, Fishing & Hunting in Paterson is 0.22%.
What is the Percentage of Population Employed in Agriculture, Fishing & Hunting in New Jersey?
Percentage of Population Employed in Agriculture, Fishing & Hunting in New Jersey is 0.26%.
What is the Percentage of Population Employed in Agriculture, Fishing & Hunting in the United States?
Percentage of Population Employed in Agriculture, Fishing & Hunting in the United States is 1.2%.