Zip Codes with the Highest Percentage of Population Employed in Farming, Fishing & Forestry in East Orange, NJ
RELATED REPORTS & OPTIONS
Farming, Fishing & Forestry
East Orange
Compare Zip Codes
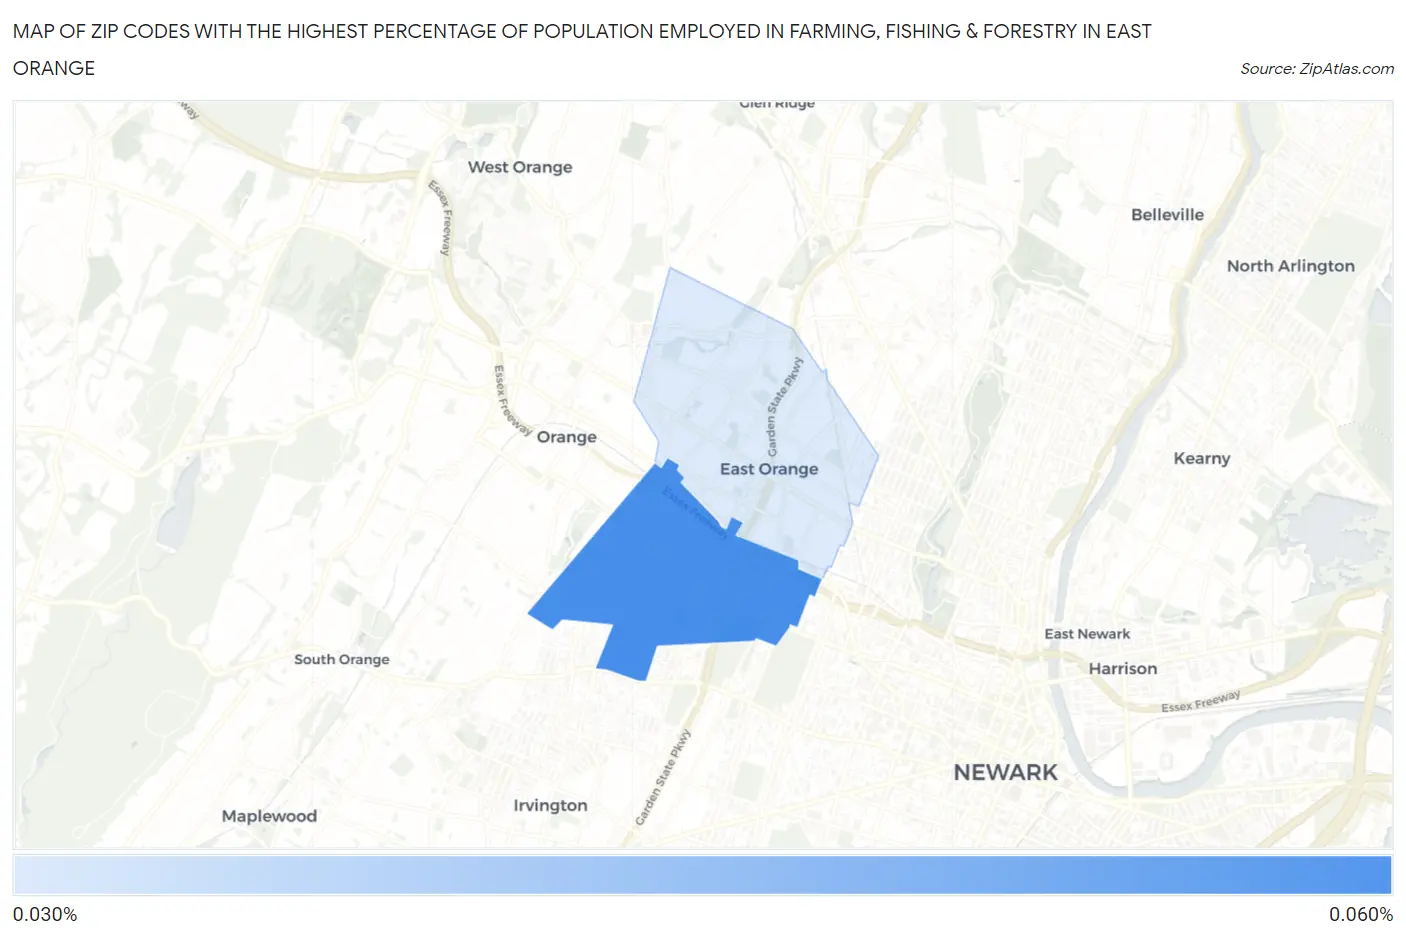
Map of Zip Codes with the Highest Percentage of Population Employed in Farming, Fishing & Forestry in East Orange
0.0%
0.060%
Zip Codes with the Highest Percentage of Population Employed in Farming, Fishing & Forestry in East Orange, NJ
| Zip Code | % Employed | vs State | vs National | |
| 1. | 07018 | 0.058% | 0.14%(-0.087)#190 | 0.61%(-0.548)#18,519 |
| 2. | 07017 | 0.033% | 0.14%(-0.111)#203 | 0.61%(-0.572)#18,915 |
1
Common Questions
What are the Top Zip Codes with the Highest Percentage of Population Employed in Farming, Fishing & Forestry in East Orange, NJ?
Top Zip Codes with the Highest Percentage of Population Employed in Farming, Fishing & Forestry in East Orange, NJ are:
What zip code has the Highest Percentage of Population Employed in Farming, Fishing & Forestry in East Orange, NJ?
07018 has the Highest Percentage of Population Employed in Farming, Fishing & Forestry in East Orange, NJ with 0.058%.
What is the Percentage of Population Employed in Farming, Fishing & Forestry in East Orange, NJ?
Percentage of Population Employed in Farming, Fishing & Forestry in East Orange is 0.044%.
What is the Percentage of Population Employed in Farming, Fishing & Forestry in New Jersey?
Percentage of Population Employed in Farming, Fishing & Forestry in New Jersey is 0.14%.
What is the Percentage of Population Employed in Farming, Fishing & Forestry in the United States?
Percentage of Population Employed in Farming, Fishing & Forestry in the United States is 0.61%.