Zip Codes with the Highest Percentage of Population Employed in Farming, Fishing & Forestry in Brick, NJ
RELATED REPORTS & OPTIONS
Farming, Fishing & Forestry
Brick
Compare Zip Codes
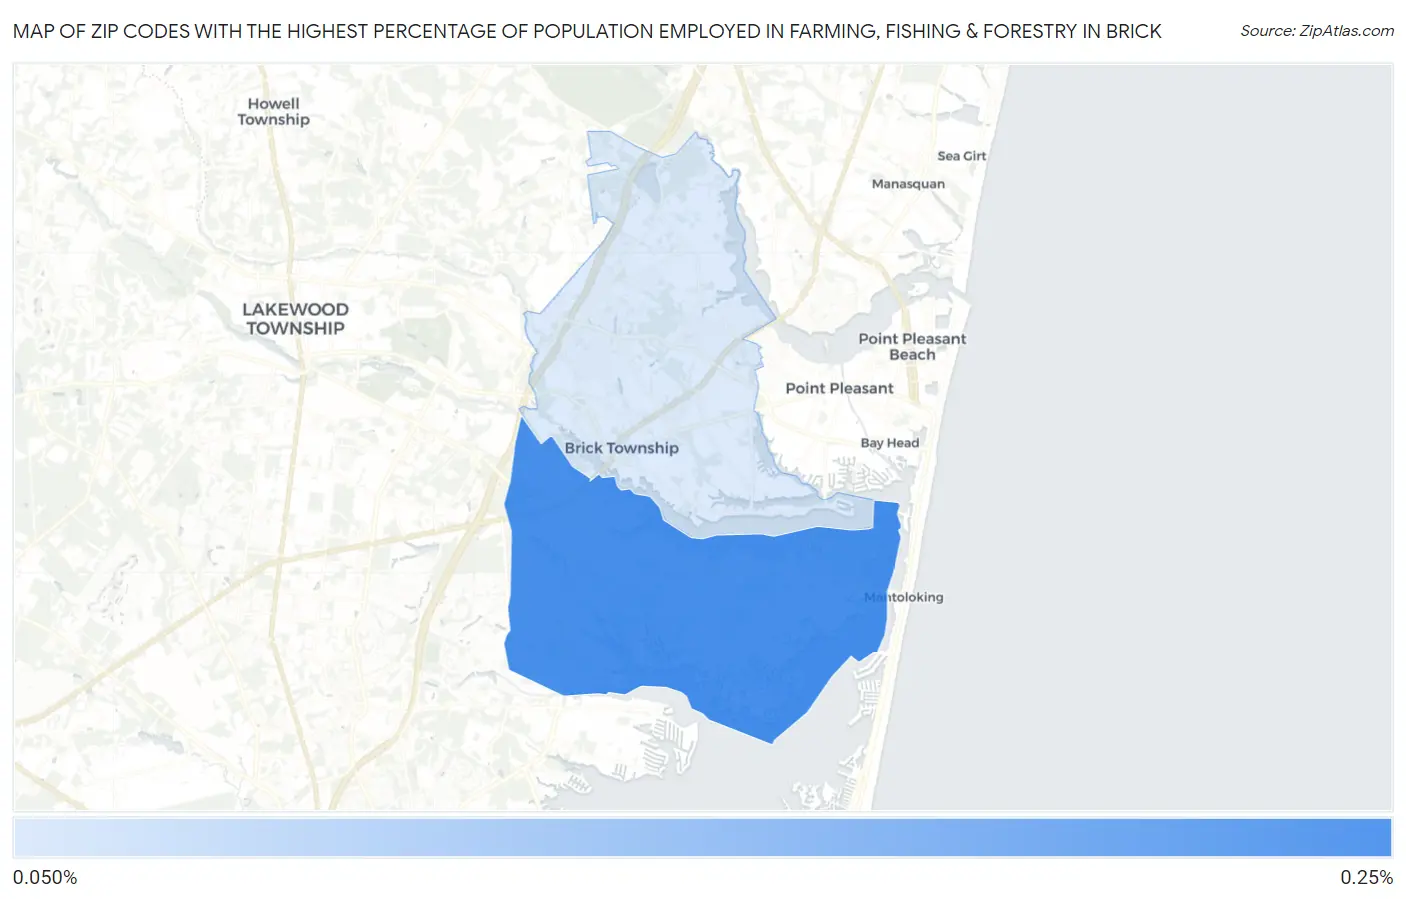
Map of Zip Codes with the Highest Percentage of Population Employed in Farming, Fishing & Forestry in Brick
0.0%
0.25%
Zip Codes with the Highest Percentage of Population Employed in Farming, Fishing & Forestry in Brick, NJ
| Zip Code | % Employed | vs State | vs National | |
| 1. | 08723 | 0.22% | 0.14%(+0.073)#113 | 0.61%(-0.389)#15,888 |
| 2. | 08724 | 0.14% | 0.14%(-0.006)#149 | 0.61%(-0.468)#17,139 |
1
Common Questions
What are the Top Zip Codes with the Highest Percentage of Population Employed in Farming, Fishing & Forestry in Brick, NJ?
Top Zip Codes with the Highest Percentage of Population Employed in Farming, Fishing & Forestry in Brick, NJ are:
What zip code has the Highest Percentage of Population Employed in Farming, Fishing & Forestry in Brick, NJ?
08723 has the Highest Percentage of Population Employed in Farming, Fishing & Forestry in Brick, NJ with 0.22%.
What is the Percentage of Population Employed in Farming, Fishing & Forestry in New Jersey?
Percentage of Population Employed in Farming, Fishing & Forestry in New Jersey is 0.14%.
What is the Percentage of Population Employed in Farming, Fishing & Forestry in the United States?
Percentage of Population Employed in Farming, Fishing & Forestry in the United States is 0.61%.