Zip Codes with the Highest Percentage of Population Employed in Arts, Entertainment & Recreation in New Hampshire
RELATED REPORTS & OPTIONS
Arts, Entertainment & Recreation
New Hampshire
Compare Zip Codes
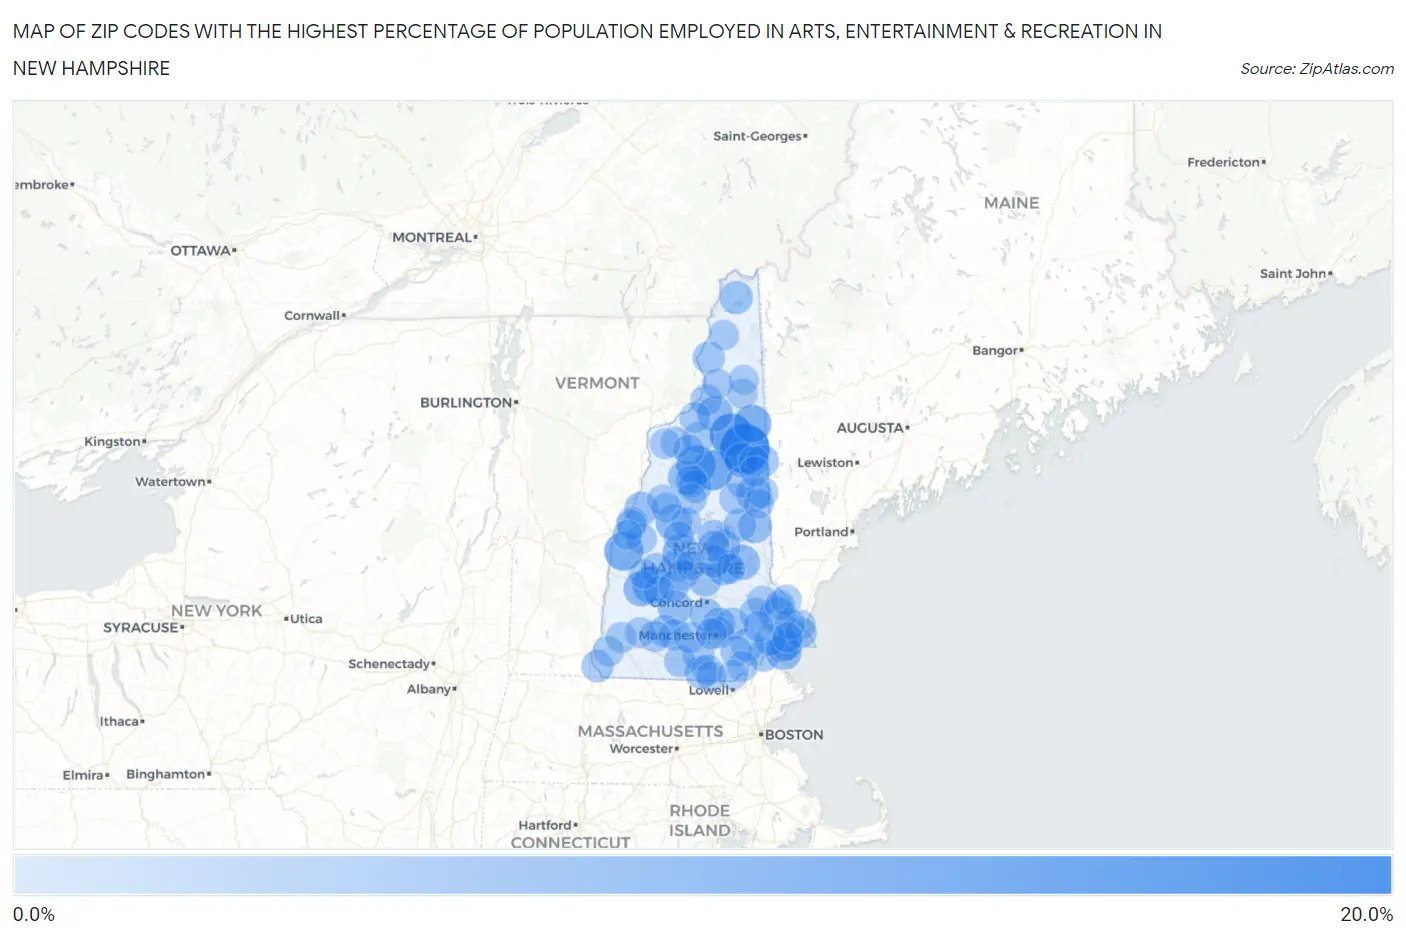
Map of Zip Codes with the Highest Percentage of Population Employed in Arts, Entertainment & Recreation in New Hampshire
0.0%
20.0%
Zip Codes with the Highest Percentage of Population Employed in Arts, Entertainment & Recreation in New Hampshire
| Zip Code | % Employed | vs State | vs National | |
| 1. | 03846 | 15.6% | 1.9%(+13.7)#1 | 2.1%(+13.5)#312 |
| 2. | 03593 | 10.9% | 1.9%(+9.02)#2 | 2.1%(+8.79)#611 |
| 3. | 03215 | 9.1% | 1.9%(+7.24)#3 | 2.1%(+7.01)#838 |
| 4. | 03251 | 8.4% | 1.9%(+6.56)#4 | 2.1%(+6.33)#966 |
| 5. | 03770 | 7.9% | 1.9%(+6.10)#5 | 2.1%(+5.86)#1,070 |
| 6. | 03255 | 7.0% | 1.9%(+5.17)#6 | 2.1%(+4.94)#1,320 |
| 7. | 03581 | 7.0% | 1.9%(+5.16)#7 | 2.1%(+4.93)#1,324 |
| 8. | 03243 | 6.7% | 1.9%(+4.83)#8 | 2.1%(+4.60)#1,422 |
| 9. | 03824 | 6.0% | 1.9%(+4.16)#9 | 2.1%(+3.93)#1,698 |
| 10. | 03241 | 6.0% | 1.9%(+4.15)#10 | 2.1%(+3.92)#1,702 |
| 11. | 03583 | 5.5% | 1.9%(+3.68)#11 | 2.1%(+3.45)#1,948 |
| 12. | 03237 | 5.3% | 1.9%(+3.48)#12 | 2.1%(+3.25)#2,065 |
| 13. | 03874 | 5.3% | 1.9%(+3.47)#13 | 2.1%(+3.24)#2,068 |
| 14. | 03752 | 5.3% | 1.9%(+3.46)#14 | 2.1%(+3.23)#2,074 |
| 15. | 03849 | 5.2% | 1.9%(+3.40)#15 | 2.1%(+3.17)#2,120 |
| 16. | 03809 | 5.1% | 1.9%(+3.21)#16 | 2.1%(+2.98)#2,244 |
| 17. | 03242 | 4.9% | 1.9%(+3.04)#17 | 2.1%(+2.81)#2,366 |
| 18. | 03262 | 4.6% | 1.9%(+2.76)#18 | 2.1%(+2.53)#2,620 |
| 19. | 03838 | 4.5% | 1.9%(+2.63)#19 | 2.1%(+2.40)#2,771 |
| 20. | 03768 | 4.4% | 1.9%(+2.58)#20 | 2.1%(+2.35)#2,818 |
| 21. | 03864 | 4.2% | 1.9%(+2.32)#21 | 2.1%(+2.08)#3,120 |
| 22. | 03249 | 4.0% | 1.9%(+2.13)#22 | 2.1%(+1.90)#3,364 |
| 23. | 03224 | 4.0% | 1.9%(+2.12)#23 | 2.1%(+1.89)#3,371 |
| 24. | 03873 | 3.9% | 1.9%(+2.02)#24 | 2.1%(+1.79)#3,520 |
| 25. | 03592 | 3.9% | 1.9%(+2.01)#25 | 2.1%(+1.78)#3,536 |
| 26. | 03304 | 3.8% | 1.9%(+1.95)#26 | 2.1%(+1.72)#3,624 |
| 27. | 03858 | 3.8% | 1.9%(+1.92)#27 | 2.1%(+1.68)#3,679 |
| 28. | 03813 | 3.6% | 1.9%(+1.79)#28 | 2.1%(+1.56)#3,858 |
| 29. | 03253 | 3.6% | 1.9%(+1.78)#29 | 2.1%(+1.55)#3,887 |
| 30. | 03285 | 3.6% | 1.9%(+1.77)#30 | 2.1%(+1.53)#3,922 |
| 31. | 03216 | 3.5% | 1.9%(+1.70)#31 | 2.1%(+1.47)#4,032 |
| 32. | 03816 | 3.5% | 1.9%(+1.68)#32 | 2.1%(+1.45)#4,058 |
| 33. | 03049 | 3.5% | 1.9%(+1.64)#33 | 2.1%(+1.40)#4,161 |
| 34. | 03844 | 3.5% | 1.9%(+1.61)#34 | 2.1%(+1.38)#4,223 |
| 35. | 03106 | 3.4% | 1.9%(+1.57)#35 | 2.1%(+1.34)#4,304 |
| 36. | 03220 | 3.4% | 1.9%(+1.57)#36 | 2.1%(+1.34)#4,311 |
| 37. | 03034 | 3.3% | 1.9%(+1.44)#37 | 2.1%(+1.21)#4,592 |
| 38. | 03442 | 3.3% | 1.9%(+1.44)#38 | 2.1%(+1.21)#4,598 |
| 39. | 03842 | 3.3% | 1.9%(+1.41)#39 | 2.1%(+1.18)#4,646 |
| 40. | 03590 | 3.2% | 1.9%(+1.34)#40 | 2.1%(+1.11)#4,828 |
| 41. | 03451 | 3.2% | 1.9%(+1.33)#41 | 2.1%(+1.10)#4,861 |
| 42. | 03293 | 3.1% | 1.9%(+1.27)#42 | 2.1%(+1.04)#5,001 |
| 43. | 03031 | 3.0% | 1.9%(+1.18)#43 | 2.1%(+0.947)#5,274 |
| 44. | 03086 | 2.9% | 1.9%(+1.09)#44 | 2.1%(+0.863)#5,519 |
| 45. | 03257 | 2.9% | 1.9%(+1.09)#45 | 2.1%(+0.855)#5,548 |
| 46. | 03043 | 2.9% | 1.9%(+1.06)#46 | 2.1%(+0.829)#5,616 |
| 47. | 03584 | 2.9% | 1.9%(+1.05)#47 | 2.1%(+0.818)#5,642 |
| 48. | 03290 | 2.9% | 1.9%(+1.03)#48 | 2.1%(+0.802)#5,694 |
| 49. | 03104 | 2.8% | 1.9%(+0.990)#49 | 2.1%(+0.759)#5,847 |
| 50. | 03246 | 2.8% | 1.9%(+0.903)#50 | 2.1%(+0.672)#6,165 |
| 51. | 03070 | 2.8% | 1.9%(+0.899)#51 | 2.1%(+0.668)#6,185 |
| 52. | 03886 | 2.7% | 1.9%(+0.862)#52 | 2.1%(+0.631)#6,307 |
| 53. | 03574 | 2.7% | 1.9%(+0.822)#53 | 2.1%(+0.591)#6,468 |
| 54. | 03833 | 2.7% | 1.9%(+0.805)#54 | 2.1%(+0.574)#6,533 |
| 55. | 03038 | 2.7% | 1.9%(+0.799)#55 | 2.1%(+0.568)#6,561 |
| 56. | 03832 | 2.6% | 1.9%(+0.798)#56 | 2.1%(+0.566)#6,564 |
| 57. | 03755 | 2.6% | 1.9%(+0.790)#57 | 2.1%(+0.559)#6,603 |
| 58. | 03268 | 2.6% | 1.9%(+0.776)#58 | 2.1%(+0.545)#6,650 |
| 59. | 03449 | 2.6% | 1.9%(+0.707)#59 | 2.1%(+0.476)#6,920 |
| 60. | 03102 | 2.5% | 1.9%(+0.680)#60 | 2.1%(+0.449)#7,042 |
| 61. | 03586 | 2.5% | 1.9%(+0.625)#61 | 2.1%(+0.394)#7,276 |
| 62. | 03223 | 2.4% | 1.9%(+0.575)#62 | 2.1%(+0.344)#7,522 |
| 63. | 03854 | 2.4% | 1.9%(+0.555)#63 | 2.1%(+0.324)#7,617 |
| 64. | 03748 | 2.4% | 1.9%(+0.553)#64 | 2.1%(+0.322)#7,632 |
| 65. | 03870 | 2.3% | 1.9%(+0.483)#65 | 2.1%(+0.251)#7,961 |
| 66. | 03580 | 2.3% | 1.9%(+0.478)#66 | 2.1%(+0.247)#7,985 |
| 67. | 03221 | 2.3% | 1.9%(+0.472)#67 | 2.1%(+0.241)#8,018 |
| 68. | 03598 | 2.3% | 1.9%(+0.470)#68 | 2.1%(+0.239)#8,031 |
| 69. | 03063 | 2.3% | 1.9%(+0.464)#69 | 2.1%(+0.233)#8,049 |
| 70. | 03825 | 2.3% | 1.9%(+0.457)#70 | 2.1%(+0.226)#8,086 |
| 71. | 03042 | 2.3% | 1.9%(+0.438)#71 | 2.1%(+0.207)#8,178 |
| 72. | 03869 | 2.3% | 1.9%(+0.435)#72 | 2.1%(+0.204)#8,193 |
| 73. | 03801 | 2.3% | 1.9%(+0.414)#73 | 2.1%(+0.183)#8,296 |
| 74. | 03282 | 2.3% | 1.9%(+0.413)#74 | 2.1%(+0.182)#8,307 |
| 75. | 03431 | 2.2% | 1.9%(+0.394)#75 | 2.1%(+0.163)#8,398 |
| 76. | 03818 | 2.2% | 1.9%(+0.339)#76 | 2.1%(+0.108)#8,694 |
| 77. | 03079 | 2.2% | 1.9%(+0.333)#77 | 2.1%(+0.102)#8,726 |
| 78. | 03845 | 2.2% | 1.9%(+0.312)#78 | 2.1%(+0.081)#8,845 |
| 79. | 03278 | 2.1% | 1.9%(+0.283)#79 | 2.1%(+0.052)#9,019 |
| 80. | 03585 | 2.1% | 1.9%(+0.273)#80 | 2.1%(+0.042)#9,074 |
| 81. | 03582 | 2.1% | 1.9%(+0.216)#81 | 2.1%(-0.015)#9,384 |
| 82. | 03457 | 2.1% | 1.9%(+0.205)#82 | 2.1%(-0.026)#9,454 |
| 83. | 03235 | 2.0% | 1.9%(+0.188)#83 | 2.1%(-0.044)#9,558 |
| 84. | 03862 | 2.0% | 1.9%(+0.187)#84 | 2.1%(-0.044)#9,562 |
| 85. | 03264 | 2.0% | 1.9%(+0.167)#85 | 2.1%(-0.064)#9,662 |
| 86. | 03462 | 2.0% | 1.9%(+0.154)#86 | 2.1%(-0.078)#9,747 |
| 87. | 03576 | 2.0% | 1.9%(+0.144)#87 | 2.1%(-0.087)#9,810 |
| 88. | 03266 | 2.0% | 1.9%(+0.111)#88 | 2.1%(-0.120)#10,000 |
| 89. | 03570 | 1.9% | 1.9%(+0.097)#89 | 2.1%(-0.134)#10,092 |
| 90. | 03837 | 1.9% | 1.9%(+0.080)#90 | 2.1%(-0.151)#10,187 |
| 91. | 03588 | 1.9% | 1.9%(+0.065)#91 | 2.1%(-0.166)#10,291 |
| 92. | 03750 | 1.9% | 1.9%(+0.047)#92 | 2.1%(-0.184)#10,390 |
| 93. | 03820 | 1.9% | 1.9%(+0.024)#93 | 2.1%(-0.207)#10,516 |
| 94. | 03782 | 1.9% | 1.9%(+0.015)#94 | 2.1%(-0.216)#10,575 |
| 95. | 03062 | 1.9% | 1.9%(+0.012)#95 | 2.1%(-0.219)#10,590 |
| 96. | 03766 | 1.9% | 1.9%(+0.009)#96 | 2.1%(-0.222)#10,616 |
| 97. | 03076 | 1.9% | 1.9%(+0.008)#97 | 2.1%(-0.223)#10,626 |
| 98. | 03836 | 1.9% | 1.9%(+0.008)#98 | 2.1%(-0.223)#10,627 |
| 99. | 03860 | 1.8% | 1.9%(-0.006)#99 | 2.1%(-0.237)#10,721 |
| 100. | 03222 | 1.8% | 1.9%(-0.026)#100 | 2.1%(-0.257)#10,841 |
Common Questions
What are the Top 10 Zip Codes with the Highest Percentage of Population Employed in Arts, Entertainment & Recreation in New Hampshire?
Top 10 Zip Codes with the Highest Percentage of Population Employed in Arts, Entertainment & Recreation in New Hampshire are:
What zip code has the Highest Percentage of Population Employed in Arts, Entertainment & Recreation in New Hampshire?
03846 has the Highest Percentage of Population Employed in Arts, Entertainment & Recreation in New Hampshire with 15.6%.
What is the Percentage of Population Employed in Arts, Entertainment & Recreation in the State of New Hampshire?
Percentage of Population Employed in Arts, Entertainment & Recreation in New Hampshire is 1.9%.
What is the Percentage of Population Employed in Arts, Entertainment & Recreation in the United States?
Percentage of Population Employed in Arts, Entertainment & Recreation in the United States is 2.1%.