Zip Codes with the Highest Percentage of Population Employed in Arts, Entertainment & Recreation in Nebraska
RELATED REPORTS & OPTIONS
Arts, Entertainment & Recreation
Nebraska
Compare Zip Codes
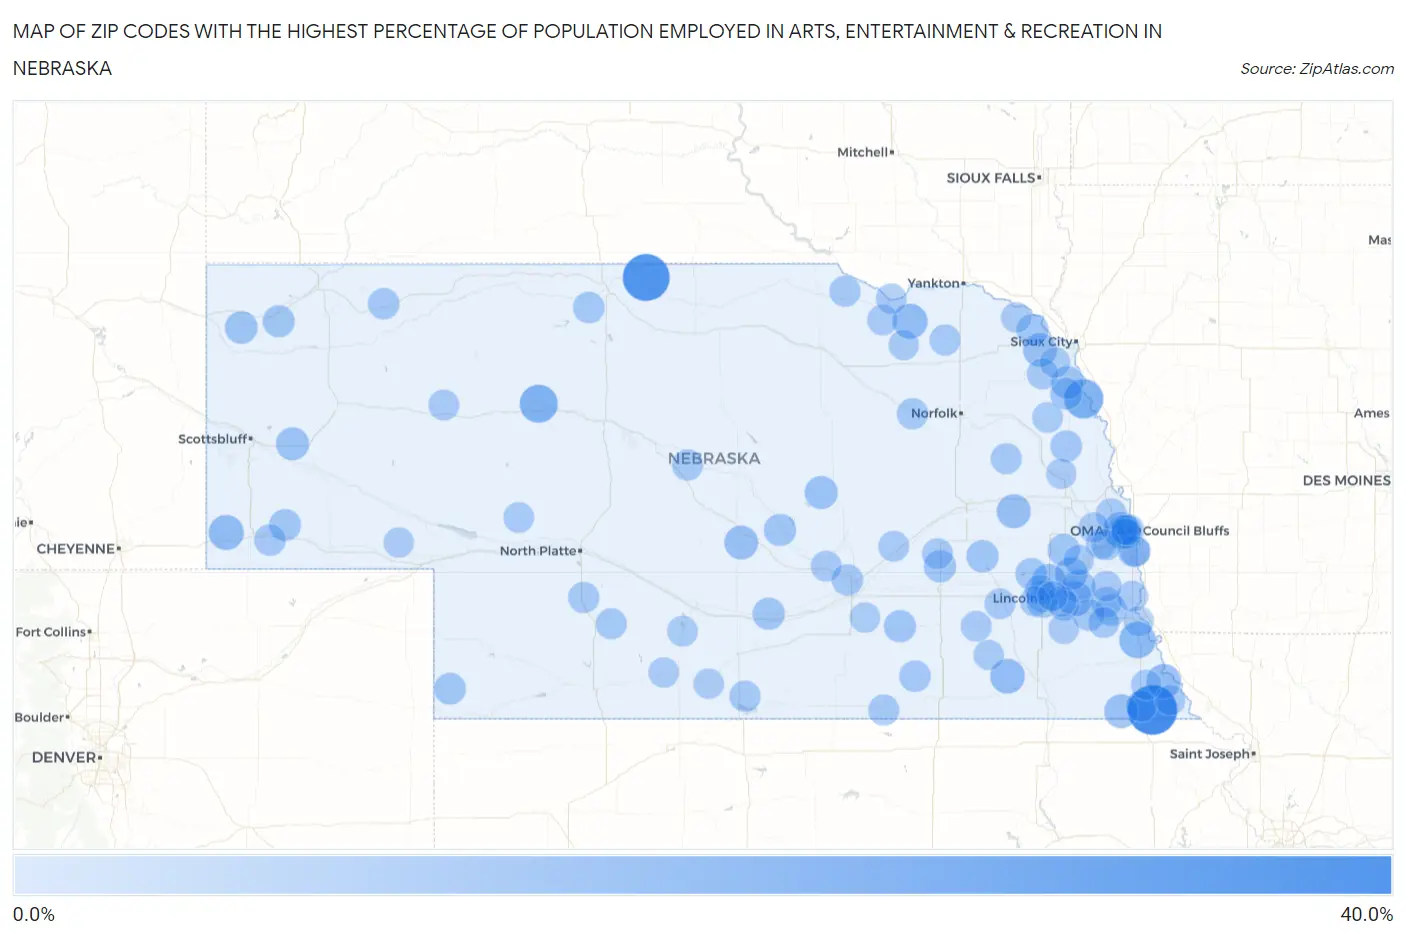
Map of Zip Codes with the Highest Percentage of Population Employed in Arts, Entertainment & Recreation in Nebraska
0.0%
40.0%
Zip Codes with the Highest Percentage of Population Employed in Arts, Entertainment & Recreation in Nebraska
| Zip Code | % Employed | vs State | vs National | |
| 1. | 68433 | 34.0% | 1.6%(+32.5)#1 | 2.1%(+32.0)#65 |
| 2. | 69220 | 29.4% | 1.6%(+27.8)#2 | 2.1%(+27.3)#79 |
| 3. | 68039 | 16.7% | 1.6%(+15.2)#3 | 2.1%(+14.6)#261 |
| 4. | 69152 | 14.7% | 1.6%(+13.2)#4 | 2.1%(+12.7)#348 |
| 5. | 68379 | 12.0% | 1.6%(+10.4)#5 | 2.1%(+9.92)#509 |
| 6. | 68182 | 11.2% | 1.6%(+9.60)#6 | 2.1%(+9.09)#584 |
| 7. | 69128 | 9.9% | 1.6%(+8.35)#7 | 2.1%(+7.84)#714 |
| 8. | 68724 | 9.8% | 1.6%(+8.20)#8 | 2.1%(+7.69)#737 |
| 9. | 68347 | 9.5% | 1.6%(+7.91)#9 | 2.1%(+7.40)#782 |
| 10. | 68424 | 9.1% | 1.6%(+7.58)#10 | 2.1%(+7.07)#827 |
| 11. | 68437 | 9.0% | 1.6%(+7.47)#11 | 2.1%(+6.96)#850 |
| 12. | 68514 | 8.9% | 1.6%(+7.30)#12 | 2.1%(+6.79)#872 |
| 13. | 68036 | 8.2% | 1.6%(+6.64)#13 | 2.1%(+6.13)#1,000 |
| 14. | 68345 | 7.9% | 1.6%(+6.29)#14 | 2.1%(+5.78)#1,094 |
| 15. | 68855 | 7.8% | 1.6%(+6.21)#15 | 2.1%(+5.70)#1,113 |
| 16. | 68785 | 7.8% | 1.6%(+6.18)#16 | 2.1%(+5.67)#1,118 |
| 17. | 68875 | 6.7% | 1.6%(+5.12)#17 | 2.1%(+4.61)#1,420 |
| 18. | 68304 | 6.7% | 1.6%(+5.10)#18 | 2.1%(+4.58)#1,434 |
| 19. | 69334 | 6.6% | 1.6%(+4.99)#19 | 2.1%(+4.47)#1,470 |
| 20. | 68366 | 6.6% | 1.6%(+4.98)#20 | 2.1%(+4.47)#1,473 |
| 21. | 68071 | 6.0% | 1.6%(+4.46)#21 | 2.1%(+3.95)#1,682 |
| 22. | 69346 | 5.9% | 1.6%(+4.34)#22 | 2.1%(+3.83)#1,740 |
| 23. | 68033 | 5.6% | 1.6%(+3.98)#23 | 2.1%(+3.47)#1,936 |
| 24. | 68316 | 5.4% | 1.6%(+3.85)#24 | 2.1%(+3.33)#2,013 |
| 25. | 68669 | 5.2% | 1.6%(+3.67)#25 | 2.1%(+3.16)#2,129 |
| 26. | 68849 | 5.2% | 1.6%(+3.63)#26 | 2.1%(+3.12)#2,150 |
| 27. | 68975 | 5.2% | 1.6%(+3.60)#27 | 2.1%(+3.09)#2,175 |
| 28. | 68853 | 5.2% | 1.6%(+3.58)#28 | 2.1%(+3.07)#2,182 |
| 29. | 68770 | 5.0% | 1.6%(+3.47)#29 | 2.1%(+2.96)#2,258 |
| 30. | 68067 | 5.0% | 1.6%(+3.42)#30 | 2.1%(+2.91)#2,294 |
| 31. | 69339 | 4.9% | 1.6%(+3.33)#31 | 2.1%(+2.82)#2,362 |
| 32. | 69156 | 4.6% | 1.6%(+3.04)#32 | 2.1%(+2.53)#2,612 |
| 33. | 69030 | 4.6% | 1.6%(+3.02)#33 | 2.1%(+2.50)#2,640 |
| 34. | 68508 | 4.5% | 1.6%(+2.98)#34 | 2.1%(+2.46)#2,681 |
| 35. | 68113 | 4.5% | 1.6%(+2.89)#35 | 2.1%(+2.38)#2,784 |
| 36. | 69133 | 4.4% | 1.6%(+2.82)#36 | 2.1%(+2.31)#2,852 |
| 37. | 68417 | 4.3% | 1.6%(+2.75)#37 | 2.1%(+2.24)#2,934 |
| 38. | 68428 | 4.3% | 1.6%(+2.74)#38 | 2.1%(+2.23)#2,955 |
| 39. | 68045 | 4.3% | 1.6%(+2.70)#39 | 2.1%(+2.19)#2,994 |
| 40. | 68454 | 4.3% | 1.6%(+2.70)#40 | 2.1%(+2.19)#2,998 |
| 41. | 68335 | 4.2% | 1.6%(+2.61)#41 | 2.1%(+2.10)#3,102 |
| 42. | 68803 | 4.1% | 1.6%(+2.53)#42 | 2.1%(+2.01)#3,207 |
| 43. | 69201 | 4.0% | 1.6%(+2.44)#43 | 2.1%(+1.92)#3,325 |
| 44. | 69360 | 3.9% | 1.6%(+2.36)#44 | 2.1%(+1.85)#3,424 |
| 45. | 69170 | 3.6% | 1.6%(+2.08)#45 | 2.1%(+1.57)#3,851 |
| 46. | 68781 | 3.6% | 1.6%(+2.05)#46 | 2.1%(+1.54)#3,918 |
| 47. | 68920 | 3.5% | 1.6%(+1.90)#47 | 2.1%(+1.39)#4,188 |
| 48. | 68746 | 3.5% | 1.6%(+1.90)#48 | 2.1%(+1.39)#4,199 |
| 49. | 68461 | 3.4% | 1.6%(+1.88)#49 | 2.1%(+1.37)#4,241 |
| 50. | 68813 | 3.4% | 1.6%(+1.86)#50 | 2.1%(+1.35)#4,276 |
| 51. | 68733 | 3.4% | 1.6%(+1.86)#51 | 2.1%(+1.35)#4,297 |
| 52. | 68337 | 3.4% | 1.6%(+1.85)#52 | 2.1%(+1.34)#4,303 |
| 53. | 69025 | 3.4% | 1.6%(+1.84)#53 | 2.1%(+1.33)#4,327 |
| 54. | 68978 | 3.4% | 1.6%(+1.78)#54 | 2.1%(+1.27)#4,464 |
| 55. | 68641 | 3.3% | 1.6%(+1.73)#55 | 2.1%(+1.22)#4,561 |
| 56. | 68786 | 3.3% | 1.6%(+1.72)#56 | 2.1%(+1.21)#4,586 |
| 57. | 68307 | 3.3% | 1.6%(+1.72)#57 | 2.1%(+1.21)#4,589 |
| 58. | 68446 | 3.3% | 1.6%(+1.70)#58 | 2.1%(+1.18)#4,642 |
| 59. | 68178 | 3.2% | 1.6%(+1.67)#59 | 2.1%(+1.15)#4,712 |
| 60. | 68106 | 3.2% | 1.6%(+1.65)#60 | 2.1%(+1.14)#4,749 |
| 61. | 68502 | 3.1% | 1.6%(+1.55)#61 | 2.1%(+1.04)#5,012 |
| 62. | 68666 | 3.1% | 1.6%(+1.53)#62 | 2.1%(+1.02)#5,049 |
| 63. | 68142 | 3.1% | 1.6%(+1.52)#63 | 2.1%(+1.00)#5,103 |
| 64. | 68005 | 3.1% | 1.6%(+1.52)#64 | 2.1%(+1.00)#5,105 |
| 65. | 68455 | 3.1% | 1.6%(+1.50)#65 | 2.1%(+0.983)#5,176 |
| 66. | 68520 | 3.0% | 1.6%(+1.46)#66 | 2.1%(+0.948)#5,258 |
| 67. | 68824 | 3.0% | 1.6%(+1.44)#67 | 2.1%(+0.928)#5,330 |
| 68. | 68359 | 3.0% | 1.6%(+1.41)#68 | 2.1%(+0.895)#5,428 |
| 69. | 68826 | 2.9% | 1.6%(+1.38)#69 | 2.1%(+0.866)#5,508 |
| 70. | 68136 | 2.9% | 1.6%(+1.37)#70 | 2.1%(+0.861)#5,525 |
| 71. | 69333 | 2.9% | 1.6%(+1.37)#71 | 2.1%(+0.859)#5,538 |
| 72. | 68004 | 2.9% | 1.6%(+1.36)#72 | 2.1%(+0.844)#5,574 |
| 73. | 68405 | 2.8% | 1.6%(+1.23)#73 | 2.1%(+0.723)#5,971 |
| 74. | 68783 | 2.8% | 1.6%(+1.22)#74 | 2.1%(+0.708)#6,035 |
| 75. | 68760 | 2.8% | 1.6%(+1.20)#75 | 2.1%(+0.690)#6,092 |
| 76. | 68463 | 2.8% | 1.6%(+1.19)#76 | 2.1%(+0.681)#6,131 |
| 77. | 69165 | 2.7% | 1.6%(+1.14)#77 | 2.1%(+0.629)#6,317 |
| 78. | 68355 | 2.7% | 1.6%(+1.13)#78 | 2.1%(+0.614)#6,373 |
| 79. | 68937 | 2.7% | 1.6%(+1.10)#79 | 2.1%(+0.587)#6,487 |
| 80. | 68132 | 2.6% | 1.6%(+0.979)#80 | 2.1%(+0.468)#6,954 |
| 81. | 68948 | 2.5% | 1.6%(+0.977)#81 | 2.1%(+0.465)#6,965 |
| 82. | 68105 | 2.5% | 1.6%(+0.968)#82 | 2.1%(+0.457)#7,006 |
| 83. | 68757 | 2.5% | 1.6%(+0.964)#83 | 2.1%(+0.452)#7,024 |
| 84. | 68419 | 2.5% | 1.6%(+0.961)#84 | 2.1%(+0.449)#7,040 |
| 85. | 68442 | 2.5% | 1.6%(+0.961)#85 | 2.1%(+0.449)#7,041 |
| 86. | 68741 | 2.5% | 1.6%(+0.895)#86 | 2.1%(+0.383)#7,324 |
| 87. | 68138 | 2.4% | 1.6%(+0.848)#87 | 2.1%(+0.337)#7,553 |
| 88. | 69129 | 2.4% | 1.6%(+0.788)#88 | 2.1%(+0.277)#7,840 |
| 89. | 68022 | 2.4% | 1.6%(+0.784)#89 | 2.1%(+0.273)#7,859 |
| 90. | 68131 | 2.4% | 1.6%(+0.782)#90 | 2.1%(+0.270)#7,866 |
| 91. | 68521 | 2.3% | 1.6%(+0.779)#91 | 2.1%(+0.267)#7,879 |
| 92. | 68967 | 2.3% | 1.6%(+0.769)#92 | 2.1%(+0.258)#7,927 |
| 93. | 68729 | 2.3% | 1.6%(+0.744)#93 | 2.1%(+0.232)#8,051 |
| 94. | 68522 | 2.3% | 1.6%(+0.738)#94 | 2.1%(+0.227)#8,081 |
| 95. | 68464 | 2.3% | 1.6%(+0.733)#95 | 2.1%(+0.222)#8,104 |
| 96. | 68980 | 2.3% | 1.6%(+0.723)#96 | 2.1%(+0.211)#8,160 |
| 97. | 68031 | 2.3% | 1.6%(+0.699)#97 | 2.1%(+0.187)#8,274 |
| 98. | 68003 | 2.3% | 1.6%(+0.697)#98 | 2.1%(+0.185)#8,285 |
| 99. | 68410 | 2.3% | 1.6%(+0.690)#99 | 2.1%(+0.179)#8,324 |
| 100. | 68505 | 2.3% | 1.6%(+0.685)#100 | 2.1%(+0.174)#8,349 |
Common Questions
What are the Top 10 Zip Codes with the Highest Percentage of Population Employed in Arts, Entertainment & Recreation in Nebraska?
Top 10 Zip Codes with the Highest Percentage of Population Employed in Arts, Entertainment & Recreation in Nebraska are:
What zip code has the Highest Percentage of Population Employed in Arts, Entertainment & Recreation in Nebraska?
68433 has the Highest Percentage of Population Employed in Arts, Entertainment & Recreation in Nebraska with 34.0%.
What is the Percentage of Population Employed in Arts, Entertainment & Recreation in the State of Nebraska?
Percentage of Population Employed in Arts, Entertainment & Recreation in Nebraska is 1.6%.
What is the Percentage of Population Employed in Arts, Entertainment & Recreation in the United States?
Percentage of Population Employed in Arts, Entertainment & Recreation in the United States is 2.1%.