Zip Codes with the Highest Percentage of Population with a Degree in Liberal Arts and History in Grand Forks, ND
RELATED REPORTS & OPTIONS
Liberal Arts and History
Grand Forks
Compare Zip Codes
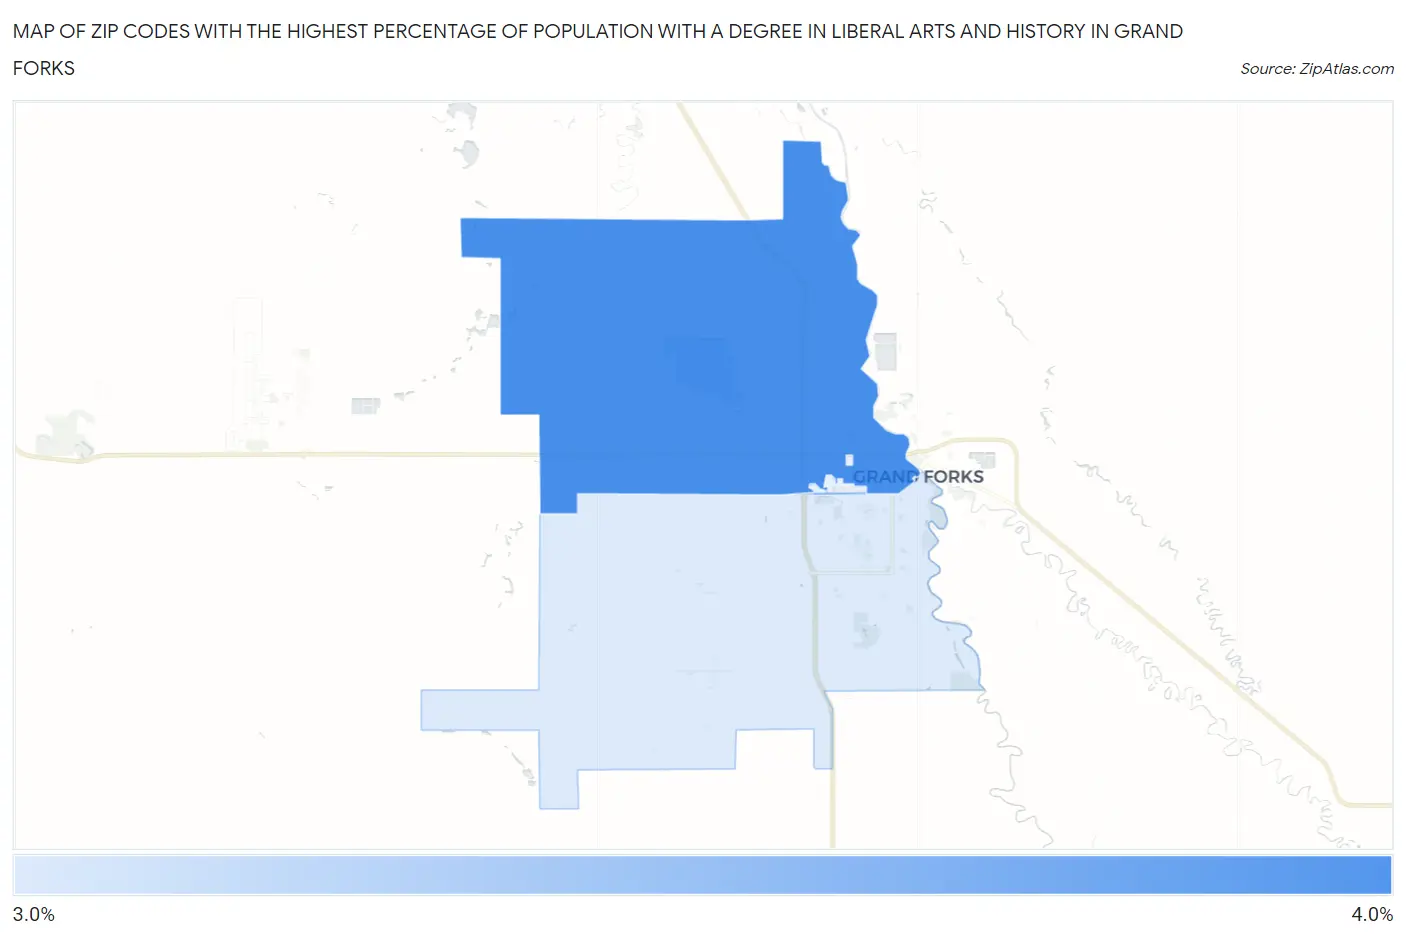
Map of Zip Codes with the Highest Percentage of Population with a Degree in Liberal Arts and History in Grand Forks
3.7%
3.8%
Zip Codes with the Highest Percentage of Population with a Degree in Liberal Arts and History in Grand Forks, ND
| Zip Code | % Graduates | vs State | vs National | |
| 1. | 58203 | 3.8% | 3.7%(+0.097)#103 | 4.9%(-1.04)#15,421 |
| 2. | 58201 | 3.7% | 3.7%(+0.019)#106 | 4.9%(-1.12)#15,707 |
1
Common Questions
What are the Top Zip Codes with the Highest Percentage of Population with a Degree in Liberal Arts and History in Grand Forks, ND?
Top Zip Codes with the Highest Percentage of Population with a Degree in Liberal Arts and History in Grand Forks, ND are:
What zip code has the Highest Percentage of Population with a Degree in Liberal Arts and History in Grand Forks, ND?
58203 has the Highest Percentage of Population with a Degree in Liberal Arts and History in Grand Forks, ND with 3.8%.
What is the Percentage of Population with a Degree in Liberal Arts and History in Grand Forks, ND?
Percentage of Population with a Degree in Liberal Arts and History in Grand Forks is 3.8%.
What is the Percentage of Population with a Degree in Liberal Arts and History in North Dakota?
Percentage of Population with a Degree in Liberal Arts and History in North Dakota is 3.7%.
What is the Percentage of Population with a Degree in Liberal Arts and History in the United States?
Percentage of Population with a Degree in Liberal Arts and History in the United States is 4.9%.