Zip Codes with the Highest Percentage of Population Employed in Arts, Entertainment & Recreation in North Carolina
RELATED REPORTS & OPTIONS
Arts, Entertainment & Recreation
North Carolina
Compare Zip Codes
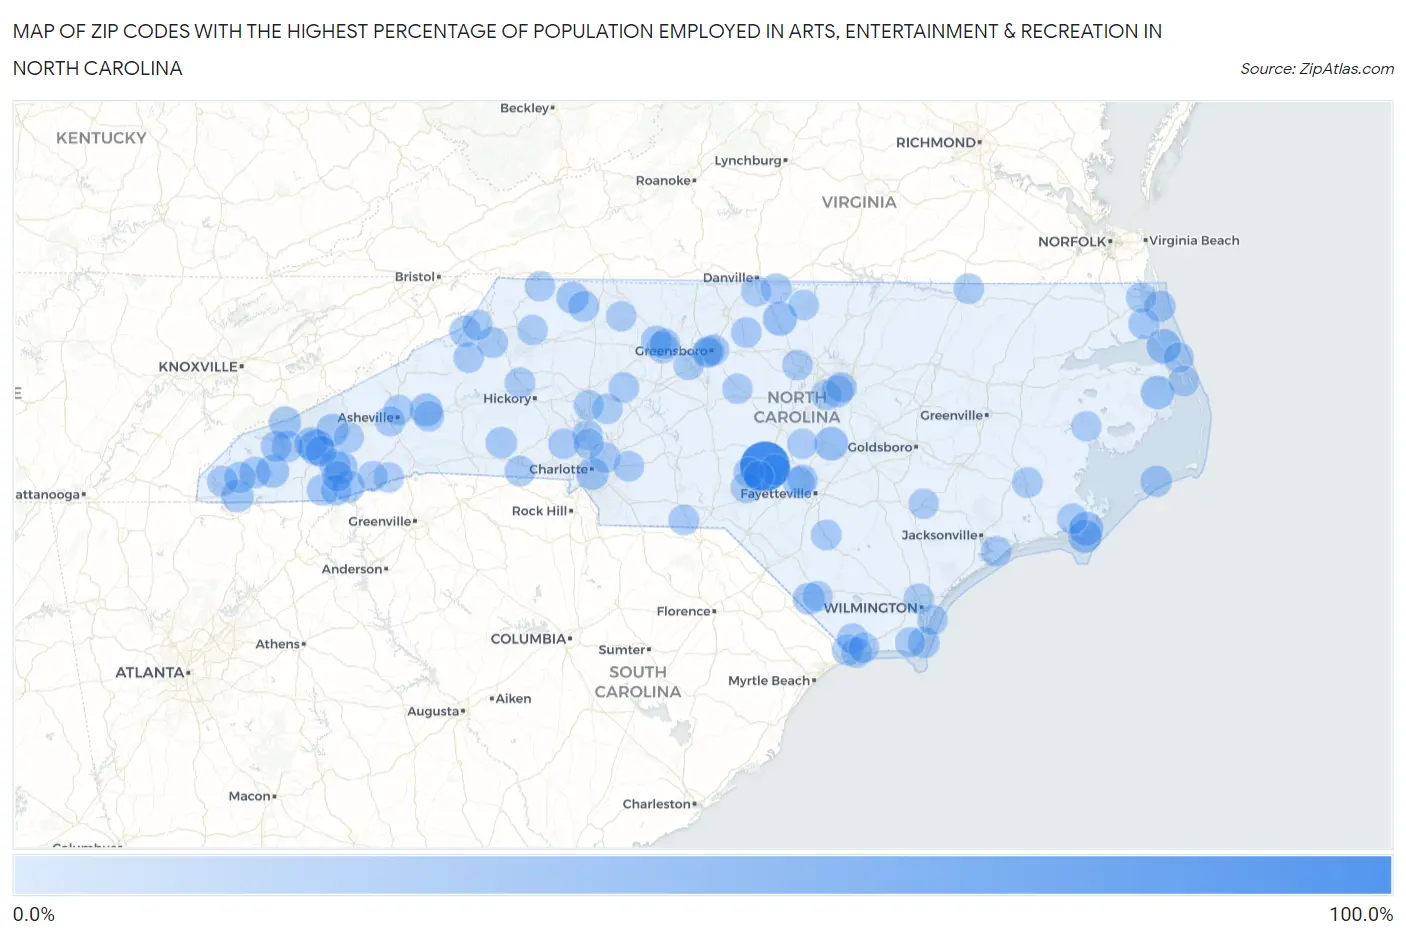
Map of Zip Codes with the Highest Percentage of Population Employed in Arts, Entertainment & Recreation in North Carolina
0.0%
100.0%
Zip Codes with the Highest Percentage of Population Employed in Arts, Entertainment & Recreation in North Carolina
| Zip Code | % Employed | vs State | vs National | |
| 1. | 28350 | 87.2% | 1.8%(+85.5)#1 | 2.1%(+85.2)#13 |
| 2. | 28725 | 25.4% | 1.8%(+23.6)#2 | 2.1%(+23.3)#113 |
| 3. | 27941 | 20.9% | 1.8%(+19.1)#3 | 2.1%(+18.8)#169 |
| 4. | 27314 | 19.4% | 1.8%(+17.6)#4 | 2.1%(+17.3)#196 |
| 5. | 28579 | 19.0% | 1.8%(+17.3)#5 | 2.1%(+16.9)#208 |
| 6. | 27506 | 18.1% | 1.8%(+16.4)#6 | 2.1%(+16.1)#228 |
| 7. | 28553 | 17.1% | 1.8%(+15.3)#7 | 2.1%(+15.0)#255 |
| 8. | 27953 | 16.9% | 1.8%(+15.1)#8 | 2.1%(+14.8)#259 |
| 9. | 28781 | 15.6% | 1.8%(+13.8)#9 | 2.1%(+13.5)#313 |
| 10. | 28757 | 15.0% | 1.8%(+13.2)#10 | 2.1%(+12.9)#333 |
| 11. | 28789 | 14.9% | 1.8%(+13.1)#11 | 2.1%(+12.8)#339 |
| 12. | 28274 | 13.3% | 1.8%(+11.6)#12 | 2.1%(+11.3)#428 |
| 13. | 28783 | 13.1% | 1.8%(+11.3)#13 | 2.1%(+11.0)#444 |
| 14. | 28902 | 12.3% | 1.8%(+10.5)#14 | 2.1%(+10.2)#487 |
| 15. | 28751 | 12.2% | 1.8%(+10.5)#15 | 2.1%(+10.1)#489 |
| 16. | 28627 | 11.9% | 1.8%(+10.1)#16 | 2.1%(+9.82)#519 |
| 17. | 28719 | 11.6% | 1.8%(+9.86)#17 | 2.1%(+9.53)#547 |
| 18. | 28774 | 11.1% | 1.8%(+9.32)#18 | 2.1%(+8.99)#596 |
| 19. | 27695 | 10.1% | 1.8%(+8.39)#19 | 2.1%(+8.06)#687 |
| 20. | 28430 | 9.9% | 1.8%(+8.18)#20 | 2.1%(+7.85)#711 |
| 21. | 28449 | 9.1% | 1.8%(+7.32)#21 | 2.1%(+6.99)#843 |
| 22. | 28713 | 9.1% | 1.8%(+7.30)#22 | 2.1%(+6.97)#848 |
| 23. | 27960 | 8.8% | 1.8%(+7.05)#23 | 2.1%(+6.72)#889 |
| 24. | 27110 | 8.7% | 1.8%(+6.97)#24 | 2.1%(+6.64)#906 |
| 25. | 28310 | 8.6% | 1.8%(+6.81)#25 | 2.1%(+6.48)#929 |
| 26. | 28394 | 8.5% | 1.8%(+6.76)#26 | 2.1%(+6.44)#938 |
| 27. | 28741 | 8.4% | 1.8%(+6.66)#27 | 2.1%(+6.33)#965 |
| 28. | 28901 | 8.2% | 1.8%(+6.40)#28 | 2.1%(+6.07)#1,017 |
| 29. | 28905 | 8.1% | 1.8%(+6.31)#29 | 2.1%(+5.98)#1,042 |
| 30. | 28723 | 7.9% | 1.8%(+6.18)#30 | 2.1%(+5.86)#1,073 |
| 31. | 27109 | 7.9% | 1.8%(+6.18)#31 | 2.1%(+5.85)#1,074 |
| 32. | 28788 | 7.8% | 1.8%(+6.09)#32 | 2.1%(+5.76)#1,098 |
| 33. | 27927 | 7.6% | 1.8%(+5.85)#33 | 2.1%(+5.52)#1,152 |
| 34. | 28622 | 7.6% | 1.8%(+5.80)#34 | 2.1%(+5.47)#1,169 |
| 35. | 28136 | 7.4% | 1.8%(+5.65)#35 | 2.1%(+5.32)#1,203 |
| 36. | 28605 | 7.3% | 1.8%(+5.50)#36 | 2.1%(+5.17)#1,250 |
| 37. | 28702 | 7.1% | 1.8%(+5.39)#37 | 2.1%(+5.06)#1,287 |
| 38. | 27412 | 6.5% | 1.8%(+4.72)#38 | 2.1%(+4.39)#1,512 |
| 39. | 28717 | 6.4% | 1.8%(+4.67)#39 | 2.1%(+4.34)#1,529 |
| 40. | 28467 | 6.4% | 1.8%(+4.66)#40 | 2.1%(+4.33)#1,535 |
| 41. | 28683 | 6.3% | 1.8%(+4.51)#41 | 2.1%(+4.18)#1,601 |
| 42. | 28373 | 6.2% | 1.8%(+4.47)#42 | 2.1%(+4.14)#1,617 |
| 43. | 27974 | 6.2% | 1.8%(+4.43)#43 | 2.1%(+4.10)#1,629 |
| 44. | 27305 | 6.0% | 1.8%(+4.28)#44 | 2.1%(+3.95)#1,681 |
| 45. | 28736 | 5.9% | 1.8%(+4.13)#45 | 2.1%(+3.80)#1,762 |
| 46. | 28452 | 5.7% | 1.8%(+3.93)#46 | 2.1%(+3.60)#1,866 |
| 47. | 28374 | 5.5% | 1.8%(+3.74)#47 | 2.1%(+3.41)#1,967 |
| 48. | 27411 | 5.5% | 1.8%(+3.71)#48 | 2.1%(+3.38)#1,987 |
| 49. | 28547 | 5.4% | 1.8%(+3.63)#49 | 2.1%(+3.30)#2,034 |
| 50. | 28119 | 5.4% | 1.8%(+3.62)#50 | 2.1%(+3.29)#2,035 |
| 51. | 28711 | 5.3% | 1.8%(+3.58)#51 | 2.1%(+3.25)#2,060 |
| 52. | 28519 | 5.3% | 1.8%(+3.57)#52 | 2.1%(+3.24)#2,067 |
| 53. | 28223 | 5.3% | 1.8%(+3.50)#53 | 2.1%(+3.17)#2,112 |
| 54. | 27514 | 5.2% | 1.8%(+3.48)#54 | 2.1%(+3.15)#2,133 |
| 55. | 28468 | 5.2% | 1.8%(+3.46)#55 | 2.1%(+3.13)#2,146 |
| 56. | 28073 | 5.2% | 1.8%(+3.44)#56 | 2.1%(+3.11)#2,158 |
| 57. | 28307 | 5.1% | 1.8%(+3.35)#57 | 2.1%(+3.02)#2,207 |
| 58. | 28906 | 5.0% | 1.8%(+3.29)#58 | 2.1%(+2.96)#2,251 |
| 59. | 28516 | 5.0% | 1.8%(+3.27)#59 | 2.1%(+2.94)#2,276 |
| 60. | 28392 | 4.9% | 1.8%(+3.12)#60 | 2.1%(+2.80)#2,379 |
| 61. | 27244 | 4.8% | 1.8%(+3.07)#61 | 2.1%(+2.75)#2,416 |
| 62. | 28006 | 4.8% | 1.8%(+3.06)#62 | 2.1%(+2.73)#2,425 |
| 63. | 27866 | 4.7% | 1.8%(+2.98)#63 | 2.1%(+2.65)#2,497 |
| 64. | 28107 | 4.7% | 1.8%(+2.96)#64 | 2.1%(+2.63)#2,516 |
| 65. | 27929 | 4.6% | 1.8%(+2.88)#65 | 2.1%(+2.55)#2,596 |
| 66. | 27014 | 4.6% | 1.8%(+2.86)#66 | 2.1%(+2.53)#2,611 |
| 67. | 28125 | 4.6% | 1.8%(+2.82)#67 | 2.1%(+2.49)#2,658 |
| 68. | 28657 | 4.5% | 1.8%(+2.76)#68 | 2.1%(+2.43)#2,722 |
| 69. | 28469 | 4.5% | 1.8%(+2.71)#69 | 2.1%(+2.38)#2,780 |
| 70. | 28387 | 4.4% | 1.8%(+2.62)#70 | 2.1%(+2.29)#2,870 |
| 71. | 28718 | 4.4% | 1.8%(+2.61)#71 | 2.1%(+2.28)#2,888 |
| 72. | 27511 | 4.4% | 1.8%(+2.61)#72 | 2.1%(+2.28)#2,890 |
| 73. | 28401 | 4.3% | 1.8%(+2.56)#73 | 2.1%(+2.23)#2,943 |
| 74. | 28638 | 4.3% | 1.8%(+2.53)#74 | 2.1%(+2.20)#2,986 |
| 75. | 28663 | 4.2% | 1.8%(+2.48)#75 | 2.1%(+2.15)#3,040 |
| 76. | 28665 | 4.1% | 1.8%(+2.36)#76 | 2.1%(+2.03)#3,183 |
| 77. | 27403 | 4.1% | 1.8%(+2.36)#77 | 2.1%(+2.03)#3,188 |
| 78. | 28431 | 4.0% | 1.8%(+2.28)#78 | 2.1%(+1.95)#3,286 |
| 79. | 28349 | 4.0% | 1.8%(+2.20)#79 | 2.1%(+1.87)#3,397 |
| 80. | 27981 | 3.9% | 1.8%(+2.19)#80 | 2.1%(+1.87)#3,403 |
| 81. | 28786 | 3.9% | 1.8%(+2.17)#81 | 2.1%(+1.84)#3,443 |
| 82. | 27810 | 3.9% | 1.8%(+2.14)#82 | 2.1%(+1.81)#3,494 |
| 83. | 27047 | 3.9% | 1.8%(+2.13)#83 | 2.1%(+1.81)#3,502 |
| 84. | 28031 | 3.9% | 1.8%(+2.11)#84 | 2.1%(+1.78)#3,537 |
| 85. | 27505 | 3.9% | 1.8%(+2.11)#85 | 2.1%(+1.78)#3,538 |
| 86. | 28804 | 3.8% | 1.8%(+2.09)#86 | 2.1%(+1.76)#3,565 |
| 87. | 27315 | 3.8% | 1.8%(+2.08)#87 | 2.1%(+1.75)#3,578 |
| 88. | 27948 | 3.8% | 1.8%(+2.04)#88 | 2.1%(+1.71)#3,639 |
| 89. | 28166 | 3.8% | 1.8%(+2.04)#89 | 2.1%(+1.71)#3,646 |
| 90. | 27608 | 3.8% | 1.8%(+2.04)#90 | 2.1%(+1.71)#3,647 |
| 91. | 28679 | 3.8% | 1.8%(+2.02)#91 | 2.1%(+1.69)#3,673 |
| 92. | 28461 | 3.8% | 1.8%(+2.02)#92 | 2.1%(+1.69)#3,675 |
| 93. | 28409 | 3.7% | 1.8%(+1.94)#93 | 2.1%(+1.61)#3,783 |
| 94. | 28806 | 3.7% | 1.8%(+1.93)#94 | 2.1%(+1.61)#3,794 |
| 95. | 27355 | 3.7% | 1.8%(+1.93)#95 | 2.1%(+1.60)#3,799 |
| 96. | 27101 | 3.6% | 1.8%(+1.89)#96 | 2.1%(+1.56)#3,874 |
| 97. | 27573 | 3.6% | 1.8%(+1.88)#97 | 2.1%(+1.55)#3,896 |
| 98. | 27268 | 3.6% | 1.8%(+1.87)#98 | 2.1%(+1.55)#3,898 |
| 99. | 28078 | 3.6% | 1.8%(+1.85)#99 | 2.1%(+1.52)#3,952 |
| 100. | 28712 | 3.6% | 1.8%(+1.83)#100 | 2.1%(+1.50)#3,982 |
Common Questions
What are the Top 10 Zip Codes with the Highest Percentage of Population Employed in Arts, Entertainment & Recreation in North Carolina?
Top 10 Zip Codes with the Highest Percentage of Population Employed in Arts, Entertainment & Recreation in North Carolina are:
What zip code has the Highest Percentage of Population Employed in Arts, Entertainment & Recreation in North Carolina?
28350 has the Highest Percentage of Population Employed in Arts, Entertainment & Recreation in North Carolina with 87.2%.
What is the Percentage of Population Employed in Arts, Entertainment & Recreation in the State of North Carolina?
Percentage of Population Employed in Arts, Entertainment & Recreation in North Carolina is 1.8%.
What is the Percentage of Population Employed in Arts, Entertainment & Recreation in the United States?
Percentage of Population Employed in Arts, Entertainment & Recreation in the United States is 2.1%.