Zip Codes with the Highest Percentage of Population with a Degree in Arts and Humanities in Wilmington, NC

RELATED REPORTS & OPTIONS

Arts and Humanities
Population
Families and Households
Female Fertility
Female Fertility (Unmarried)
Race (Community Size)
Race (Percentage)
Ancestry (Community Size)
AfricanAlbanianAmericanArabArgentineanArmenianAustrianBasqueBelgianBhutaneseBlackfeetBrazilianBritishBurmeseCanadianCelticCentral AmericanCherokeeChileanChoctawColombianCosta RicanCroatianCubanCzechDanishDominicanDutchEastern EuropeanEgyptianEnglishEuropeanFilipinoFinnishFrenchFrench CanadianGermanGreekGuatemalanHaitianHonduranHungarianIndian (Asian)IranianIrishIroquoisIsraeliItalianJamaicanKoreanLatvianLebaneseLithuanianLumbeeMalteseMexicanMoroccanNigerianNorthern EuropeanNorwegianPakistaniPalestinianPanamanianPennsylvania GermanPolishPortuguesePuerto RicanRomanianRussianSalvadoranScandinavianScotch-IrishScottishSlavicSlovakSloveneSouth AfricanSouth AmericanSpaniardSpanishSri LankanSubsaharan AfricanSwedishSwissSyrianThaiTrinidadian and TobagonianTurkishUkrainianVenezuelanWelshWest IndianYugoslavian
Ancestry (Percentage)
AfricanAlbanianAmericanArabArgentineanArmenianAustrianBasqueBelgianBhutaneseBlackfeetBrazilianBritishBurmeseCanadianCelticCentral AmericanCherokeeChileanChoctawColombianCosta RicanCroatianCubanCzechDanishDominicanDutchEastern EuropeanEgyptianEnglishEuropeanFilipinoFinnishFrenchFrench CanadianGermanGreekGuatemalanHaitianHonduranHungarianIndian (Asian)IranianIrishIroquoisIsraeliItalianJamaicanKoreanLatvianLebaneseLithuanianLumbeeMalteseMexicanMoroccanNigerianNorthern EuropeanNorwegianPakistaniPalestinianPanamanianPennsylvania GermanPolishPortuguesePuerto RicanRomanianRussianSalvadoranScandinavianScotch-IrishScottishSlavicSlovakSloveneSouth AfricanSouth AmericanSpaniardSpanishSri LankanSubsaharan AfricanSwedishSwissSyrianThaiTrinidadian and TobagonianTurkishUkrainianVenezuelanWelshWest IndianYugoslavian
Immigrant Origin (Total)
Immigrant Origin (Percentage)
Income
Income (Families)
Income (Households)
Poverty
Poverty (Families)
Unemployment
Employment Occupations
Employment Industries
Employer Class
Commute Time
Commute Means
School Enrollment
Education by Degree Field
Occupancy
Finances
Physical Characteristics
Wilmington
Compare Zip Codes
Comparison Subject

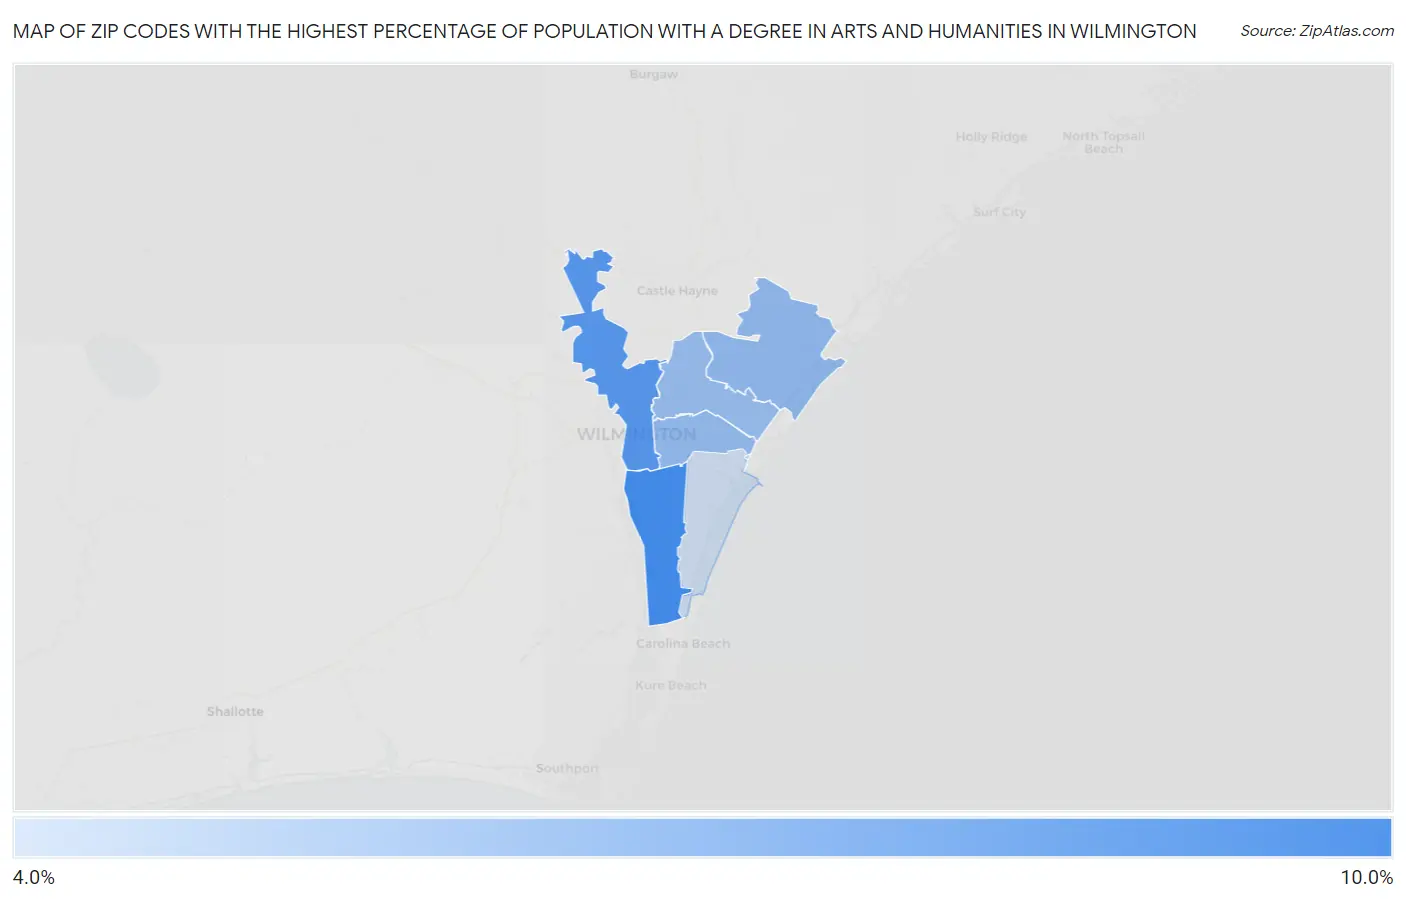
Map of Zip Codes with the Highest Percentage of Population with a Degree in Arts and Humanities in Wilmington

0.0%
10.0%
Zip Codes with the Highest Percentage of Population with a Degree in Arts and Humanities in Wilmington Map

Zip Codes with the Highest Percentage of Population with a Degree in Arts and Humanities in Wilmington, NC

Zip Code % Graduates vs State vs National
1.284129.4%7.1%(+2.28)#2476.0%(+3.41)#7,082
2.284018.6%7.1%(+1.44)#2916.0%(+2.57)#8,505
3.284116.5%7.1%(-0.611)#4236.0%(+0.518)#13,224
4.284036.3%7.1%(-0.864)#4376.0%(+0.265)#13,897
5.284056.2%7.1%(-0.923)#4426.0%(+0.206)#14,096
6.284094.3%7.1%(-2.86)#5736.0%(-1.73)#19,634

Common Questions

What are the Top 5 Zip Codes with the Highest Percentage of Population with a Degree in Arts and Humanities in Wilmington, NC?
Top 5 Zip Codes with the Highest Percentage of Population with a Degree in Arts and Humanities in Wilmington, NC are:
#1
9.4%
#2
8.6%
#3
6.5%
#4
6.3%
#5
6.2%
What zip code has the Highest Percentage of Population with a Degree in Arts and Humanities in Wilmington, NC?
28412 has the Highest Percentage of Population with a Degree in Arts and Humanities in Wilmington, NC with 9.4%.
What is the Percentage of Population with a Degree in Arts and Humanities in Wilmington, NC?
Percentage of Population with a Degree in Arts and Humanities in Wilmington is 6.3%.
What is the Percentage of Population with a Degree in Arts and Humanities in North Carolina?
Percentage of Population with a Degree in Arts and Humanities in North Carolina is 7.1%.
What is the Percentage of Population with a Degree in Arts and Humanities in the United States?
Percentage of Population with a Degree in Arts and Humanities in the United States is 6.0%.