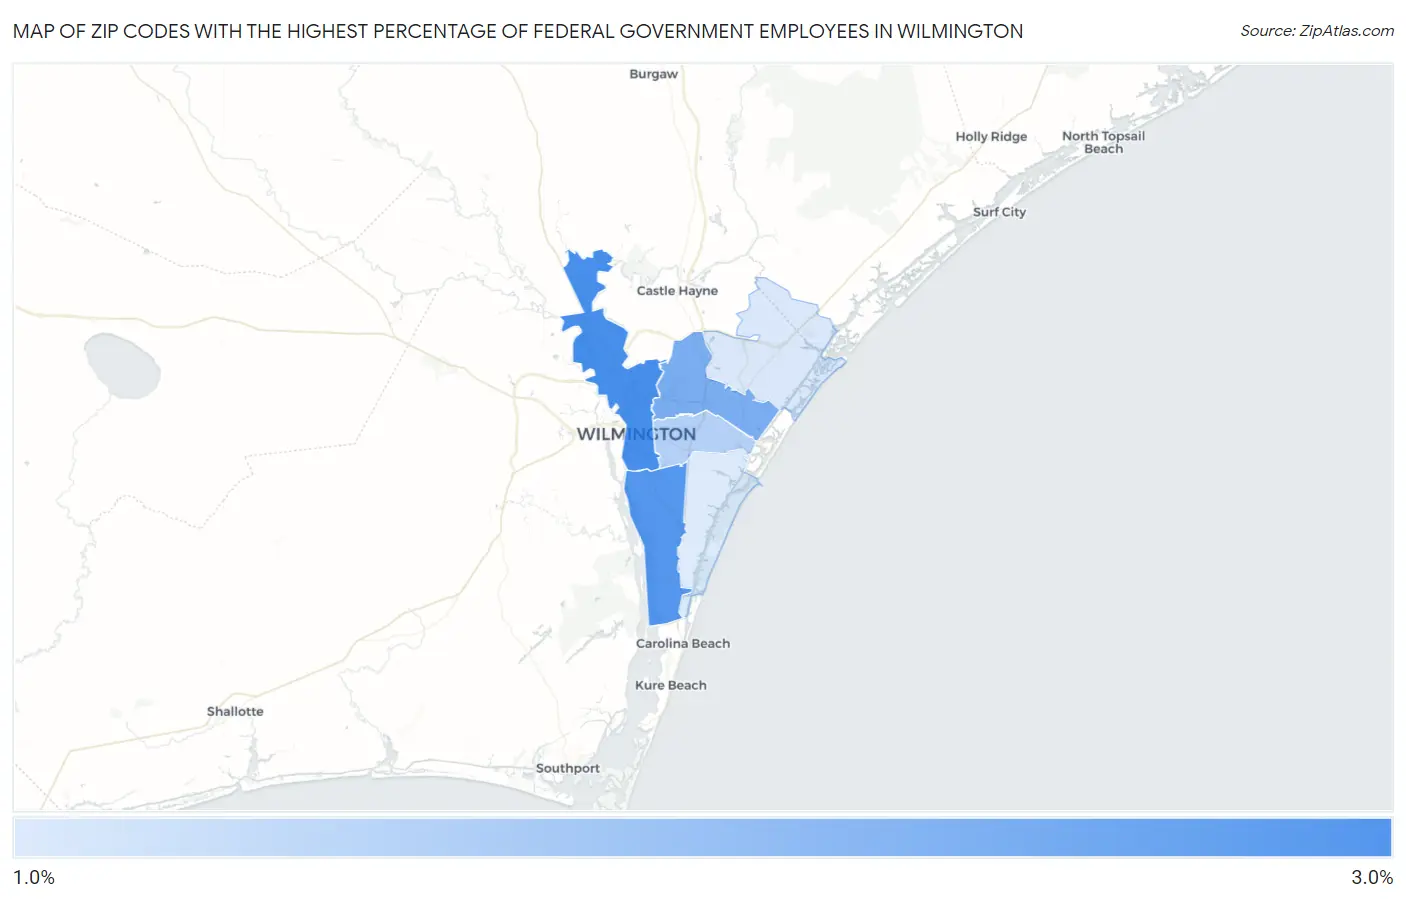
Zip Codes with the Highest Percentage of Federal Government Employees in Wilmington, NC
RELATED REPORTS & OPTIONS
Federal Government Employees
Wilmington
Compare Zip Codes
Map of Zip Codes with the Highest Percentage of Federal Government Employees in Wilmington
0.0%
3.0%
Zip Codes with the Highest Percentage of Federal Government Employees in Wilmington, NC
| Zip Code | % Federal Government Employees | vs State | vs National | |
| 1. | 28401 | 2.6% | 4.2%(-1.54)#217 | 3.4%(-0.743)#10,424 |
| 2. | 28412 | 2.6% | 4.2%(-1.62)#230 | 3.4%(-0.827)#10,803 |
| 3. | 28405 | 2.3% | 4.2%(-1.86)#260 | 3.4%(-1.07)#11,930 |
| 4. | 28403 | 1.9% | 4.2%(-2.23)#310 | 3.4%(-1.43)#14,001 |
| 5. | 28411 | 1.7% | 4.2%(-2.47)#352 | 3.4%(-1.67)#15,582 |
| 6. | 28409 | 1.7% | 4.2%(-2.49)#356 | 3.4%(-1.69)#15,710 |
1
Common Questions
What are the Top 5 Zip Codes with the Highest Percentage of Federal Government Employees in Wilmington, NC?
Top 5 Zip Codes with the Highest Percentage of Federal Government Employees in Wilmington, NC are:
What zip code has the Highest Percentage of Federal Government Employees in Wilmington, NC?
28401 has the Highest Percentage of Federal Government Employees in Wilmington, NC with 2.6%.
What is the Percentage of Federal Government Employees in Wilmington, NC?
Percentage of Federal Government Employees in Wilmington is 1.8%.
What is the Percentage of Federal Government Employees in North Carolina?
Percentage of Federal Government Employees in North Carolina is 4.2%.
What is the Percentage of Federal Government Employees in the United States?
Percentage of Federal Government Employees in the United States is 3.4%.