Zip Codes with the Highest Percentage of Population Employed in Arts, Entertainment & Recreation in Kannapolis, NC
RELATED REPORTS & OPTIONS
Arts, Entertainment & Recreation
Kannapolis
Compare Zip Codes
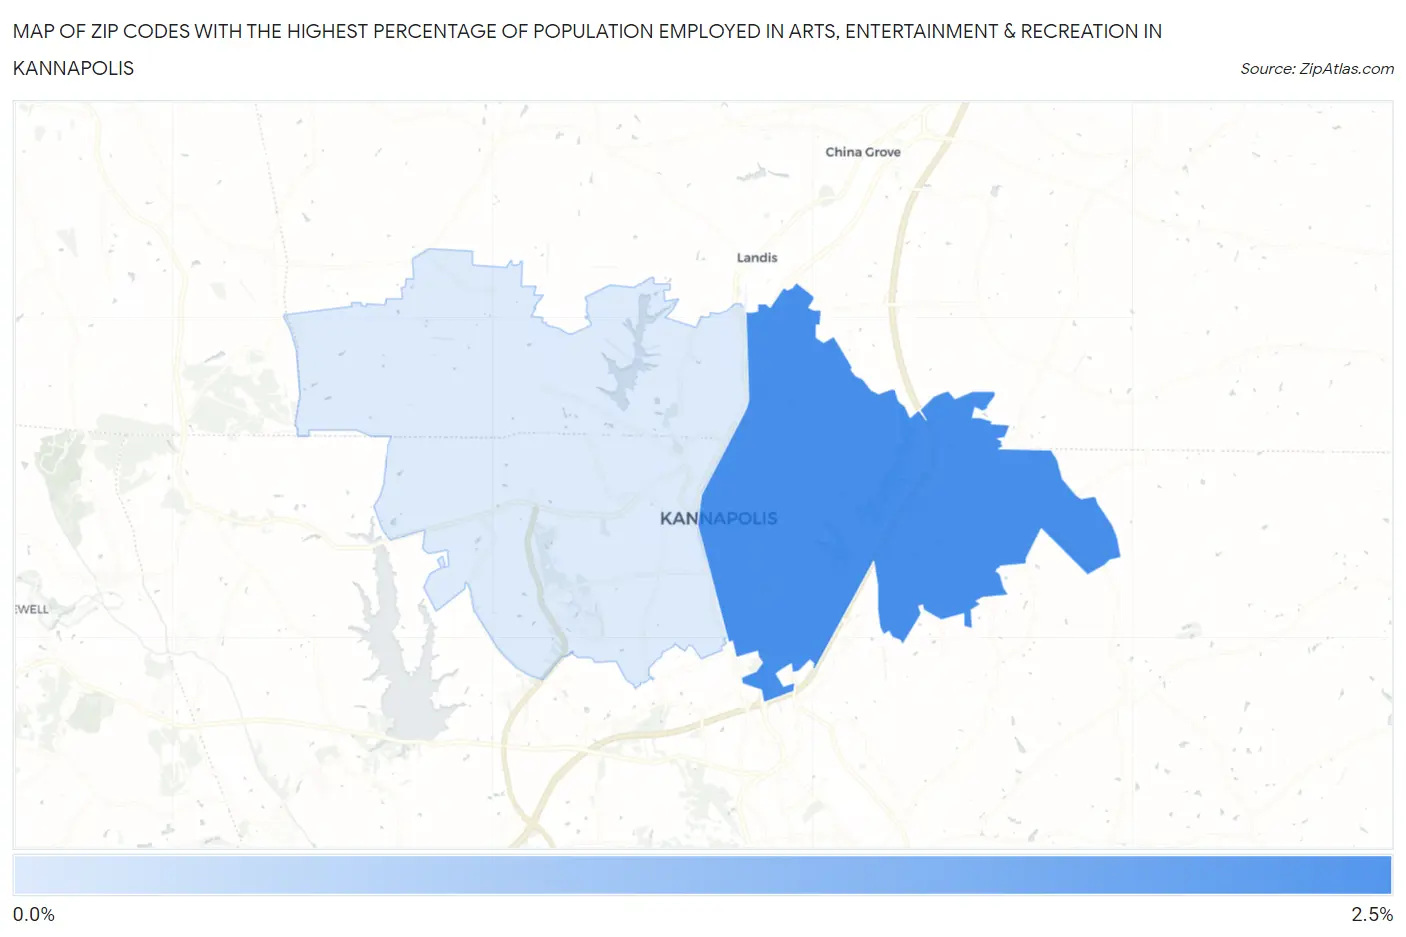
Map of Zip Codes with the Highest Percentage of Population Employed in Arts, Entertainment & Recreation in Kannapolis
0.0%
2.5%
Zip Codes with the Highest Percentage of Population Employed in Arts, Entertainment & Recreation in Kannapolis, NC
| Zip Code | % Employed | vs State | vs National | |
| 1. | 28083 | 2.3% | 1.8%(+0.569)#192 | 2.1%(+0.241)#8,020 |
| 2. | 28081 | 0.45% | 1.8%(-1.31)#551 | 2.1%(-1.64)#20,825 |
1
Common Questions
What are the Top Zip Codes with the Highest Percentage of Population Employed in Arts, Entertainment & Recreation in Kannapolis, NC?
Top Zip Codes with the Highest Percentage of Population Employed in Arts, Entertainment & Recreation in Kannapolis, NC are:
What zip code has the Highest Percentage of Population Employed in Arts, Entertainment & Recreation in Kannapolis, NC?
28083 has the Highest Percentage of Population Employed in Arts, Entertainment & Recreation in Kannapolis, NC with 2.3%.
What is the Percentage of Population Employed in Arts, Entertainment & Recreation in Kannapolis, NC?
Percentage of Population Employed in Arts, Entertainment & Recreation in Kannapolis is 1.7%.
What is the Percentage of Population Employed in Arts, Entertainment & Recreation in North Carolina?
Percentage of Population Employed in Arts, Entertainment & Recreation in North Carolina is 1.8%.
What is the Percentage of Population Employed in Arts, Entertainment & Recreation in the United States?
Percentage of Population Employed in Arts, Entertainment & Recreation in the United States is 2.1%.