Zip Codes with the Highest Percentage of Population Employed in Agriculture, Fishing & Hunting in Kannapolis, NC
RELATED REPORTS & OPTIONS
Agriculture, Fishing & Hunting
Kannapolis
Compare Zip Codes
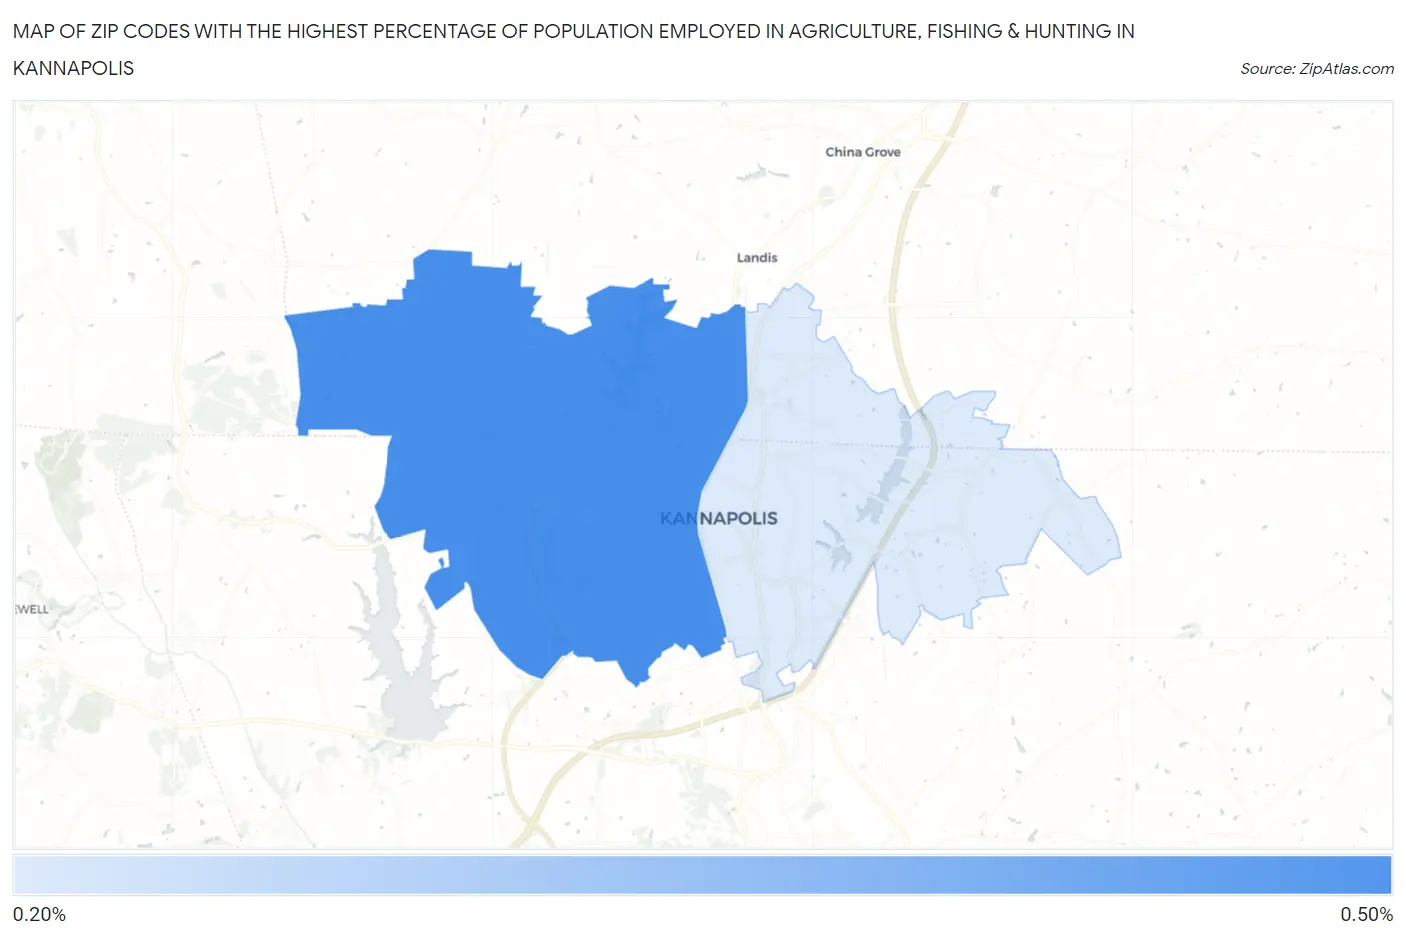
Map of Zip Codes with the Highest Percentage of Population Employed in Agriculture, Fishing & Hunting in Kannapolis
0.0%
0.50%
Zip Codes with the Highest Percentage of Population Employed in Agriculture, Fishing & Hunting in Kannapolis, NC
| Zip Code | % Employed | vs State | vs National | |
| 1. | 28081 | 0.43% | 1.0%(-0.578)#506 | 1.2%(-0.769)#19,900 |
| 2. | 28083 | 0.27% | 1.0%(-0.740)#560 | 1.2%(-0.932)#21,567 |
1
Common Questions
What are the Top Zip Codes with the Highest Percentage of Population Employed in Agriculture, Fishing & Hunting in Kannapolis, NC?
Top Zip Codes with the Highest Percentage of Population Employed in Agriculture, Fishing & Hunting in Kannapolis, NC are:
What zip code has the Highest Percentage of Population Employed in Agriculture, Fishing & Hunting in Kannapolis, NC?
28081 has the Highest Percentage of Population Employed in Agriculture, Fishing & Hunting in Kannapolis, NC with 0.43%.
What is the Percentage of Population Employed in Agriculture, Fishing & Hunting in Kannapolis, NC?
Percentage of Population Employed in Agriculture, Fishing & Hunting in Kannapolis is 0.37%.
What is the Percentage of Population Employed in Agriculture, Fishing & Hunting in North Carolina?
Percentage of Population Employed in Agriculture, Fishing & Hunting in North Carolina is 1.0%.
What is the Percentage of Population Employed in Agriculture, Fishing & Hunting in the United States?
Percentage of Population Employed in Agriculture, Fishing & Hunting in the United States is 1.2%.