Zip Codes with the Highest Percentage of Population with a Degree in Literature and Languages in Greensboro, NC

RELATED REPORTS & OPTIONS

Literature and Languages
Population
Families and Households
Female Fertility
Female Fertility (Unmarried)
Race (Community Size)
Race (Percentage)
Ancestry (Community Size)
AfricanAmericanArabArgentineanArmenianAustralianAustrianBahamianBangladeshiBarbadianBelgianBhutaneseBlackfeetBrazilianBritishBritish West IndianBulgarianBurmeseCanadianCentral AmericanCentral American IndianCherokeeChileanColombianCosta RicanCreekCroatianCubanCzechCzechoslovakianDanishDominicanDutchEastern EuropeanEcuadorianEgyptianEnglishEstonianEthiopianEuropeanFilipinoFinnishFrenchFrench CanadianGermanGhanaianGreekGuamanian / ChamorroGuatemalanGuyaneseHaitianHonduranHungarianIcelanderIndian (Asian)IndonesianIranianIraqiIrishIroquoisIsraeliItalianJamaicanJapaneseJordanianKenyanKoreanLatvianLebaneseLiberianLithuanianLumbeeMalaysianMalteseMexicanMexican American IndianMoroccanNative HawaiianNavajoNew ZealanderNicaraguanNigerianNorthern EuropeanNorwegianPakistaniPalestinianPanamanianPennsylvania GermanPeruvianPolishPortuguesePuerto RicanRomanianRussianSalvadoranScandinavianScotch-IrishScottishSenegaleseSerbianSierra LeoneanSlavicSlovakSloveneSomaliSouth AfricanSouth AmericanSpaniardSpanishSri LankanSubsaharan AfricanSudaneseSwedishSwissSyrianThaiTrinidadian and TobagonianTurkishUkrainianVenezuelanVietnameseWelshWest IndianYugoslavian
Ancestry (Percentage)
AfricanAmericanArabArgentineanArmenianAustralianAustrianBahamianBangladeshiBarbadianBelgianBhutaneseBlackfeetBrazilianBritishBritish West IndianBulgarianBurmeseCanadianCentral AmericanCentral American IndianCherokeeChileanColombianCosta RicanCreekCroatianCubanCzechCzechoslovakianDanishDominicanDutchEastern EuropeanEcuadorianEgyptianEnglishEstonianEthiopianEuropeanFilipinoFinnishFrenchFrench CanadianGermanGhanaianGreekGuamanian / ChamorroGuatemalanGuyaneseHaitianHonduranHungarianIcelanderIndian (Asian)IndonesianIranianIraqiIrishIroquoisIsraeliItalianJamaicanJapaneseJordanianKenyanKoreanLatvianLebaneseLiberianLithuanianLumbeeMalaysianMalteseMexicanMexican American IndianMoroccanNative HawaiianNavajoNew ZealanderNicaraguanNigerianNorthern EuropeanNorwegianPakistaniPalestinianPanamanianPennsylvania GermanPeruvianPolishPortuguesePuerto RicanRomanianRussianSalvadoranScandinavianScotch-IrishScottishSenegaleseSerbianSierra LeoneanSlavicSlovakSloveneSomaliSouth AfricanSouth AmericanSpaniardSpanishSri LankanSubsaharan AfricanSudaneseSwedishSwissSyrianThaiTrinidadian and TobagonianTurkishUkrainianVenezuelanVietnameseWelshWest IndianYugoslavian
Immigrant Origin (Total)
AfricaArgentinaAsiaAustraliaBangladeshBarbadosBelarusBosnia and HerzegovinaBrazilBulgariaBurma / MyanmarCambodiaCanadaCaribbeanCentral AmericaChileChinaColombiaCosta RicaCroatiaCubaDominicaDominican RepublicEastern AfricaEastern AsiaEastern EuropeEcuadorEgyptEl SalvadorEnglandEthiopiaEuropeFranceGermanyGhanaGreeceGuatemalaGuyanaHaitiHondurasHong KongHungaryIndiaIndonesiaIranIraqIrelandItalyJamaicaJapanKenyaKoreaLaosLatin AmericaLiberiaMexicoMiddle AfricaMoroccoNepalNetherlandsNicaraguaNigeriaNorthern AfricaNorthern EuropeOceaniaPakistanPanamaPeruPhilippinesPolandRomaniaRussiaSaudi ArabiaScotlandSenegalSierra LeoneSomaliaSouth AfricaSouth AmericaSouth Central AsiaSouth Eastern AsiaSouthern EuropeSri LankaSudanSyriaTaiwanThailandTrinidad and TobagoTurkeyUgandaUkraineVenezuelaVietnamWestern AfricaWestern AsiaWestern EuropeZaireZimbabwe
Immigrant Origin (Percentage)
AfricaArgentinaAsiaAustraliaBangladeshBarbadosBelarusBosnia and HerzegovinaBrazilBulgariaBurma / MyanmarCambodiaCanadaCaribbeanCentral AmericaChileChinaColombiaCosta RicaCroatiaCubaDominicaDominican RepublicEastern AfricaEastern AsiaEastern EuropeEcuadorEgyptEl SalvadorEnglandEthiopiaEuropeFranceGermanyGhanaGreeceGuatemalaGuyanaHaitiHondurasHong KongHungaryIndiaIndonesiaIranIraqIrelandItalyJamaicaJapanKenyaKoreaLaosLatin AmericaLiberiaMexicoMiddle AfricaMoroccoNepalNetherlandsNicaraguaNigeriaNorthern AfricaNorthern EuropeOceaniaPakistanPanamaPeruPhilippinesPolandRomaniaRussiaSaudi ArabiaScotlandSenegalSierra LeoneSomaliaSouth AfricaSouth AmericaSouth Central AsiaSouth Eastern AsiaSouthern EuropeSri LankaSudanSyriaTaiwanThailandTrinidad and TobagoTurkeyUgandaUkraineVenezuelaVietnamWestern AfricaWestern AsiaWestern EuropeZaireZimbabwe
Income
Income (Families)
Income (Households)
Poverty
Poverty (Families)
Unemployment
Employment Occupations
Employment Industries
Employer Class
Commute Time
Commute Means
School Enrollment
Education by Degree Field
Occupancy
Finances
Physical Characteristics
Greensboro
Compare Zip Codes
Comparison Subject

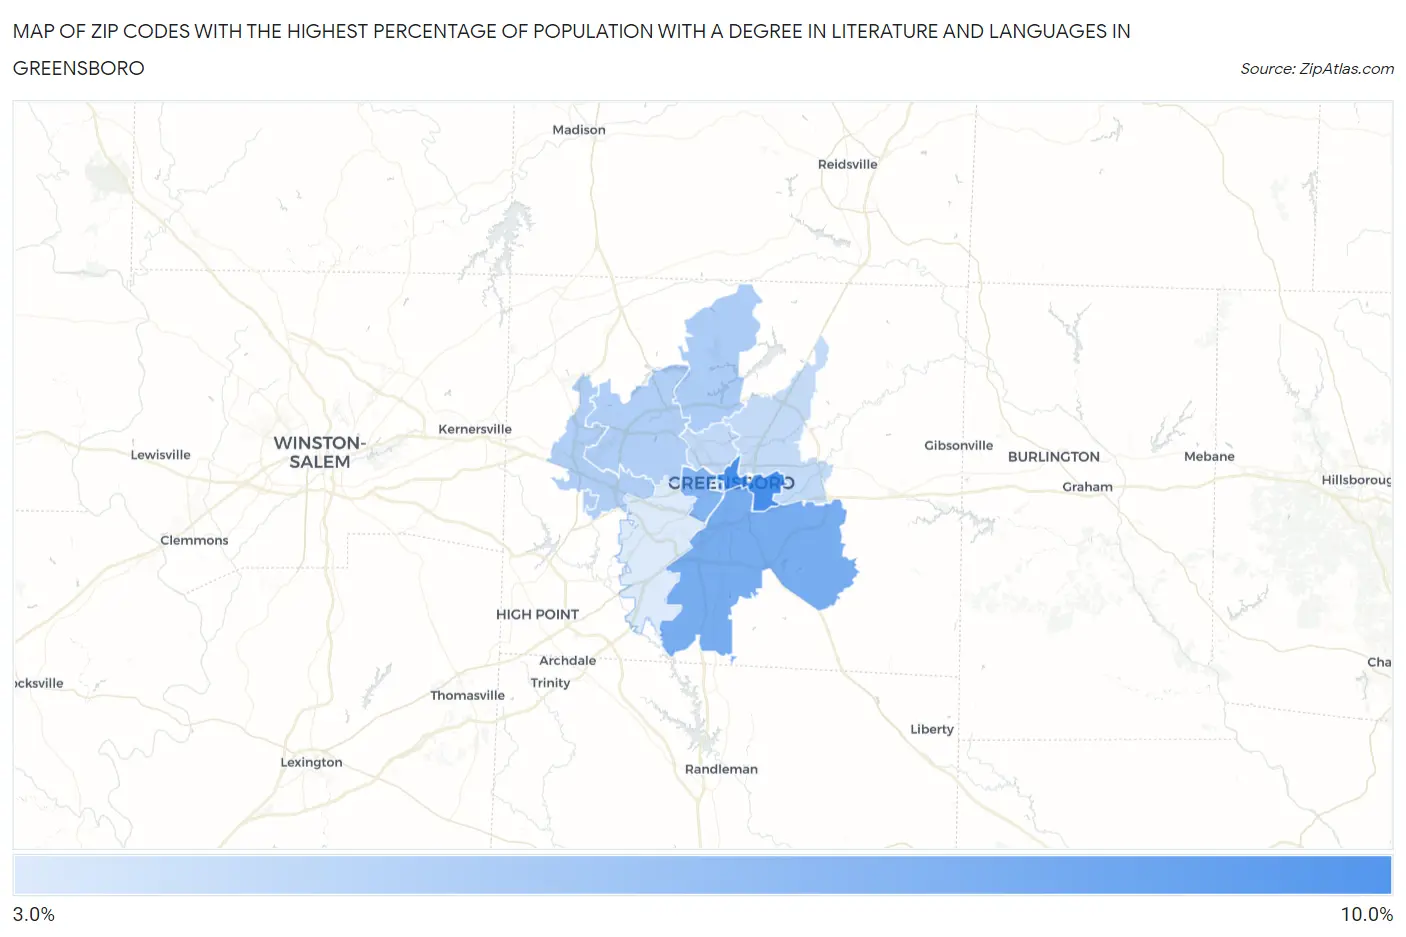
Map of Zip Codes with the Highest Percentage of Population with a Degree in Literature and Languages in Greensboro

0.0%
10.0%
Zip Codes with the Highest Percentage of Population with a Degree in Literature and Languages in Greensboro Map

Zip Codes with the Highest Percentage of Population with a Degree in Literature and Languages in Greensboro, NC

Zip Code % Graduates vs State vs National
1.274018.6%4.2%(+4.40)#614.4%(+4.23)#2,521
2.274067.1%4.2%(+2.84)#974.4%(+2.67)#3,906
3.274036.7%4.2%(+2.50)#1074.4%(+2.33)#4,323
4.274555.4%4.2%(+1.18)#1574.4%(+1.00)#6,490
5.274095.3%4.2%(+1.05)#1644.4%(+0.877)#6,758
6.274105.3%4.2%(+1.04)#1654.4%(+0.861)#6,789
7.274084.8%4.2%(+0.549)#2064.4%(+0.374)#7,939
8.274054.7%4.2%(+0.498)#2114.4%(+0.323)#8,080
9.274073.9%4.2%(-0.316)#2924.4%(-0.490)#10,431

Common Questions

What are the Top 5 Zip Codes with the Highest Percentage of Population with a Degree in Literature and Languages in Greensboro, NC?
Top 5 Zip Codes with the Highest Percentage of Population with a Degree in Literature and Languages in Greensboro, NC are:
#1
8.6%
#2
7.1%
#3
6.7%
#4
5.4%
#5
5.3%
What zip code has the Highest Percentage of Population with a Degree in Literature and Languages in Greensboro, NC?
27401 has the Highest Percentage of Population with a Degree in Literature and Languages in Greensboro, NC with 8.6%.
What is the Percentage of Population with a Degree in Literature and Languages in Greensboro, NC?
Percentage of Population with a Degree in Literature and Languages in Greensboro is 5.5%.
What is the Percentage of Population with a Degree in Literature and Languages in North Carolina?
Percentage of Population with a Degree in Literature and Languages in North Carolina is 4.2%.
What is the Percentage of Population with a Degree in Literature and Languages in the United States?
Percentage of Population with a Degree in Literature and Languages in the United States is 4.4%.