Zip Codes with the Highest Percentage of Population Employed in Health Care & Social Assistance in Montana
RELATED REPORTS & OPTIONS
Health Care & Social Assistance
Montana
Compare Zip Codes
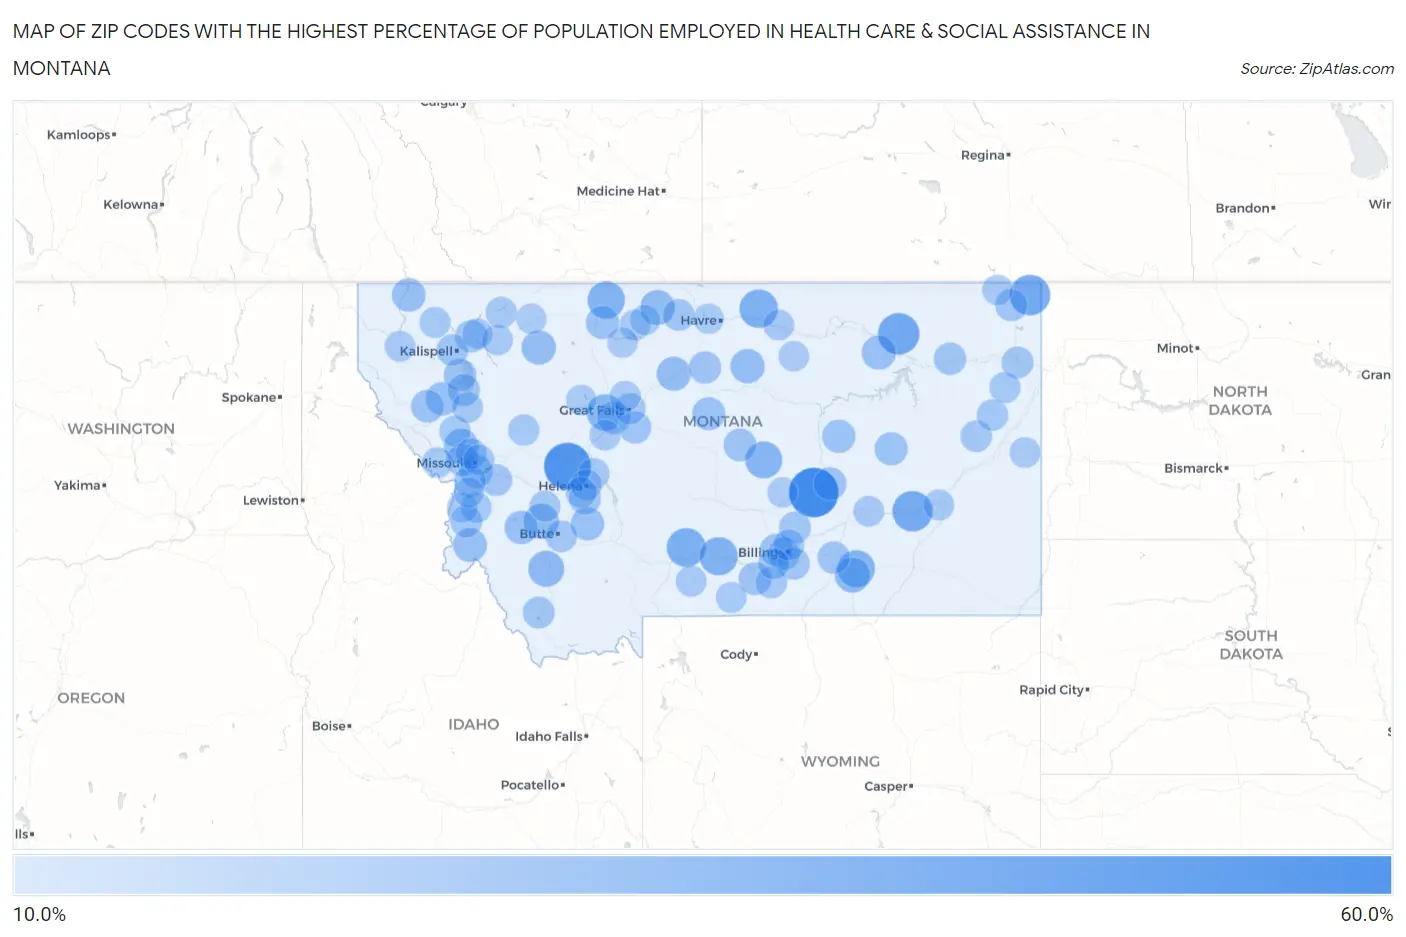
Map of Zip Codes with the Highest Percentage of Population Employed in Health Care & Social Assistance in Montana
0.0%
60.0%
Zip Codes with the Highest Percentage of Population Employed in Health Care & Social Assistance in Montana
| Zip Code | % Employed | vs State | vs National | |
| 1. | 59059 | 57.4% | 14.5%(+42.9)#1 | 13.9%(+43.4)#149 |
| 2. | 59633 | 51.4% | 14.5%(+37.0)#2 | 13.9%(+37.5)#202 |
| 3. | 59231 | 38.8% | 14.5%(+24.4)#3 | 13.9%(+24.9)#427 |
| 4. | 59275 | 36.8% | 14.5%(+22.4)#4 | 13.9%(+22.9)#502 |
| 5. | 59333 | 36.4% | 14.5%(+21.9)#5 | 13.9%(+22.4)#531 |
| 6. | 59082 | 33.3% | 14.5%(+18.9)#6 | 13.9%(+19.4)#703 |
| 7. | 59547 | 32.3% | 14.5%(+17.8)#7 | 13.9%(+18.3)#764 |
| 8. | 59033 | 31.4% | 14.5%(+16.9)#8 | 13.9%(+17.5)#818 |
| 9. | 59466 | 29.9% | 14.5%(+15.4)#9 | 13.9%(+15.9)#949 |
| 10. | 59022 | 29.6% | 14.5%(+15.1)#10 | 13.9%(+15.7)#982 |
| 11. | 59441 | 28.7% | 14.5%(+14.3)#11 | 13.9%(+14.8)#1,093 |
| 12. | 59483 | 28.3% | 14.5%(+13.9)#12 | 13.9%(+14.4)#1,134 |
| 13. | 59743 | 26.8% | 14.5%(+12.3)#13 | 13.9%(+12.8)#1,383 |
| 14. | 59031 | 25.0% | 14.5%(+10.5)#14 | 13.9%(+11.1)#1,721 |
| 15. | 59756 | 25.0% | 14.5%(+10.5)#15 | 13.9%(+11.1)#1,724 |
| 16. | 59531 | 24.2% | 14.5%(+9.75)#16 | 13.9%(+10.3)#1,948 |
| 17. | 59834 | 23.9% | 14.5%(+9.47)#17 | 13.9%(+9.99)#2,013 |
| 18. | 59448 | 23.0% | 14.5%(+8.56)#18 | 13.9%(+9.07)#2,344 |
| 19. | 59535 | 22.7% | 14.5%(+8.27)#19 | 13.9%(+8.79)#2,457 |
| 20. | 59442 | 22.6% | 14.5%(+8.16)#20 | 13.9%(+8.67)#2,513 |
| 21. | 59230 | 22.3% | 14.5%(+7.86)#21 | 13.9%(+8.38)#2,639 |
| 22. | 59827 | 22.0% | 14.5%(+7.50)#22 | 13.9%(+8.02)#2,821 |
| 23. | 59930 | 21.6% | 14.5%(+7.11)#23 | 13.9%(+7.63)#3,028 |
| 24. | 59845 | 21.2% | 14.5%(+6.70)#24 | 13.9%(+7.22)#3,271 |
| 25. | 59632 | 20.9% | 14.5%(+6.50)#25 | 13.9%(+7.01)#3,407 |
| 26. | 59711 | 20.9% | 14.5%(+6.43)#26 | 13.9%(+6.95)#3,449 |
| 27. | 59077 | 20.7% | 14.5%(+6.24)#27 | 13.9%(+6.75)#3,590 |
| 28. | 59474 | 20.6% | 14.5%(+6.10)#28 | 13.9%(+6.62)#3,677 |
| 29. | 59430 | 20.4% | 14.5%(+5.98)#29 | 13.9%(+6.49)#3,771 |
| 30. | 59322 | 20.4% | 14.5%(+5.92)#30 | 13.9%(+6.43)#3,814 |
| 31. | 59485 | 20.1% | 14.5%(+5.61)#31 | 13.9%(+6.13)#4,044 |
| 32. | 59803 | 20.0% | 14.5%(+5.58)#32 | 13.9%(+6.09)#4,058 |
| 33. | 59054 | 19.8% | 14.5%(+5.37)#33 | 13.9%(+5.88)#4,216 |
| 34. | 59859 | 19.6% | 14.5%(+5.12)#34 | 13.9%(+5.64)#4,421 |
| 35. | 59106 | 19.6% | 14.5%(+5.10)#35 | 13.9%(+5.62)#4,444 |
| 36. | 59013 | 19.5% | 14.5%(+5.09)#36 | 13.9%(+5.60)#4,464 |
| 37. | 59457 | 19.5% | 14.5%(+5.05)#37 | 13.9%(+5.57)#4,498 |
| 38. | 59931 | 19.1% | 14.5%(+4.66)#38 | 13.9%(+5.18)#4,866 |
| 39. | 59919 | 18.8% | 14.5%(+4.32)#39 | 13.9%(+4.83)#5,234 |
| 40. | 59034 | 18.8% | 14.5%(+4.30)#40 | 13.9%(+4.82)#5,247 |
| 41. | 59201 | 18.7% | 14.5%(+4.24)#41 | 13.9%(+4.76)#5,313 |
| 42. | 59520 | 18.6% | 14.5%(+4.18)#42 | 13.9%(+4.70)#5,387 |
| 43. | 59102 | 18.6% | 14.5%(+4.12)#43 | 13.9%(+4.64)#5,458 |
| 44. | 59405 | 18.5% | 14.5%(+4.08)#44 | 13.9%(+4.59)#5,505 |
| 45. | 59254 | 18.4% | 14.5%(+3.99)#45 | 13.9%(+4.51)#5,619 |
| 46. | 59860 | 18.3% | 14.5%(+3.88)#46 | 13.9%(+4.39)#5,770 |
| 47. | 59804 | 18.2% | 14.5%(+3.73)#47 | 13.9%(+4.25)#5,951 |
| 48. | 59101 | 18.0% | 14.5%(+3.52)#48 | 13.9%(+4.04)#6,220 |
| 49. | 59634 | 17.7% | 14.5%(+3.25)#49 | 13.9%(+3.77)#6,619 |
| 50. | 59528 | 17.5% | 14.5%(+3.05)#50 | 13.9%(+3.56)#6,924 |
| 51. | 59825 | 17.4% | 14.5%(+2.97)#51 | 13.9%(+3.49)#7,057 |
| 52. | 59725 | 17.4% | 14.5%(+2.91)#52 | 13.9%(+3.43)#7,159 |
| 53. | 59079 | 17.4% | 14.5%(+2.90)#53 | 13.9%(+3.42)#7,169 |
| 54. | 59218 | 17.3% | 14.5%(+2.89)#54 | 13.9%(+3.41)#7,182 |
| 55. | 59901 | 17.3% | 14.5%(+2.89)#55 | 13.9%(+3.40)#7,183 |
| 56. | 59339 | 17.2% | 14.5%(+2.72)#56 | 13.9%(+3.24)#7,439 |
| 57. | 59701 | 17.2% | 14.5%(+2.70)#57 | 13.9%(+3.22)#7,471 |
| 58. | 59840 | 17.1% | 14.5%(+2.68)#58 | 13.9%(+3.20)#7,498 |
| 59. | 59029 | 17.0% | 14.5%(+2.56)#59 | 13.9%(+3.07)#7,701 |
| 60. | 59833 | 17.0% | 14.5%(+2.55)#60 | 13.9%(+3.07)#7,718 |
| 61. | 59315 | 16.7% | 14.5%(+2.21)#61 | 13.9%(+2.73)#8,262 |
| 62. | 59105 | 16.4% | 14.5%(+1.94)#62 | 13.9%(+2.46)#8,754 |
| 63. | 59602 | 16.4% | 14.5%(+1.92)#63 | 13.9%(+2.43)#8,784 |
| 64. | 59625 | 16.4% | 14.5%(+1.91)#64 | 13.9%(+2.43)#8,796 |
| 65. | 59434 | 16.3% | 14.5%(+1.89)#65 | 13.9%(+2.41)#8,828 |
| 66. | 59401 | 16.3% | 14.5%(+1.81)#66 | 13.9%(+2.33)#9,008 |
| 67. | 59044 | 16.2% | 14.5%(+1.76)#67 | 13.9%(+2.28)#9,103 |
| 68. | 59831 | 16.1% | 14.5%(+1.69)#68 | 13.9%(+2.21)#9,221 |
| 69. | 59854 | 16.1% | 14.5%(+1.68)#69 | 13.9%(+2.19)#9,252 |
| 70. | 59808 | 15.9% | 14.5%(+1.40)#70 | 13.9%(+1.92)#9,799 |
| 71. | 59601 | 15.8% | 14.5%(+1.39)#71 | 13.9%(+1.91)#9,830 |
| 72. | 59243 | 15.8% | 14.5%(+1.38)#72 | 13.9%(+1.90)#9,841 |
| 73. | 59828 | 15.7% | 14.5%(+1.23)#73 | 13.9%(+1.75)#10,136 |
| 74. | 59927 | 15.6% | 14.5%(+1.14)#74 | 13.9%(+1.66)#10,312 |
| 75. | 59722 | 15.6% | 14.5%(+1.13)#75 | 13.9%(+1.65)#10,334 |
| 76. | 59864 | 15.6% | 14.5%(+1.12)#76 | 13.9%(+1.64)#10,343 |
| 77. | 59052 | 15.5% | 14.5%(+1.04)#77 | 13.9%(+1.56)#10,525 |
| 78. | 59802 | 15.5% | 14.5%(+1.01)#78 | 13.9%(+1.53)#10,586 |
| 79. | 59421 | 15.4% | 14.5%(+0.967)#79 | 13.9%(+1.48)#10,705 |
| 80. | 59526 | 15.3% | 14.5%(+0.846)#80 | 13.9%(+1.36)#10,976 |
| 81. | 59841 | 15.3% | 14.5%(+0.827)#81 | 13.9%(+1.35)#11,022 |
| 82. | 59923 | 15.2% | 14.5%(+0.721)#82 | 13.9%(+1.24)#11,242 |
| 83. | 59068 | 15.1% | 14.5%(+0.680)#83 | 13.9%(+1.20)#11,342 |
| 84. | 59301 | 15.1% | 14.5%(+0.662)#84 | 13.9%(+1.18)#11,377 |
| 85. | 59916 | 15.1% | 14.5%(+0.640)#85 | 13.9%(+1.16)#11,436 |
| 86. | 59404 | 15.1% | 14.5%(+0.622)#86 | 13.9%(+1.14)#11,478 |
| 87. | 59461 | 15.0% | 14.5%(+0.546)#87 | 13.9%(+1.06)#11,636 |
| 88. | 59076 | 15.0% | 14.5%(+0.546)#88 | 13.9%(+1.06)#11,637 |
| 89. | 59913 | 14.9% | 14.5%(+0.411)#89 | 13.9%(+0.929)#11,962 |
| 90. | 59353 | 14.8% | 14.5%(+0.392)#90 | 13.9%(+0.910)#12,010 |
| 91. | 59820 | 14.8% | 14.5%(+0.361)#91 | 13.9%(+0.879)#12,068 |
| 92. | 59252 | 14.7% | 14.5%(+0.252)#92 | 13.9%(+0.770)#12,337 |
| 93. | 59501 | 14.7% | 14.5%(+0.242)#93 | 13.9%(+0.760)#12,361 |
| 94. | 59524 | 14.7% | 14.5%(+0.206)#94 | 13.9%(+0.724)#12,454 |
| 95. | 59417 | 14.5% | 14.5%(+0.073)#95 | 13.9%(+0.592)#12,773 |
| 96. | 59436 | 14.5% | 14.5%(+0.036)#96 | 13.9%(+0.554)#12,874 |
| 97. | 59072 | 14.4% | 14.5%(-0.019)#97 | 13.9%(+0.500)#13,004 |
| 98. | 59522 | 14.3% | 14.5%(-0.168)#98 | 13.9%(+0.350)#13,359 |
| 99. | 59456 | 14.3% | 14.5%(-0.168)#99 | 13.9%(+0.350)#13,387 |
| 100. | 59870 | 14.3% | 14.5%(-0.196)#100 | 13.9%(+0.322)#13,454 |
Common Questions
What are the Top 10 Zip Codes with the Highest Percentage of Population Employed in Health Care & Social Assistance in Montana?
Top 10 Zip Codes with the Highest Percentage of Population Employed in Health Care & Social Assistance in Montana are:
What zip code has the Highest Percentage of Population Employed in Health Care & Social Assistance in Montana?
59059 has the Highest Percentage of Population Employed in Health Care & Social Assistance in Montana with 57.4%.
What is the Percentage of Population Employed in Health Care & Social Assistance in the State of Montana?
Percentage of Population Employed in Health Care & Social Assistance in Montana is 14.5%.
What is the Percentage of Population Employed in Health Care & Social Assistance in the United States?
Percentage of Population Employed in Health Care & Social Assistance in the United States is 13.9%.