Zip Codes with the Highest Percentage of Population Employed in Farming, Fishing & Forestry in Tupelo, MS
RELATED REPORTS & OPTIONS
Farming, Fishing & Forestry
Tupelo
Compare Zip Codes
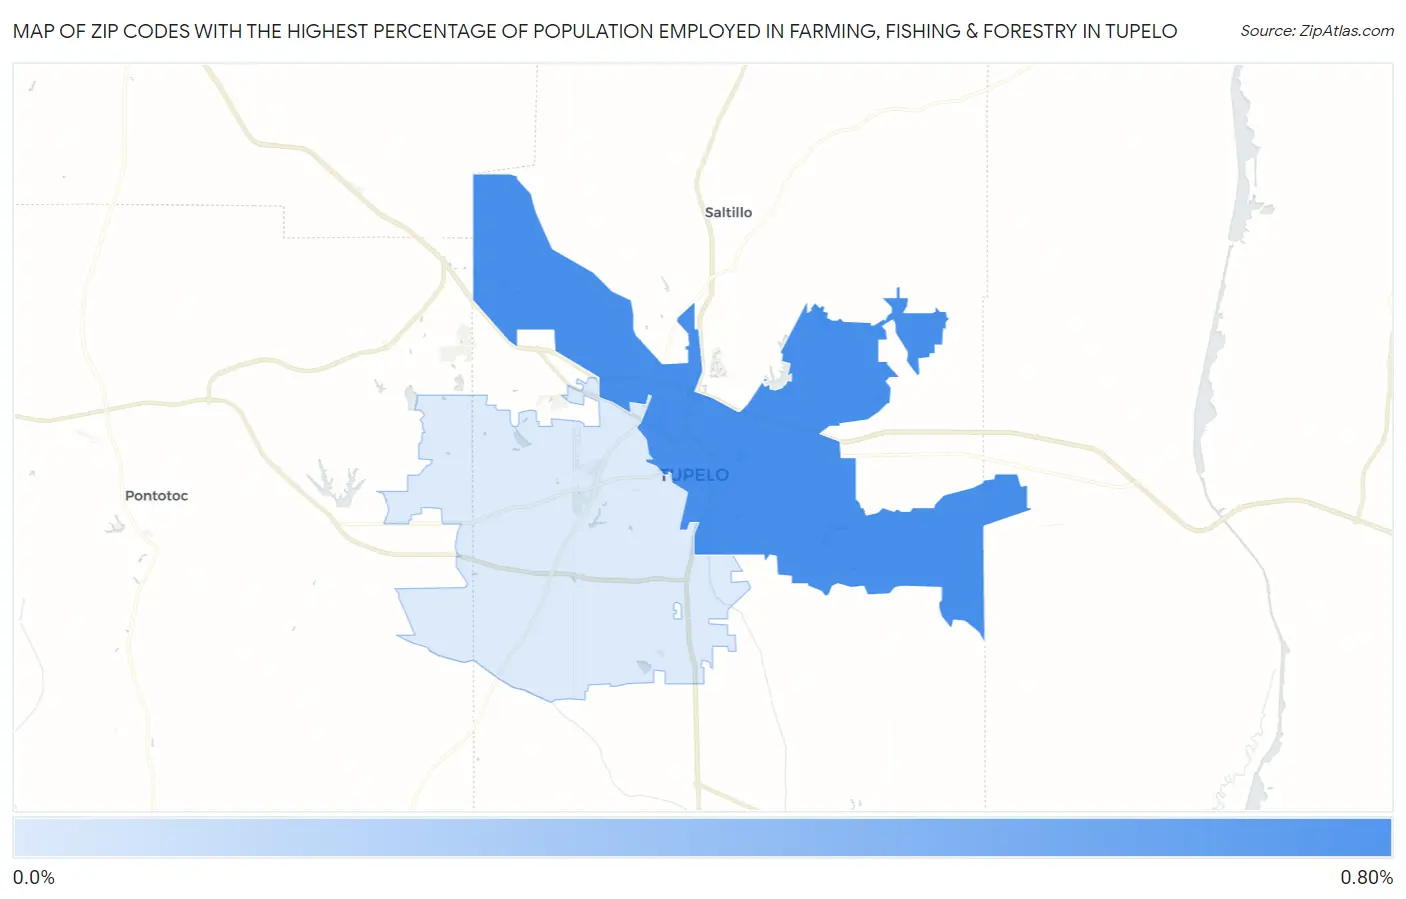
Map of Zip Codes with the Highest Percentage of Population Employed in Farming, Fishing & Forestry in Tupelo
0.0%
0.80%
Zip Codes with the Highest Percentage of Population Employed in Farming, Fishing & Forestry in Tupelo, MS
| Zip Code | % Employed | vs State | vs National | |
| 1. | 38804 | 0.73% | 0.63%(+0.103)#139 | 0.61%(+0.127)#11,187 |
| 2. | 38801 | 0.084% | 0.63%(-0.545)#210 | 0.61%(-0.521)#18,032 |
1
Common Questions
What are the Top Zip Codes with the Highest Percentage of Population Employed in Farming, Fishing & Forestry in Tupelo, MS?
Top Zip Codes with the Highest Percentage of Population Employed in Farming, Fishing & Forestry in Tupelo, MS are:
What zip code has the Highest Percentage of Population Employed in Farming, Fishing & Forestry in Tupelo, MS?
38804 has the Highest Percentage of Population Employed in Farming, Fishing & Forestry in Tupelo, MS with 0.73%.
What is the Percentage of Population Employed in Farming, Fishing & Forestry in Tupelo, MS?
Percentage of Population Employed in Farming, Fishing & Forestry in Tupelo is 0.37%.
What is the Percentage of Population Employed in Farming, Fishing & Forestry in Mississippi?
Percentage of Population Employed in Farming, Fishing & Forestry in Mississippi is 0.63%.
What is the Percentage of Population Employed in Farming, Fishing & Forestry in the United States?
Percentage of Population Employed in Farming, Fishing & Forestry in the United States is 0.61%.