Zip Codes with the Highest Percentage of Population Employed in Farming, Fishing & Forestry in Lees Summit, MO
RELATED REPORTS & OPTIONS
Farming, Fishing & Forestry
Lees Summit
Compare Zip Codes
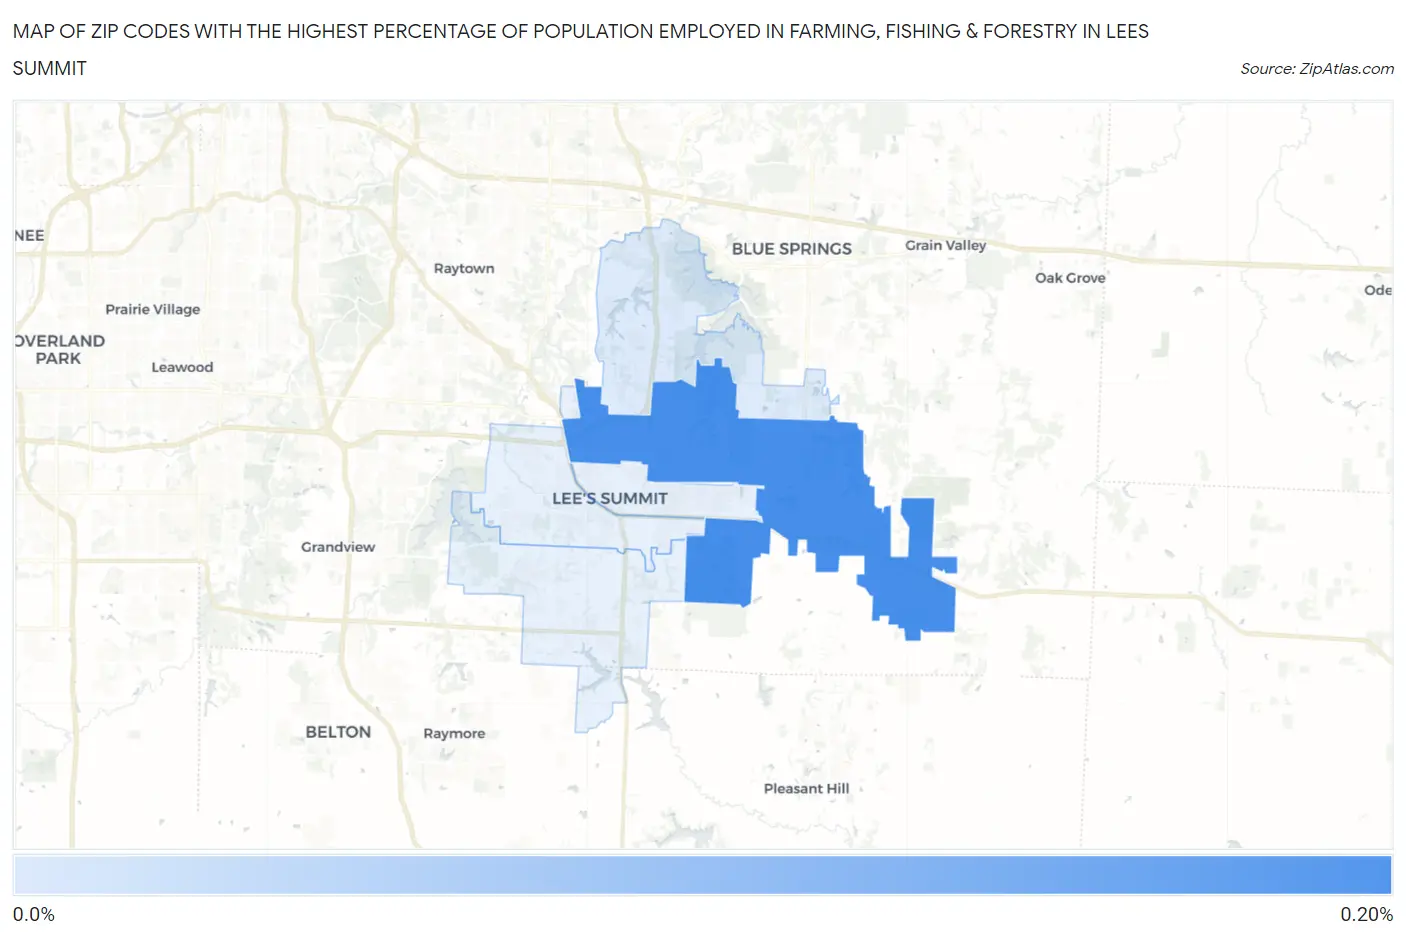
Map of Zip Codes with the Highest Percentage of Population Employed in Farming, Fishing & Forestry in Lees Summit
0.0%
0.20%
Zip Codes with the Highest Percentage of Population Employed in Farming, Fishing & Forestry in Lees Summit, MO
| Zip Code | % Employed | vs State | vs National | |
| 1. | 64086 | 0.16% | 0.49%(-0.326)#536 | 0.61%(-0.442)#16,691 |
| 2. | 64064 | 0.061% | 0.49%(-0.428)#587 | 0.61%(-0.544)#18,453 |
1
Common Questions
What are the Top 5 Zip Codes with the Highest Percentage of Population Employed in Farming, Fishing & Forestry in Lees Summit, MO?
Top 5 Zip Codes with the Highest Percentage of Population Employed in Farming, Fishing & Forestry in Lees Summit, MO are:
What zip code has the Highest Percentage of Population Employed in Farming, Fishing & Forestry in Lees Summit, MO?
64086 has the Highest Percentage of Population Employed in Farming, Fishing & Forestry in Lees Summit, MO with 0.16%.
What is the Percentage of Population Employed in Farming, Fishing & Forestry in Missouri?
Percentage of Population Employed in Farming, Fishing & Forestry in Missouri is 0.49%.
What is the Percentage of Population Employed in Farming, Fishing & Forestry in the United States?
Percentage of Population Employed in Farming, Fishing & Forestry in the United States is 0.61%.