Zip Codes with the Highest Percentage of Population Employed in Farming, Fishing & Forestry in Joplin, MO
RELATED REPORTS & OPTIONS
Farming, Fishing & Forestry
Joplin
Compare Zip Codes
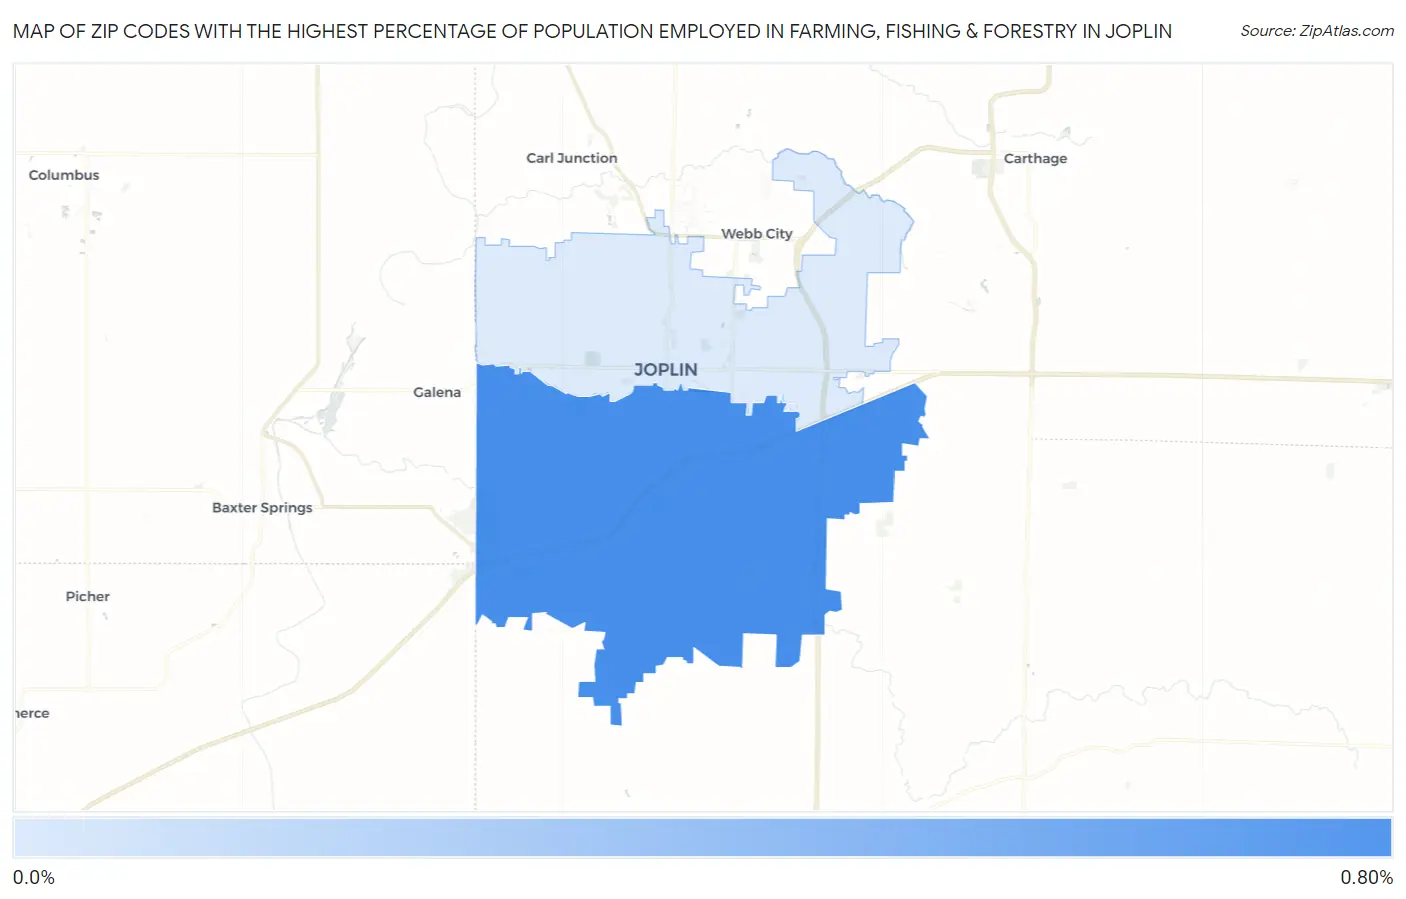
Map of Zip Codes with the Highest Percentage of Population Employed in Farming, Fishing & Forestry in Joplin
0.0%
0.80%
Zip Codes with the Highest Percentage of Population Employed in Farming, Fishing & Forestry in Joplin, MO
| Zip Code | % Employed | vs State | vs National | |
| 1. | 64804 | 0.67% | 0.49%(+0.177)#406 | 0.61%(+0.061)#11,602 |
| 2. | 64801 | 0.13% | 0.49%(-0.358)#553 | 0.61%(-0.474)#17,247 |
1
Common Questions
What are the Top Zip Codes with the Highest Percentage of Population Employed in Farming, Fishing & Forestry in Joplin, MO?
Top Zip Codes with the Highest Percentage of Population Employed in Farming, Fishing & Forestry in Joplin, MO are:
What zip code has the Highest Percentage of Population Employed in Farming, Fishing & Forestry in Joplin, MO?
64804 has the Highest Percentage of Population Employed in Farming, Fishing & Forestry in Joplin, MO with 0.67%.
What is the Percentage of Population Employed in Farming, Fishing & Forestry in Joplin, MO?
Percentage of Population Employed in Farming, Fishing & Forestry in Joplin is 0.35%.
What is the Percentage of Population Employed in Farming, Fishing & Forestry in Missouri?
Percentage of Population Employed in Farming, Fishing & Forestry in Missouri is 0.49%.
What is the Percentage of Population Employed in Farming, Fishing & Forestry in the United States?
Percentage of Population Employed in Farming, Fishing & Forestry in the United States is 0.61%.