Zip Codes with the Highest Unemployment Rate in Minnesota
RELATED REPORTS & OPTIONS
Highest Unemployment
Minnesota
Compare Zip Codes
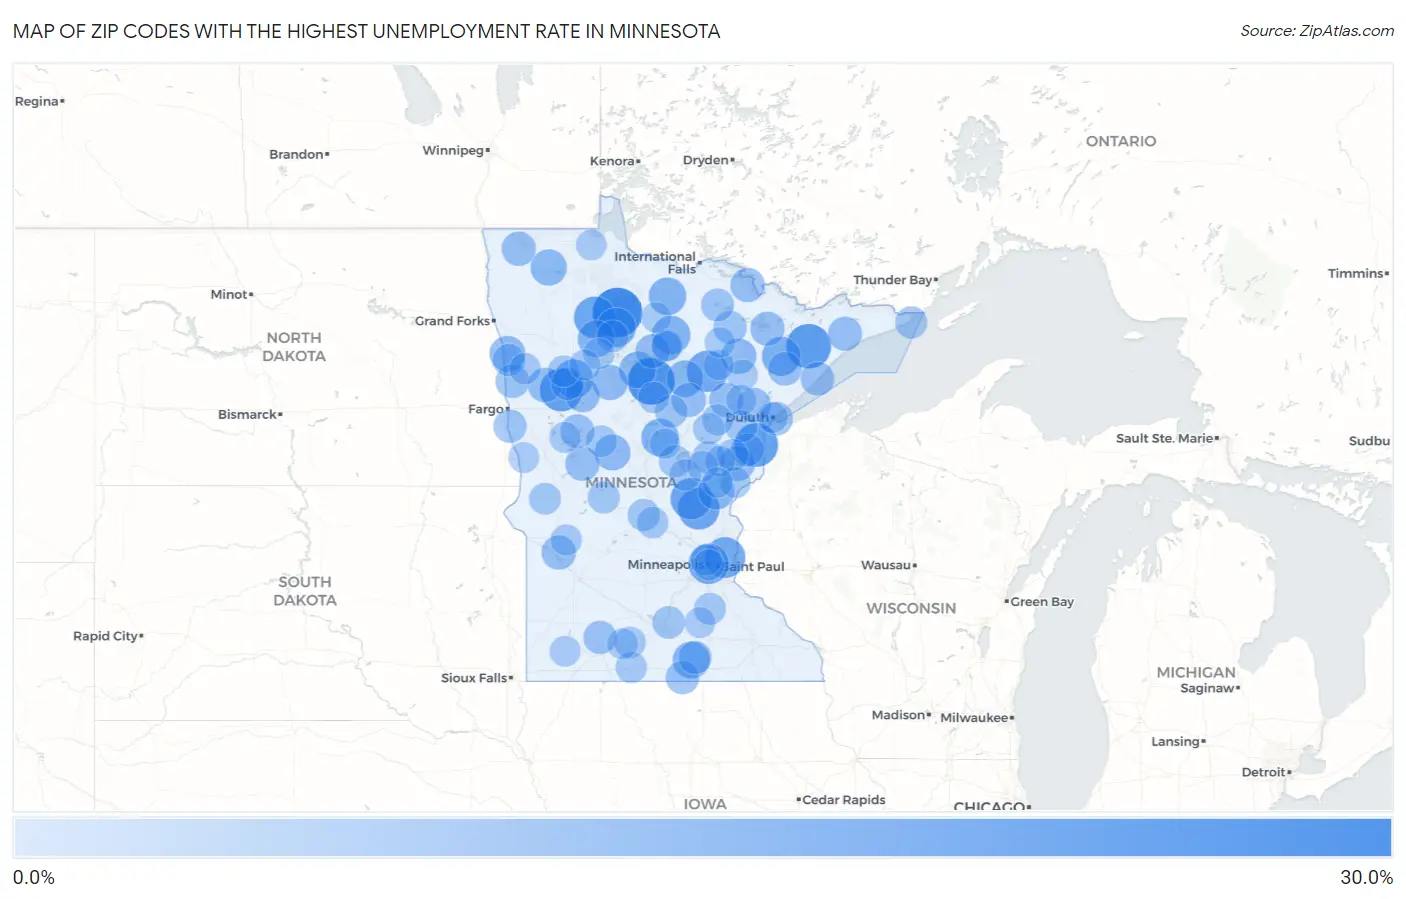
Map of Zip Codes with the Highest Unemployment Rate in Minnesota
0.0%
30.0%
Zip Codes with the Highest Unemployment Rate in Minnesota
| Zip Code | Unemployment Rate | vs State | vs National | |
| 1. | 56666 | 29.6% | 3.7%(+25.9)#1 | 5.0%(+24.6)#350 |
| 2. | 56641 | 26.6% | 3.7%(+22.9)#2 | 5.0%(+21.6)#451 |
| 3. | 55607 | 23.8% | 3.7%(+20.1)#3 | 5.0%(+18.8)#568 |
| 4. | 55749 | 22.6% | 3.7%(+18.9)#4 | 5.0%(+17.6)#627 |
| 5. | 56591 | 21.7% | 3.7%(+18.0)#5 | 5.0%(+16.7)#680 |
| 6. | 56671 | 20.5% | 3.7%(+16.8)#6 | 5.0%(+15.5)#752 |
| 7. | 55017 | 20.1% | 3.7%(+16.4)#7 | 5.0%(+15.1)#787 |
| 8. | 56313 | 20.0% | 3.7%(+16.3)#8 | 5.0%(+15.0)#808 |
| 9. | 55716 | 19.8% | 3.7%(+16.1)#9 | 5.0%(+14.8)#830 |
| 10. | 55090 | 19.1% | 3.7%(+15.4)#10 | 5.0%(+14.1)#902 |
| 11. | 55454 | 18.7% | 3.7%(+15.0)#11 | 5.0%(+13.7)#928 |
| 12. | 56670 | 17.4% | 3.7%(+13.7)#12 | 5.0%(+12.4)#1,070 |
| 13. | 56566 | 17.1% | 3.7%(+13.4)#13 | 5.0%(+12.1)#1,112 |
| 14. | 55750 | 16.8% | 3.7%(+13.1)#14 | 5.0%(+11.8)#1,150 |
| 15. | 56688 | 16.1% | 3.7%(+12.4)#15 | 5.0%(+11.1)#1,250 |
| 16. | 56465 | 15.4% | 3.7%(+11.7)#16 | 5.0%(+10.4)#1,344 |
| 17. | 56627 | 15.4% | 3.7%(+11.7)#17 | 5.0%(+10.4)#1,352 |
| 18. | 56652 | 14.8% | 3.7%(+11.1)#18 | 5.0%(+9.80)#1,475 |
| 19. | 56032 | 14.8% | 3.7%(+11.1)#19 | 5.0%(+9.80)#1,476 |
| 20. | 56633 | 14.4% | 3.7%(+10.7)#20 | 5.0%(+9.40)#1,547 |
| 21. | 55721 | 14.4% | 3.7%(+10.7)#21 | 5.0%(+9.40)#1,549 |
| 22. | 55036 | 14.3% | 3.7%(+10.6)#22 | 5.0%(+9.30)#1,580 |
| 23. | 56759 | 13.9% | 3.7%(+10.2)#23 | 5.0%(+8.90)#1,678 |
| 24. | 56434 | 13.4% | 3.7%(+9.70)#24 | 5.0%(+8.40)#1,813 |
| 25. | 56568 | 13.2% | 3.7%(+9.50)#25 | 5.0%(+8.20)#1,872 |
| 26. | 56458 | 12.8% | 3.7%(+9.10)#26 | 5.0%(+7.80)#1,983 |
| 27. | 55758 | 12.8% | 3.7%(+9.10)#27 | 5.0%(+7.80)#1,988 |
| 28. | 55704 | 12.2% | 3.7%(+8.50)#28 | 5.0%(+7.20)#2,181 |
| 29. | 56575 | 11.8% | 3.7%(+8.10)#29 | 5.0%(+6.80)#2,335 |
| 30. | 56541 | 11.8% | 3.7%(+8.10)#30 | 5.0%(+6.80)#2,342 |
| 31. | 56262 | 11.7% | 3.7%(+8.00)#31 | 5.0%(+6.70)#2,378 |
| 32. | 55748 | 11.6% | 3.7%(+7.90)#32 | 5.0%(+6.60)#2,413 |
| 33. | 56734 | 11.6% | 3.7%(+7.90)#33 | 5.0%(+6.60)#2,426 |
| 34. | 55725 | 11.6% | 3.7%(+7.90)#34 | 5.0%(+6.60)#2,430 |
| 35. | 55736 | 11.5% | 3.7%(+7.80)#35 | 5.0%(+6.50)#2,455 |
| 36. | 56588 | 11.5% | 3.7%(+7.80)#36 | 5.0%(+6.50)#2,464 |
| 37. | 55779 | 11.4% | 3.7%(+7.70)#37 | 5.0%(+6.40)#2,493 |
| 38. | 55782 | 11.4% | 3.7%(+7.70)#38 | 5.0%(+6.40)#2,510 |
| 39. | 55615 | 11.3% | 3.7%(+7.60)#39 | 5.0%(+6.30)#2,561 |
| 40. | 56681 | 11.3% | 3.7%(+7.60)#40 | 5.0%(+6.30)#2,562 |
| 41. | 56573 | 11.1% | 3.7%(+7.40)#41 | 5.0%(+6.10)#2,619 |
| 42. | 55602 | 11.0% | 3.7%(+7.30)#42 | 5.0%(+6.00)#2,701 |
| 43. | 55601 | 10.9% | 3.7%(+7.20)#43 | 5.0%(+5.90)#2,758 |
| 44. | 56574 | 10.8% | 3.7%(+7.10)#44 | 5.0%(+5.80)#2,809 |
| 45. | 55802 | 10.7% | 3.7%(+7.00)#45 | 5.0%(+5.70)#2,840 |
| 46. | 56051 | 10.5% | 3.7%(+6.80)#46 | 5.0%(+5.50)#2,966 |
| 47. | 56145 | 10.4% | 3.7%(+6.70)#47 | 5.0%(+5.40)#3,037 |
| 48. | 55723 | 10.3% | 3.7%(+6.60)#48 | 5.0%(+5.30)#3,075 |
| 49. | 56525 | 10.3% | 3.7%(+6.60)#49 | 5.0%(+5.30)#3,100 |
| 50. | 56042 | 10.2% | 3.7%(+6.50)#50 | 5.0%(+5.20)#3,145 |
| 51. | 55772 | 10.0% | 3.7%(+6.30)#51 | 5.0%(+5.00)#3,292 |
| 52. | 56589 | 9.9% | 3.7%(+6.20)#52 | 5.0%(+4.90)#3,335 |
| 53. | 55756 | 9.9% | 3.7%(+6.20)#53 | 5.0%(+4.90)#3,354 |
| 54. | 56662 | 9.8% | 3.7%(+6.10)#54 | 5.0%(+4.80)#3,420 |
| 55. | 56350 | 9.7% | 3.7%(+6.00)#55 | 5.0%(+4.70)#3,506 |
| 56. | 56050 | 9.6% | 3.7%(+5.90)#56 | 5.0%(+4.60)#3,565 |
| 57. | 56581 | 9.3% | 3.7%(+5.60)#57 | 5.0%(+4.30)#3,808 |
| 58. | 55780 | 9.3% | 3.7%(+5.60)#58 | 5.0%(+4.30)#3,809 |
| 59. | 55605 | 9.2% | 3.7%(+5.50)#59 | 5.0%(+4.20)#3,878 |
| 60. | 56450 | 9.1% | 3.7%(+5.40)#60 | 5.0%(+4.10)#3,956 |
| 61. | 56321 | 9.0% | 3.7%(+5.30)#61 | 5.0%(+4.00)#4,029 |
| 62. | 56389 | 8.9% | 3.7%(+5.20)#62 | 5.0%(+3.90)#4,139 |
| 63. | 56667 | 8.8% | 3.7%(+5.10)#63 | 5.0%(+3.80)#4,234 |
| 64. | 55795 | 8.7% | 3.7%(+5.00)#64 | 5.0%(+3.70)#4,313 |
| 65. | 55019 | 8.6% | 3.7%(+4.90)#65 | 5.0%(+3.60)#4,417 |
| 66. | 56248 | 8.6% | 3.7%(+4.90)#66 | 5.0%(+3.60)#4,432 |
| 67. | 56301 | 8.5% | 3.7%(+4.80)#67 | 5.0%(+3.50)#4,461 |
| 68. | 56557 | 8.5% | 3.7%(+4.80)#68 | 5.0%(+3.50)#4,527 |
| 69. | 56482 | 8.4% | 3.7%(+4.70)#69 | 5.0%(+3.40)#4,623 |
| 70. | 56359 | 8.4% | 3.7%(+4.70)#70 | 5.0%(+3.40)#4,638 |
| 71. | 56081 | 8.3% | 3.7%(+4.60)#71 | 5.0%(+3.30)#4,739 |
| 72. | 55760 | 8.3% | 3.7%(+4.60)#72 | 5.0%(+3.30)#4,756 |
| 73. | 56510 | 8.2% | 3.7%(+4.50)#73 | 5.0%(+3.20)#4,896 |
| 74. | 56676 | 8.1% | 3.7%(+4.40)#74 | 5.0%(+3.10)#5,016 |
| 75. | 56655 | 8.1% | 3.7%(+4.40)#75 | 5.0%(+3.10)#5,026 |
| 76. | 56181 | 8.1% | 3.7%(+4.40)#76 | 5.0%(+3.10)#5,032 |
| 77. | 55787 | 8.1% | 3.7%(+4.40)#77 | 5.0%(+3.10)#5,046 |
| 78. | 56680 | 8.1% | 3.7%(+4.40)#78 | 5.0%(+3.10)#5,059 |
| 79. | 55412 | 8.0% | 3.7%(+4.30)#79 | 5.0%(+3.00)#5,087 |
| 80. | 56231 | 8.0% | 3.7%(+4.30)#80 | 5.0%(+3.00)#5,190 |
| 81. | 55404 | 7.8% | 3.7%(+4.10)#81 | 5.0%(+2.80)#5,342 |
| 82. | 55037 | 7.8% | 3.7%(+4.10)#82 | 5.0%(+2.80)#5,391 |
| 83. | 56621 | 7.8% | 3.7%(+4.10)#83 | 5.0%(+2.80)#5,396 |
| 84. | 56528 | 7.8% | 3.7%(+4.10)#84 | 5.0%(+2.80)#5,425 |
| 85. | 55806 | 7.6% | 3.7%(+3.90)#85 | 5.0%(+2.60)#5,663 |
| 86. | 56342 | 7.6% | 3.7%(+3.90)#86 | 5.0%(+2.60)#5,691 |
| 87. | 56120 | 7.6% | 3.7%(+3.90)#87 | 5.0%(+2.60)#5,713 |
| 88. | 56763 | 7.5% | 3.7%(+3.80)#88 | 5.0%(+2.50)#5,815 |
| 89. | 55738 | 7.5% | 3.7%(+3.80)#89 | 5.0%(+2.50)#5,881 |
| 90. | 56659 | 7.5% | 3.7%(+3.80)#90 | 5.0%(+2.50)#5,890 |
| 91. | 56520 | 7.4% | 3.7%(+3.70)#91 | 5.0%(+2.40)#5,982 |
| 92. | 55702 | 7.4% | 3.7%(+3.70)#92 | 5.0%(+2.40)#6,028 |
| 93. | 55087 | 7.4% | 3.7%(+3.70)#93 | 5.0%(+2.40)#6,033 |
| 94. | 56141 | 7.4% | 3.7%(+3.70)#94 | 5.0%(+2.40)#6,038 |
| 95. | 55735 | 7.3% | 3.7%(+3.60)#95 | 5.0%(+2.30)#6,163 |
| 96. | 56455 | 7.1% | 3.7%(+3.40)#96 | 5.0%(+2.10)#6,467 |
| 97. | 55753 | 7.1% | 3.7%(+3.40)#97 | 5.0%(+2.10)#6,476 |
| 98. | 55781 | 7.1% | 3.7%(+3.40)#98 | 5.0%(+2.10)#6,487 |
| 99. | 56660 | 7.1% | 3.7%(+3.40)#99 | 5.0%(+2.10)#6,503 |
| 100. | 55007 | 7.0% | 3.7%(+3.30)#100 | 5.0%(+2.00)#6,632 |
Common Questions
What are the Top 10 Zip Codes with the Highest Unemployment Rate in Minnesota?
Top 10 Zip Codes with the Highest Unemployment Rate in Minnesota are:
What zip code has the Highest Unemployment Rate in Minnesota?
56666 has the Highest Unemployment Rate in Minnesota with 29.6%.
What is the Unemployment Rate in the State of Minnesota?
Unemployment Rate in Minnesota is 3.7%.
What is the Unemployment Rate in the United States?
Unemployment Rate in the United States is 5.0%.