Zip Codes with the Highest Percentage of Population Employed in Sales & Related in Minnesota
RELATED REPORTS & OPTIONS
Sales & Related
Minnesota
Compare Zip Codes
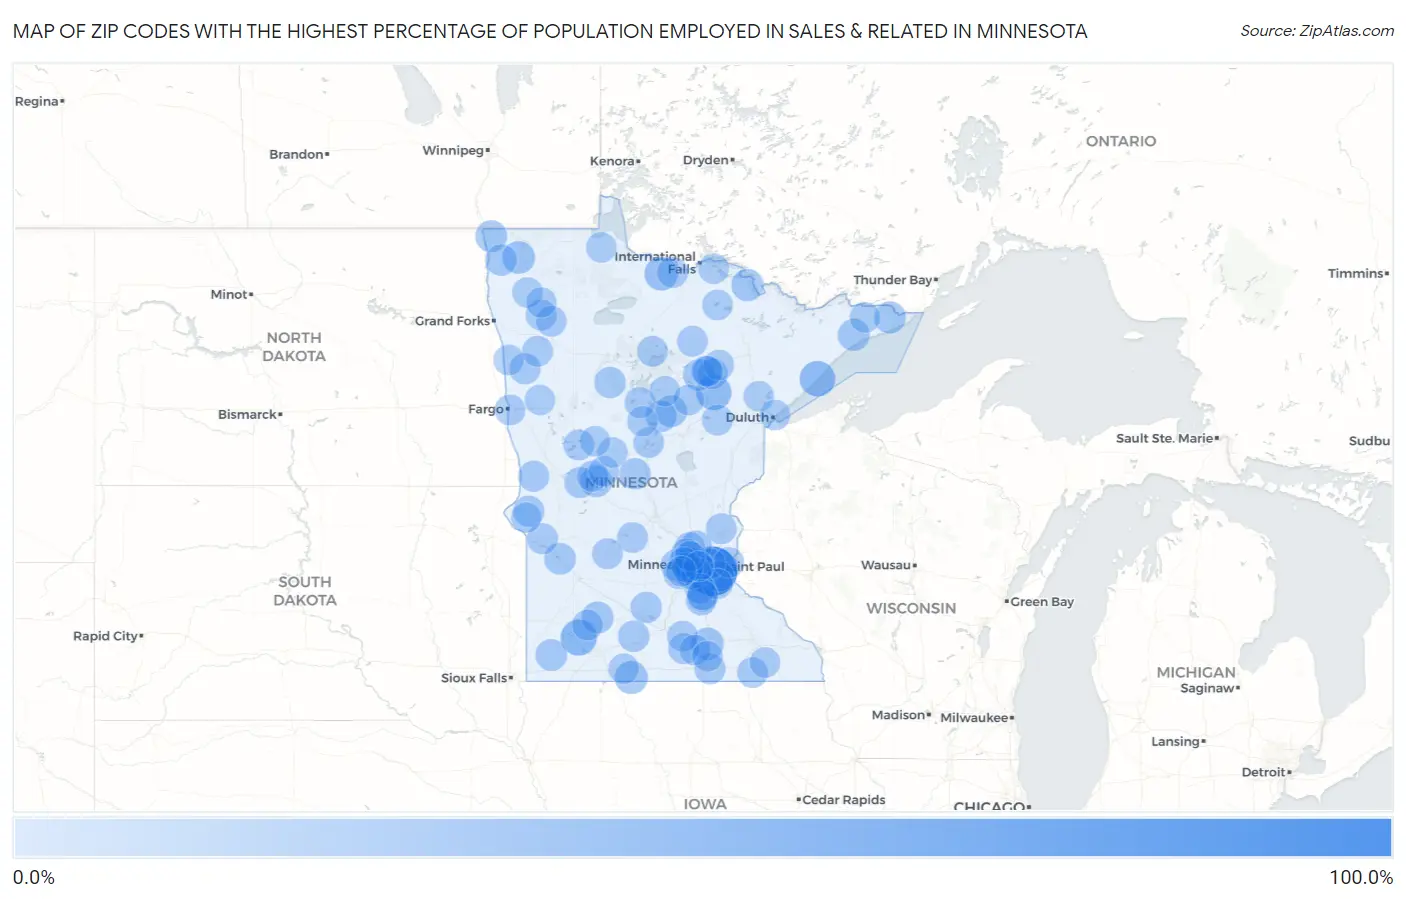
Map of Zip Codes with the Highest Percentage of Population Employed in Sales & Related in Minnesota
0.0%
100.0%
Zip Codes with the Highest Percentage of Population Employed in Sales & Related in Minnesota
| Zip Code | % Employed | vs State | vs National | |
| 1. | 55111 | 100.0% | 9.1%(+90.9)#1 | 9.6%(+90.4)#16 |
| 2. | 56125 | 38.1% | 9.1%(+29.0)#2 | 9.6%(+28.5)#225 |
| 3. | 55601 | 35.2% | 9.1%(+26.1)#3 | 9.6%(+25.6)#270 |
| 4. | 55784 | 34.0% | 9.1%(+24.8)#4 | 9.6%(+24.4)#293 |
| 5. | 56629 | 26.5% | 9.1%(+17.4)#5 | 9.6%(+16.9)#542 |
| 6. | 56121 | 23.2% | 9.1%(+14.1)#6 | 9.6%(+13.6)#770 |
| 7. | 56729 | 21.7% | 9.1%(+12.6)#7 | 9.6%(+12.1)#931 |
| 8. | 56046 | 21.5% | 9.1%(+12.4)#8 | 9.6%(+11.9)#957 |
| 9. | 55725 | 20.0% | 9.1%(+10.9)#9 | 9.6%(+10.4)#1,160 |
| 10. | 55612 | 19.3% | 9.1%(+10.1)#10 | 9.6%(+9.67)#1,285 |
| 11. | 55606 | 18.4% | 9.1%(+9.23)#11 | 9.6%(+8.77)#1,471 |
| 12. | 56662 | 18.2% | 9.1%(+9.08)#12 | 9.6%(+8.63)#1,509 |
| 13. | 56731 | 18.2% | 9.1%(+9.04)#13 | 9.6%(+8.59)#1,532 |
| 14. | 56294 | 18.2% | 9.1%(+9.04)#14 | 9.6%(+8.59)#1,533 |
| 15. | 56319 | 18.1% | 9.1%(+8.99)#15 | 9.6%(+8.53)#1,546 |
| 16. | 56153 | 17.6% | 9.1%(+8.51)#16 | 9.6%(+8.05)#1,654 |
| 17. | 56295 | 17.4% | 9.1%(+8.25)#17 | 9.6%(+7.80)#1,717 |
| 18. | 55722 | 17.1% | 9.1%(+7.94)#18 | 9.6%(+7.48)#1,813 |
| 19. | 56448 | 16.7% | 9.1%(+7.53)#19 | 9.6%(+7.07)#1,940 |
| 20. | 56733 | 16.7% | 9.1%(+7.53)#20 | 9.6%(+7.07)#1,941 |
| 21. | 55327 | 16.5% | 9.1%(+7.31)#21 | 9.6%(+6.86)#2,034 |
| 22. | 56056 | 16.3% | 9.1%(+7.19)#22 | 9.6%(+6.73)#2,089 |
| 23. | 55391 | 16.1% | 9.1%(+6.91)#23 | 9.6%(+6.46)#2,214 |
| 24. | 56054 | 15.9% | 9.1%(+6.76)#24 | 9.6%(+6.30)#2,280 |
| 25. | 56458 | 15.6% | 9.1%(+6.46)#25 | 9.6%(+6.01)#2,420 |
| 26. | 56475 | 15.5% | 9.1%(+6.40)#26 | 9.6%(+5.95)#2,448 |
| 27. | 55424 | 15.5% | 9.1%(+6.38)#27 | 9.6%(+5.92)#2,465 |
| 28. | 55388 | 15.3% | 9.1%(+6.14)#28 | 9.6%(+5.69)#2,575 |
| 29. | 56332 | 15.3% | 9.1%(+6.12)#29 | 9.6%(+5.66)#2,595 |
| 30. | 56236 | 15.2% | 9.1%(+6.08)#30 | 9.6%(+5.62)#2,617 |
| 31. | 55356 | 15.2% | 9.1%(+6.02)#31 | 9.6%(+5.57)#2,641 |
| 32. | 55436 | 15.0% | 9.1%(+5.82)#32 | 9.6%(+5.37)#2,759 |
| 33. | 56510 | 14.8% | 9.1%(+5.67)#33 | 9.6%(+5.22)#2,853 |
| 34. | 56565 | 14.7% | 9.1%(+5.56)#34 | 9.6%(+5.11)#2,936 |
| 35. | 55764 | 14.7% | 9.1%(+5.54)#35 | 9.6%(+5.09)#2,952 |
| 36. | 56043 | 14.6% | 9.1%(+5.51)#36 | 9.6%(+5.05)#2,980 |
| 37. | 56091 | 14.5% | 9.1%(+5.36)#37 | 9.6%(+4.91)#3,083 |
| 38. | 56354 | 14.4% | 9.1%(+5.25)#38 | 9.6%(+4.80)#3,163 |
| 39. | 56754 | 14.4% | 9.1%(+5.24)#39 | 9.6%(+4.79)#3,177 |
| 40. | 55787 | 14.3% | 9.1%(+5.20)#40 | 9.6%(+4.74)#3,206 |
| 41. | 55054 | 14.3% | 9.1%(+5.17)#41 | 9.6%(+4.72)#3,226 |
| 42. | 56227 | 14.3% | 9.1%(+5.14)#42 | 9.6%(+4.69)#3,261 |
| 43. | 56654 | 14.3% | 9.1%(+5.14)#43 | 9.6%(+4.69)#3,272 |
| 44. | 55347 | 14.0% | 9.1%(+4.83)#44 | 9.6%(+4.38)#3,505 |
| 45. | 56452 | 14.0% | 9.1%(+4.81)#45 | 9.6%(+4.36)#3,519 |
| 46. | 55079 | 13.9% | 9.1%(+4.80)#46 | 9.6%(+4.34)#3,531 |
| 47. | 55775 | 13.9% | 9.1%(+4.75)#47 | 9.6%(+4.29)#3,565 |
| 48. | 55331 | 13.9% | 9.1%(+4.72)#48 | 9.6%(+4.27)#3,584 |
| 49. | 56540 | 13.8% | 9.1%(+4.68)#49 | 9.6%(+4.23)#3,622 |
| 50. | 55329 | 13.7% | 9.1%(+4.60)#50 | 9.6%(+4.15)#3,703 |
| 51. | 56048 | 13.7% | 9.1%(+4.60)#51 | 9.6%(+4.14)#3,717 |
| 52. | 55088 | 13.7% | 9.1%(+4.55)#52 | 9.6%(+4.10)#3,755 |
| 53. | 56628 | 13.7% | 9.1%(+4.52)#53 | 9.6%(+4.06)#3,791 |
| 54. | 56748 | 13.6% | 9.1%(+4.50)#54 | 9.6%(+4.04)#3,804 |
| 55. | 56681 | 13.6% | 9.1%(+4.45)#55 | 9.6%(+4.00)#3,848 |
| 56. | 56166 | 13.5% | 9.1%(+4.34)#56 | 9.6%(+3.89)#3,958 |
| 57. | 55077 | 13.4% | 9.1%(+4.29)#57 | 9.6%(+3.84)#4,008 |
| 58. | 55374 | 13.4% | 9.1%(+4.25)#58 | 9.6%(+3.79)#4,046 |
| 59. | 56571 | 13.4% | 9.1%(+4.24)#59 | 9.6%(+3.79)#4,054 |
| 60. | 56201 | 13.3% | 9.1%(+4.21)#60 | 9.6%(+3.75)#4,105 |
| 61. | 56563 | 13.3% | 9.1%(+4.15)#61 | 9.6%(+3.69)#4,174 |
| 62. | 55748 | 13.3% | 9.1%(+4.13)#62 | 9.6%(+3.68)#4,193 |
| 63. | 55961 | 13.3% | 9.1%(+4.12)#63 | 9.6%(+3.67)#4,209 |
| 64. | 55317 | 13.2% | 9.1%(+4.10)#64 | 9.6%(+3.64)#4,236 |
| 65. | 55455 | 13.2% | 9.1%(+4.08)#65 | 9.6%(+3.63)#4,247 |
| 66. | 56072 | 13.1% | 9.1%(+3.96)#66 | 9.6%(+3.50)#4,386 |
| 67. | 56468 | 13.0% | 9.1%(+3.91)#67 | 9.6%(+3.45)#4,432 |
| 68. | 55772 | 13.0% | 9.1%(+3.90)#68 | 9.6%(+3.45)#4,437 |
| 69. | 56581 | 13.0% | 9.1%(+3.84)#69 | 9.6%(+3.38)#4,514 |
| 70. | 55042 | 12.9% | 9.1%(+3.74)#70 | 9.6%(+3.29)#4,625 |
| 71. | 56035 | 12.8% | 9.1%(+3.66)#71 | 9.6%(+3.20)#4,758 |
| 72. | 56446 | 12.7% | 9.1%(+3.57)#72 | 9.6%(+3.12)#4,864 |
| 73. | 56171 | 12.7% | 9.1%(+3.54)#73 | 9.6%(+3.09)#4,900 |
| 74. | 55357 | 12.6% | 9.1%(+3.50)#74 | 9.6%(+3.04)#4,961 |
| 75. | 55359 | 12.6% | 9.1%(+3.47)#75 | 9.6%(+3.01)#4,998 |
| 76. | 55068 | 12.6% | 9.1%(+3.46)#76 | 9.6%(+3.01)#5,004 |
| 77. | 55387 | 12.6% | 9.1%(+3.42)#77 | 9.6%(+2.97)#5,064 |
| 78. | 56760 | 12.5% | 9.1%(+3.41)#78 | 9.6%(+2.95)#5,090 |
| 79. | 55717 | 12.5% | 9.1%(+3.36)#79 | 9.6%(+2.90)#5,181 |
| 80. | 56649 | 12.5% | 9.1%(+3.32)#80 | 9.6%(+2.87)#5,225 |
| 81. | 55346 | 12.4% | 9.1%(+3.30)#81 | 9.6%(+2.85)#5,258 |
| 82. | 55753 | 12.4% | 9.1%(+3.28)#82 | 9.6%(+2.82)#5,299 |
| 83. | 55372 | 12.4% | 9.1%(+3.26)#83 | 9.6%(+2.81)#5,322 |
| 84. | 56552 | 12.4% | 9.1%(+3.24)#84 | 9.6%(+2.79)#5,349 |
| 85. | 55716 | 12.4% | 9.1%(+3.23)#85 | 9.6%(+2.78)#5,374 |
| 86. | 56434 | 12.4% | 9.1%(+3.22)#86 | 9.6%(+2.76)#5,398 |
| 87. | 56673 | 12.3% | 9.1%(+3.13)#87 | 9.6%(+2.68)#5,524 |
| 88. | 56672 | 12.3% | 9.1%(+3.12)#88 | 9.6%(+2.67)#5,552 |
| 89. | 55384 | 12.2% | 9.1%(+3.11)#89 | 9.6%(+2.65)#5,584 |
| 90. | 55340 | 12.2% | 9.1%(+3.11)#90 | 9.6%(+2.65)#5,590 |
| 91. | 55604 | 12.2% | 9.1%(+3.06)#91 | 9.6%(+2.60)#5,669 |
| 92. | 55990 | 12.2% | 9.1%(+3.04)#92 | 9.6%(+2.58)#5,710 |
| 93. | 56474 | 12.2% | 9.1%(+3.03)#93 | 9.6%(+2.58)#5,715 |
| 94. | 55020 | 12.2% | 9.1%(+3.03)#94 | 9.6%(+2.57)#5,731 |
| 95. | 55305 | 12.1% | 9.1%(+2.99)#95 | 9.6%(+2.54)#5,797 |
| 96. | 55805 | 12.1% | 9.1%(+2.96)#96 | 9.6%(+2.51)#5,865 |
| 97. | 55375 | 12.1% | 9.1%(+2.94)#97 | 9.6%(+2.49)#5,902 |
| 98. | 56240 | 12.0% | 9.1%(+2.90)#98 | 9.6%(+2.45)#5,976 |
| 99. | 56518 | 12.0% | 9.1%(+2.84)#99 | 9.6%(+2.38)#6,086 |
| 100. | 56701 | 12.0% | 9.1%(+2.84)#100 | 9.6%(+2.38)#6,090 |
Common Questions
What are the Top 10 Zip Codes with the Highest Percentage of Population Employed in Sales & Related in Minnesota?
Top 10 Zip Codes with the Highest Percentage of Population Employed in Sales & Related in Minnesota are:
What zip code has the Highest Percentage of Population Employed in Sales & Related in Minnesota?
55111 has the Highest Percentage of Population Employed in Sales & Related in Minnesota with 100.0%.
What is the Percentage of Population Employed in Sales & Related in the State of Minnesota?
Percentage of Population Employed in Sales & Related in Minnesota is 9.1%.
What is the Percentage of Population Employed in Sales & Related in the United States?
Percentage of Population Employed in Sales & Related in the United States is 9.6%.