Zip Codes with the Highest Percentage of Population Employed in Farming, Fishing & Forestry in Minnesota
RELATED REPORTS & OPTIONS
Farming, Fishing & Forestry
Minnesota
Compare Zip Codes
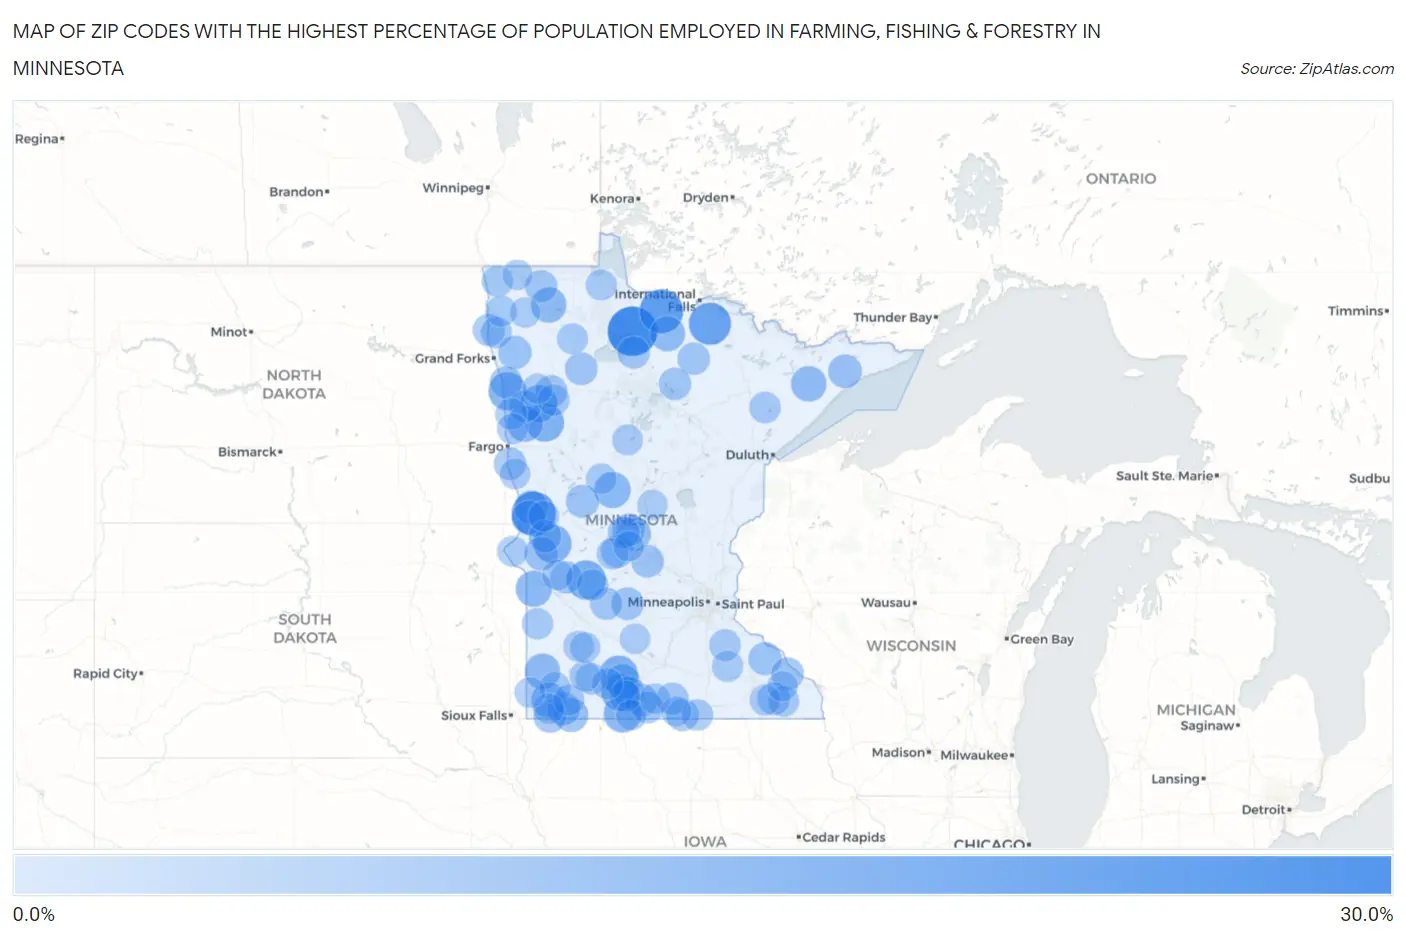
Map of Zip Codes with the Highest Percentage of Population Employed in Farming, Fishing & Forestry in Minnesota
0.0%
30.0%
Zip Codes with the Highest Percentage of Population Employed in Farming, Fishing & Forestry in Minnesota
| Zip Code | % Employed | vs State | vs National | |
| 1. | 56685 | 28.6% | 0.63%(+27.9)#1 | 0.61%(+28.0)#214 |
| 2. | 56565 | 22.1% | 0.63%(+21.4)#2 | 0.61%(+21.5)#342 |
| 3. | 56629 | 21.7% | 0.63%(+21.1)#3 | 0.61%(+21.1)#354 |
| 4. | 56669 | 19.5% | 0.63%(+18.9)#4 | 0.61%(+18.9)#426 |
| 5. | 56271 | 16.0% | 0.63%(+15.4)#5 | 0.61%(+15.4)#590 |
| 6. | 56022 | 15.2% | 0.63%(+14.6)#6 | 0.61%(+14.6)#636 |
| 7. | 56541 | 14.8% | 0.63%(+14.2)#7 | 0.61%(+14.2)#660 |
| 8. | 56235 | 14.8% | 0.63%(+14.2)#8 | 0.61%(+14.2)#661 |
| 9. | 56568 | 14.5% | 0.63%(+13.9)#9 | 0.61%(+13.9)#675 |
| 10. | 56127 | 13.9% | 0.63%(+13.3)#10 | 0.61%(+13.3)#728 |
| 11. | 56160 | 13.7% | 0.63%(+13.1)#11 | 0.61%(+13.1)#745 |
| 12. | 56545 | 13.2% | 0.63%(+12.6)#12 | 0.61%(+12.6)#795 |
| 13. | 56434 | 12.4% | 0.63%(+11.7)#13 | 0.61%(+11.8)#887 |
| 14. | 56212 | 12.3% | 0.63%(+11.6)#14 | 0.61%(+11.6)#905 |
| 15. | 56519 | 12.0% | 0.63%(+11.3)#15 | 0.61%(+11.4)#935 |
| 16. | 55607 | 11.4% | 0.63%(+10.8)#16 | 0.61%(+10.8)#1,000 |
| 17. | 56139 | 11.4% | 0.63%(+10.8)#17 | 0.61%(+10.8)#1,002 |
| 18. | 56759 | 11.3% | 0.63%(+10.7)#18 | 0.61%(+10.7)#1,015 |
| 19. | 56627 | 11.1% | 0.63%(+10.5)#19 | 0.61%(+10.5)#1,035 |
| 20. | 56147 | 10.9% | 0.63%(+10.3)#20 | 0.61%(+10.3)#1,064 |
| 21. | 56120 | 10.4% | 0.63%(+9.75)#21 | 0.61%(+9.77)#1,149 |
| 22. | 56384 | 10.2% | 0.63%(+9.55)#22 | 0.61%(+9.57)#1,183 |
| 23. | 56117 | 9.8% | 0.63%(+9.17)#23 | 0.61%(+9.19)#1,241 |
| 24. | 56522 | 9.6% | 0.63%(+8.99)#24 | 0.61%(+9.01)#1,273 |
| 25. | 56583 | 9.5% | 0.63%(+8.85)#25 | 0.61%(+8.87)#1,304 |
| 26. | 56221 | 9.3% | 0.63%(+8.67)#26 | 0.61%(+8.70)#1,339 |
| 27. | 55615 | 9.3% | 0.63%(+8.63)#27 | 0.61%(+8.65)#1,346 |
| 28. | 56722 | 8.8% | 0.63%(+8.13)#28 | 0.61%(+8.16)#1,464 |
| 29. | 56588 | 8.7% | 0.63%(+8.09)#29 | 0.61%(+8.11)#1,477 |
| 30. | 56168 | 8.7% | 0.63%(+8.08)#30 | 0.61%(+8.10)#1,478 |
| 31. | 55957 | 8.6% | 0.63%(+7.94)#31 | 0.61%(+7.96)#1,513 |
| 32. | 56335 | 8.5% | 0.63%(+7.85)#32 | 0.61%(+7.87)#1,531 |
| 33. | 56129 | 8.5% | 0.63%(+7.82)#33 | 0.61%(+7.85)#1,533 |
| 34. | 56075 | 8.3% | 0.63%(+7.71)#34 | 0.61%(+7.73)#1,565 |
| 35. | 56318 | 8.2% | 0.63%(+7.57)#35 | 0.61%(+7.60)#1,607 |
| 36. | 56644 | 8.1% | 0.63%(+7.43)#36 | 0.61%(+7.45)#1,647 |
| 37. | 56228 | 8.0% | 0.63%(+7.35)#37 | 0.61%(+7.37)#1,671 |
| 38. | 56369 | 8.0% | 0.63%(+7.34)#38 | 0.61%(+7.36)#1,676 |
| 39. | 55969 | 8.0% | 0.63%(+7.34)#39 | 0.61%(+7.36)#1,677 |
| 40. | 56248 | 7.9% | 0.63%(+7.31)#40 | 0.61%(+7.33)#1,684 |
| 41. | 56523 | 7.9% | 0.63%(+7.27)#41 | 0.61%(+7.29)#1,692 |
| 42. | 55935 | 7.9% | 0.63%(+7.26)#42 | 0.61%(+7.28)#1,695 |
| 43. | 56639 | 7.8% | 0.63%(+7.22)#43 | 0.61%(+7.24)#1,707 |
| 44. | 56592 | 7.8% | 0.63%(+7.16)#44 | 0.61%(+7.19)#1,722 |
| 45. | 56051 | 7.8% | 0.63%(+7.13)#45 | 0.61%(+7.16)#1,738 |
| 46. | 56637 | 7.7% | 0.63%(+7.06)#46 | 0.61%(+7.09)#1,760 |
| 47. | 56525 | 7.7% | 0.63%(+7.06)#47 | 0.61%(+7.09)#1,763 |
| 48. | 56650 | 7.6% | 0.63%(+7.02)#48 | 0.61%(+7.04)#1,774 |
| 49. | 56726 | 7.6% | 0.63%(+7.00)#49 | 0.61%(+7.03)#1,780 |
| 50. | 56510 | 7.6% | 0.63%(+6.96)#50 | 0.61%(+6.99)#1,793 |
| 51. | 56162 | 7.6% | 0.63%(+6.94)#51 | 0.61%(+6.96)#1,801 |
| 52. | 56216 | 7.5% | 0.63%(+6.85)#52 | 0.61%(+6.88)#1,827 |
| 53. | 56231 | 7.4% | 0.63%(+6.80)#53 | 0.61%(+6.82)#1,843 |
| 54. | 56025 | 7.4% | 0.63%(+6.74)#54 | 0.61%(+6.76)#1,867 |
| 55. | 56744 | 7.3% | 0.63%(+6.69)#55 | 0.61%(+6.71)#1,875 |
| 56. | 56336 | 7.2% | 0.63%(+6.62)#56 | 0.61%(+6.64)#1,898 |
| 57. | 56039 | 7.0% | 0.63%(+6.34)#57 | 0.61%(+6.37)#1,988 |
| 58. | 55018 | 6.9% | 0.63%(+6.25)#58 | 0.61%(+6.28)#2,033 |
| 59. | 55763 | 6.8% | 0.63%(+6.20)#59 | 0.61%(+6.22)#2,045 |
| 60. | 56550 | 6.8% | 0.63%(+6.17)#60 | 0.61%(+6.20)#2,056 |
| 61. | 56516 | 6.8% | 0.63%(+6.16)#61 | 0.61%(+6.18)#2,063 |
| 62. | 56176 | 6.8% | 0.63%(+6.16)#62 | 0.61%(+6.18)#2,064 |
| 63. | 56174 | 6.7% | 0.63%(+6.04)#63 | 0.61%(+6.06)#2,107 |
| 64. | 56325 | 6.7% | 0.63%(+6.04)#64 | 0.61%(+6.06)#2,109 |
| 65. | 56252 | 6.6% | 0.63%(+5.99)#65 | 0.61%(+6.02)#2,119 |
| 66. | 56089 | 6.6% | 0.63%(+5.94)#66 | 0.61%(+5.96)#2,137 |
| 67. | 56710 | 6.5% | 0.63%(+5.90)#67 | 0.61%(+5.93)#2,150 |
| 68. | 56122 | 6.4% | 0.63%(+5.76)#68 | 0.61%(+5.78)#2,205 |
| 69. | 56118 | 6.4% | 0.63%(+5.76)#69 | 0.61%(+5.78)#2,206 |
| 70. | 56220 | 6.3% | 0.63%(+5.68)#70 | 0.61%(+5.70)#2,235 |
| 71. | 55985 | 6.3% | 0.63%(+5.67)#71 | 0.61%(+5.70)#2,237 |
| 72. | 56728 | 6.3% | 0.63%(+5.65)#72 | 0.61%(+5.68)#2,252 |
| 73. | 56757 | 6.2% | 0.63%(+5.59)#73 | 0.61%(+5.61)#2,286 |
| 74. | 56673 | 6.1% | 0.63%(+5.51)#74 | 0.61%(+5.53)#2,325 |
| 75. | 56165 | 6.1% | 0.63%(+5.51)#75 | 0.61%(+5.53)#2,326 |
| 76. | 55949 | 6.1% | 0.63%(+5.48)#76 | 0.61%(+5.50)#2,342 |
| 77. | 56183 | 6.1% | 0.63%(+5.44)#77 | 0.61%(+5.46)#2,357 |
| 78. | 56725 | 6.0% | 0.63%(+5.41)#78 | 0.61%(+5.44)#2,374 |
| 79. | 56590 | 5.9% | 0.63%(+5.31)#79 | 0.61%(+5.34)#2,421 |
| 80. | 56433 | 5.9% | 0.63%(+5.29)#80 | 0.61%(+5.31)#2,439 |
| 81. | 56158 | 5.9% | 0.63%(+5.28)#81 | 0.61%(+5.31)#2,441 |
| 82. | 55990 | 5.9% | 0.63%(+5.28)#82 | 0.61%(+5.30)#2,444 |
| 83. | 56546 | 5.8% | 0.63%(+5.21)#83 | 0.61%(+5.23)#2,477 |
| 84. | 56263 | 5.8% | 0.63%(+5.19)#84 | 0.61%(+5.21)#2,488 |
| 85. | 56482 | 5.8% | 0.63%(+5.16)#85 | 0.61%(+5.18)#2,498 |
| 86. | 56211 | 5.7% | 0.63%(+5.12)#86 | 0.61%(+5.14)#2,524 |
| 87. | 56594 | 5.7% | 0.63%(+5.08)#87 | 0.61%(+5.10)#2,549 |
| 88. | 56255 | 5.7% | 0.63%(+5.07)#88 | 0.61%(+5.09)#2,550 |
| 89. | 56249 | 5.7% | 0.63%(+5.03)#89 | 0.61%(+5.05)#2,568 |
| 90. | 56121 | 5.6% | 0.63%(+5.01)#90 | 0.61%(+5.03)#2,579 |
| 91. | 56144 | 5.6% | 0.63%(+5.00)#91 | 0.61%(+5.03)#2,581 |
| 92. | 56331 | 5.5% | 0.63%(+4.92)#92 | 0.61%(+4.94)#2,630 |
| 93. | 56098 | 5.5% | 0.63%(+4.91)#93 | 0.61%(+4.93)#2,635 |
| 94. | 56014 | 5.5% | 0.63%(+4.86)#94 | 0.61%(+4.88)#2,661 |
| 95. | 55335 | 5.5% | 0.63%(+4.85)#95 | 0.61%(+4.87)#2,663 |
| 96. | 56449 | 5.4% | 0.63%(+4.81)#96 | 0.61%(+4.83)#2,685 |
| 97. | 55979 | 5.4% | 0.63%(+4.81)#97 | 0.61%(+4.83)#2,686 |
| 98. | 56758 | 5.4% | 0.63%(+4.76)#98 | 0.61%(+4.78)#2,704 |
| 99. | 56735 | 5.3% | 0.63%(+4.68)#99 | 0.61%(+4.70)#2,739 |
| 100. | 56540 | 5.3% | 0.63%(+4.67)#100 | 0.61%(+4.69)#2,744 |
Common Questions
What are the Top 10 Zip Codes with the Highest Percentage of Population Employed in Farming, Fishing & Forestry in Minnesota?
Top 10 Zip Codes with the Highest Percentage of Population Employed in Farming, Fishing & Forestry in Minnesota are:
What zip code has the Highest Percentage of Population Employed in Farming, Fishing & Forestry in Minnesota?
56685 has the Highest Percentage of Population Employed in Farming, Fishing & Forestry in Minnesota with 28.6%.
What is the Percentage of Population Employed in Farming, Fishing & Forestry in the State of Minnesota?
Percentage of Population Employed in Farming, Fishing & Forestry in Minnesota is 0.63%.
What is the Percentage of Population Employed in Farming, Fishing & Forestry in the United States?
Percentage of Population Employed in Farming, Fishing & Forestry in the United States is 0.61%.