Zip Codes with the Highest Percentage of Population Employed in Administrative & Support Services in Duluth, MN

RELATED REPORTS & OPTIONS

Administrative & Support Services
Population
Families and Households
Female Fertility
Female Fertility (Unmarried)
Race (Community Size)
Race (Percentage)
Ancestry (Community Size)
AfricanAlbanianAmericanApacheArabAustralianAustrianBangladeshiBelgianBhutaneseBlackfeetBritishBulgarianBurmeseCanadianCelticCentral AmericanCherokeeChippewaColombianCreeCroatianCubanCzechCzechoslovakianDanishDominicanDutchEastern EuropeanEcuadorianEnglishEthiopianEuropeanFinnishFrenchFrench American IndianFrench CanadianGermanGerman RussianGreekGuatemalanHaitianHungarianIcelanderIndian (Asian)IranianIrishIroquoisItalianJamaicanJordanianKoreanLatvianLebaneseLiberianLithuanianLuxembourgerMexicanMexican American IndianNative HawaiianNigerianNorthern EuropeanNorwegianOttawaPakistaniPalestinianPanamanianPennsylvania GermanPolishPortuguesePuerto RicanRomanianRussianSalvadoranSamoanScandinavianScotch-IrishScottishSerbianSiouxSlavicSlovakSloveneSomaliSouth AmericanSpaniardSpanishSri LankanSubsaharan AfricanSwedishSwissSyrianThaiTrinidadian and TobagonianTurkishUkrainianVenezuelanWelshYugoslavian
Ancestry (Percentage)
AfricanAlbanianAmericanApacheArabAustralianAustrianBangladeshiBelgianBhutaneseBlackfeetBritishBulgarianBurmeseCanadianCelticCentral AmericanCherokeeChippewaColombianCreeCroatianCubanCzechCzechoslovakianDanishDominicanDutchEastern EuropeanEcuadorianEnglishEthiopianEuropeanFinnishFrenchFrench American IndianFrench CanadianGermanGerman RussianGreekGuatemalanHaitianHungarianIcelanderIndian (Asian)IranianIrishIroquoisItalianJamaicanJordanianKoreanLatvianLebaneseLiberianLithuanianLuxembourgerMexicanMexican American IndianNative HawaiianNigerianNorthern EuropeanNorwegianOttawaPakistaniPalestinianPanamanianPennsylvania GermanPolishPortuguesePuerto RicanRomanianRussianSalvadoranSamoanScandinavianScotch-IrishScottishSerbianSiouxSlavicSlovakSloveneSomaliSouth AmericanSpaniardSpanishSri LankanSubsaharan AfricanSwedishSwissSyrianThaiTrinidadian and TobagonianTurkishUkrainianVenezuelanWelshYugoslavian
Immigrant Origin (Total)
Immigrant Origin (Percentage)
Income
Income (Families)
Income (Households)
Poverty
Poverty (Families)
Unemployment
Employment Occupations
Employment Industries
Employer Class
Commute Time
Commute Means
School Enrollment
Education by Degree Field
Occupancy
Finances
Physical Characteristics
Duluth
Compare Zip Codes
Comparison Subject

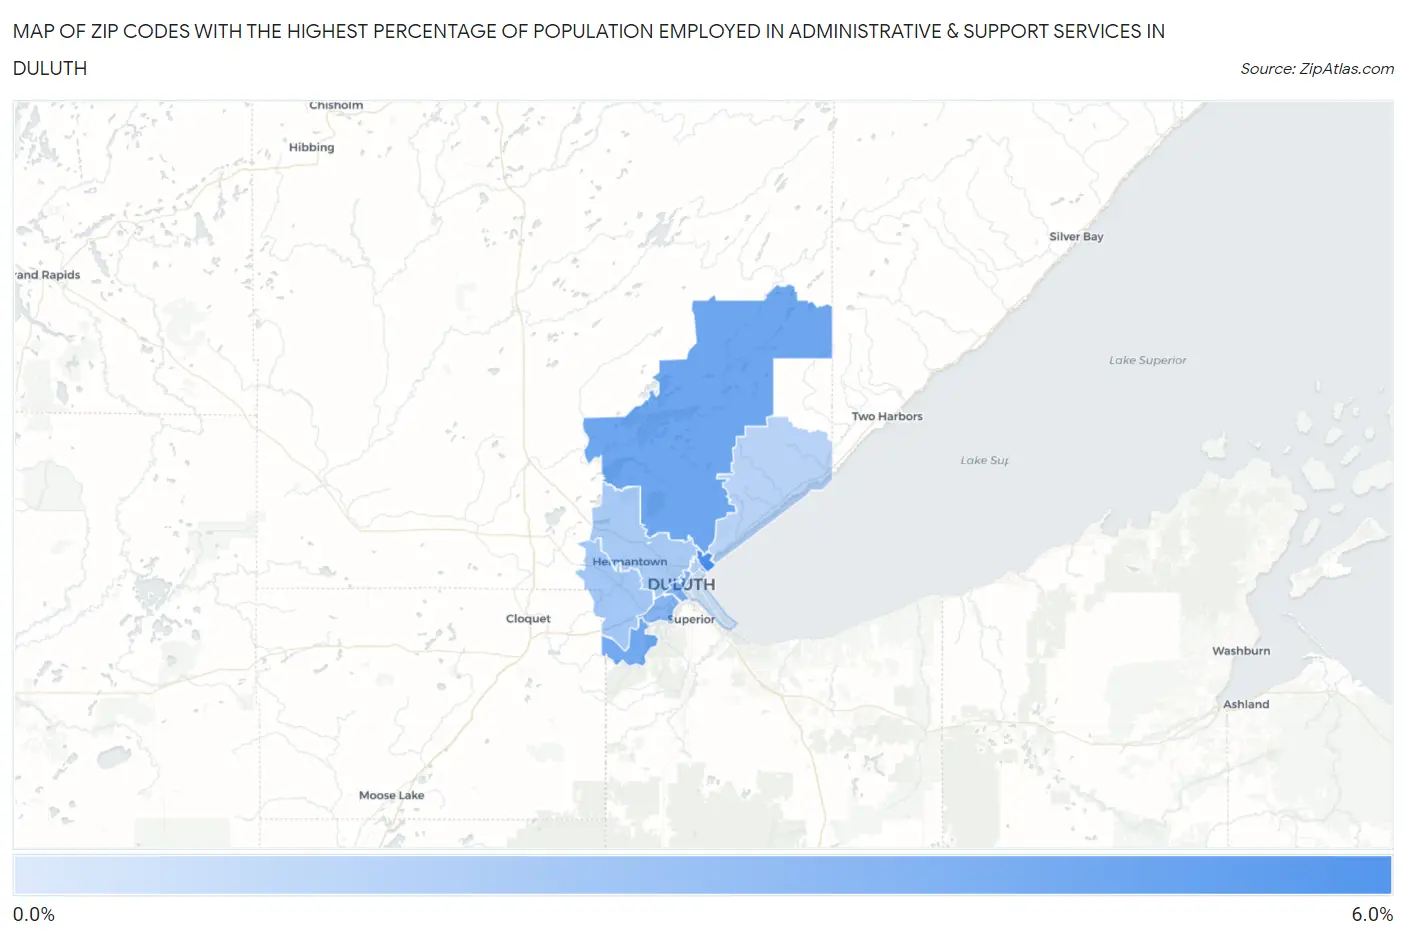
Map of Zip Codes with the Highest Percentage of Population Employed in Administrative & Support Services in Duluth

0.0%
6.0%
Zip Codes with the Highest Percentage of Population Employed in Administrative & Support Services in Duluth Map

Zip Codes with the Highest Percentage of Population Employed in Administrative & Support Services in Duluth, MN

Zip Code % Employed vs State vs National
1.558125.4%3.0%(+2.33)#584.1%(+1.22)#6,140
2.558034.1%3.0%(+1.07)#1334.1%(-0.035)#10,180
3.558083.9%3.0%(+0.860)#1524.1%(-0.247)#11,099
4.558063.4%3.0%(+0.368)#2164.1%(-0.739)#13,383
5.558073.3%3.0%(+0.254)#2374.1%(-0.853)#13,951
6.558102.3%3.0%(-0.699)#4264.1%(-1.81)#18,963
7.558112.2%3.0%(-0.809)#4494.1%(-1.92)#19,494
8.558051.9%3.0%(-1.14)#5314.1%(-2.25)#21,075
9.558041.7%3.0%(-1.31)#5674.1%(-2.42)#21,822
10.558020.53%3.0%(-2.51)#7604.1%(-3.62)#25,793

Common Questions

What are the Top 5 Zip Codes with the Highest Percentage of Population Employed in Administrative & Support Services in Duluth, MN?
Top 5 Zip Codes with the Highest Percentage of Population Employed in Administrative & Support Services in Duluth, MN are:
#1
5.4%
#2
4.1%
#3
3.9%
#4
3.4%
#5
3.3%
What zip code has the Highest Percentage of Population Employed in Administrative & Support Services in Duluth, MN?
55812 has the Highest Percentage of Population Employed in Administrative & Support Services in Duluth, MN with 5.4%.
What is the Percentage of Population Employed in Administrative & Support Services in Duluth, MN?
Percentage of Population Employed in Administrative & Support Services in Duluth is 2.9%.
What is the Percentage of Population Employed in Administrative & Support Services in Minnesota?
Percentage of Population Employed in Administrative & Support Services in Minnesota is 3.0%.
What is the Percentage of Population Employed in Administrative & Support Services in the United States?
Percentage of Population Employed in Administrative & Support Services in the United States is 4.1%.