Zip Codes with the Highest Percentage of Renter-Occupied Units in New Haven, MI
RELATED REPORTS & OPTIONS
Highest Renter-Occupied
New Haven
Compare Zip Codes
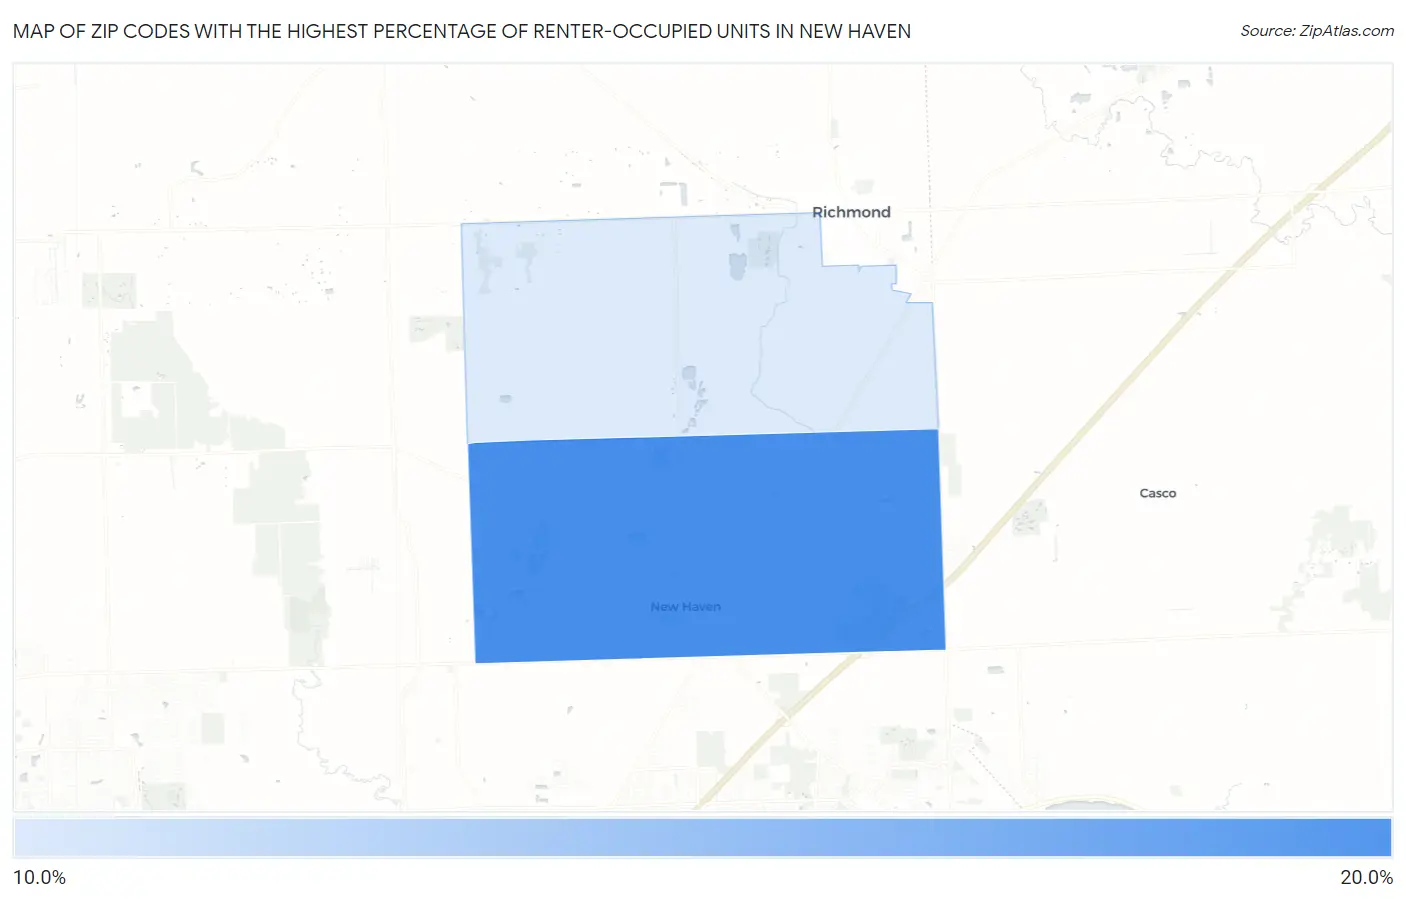
Map of Zip Codes with the Highest Percentage of Renter-Occupied Units in New Haven
0.0%
20.0%
Zip Codes with the Highest Percentage of Renter-Occupied Units in New Haven, MI
| Zip Code | % Renter-Occupied | vs State | vs National | |
| 1. | 48048 | 19.6% | 27.5%(-7.91)#353 | 35.2%(-15.6)#18,592 |
| 2. | 48050 | 13.0% | 27.5%(-14.5)#605 | 35.2%(-22.2)#24,958 |
1
Common Questions
What are the Top Zip Codes with the Highest Percentage of Renter-Occupied Units in New Haven, MI?
Top Zip Codes with the Highest Percentage of Renter-Occupied Units in New Haven, MI are:
What zip code has the Highest Percentage of Renter-Occupied Units in New Haven, MI?
48048 has the Highest Percentage of Renter-Occupied Units in New Haven, MI with 19.6%.
What is the Percentage of Renter-Occupied Units in New Haven, MI?
Percentage of Renter-Occupied Units in New Haven is 24.7%.
What is the Percentage of Renter-Occupied Units in Michigan?
Percentage of Renter-Occupied Units in Michigan is 27.5%.
What is the Percentage of Renter-Occupied Units in the United States?
Percentage of Renter-Occupied Units in the United States is 35.2%.