Zip Codes with the Highest Percentage of Renter-Occupied Units in Burton, MI
RELATED REPORTS & OPTIONS
Highest Renter-Occupied
Burton
Compare Zip Codes
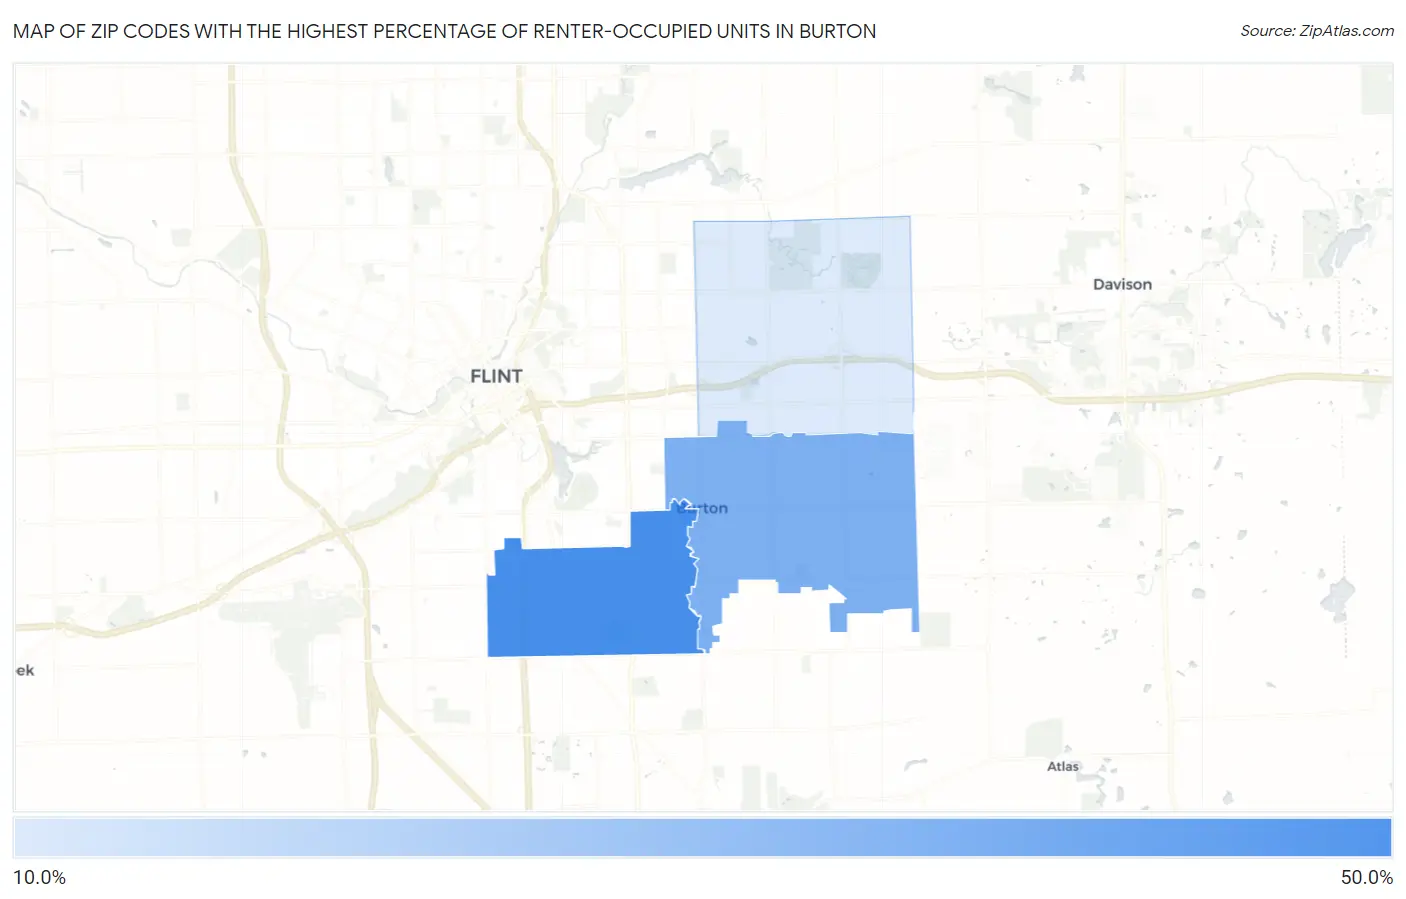
Map of Zip Codes with the Highest Percentage of Renter-Occupied Units in Burton
0.0%
50.0%
Zip Codes with the Highest Percentage of Renter-Occupied Units in Burton, MI
| Zip Code | % Renter-Occupied | vs State | vs National | |
| 1. | 48529 | 42.1% | 27.5%(+14.5)#79 | 35.2%(+6.87)#4,823 |
| 2. | 48519 | 31.3% | 27.5%(+3.79)#157 | 35.2%(-3.89)#9,264 |
| 3. | 48509 | 14.2% | 27.5%(-13.3)#545 | 35.2%(-21.0)#23,887 |
1
Common Questions
What are the Top Zip Codes with the Highest Percentage of Renter-Occupied Units in Burton, MI?
Top Zip Codes with the Highest Percentage of Renter-Occupied Units in Burton, MI are:
What zip code has the Highest Percentage of Renter-Occupied Units in Burton, MI?
48529 has the Highest Percentage of Renter-Occupied Units in Burton, MI with 42.1%.
What is the Percentage of Renter-Occupied Units in Burton, MI?
Percentage of Renter-Occupied Units in Burton is 26.0%.
What is the Percentage of Renter-Occupied Units in Michigan?
Percentage of Renter-Occupied Units in Michigan is 27.5%.
What is the Percentage of Renter-Occupied Units in the United States?
Percentage of Renter-Occupied Units in the United States is 35.2%.