Freeport, ME Map & Demographics
Freeport Map
Freeport Overview
$35,128
PER CAPITA INCOME
$91,642
AVG FAMILY INCOME
$76,012
AVG HOUSEHOLD INCOME
33.4%
WAGE / INCOME GAP [ % ]
66.6¢/ $1
WAGE / INCOME GAP [ $ ]
0.41
INEQUALITY / GINI INDEX
1,848
TOTAL POPULATION
753
MALE POPULATION
1,095
FEMALE POPULATION
68.77
MALES / 100 FEMALES
145.42
FEMALES / 100 MALES
37.9
MEDIAN AGE
2.8
AVG FAMILY SIZE
2.2
AVG HOUSEHOLD SIZE
1,162
LABOR FORCE [ PEOPLE ]
76.3%
PERCENT IN LABOR FORCE
10.7%
UNEMPLOYMENT RATE
Freeport Zip Codes
Freeport Area Codes
Income in Freeport
Income Overview in Freeport
Per Capita Income in Freeport is $35,128, while median incomes of families and households are $91,642 and $76,012 respectively.
| Characteristic | Number | Measure |
| Per Capita Income | 1,848 | $35,128 |
| Median Family Income | 511 | $91,642 |
| Mean Family Income | 511 | $95,868 |
| Median Household Income | 831 | $76,012 |
| Mean Household Income | 831 | $76,583 |
| Income Deficit | 511 | $0 |
| Wage / Income Gap (%) | 1,848 | 33.39% |
| Wage / Income Gap ($) | 1,848 | 66.61¢ per $1 |
| Gini / Inequality Index | 1,848 | 0.41 |
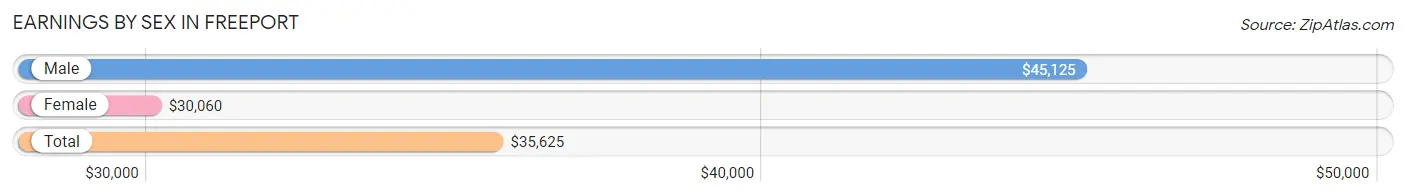
Earnings by Sex in Freeport
Average Earnings in Freeport are $35,625, $45,125 for men and $30,060 for women, a difference of 33.4%.
| Sex | Number | Average Earnings |
| Male | 602 (50.7%) | $45,125 |
| Female | 585 (49.3%) | $30,060 |
| Total | 1,187 (100.0%) | $35,625 |
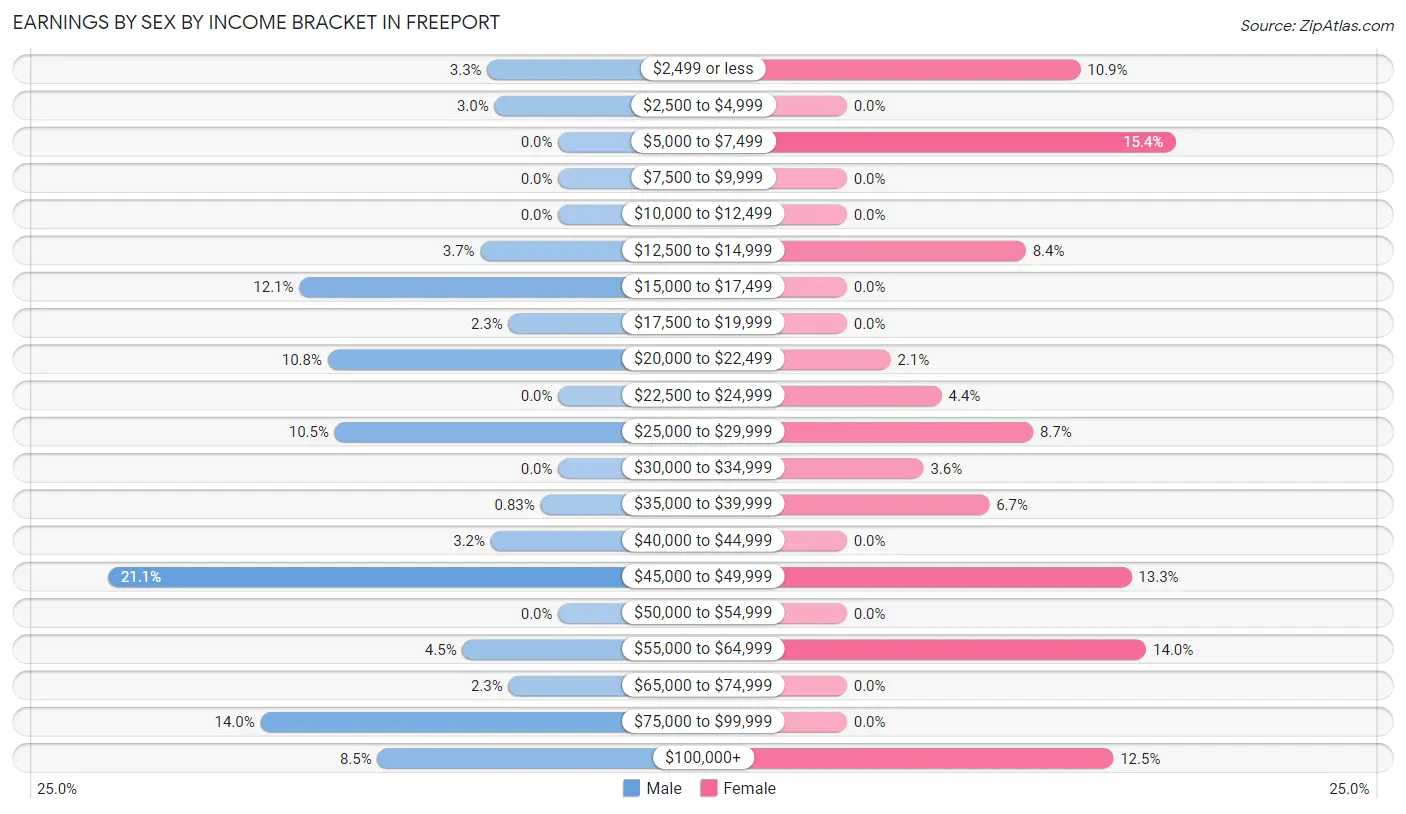
Earnings by Sex by Income Bracket in Freeport
The most common earnings brackets in Freeport are $45,000 to $49,999 for men (127 | 21.1%) and $5,000 to $7,499 for women (90 | 15.4%).
| Income | Male | Female |
| $2,499 or less | 20 (3.3%) | 64 (10.9%) |
| $2,500 to $4,999 | 18 (3.0%) | 0 (0.0%) |
| $5,000 to $7,499 | 0 (0.0%) | 90 (15.4%) |
| $7,500 to $9,999 | 0 (0.0%) | 0 (0.0%) |
| $10,000 to $12,499 | 0 (0.0%) | 0 (0.0%) |
| $12,500 to $14,999 | 22 (3.6%) | 49 (8.4%) |
| $15,000 to $17,499 | 73 (12.1%) | 0 (0.0%) |
| $17,500 to $19,999 | 14 (2.3%) | 0 (0.0%) |
| $20,000 to $22,499 | 65 (10.8%) | 12 (2.1%) |
| $22,500 to $24,999 | 0 (0.0%) | 26 (4.4%) |
| $25,000 to $29,999 | 63 (10.5%) | 51 (8.7%) |
| $30,000 to $34,999 | 0 (0.0%) | 21 (3.6%) |
| $35,000 to $39,999 | 5 (0.8%) | 39 (6.7%) |
| $40,000 to $44,999 | 19 (3.2%) | 0 (0.0%) |
| $45,000 to $49,999 | 127 (21.1%) | 78 (13.3%) |
| $50,000 to $54,999 | 0 (0.0%) | 0 (0.0%) |
| $55,000 to $64,999 | 27 (4.5%) | 82 (14.0%) |
| $65,000 to $74,999 | 14 (2.3%) | 0 (0.0%) |
| $75,000 to $99,999 | 84 (14.0%) | 0 (0.0%) |
| $100,000+ | 51 (8.5%) | 73 (12.5%) |
| Total | 602 (100.0%) | 585 (100.0%) |
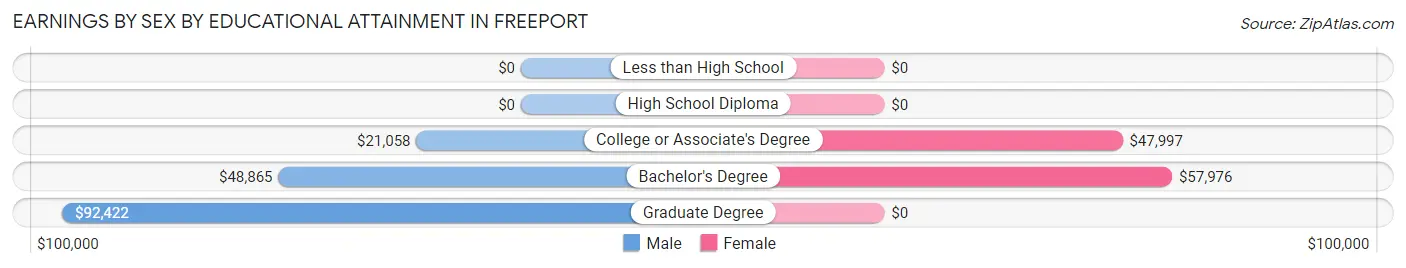
Earnings by Sex by Educational Attainment in Freeport
Average earnings in Freeport are $46,313 for men and $48,061 for women, a difference of 3.6%. Men with an educational attainment of graduate degree enjoy the highest average annual earnings of $92,422, while those with college or associate's degree education earn the least with $21,058. Women with an educational attainment of bachelor's degree earn the most with the average annual earnings of $57,976, while those with college or associate's degree education have the smallest earnings of $47,997.
| Educational Attainment | Male Income | Female Income |
| Less than High School | - | - |
| High School Diploma | - | - |
| College or Associate's Degree | $21,058 | $47,997 |
| Bachelor's Degree | $48,865 | $57,976 |
| Graduate Degree | $92,422 | $0 |
| Total | $46,313 | $48,061 |
Family Income in Freeport
Family Income Brackets in Freeport
According to the Freeport family income data, there are 206 families falling into the $75,000 to $99,999 income range, which is the most common income bracket and makes up 40.3% of all families.
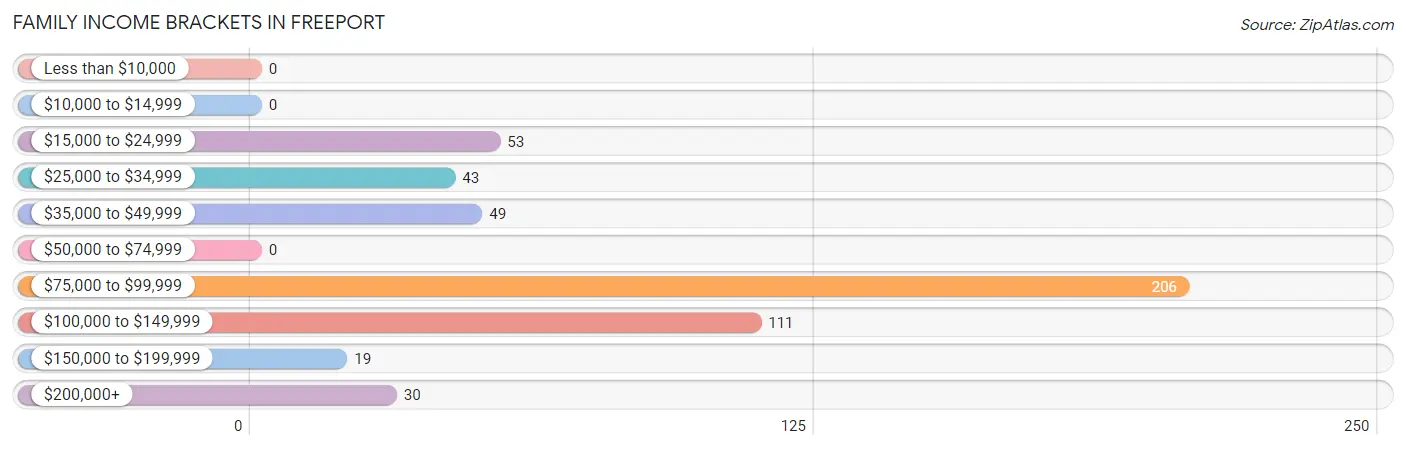
| Income Bracket | # Families | % Families |
| Less than $10,000 | 0 | 0.0% |
| $10,000 to $14,999 | 0 | 0.0% |
| $15,000 to $24,999 | 53 | 10.4% |
| $25,000 to $34,999 | 43 | 8.4% |
| $35,000 to $49,999 | 49 | 9.6% |
| $50,000 to $74,999 | 0 | 0.0% |
| $75,000 to $99,999 | 206 | 40.3% |
| $100,000 to $149,999 | 111 | 21.7% |
| $150,000 to $199,999 | 19 | 3.7% |
| $200,000+ | 30 | 5.9% |
Family Income by Famaliy Size in Freeport
3-person families (54 | 10.6%) account for the highest median family income in Freeport with $138,553 per family, while 2-person families (295 | 57.7%) have the highest median income of $47,976 per family member.
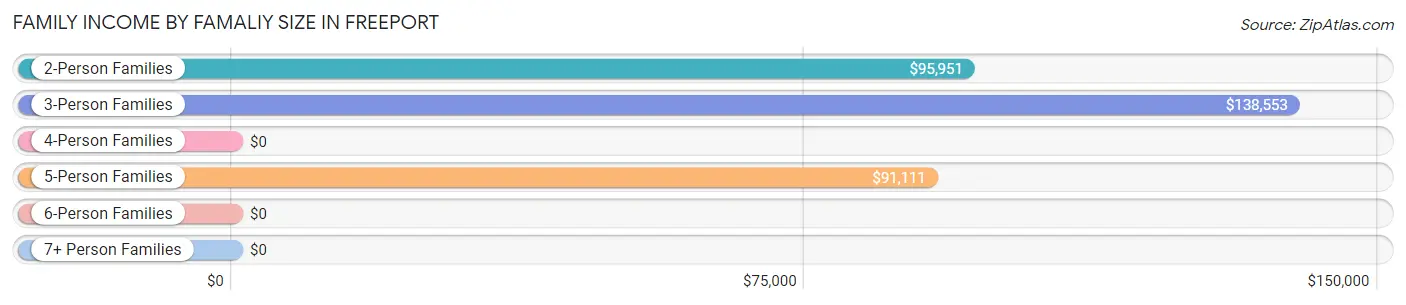
| Income Bracket | # Families | Median Income |
| 2-Person Families | 295 (57.7%) | $95,951 |
| 3-Person Families | 54 (10.6%) | $138,553 |
| 4-Person Families | 64 (12.5%) | $0 |
| 5-Person Families | 98 (19.2%) | $91,111 |
| 6-Person Families | 0 (0.0%) | $0 |
| 7+ Person Families | 0 (0.0%) | $0 |
| Total | 511 (100.0%) | $91,642 |
Family Income by Number of Earners in Freeport
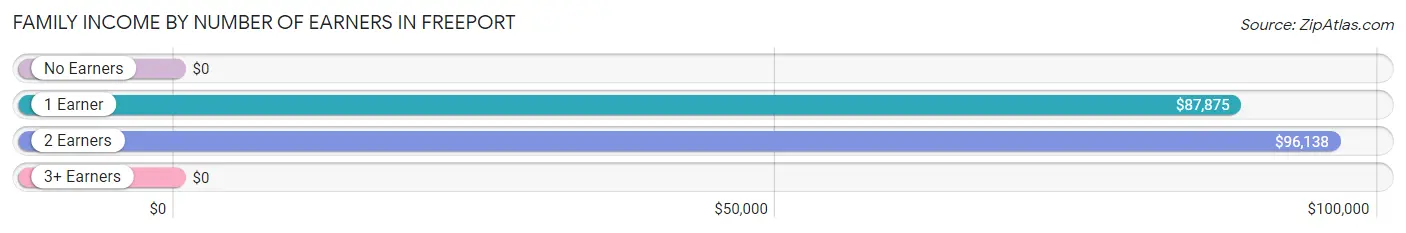
| Number of Earners | # Families | Median Income |
| No Earners | 43 (8.4%) | $0 |
| 1 Earner | 45 (8.8%) | $87,875 |
| 2 Earners | 355 (69.5%) | $96,138 |
| 3+ Earners | 68 (13.3%) | $0 |
| Total | 511 (100.0%) | $91,642 |
Household Income in Freeport
Household Income Brackets in Freeport
With 204 households falling in the category, the $75,000 to $99,999 income range is the most frequent in Freeport, accounting for 24.5% of all households. In contrast, only 17 households (2.1%) fall into the less than $10,000 income bracket, making it the least populous group.
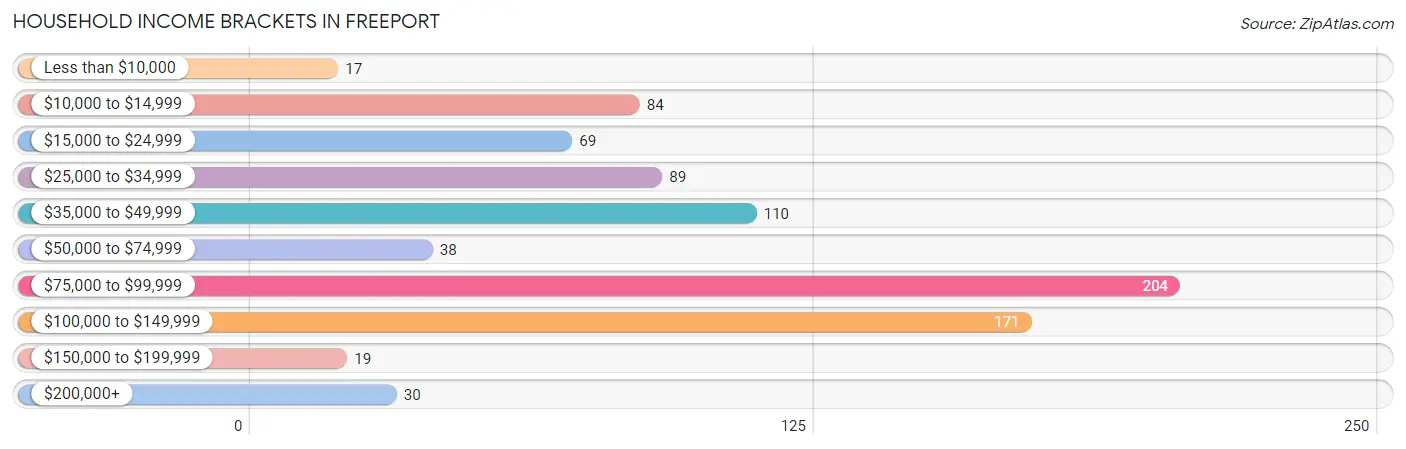
| Income Bracket | # Households | % Households |
| Less than $10,000 | 17 | 2.0% |
| $10,000 to $14,999 | 84 | 10.1% |
| $15,000 to $24,999 | 69 | 8.3% |
| $25,000 to $34,999 | 89 | 10.7% |
| $35,000 to $49,999 | 110 | 13.2% |
| $50,000 to $74,999 | 38 | 4.6% |
| $75,000 to $99,999 | 204 | 24.5% |
| $100,000 to $149,999 | 171 | 20.6% |
| $150,000 to $199,999 | 19 | 2.3% |
| $200,000+ | 30 | 3.6% |
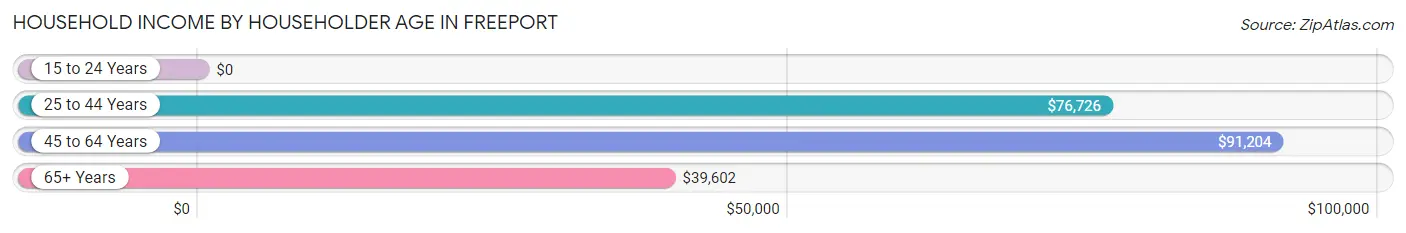
Household Income by Householder Age in Freeport
The median household income in Freeport is $76,012, with the highest median household income of $91,204 found in the 45 to 64 years age bracket for the primary householder. A total of 370 households (44.5%) fall into this category.
| Income Bracket | # Households | Median Income |
| 15 to 24 Years | 0 (0.0%) | $0 |
| 25 to 44 Years | 287 (34.5%) | $76,726 |
| 45 to 64 Years | 370 (44.5%) | $91,204 |
| 65+ Years | 174 (20.9%) | $39,602 |
| Total | 831 (100.0%) | $76,012 |
Poverty in Freeport
Income Below Poverty by Sex and Age in Freeport
With 15.0% poverty level for males and 19.2% for females among the residents of Freeport, 18 to 24 year old males and 5 year old females are the most vulnerable to poverty, with 20 males (52.6%) and 31 females (72.1%) in their respective age groups living below the poverty level.
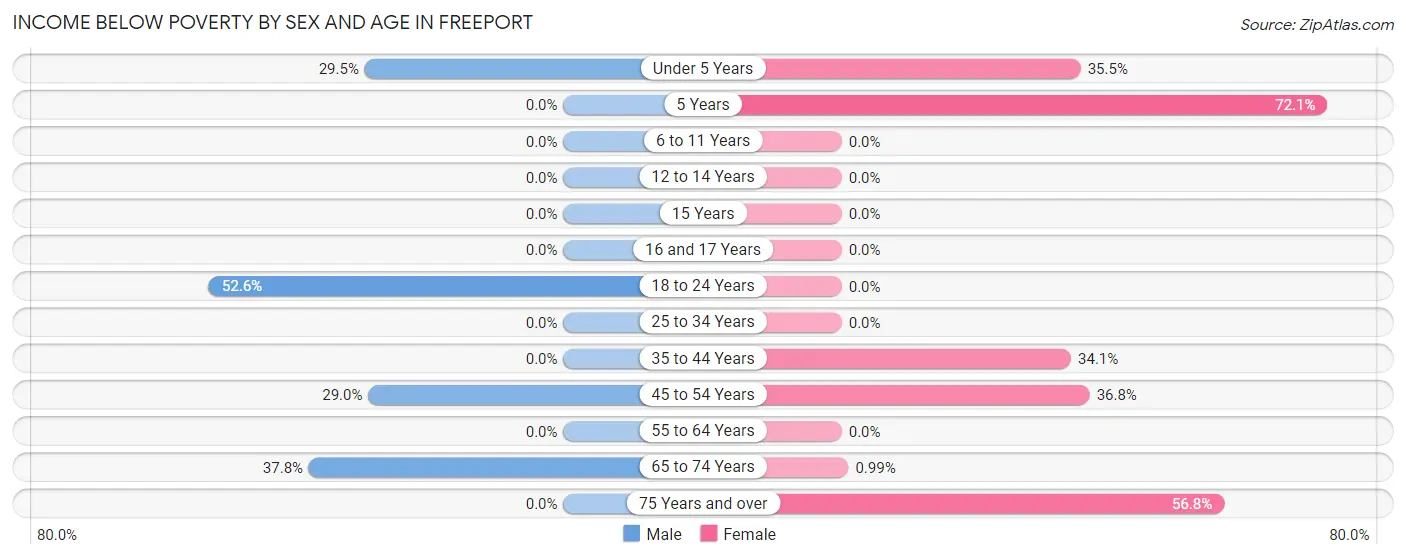
| Age Bracket | Male | Female |
| Under 5 Years | 23 (29.5%) | 22 (35.5%) |
| 5 Years | 0 (0.0%) | 31 (72.1%) |
| 6 to 11 Years | 0 (0.0%) | 0 (0.0%) |
| 12 to 14 Years | 0 (0.0%) | 0 (0.0%) |
| 15 Years | 0 (0.0%) | 0 (0.0%) |
| 16 and 17 Years | 0 (0.0%) | 0 (0.0%) |
| 18 to 24 Years | 20 (52.6%) | 0 (0.0%) |
| 25 to 34 Years | 0 (0.0%) | 0 (0.0%) |
| 35 to 44 Years | 0 (0.0%) | 63 (34.1%) |
| 45 to 54 Years | 53 (29.0%) | 67 (36.8%) |
| 55 to 64 Years | 0 (0.0%) | 0 (0.0%) |
| 65 to 74 Years | 17 (37.8%) | 1 (1.0%) |
| 75 Years and over | 0 (0.0%) | 21 (56.8%) |
| Total | 113 (15.0%) | 205 (19.2%) |
Income Above Poverty by Sex and Age in Freeport
According to the poverty statistics in Freeport, males aged 6 to 11 years and females aged 6 to 11 years are the age groups that are most secure financially, with 100.0% of males and 100.0% of females in these age groups living above the poverty line.
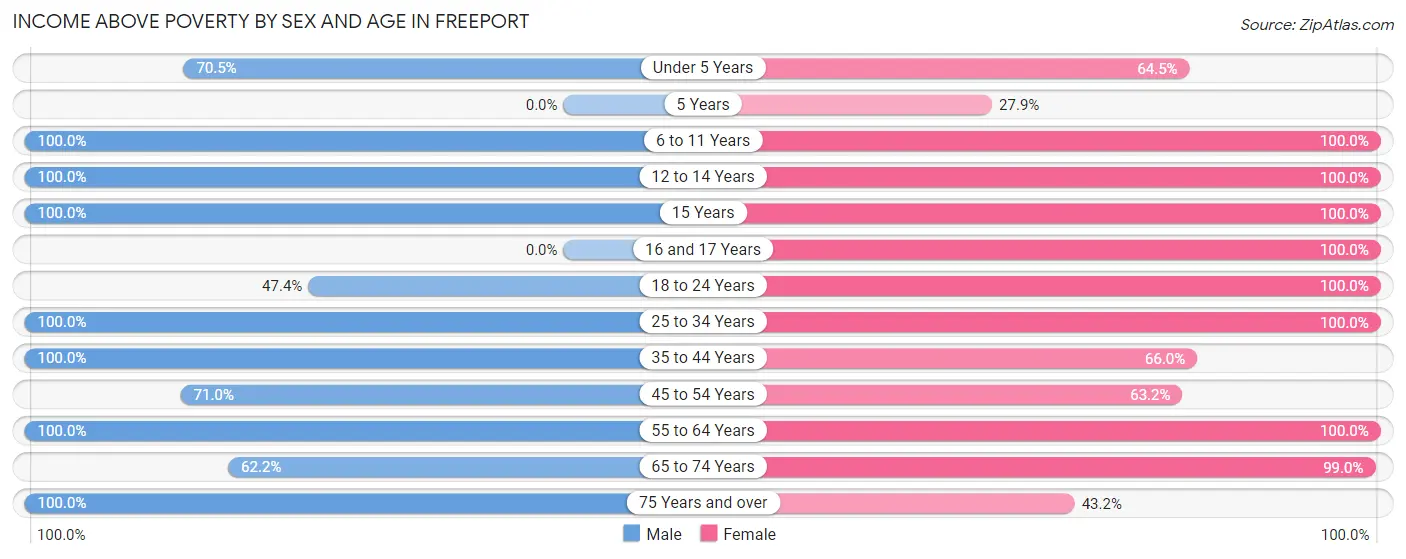
| Age Bracket | Male | Female |
| Under 5 Years | 55 (70.5%) | 40 (64.5%) |
| 5 Years | 0 (0.0%) | 12 (27.9%) |
| 6 to 11 Years | 13 (100.0%) | 80 (100.0%) |
| 12 to 14 Years | 13 (100.0%) | 8 (100.0%) |
| 15 Years | 14 (100.0%) | 14 (100.0%) |
| 16 and 17 Years | 0 (0.0%) | 64 (100.0%) |
| 18 to 24 Years | 18 (47.4%) | 90 (100.0%) |
| 25 to 34 Years | 169 (100.0%) | 83 (100.0%) |
| 35 to 44 Years | 63 (100.0%) | 122 (65.9%) |
| 45 to 54 Years | 130 (71.0%) | 115 (63.2%) |
| 55 to 64 Years | 122 (100.0%) | 117 (100.0%) |
| 65 to 74 Years | 28 (62.2%) | 100 (99.0%) |
| 75 Years and over | 15 (100.0%) | 16 (43.2%) |
| Total | 640 (85.0%) | 861 (80.8%) |
Income Below Poverty Among Married-Couple Families in Freeport
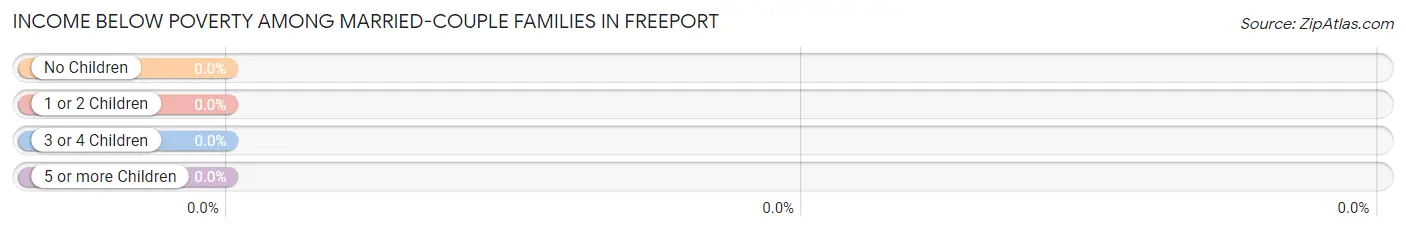
| Children | Above Poverty | Below Poverty |
| No Children | 242 (100.0%) | 0 (0.0%) |
| 1 or 2 Children | 119 (100.0%) | 0 (0.0%) |
| 3 or 4 Children | 35 (100.0%) | 0 (0.0%) |
| 5 or more Children | 0 (0.0%) | 0 (0.0%) |
| Total | 396 (100.0%) | 0 (0.0%) |
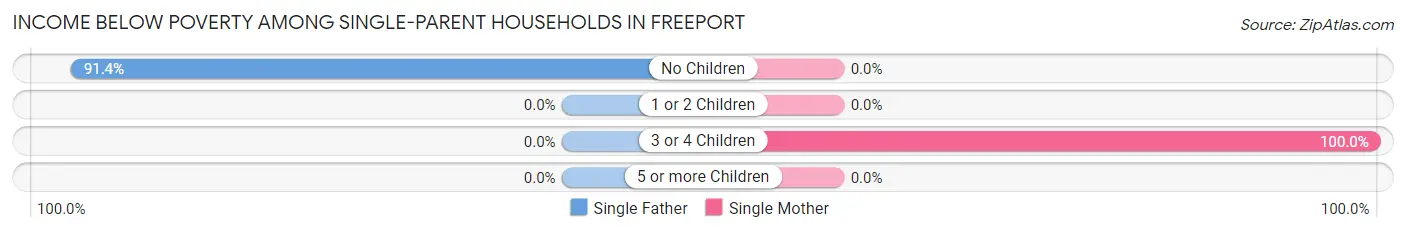
Income Below Poverty Among Single-Parent Households in Freeport
According to the poverty data in Freeport, 73.6% or 53 single-father households and 100.0% or 43 single-mother households are living below the poverty line. Among single-father households, those with no children have the highest poverty rate, with 53 households (91.4%) experiencing poverty. Likewise, among single-mother households, those with 3 or 4 children have the highest poverty rate, with 43 households (100.0%) falling below the poverty line.
| Children | Single Father | Single Mother |
| No Children | 53 (91.4%) | 0 (0.0%) |
| 1 or 2 Children | 0 (0.0%) | 0 (0.0%) |
| 3 or 4 Children | 0 (0.0%) | 43 (100.0%) |
| 5 or more Children | 0 (0.0%) | 0 (0.0%) |
| Total | 53 (73.6%) | 43 (100.0%) |
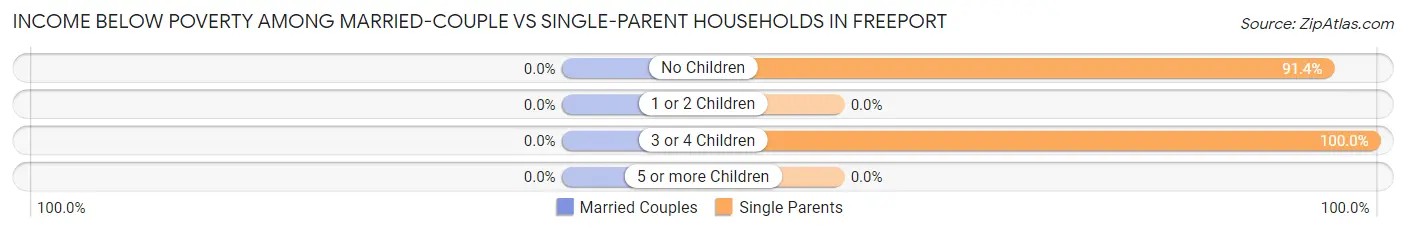
Income Below Poverty Among Married-Couple vs Single-Parent Households in Freeport
| Children | Married-Couple Families | Single-Parent Households |
| No Children | 0 (0.0%) | 53 (91.4%) |
| 1 or 2 Children | 0 (0.0%) | 0 (0.0%) |
| 3 or 4 Children | 0 (0.0%) | 43 (100.0%) |
| 5 or more Children | 0 (0.0%) | 0 (0.0%) |
| Total | 0 (0.0%) | 96 (83.5%) |
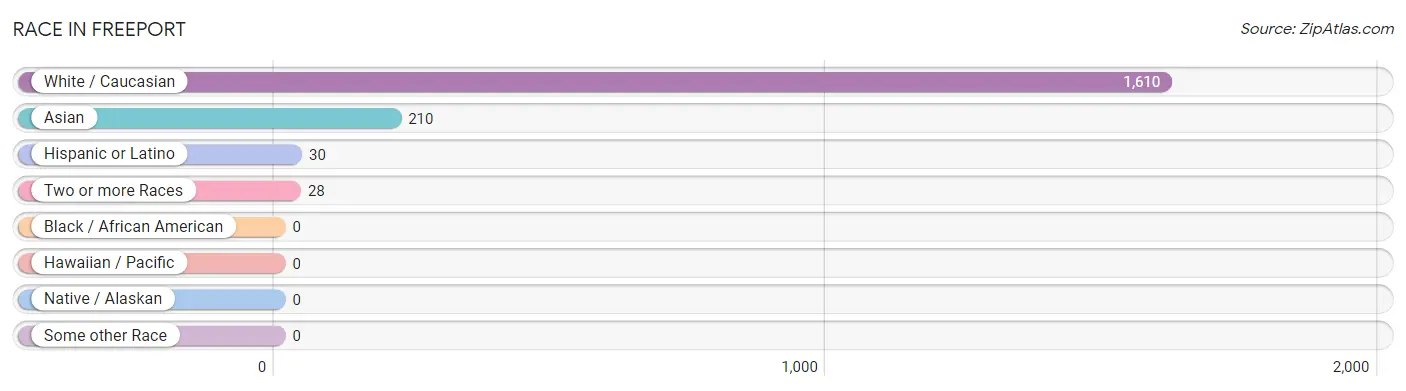
Race in Freeport
The most populous races in Freeport are White / Caucasian (1,610 | 87.1%), Asian (210 | 11.4%), and Hispanic or Latino (30 | 1.6%).
| Race | # Population | % Population |
| Asian | 210 | 11.4% |
| Black / African American | 0 | 0.0% |
| Hawaiian / Pacific | 0 | 0.0% |
| Hispanic or Latino | 30 | 1.6% |
| Native / Alaskan | 0 | 0.0% |
| White / Caucasian | 1,610 | 87.1% |
| Two or more Races | 28 | 1.5% |
| Some other Race | 0 | 0.0% |
| Total | 1,848 | 100.0% |
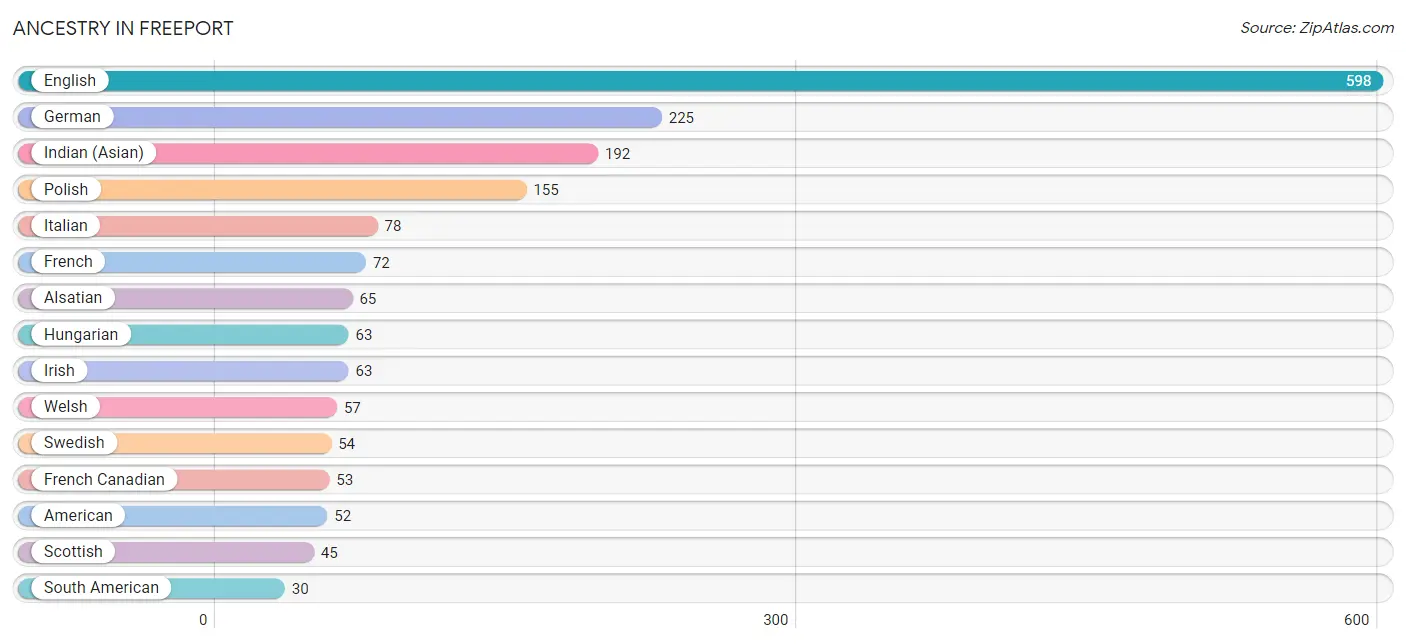
Ancestry in Freeport
The most populous ancestries reported in Freeport are English (598 | 32.4%), German (225 | 12.2%), Indian (Asian) (192 | 10.4%), Polish (155 | 8.4%), and Italian (78 | 4.2%), together accounting for 67.5% of all Freeport residents.
| Ancestry | # Population | % Population |
| Alsatian | 65 | 3.5% |
| American | 52 | 2.8% |
| Argentinean | 27 | 1.5% |
| Armenian | 12 | 0.6% |
| Bhutanese | 18 | 1.0% |
| British | 18 | 1.0% |
| Canadian | 16 | 0.9% |
| Dutch | 26 | 1.4% |
| Ecuadorian | 3 | 0.2% |
| English | 598 | 32.4% |
| Finnish | 17 | 0.9% |
| French | 72 | 3.9% |
| French Canadian | 53 | 2.9% |
| German | 225 | 12.2% |
| Hungarian | 63 | 3.4% |
| Indian (Asian) | 192 | 10.4% |
| Irish | 63 | 3.4% |
| Italian | 78 | 4.2% |
| Polish | 155 | 8.4% |
| Scottish | 45 | 2.4% |
| Slavic | 5 | 0.3% |
| South American | 30 | 1.6% |
| Swedish | 54 | 2.9% |
| Welsh | 57 | 3.1% | View All 24 Rows |
Immigrants in Freeport
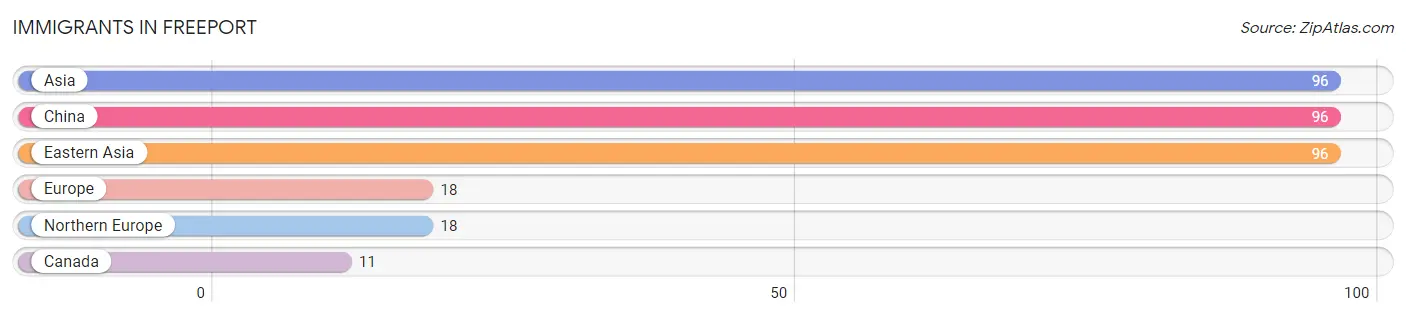
The most numerous immigrant groups reported in Freeport came from Asia (96 | 5.2%), China (96 | 5.2%), Eastern Asia (96 | 5.2%), Europe (18 | 1.0%), and Northern Europe (18 | 1.0%), together accounting for 17.5% of all Freeport residents.
| Immigration Origin | # Population | % Population |
| Asia | 96 | 5.2% |
| Canada | 11 | 0.6% |
| China | 96 | 5.2% |
| Eastern Asia | 96 | 5.2% |
| Europe | 18 | 1.0% |
| Northern Europe | 18 | 1.0% | View All 6 Rows |
Sex and Age in Freeport
Sex and Age in Freeport
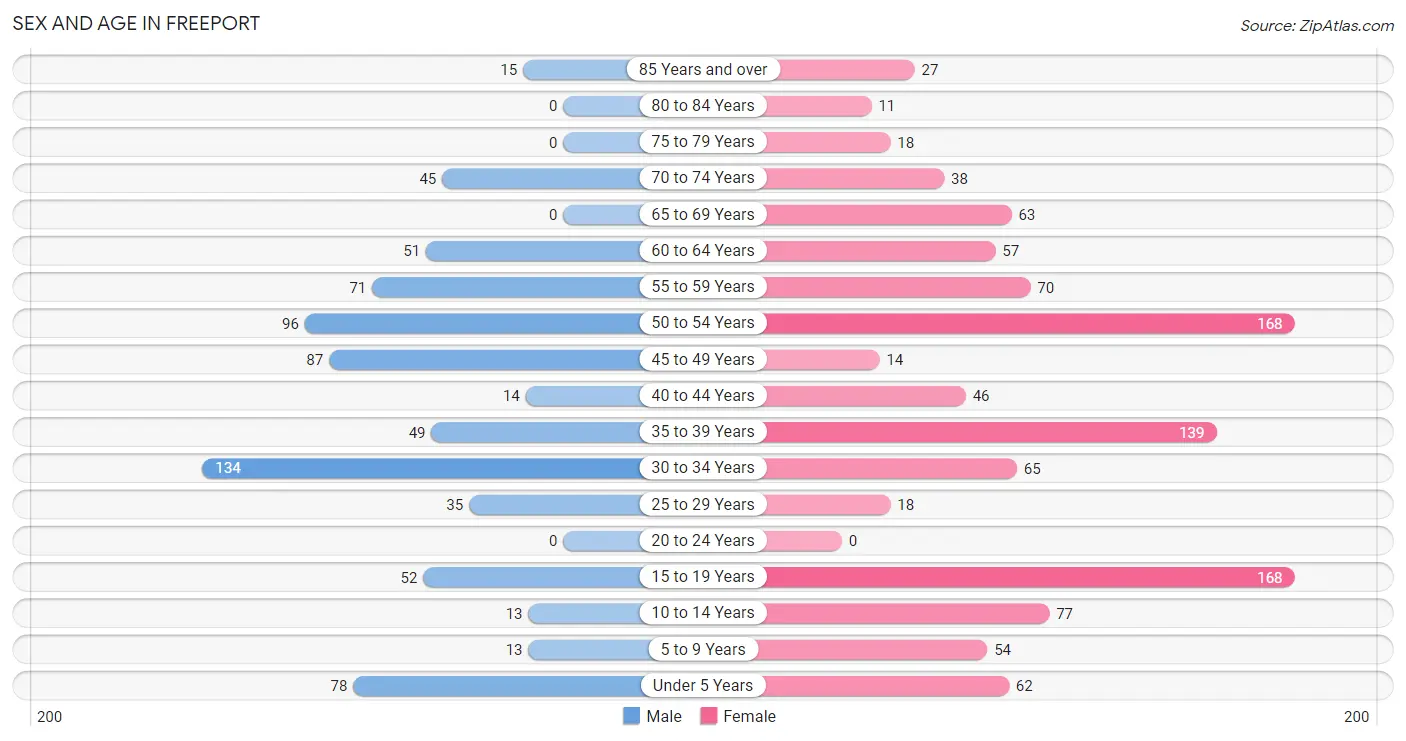
The most populous age groups in Freeport are 30 to 34 Years (134 | 17.8%) for men and 15 to 19 Years (168 | 15.3%) for women.
| Age Bracket | Male | Female |
| Under 5 Years | 78 (10.4%) | 62 (5.7%) |
| 5 to 9 Years | 13 (1.7%) | 54 (4.9%) |
| 10 to 14 Years | 13 (1.7%) | 77 (7.0%) |
| 15 to 19 Years | 52 (6.9%) | 168 (15.3%) |
| 20 to 24 Years | 0 (0.0%) | 0 (0.0%) |
| 25 to 29 Years | 35 (4.6%) | 18 (1.6%) |
| 30 to 34 Years | 134 (17.8%) | 65 (5.9%) |
| 35 to 39 Years | 49 (6.5%) | 139 (12.7%) |
| 40 to 44 Years | 14 (1.9%) | 46 (4.2%) |
| 45 to 49 Years | 87 (11.6%) | 14 (1.3%) |
| 50 to 54 Years | 96 (12.8%) | 168 (15.3%) |
| 55 to 59 Years | 71 (9.4%) | 70 (6.4%) |
| 60 to 64 Years | 51 (6.8%) | 57 (5.2%) |
| 65 to 69 Years | 0 (0.0%) | 63 (5.8%) |
| 70 to 74 Years | 45 (6.0%) | 38 (3.5%) |
| 75 to 79 Years | 0 (0.0%) | 18 (1.6%) |
| 80 to 84 Years | 0 (0.0%) | 11 (1.0%) |
| 85 Years and over | 15 (2.0%) | 27 (2.5%) |
| Total | 753 (100.0%) | 1,095 (100.0%) |
Families and Households in Freeport
Median Family Size in Freeport
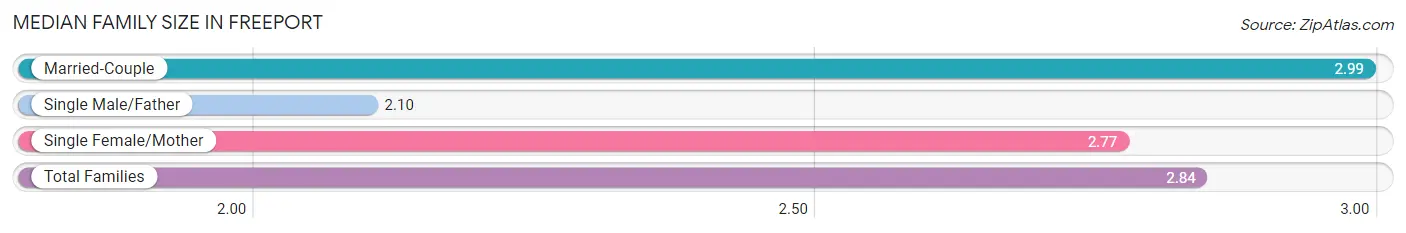
The median family size in Freeport is 2.84 persons per family, with married-couple families (396 | 77.5%) accounting for the largest median family size of 2.99 persons per family. On the other hand, single male/father families (72 | 14.1%) represent the smallest median family size with 2.10 persons per family.
| Family Type | # Families | Family Size |
| Married-Couple | 396 (77.5%) | 2.99 |
| Single Male/Father | 72 (14.1%) | 2.10 |
| Single Female/Mother | 43 (8.4%) | 2.77 |
| Total Families | 511 (100.0%) | 2.84 |
Median Household Size in Freeport
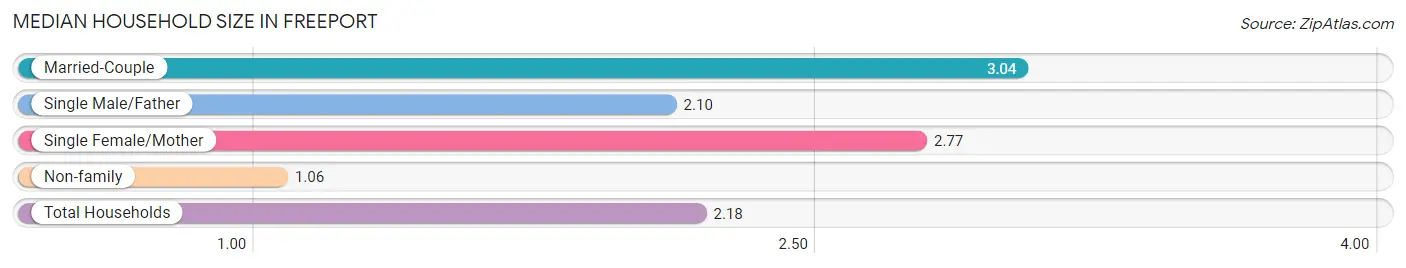
The median household size in Freeport is 2.18 persons per household, with married-couple households (396 | 47.6%) accounting for the largest median household size of 3.04 persons per household. non-family households (320 | 38.5%) represent the smallest median household size with 1.06 persons per household.
| Household Type | # Households | Household Size |
| Married-Couple | 396 (47.6%) | 3.04 |
| Single Male/Father | 72 (8.7%) | 2.10 |
| Single Female/Mother | 43 (5.2%) | 2.77 |
| Non-family | 320 (38.5%) | 1.06 |
| Total Households | 831 (100.0%) | 2.18 |
Household Size by Marriage Status in Freeport
Out of a total of 831 households in Freeport, 511 (61.5%) are family households, while 320 (38.5%) are nonfamily households. The most numerous type of family households are 2-person households, comprising 275, and the most common type of nonfamily households are 1-person households, comprising 300.
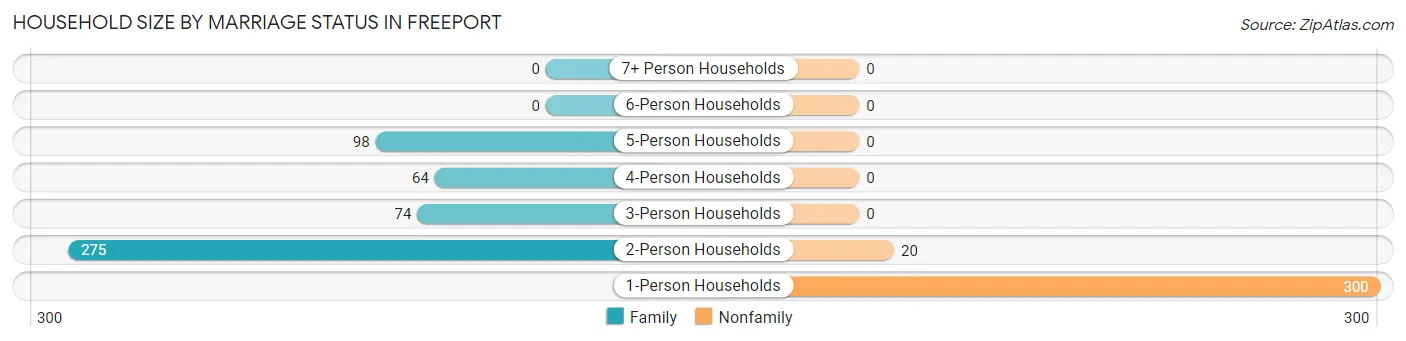
| Household Size | Family Households | Nonfamily Households |
| 1-Person Households | - | 300 (36.1%) |
| 2-Person Households | 275 (33.1%) | 20 (2.4%) |
| 3-Person Households | 74 (8.9%) | 0 (0.0%) |
| 4-Person Households | 64 (7.7%) | 0 (0.0%) |
| 5-Person Households | 98 (11.8%) | 0 (0.0%) |
| 6-Person Households | 0 (0.0%) | 0 (0.0%) |
| 7+ Person Households | 0 (0.0%) | 0 (0.0%) |
| Total | 511 (61.5%) | 320 (38.5%) |
Female Fertility in Freeport
Fertility by Age in Freeport
Average fertility rate in Freeport is 136.0 births per 1,000 women. Women in the age bracket of 20 to 34 years have the highest fertility rate with 217.0 births per 1,000 women. Women in the age bracket of 35 to 50 years acount for 70.5% of all women with births.
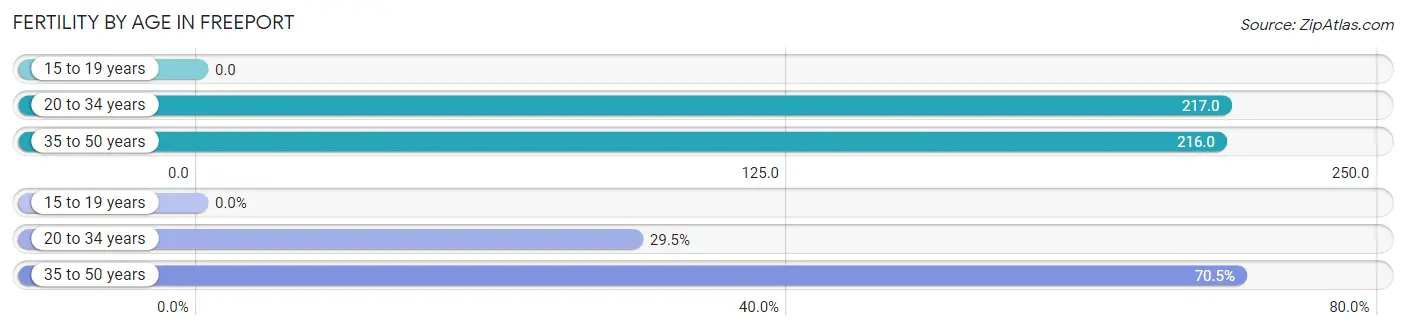
| Age Bracket | Women with Births | Births / 1,000 Women |
| 15 to 19 years | 0 (0.0%) | 0.0 |
| 20 to 34 years | 18 (29.5%) | 217.0 |
| 35 to 50 years | 43 (70.5%) | 216.0 |
| Total | 61 (100.0%) | 136.0 |
Fertility by Age by Marriage Status in Freeport
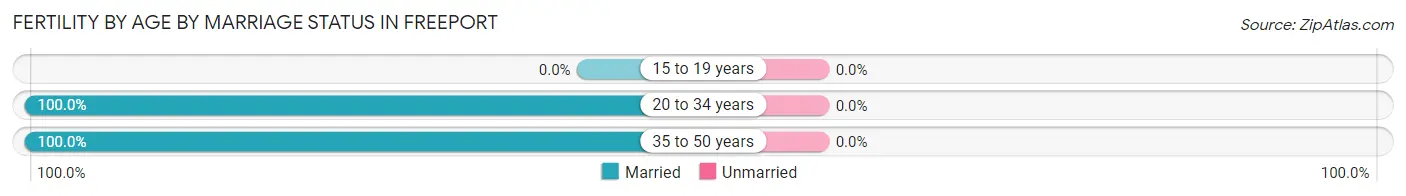
| Age Bracket | Married | Unmarried |
| 15 to 19 years | 0 (0.0%) | 0 (0.0%) |
| 20 to 34 years | 18 (100.0%) | 0 (0.0%) |
| 35 to 50 years | 43 (100.0%) | 0 (0.0%) |
| Total | 61 (100.0%) | 0 (0.0%) |
Fertility by Education in Freeport
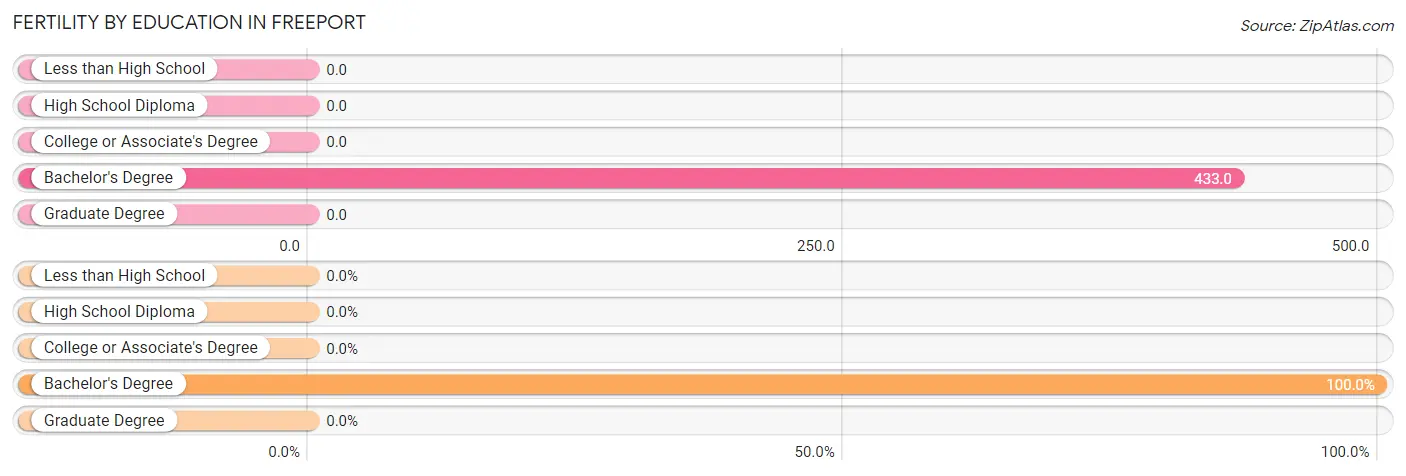
| Educational Attainment | Women with Births | Births / 1,000 Women |
| Less than High School | 0 (0.0%) | 0.0 |
| High School Diploma | 0 (0.0%) | 0.0 |
| College or Associate's Degree | 0 (0.0%) | 0.0 |
| Bachelor's Degree | 61 (100.0%) | 433.0 |
| Graduate Degree | 0 (0.0%) | 0.0 |
| Total | 61 (100.0%) | 136.0 |
Fertility by Education by Marriage Status in Freeport
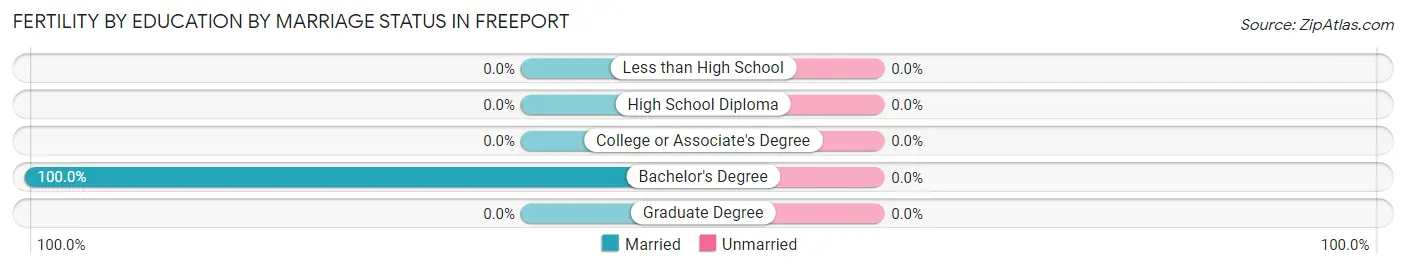
| Educational Attainment | Married | Unmarried |
| Less than High School | 0 (0.0%) | 0 (0.0%) |
| High School Diploma | 0 (0.0%) | 0 (0.0%) |
| College or Associate's Degree | 0 (0.0%) | 0 (0.0%) |
| Bachelor's Degree | 61 (100.0%) | 0 (0.0%) |
| Graduate Degree | 0 (0.0%) | 0 (0.0%) |
| Total | 61 (100.0%) | 0 (0.0%) |
Employment Characteristics in Freeport
Employment by Class of Employer in Freeport
Among the 1,038 employed individuals in Freeport, private company employees (625 | 60.2%), not-for-profit organizations (227 | 21.9%), and self-employed (not incorporated) (112 | 10.8%) make up the most common classes of employment.
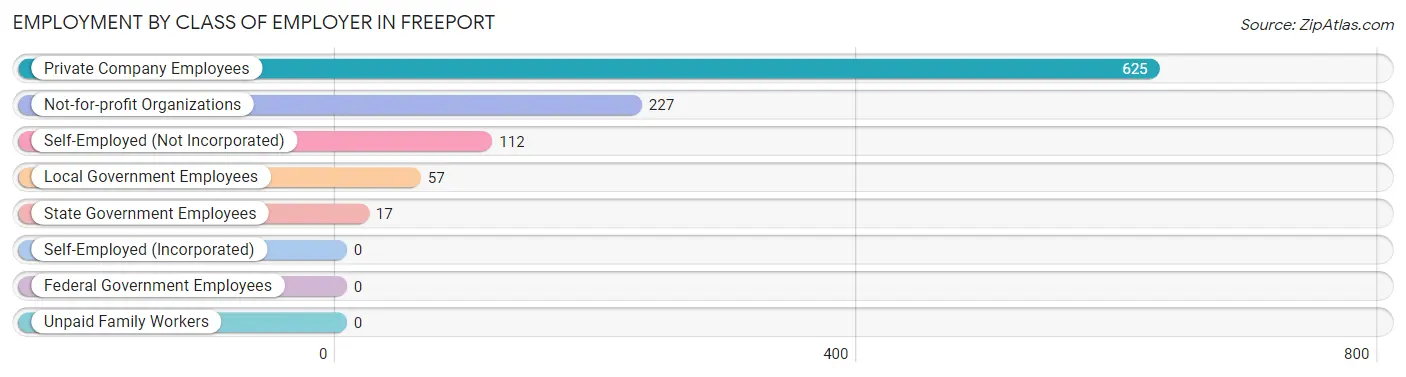
| Employer Class | # Employees | % Employees |
| Private Company Employees | 625 | 60.2% |
| Self-Employed (Incorporated) | 0 | 0.0% |
| Self-Employed (Not Incorporated) | 112 | 10.8% |
| Not-for-profit Organizations | 227 | 21.9% |
| Local Government Employees | 57 | 5.5% |
| State Government Employees | 17 | 1.6% |
| Federal Government Employees | 0 | 0.0% |
| Unpaid Family Workers | 0 | 0.0% |
| Total | 1,038 | 100.0% |
Employment Status by Age in Freeport
According to the labor force statistics for Freeport, out of the total population over 16 years of age (1,523), 76.3% or 1,162 individuals are in the labor force, with 10.7% or 124 of them unemployed. The age group with the highest labor force participation rate is 30 to 34 years, with 100.0% or 199 individuals in the labor force. Within the labor force, the 65 to 74 years age range has the highest percentage of unemployed individuals, with 44.9% or 22 of them being unemployed.
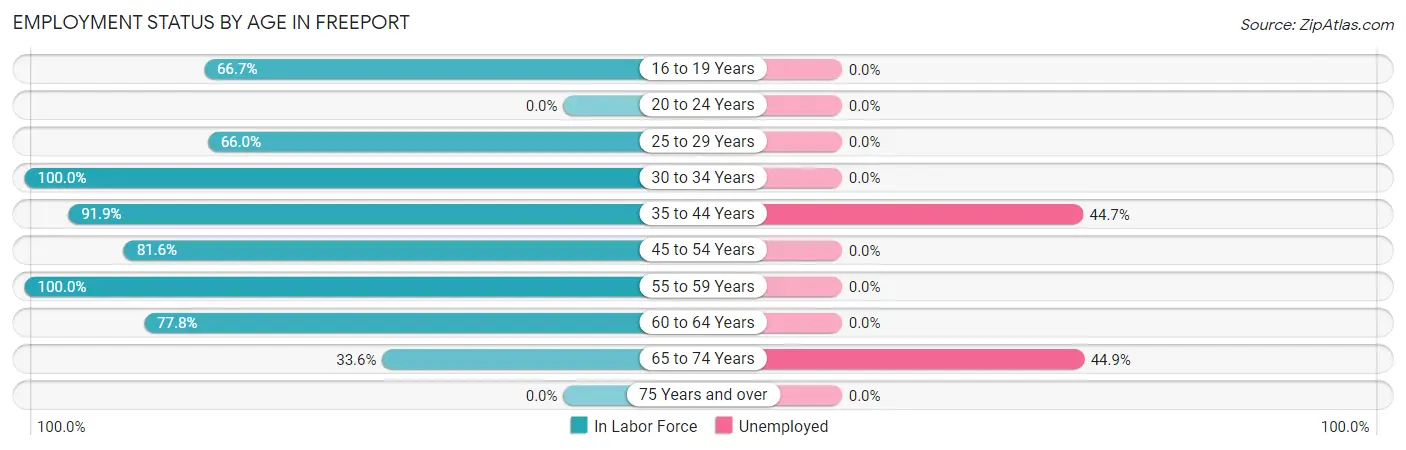
| Age Bracket | In Labor Force | Unemployed |
| 16 to 19 Years | 128 (66.7%) | 0 (0.0%) |
| 20 to 24 Years | 0 (0.0%) | 0 (0.0%) |
| 25 to 29 Years | 35 (66.0%) | 0 (0.0%) |
| 30 to 34 Years | 199 (100.0%) | 0 (0.0%) |
| 35 to 44 Years | 228 (91.9%) | 102 (44.7%) |
| 45 to 54 Years | 298 (81.6%) | 0 (0.0%) |
| 55 to 59 Years | 141 (100.0%) | 0 (0.0%) |
| 60 to 64 Years | 84 (77.8%) | 0 (0.0%) |
| 65 to 74 Years | 49 (33.6%) | 22 (44.9%) |
| 75 Years and over | 0 (0.0%) | 0 (0.0%) |
| Total | 1,162 (76.3%) | 124 (10.7%) |
Employment Status by Educational Attainment in Freeport
According to labor force statistics for Freeport, 88.4% of individuals (985) out of the total population between 25 and 64 years of age (1,114) are in the labor force, with 10.4% or 102 of them being unemployed. The group with the highest labor force participation rate are those with the educational attainment of less than high school, with 100.0% or 20 individuals in the labor force. Within the labor force, individuals with bachelor's degree or higher education have the highest percentage of unemployment, with 15.7% or 92 of them being unemployed.
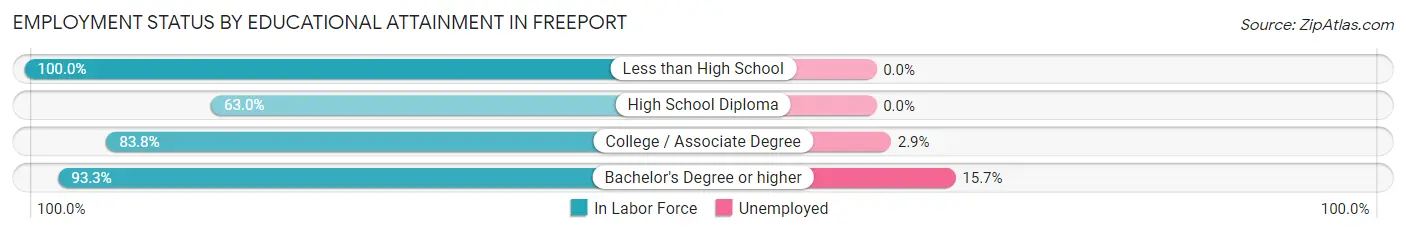
| Educational Attainment | In Labor Force | Unemployed |
| Less than High School | 20 (100.0%) | 0 (0.0%) |
| High School Diploma | 34 (63.0%) | 0 (0.0%) |
| College / Associate Degree | 346 (83.8%) | 12 (2.9%) |
| Bachelor's Degree or higher | 585 (93.3%) | 98 (15.7%) |
| Total | 985 (88.4%) | 116 (10.4%) |
Employment Occupations by Sex in Freeport
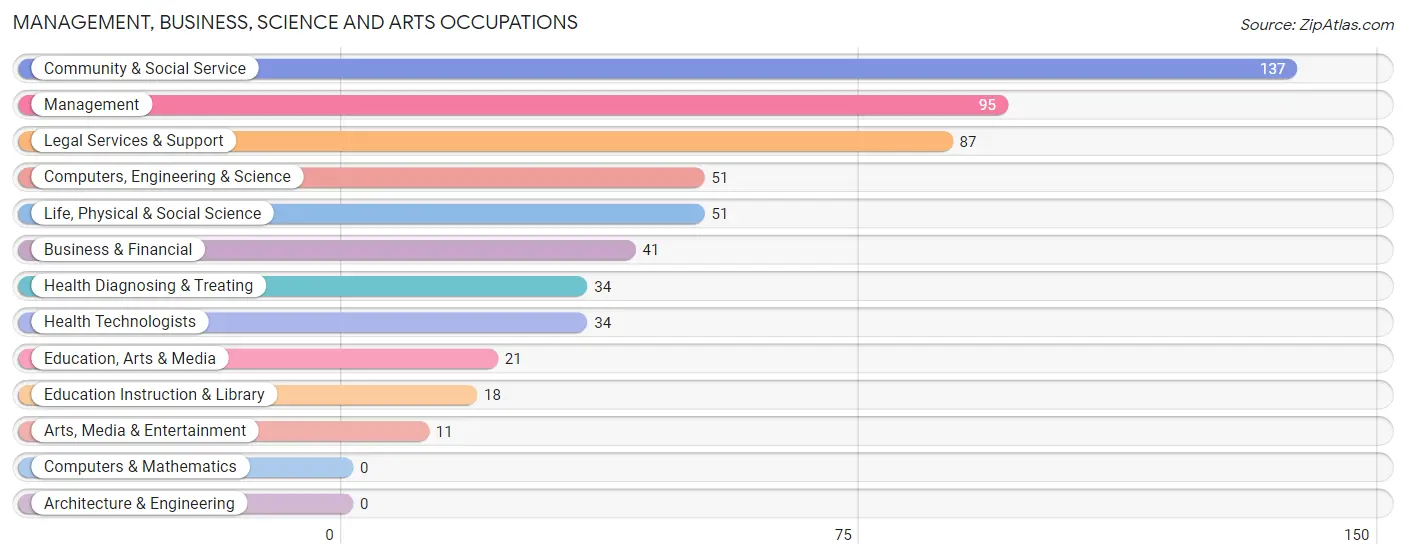
Management, Business, Science and Arts Occupations
The most common Management, Business, Science and Arts occupations in Freeport are Community & Social Service (137 | 13.2%), Management (95 | 9.1%), Legal Services & Support (87 | 8.4%), Computers, Engineering & Science (51 | 4.9%), and Life, Physical & Social Science (51 | 4.9%).
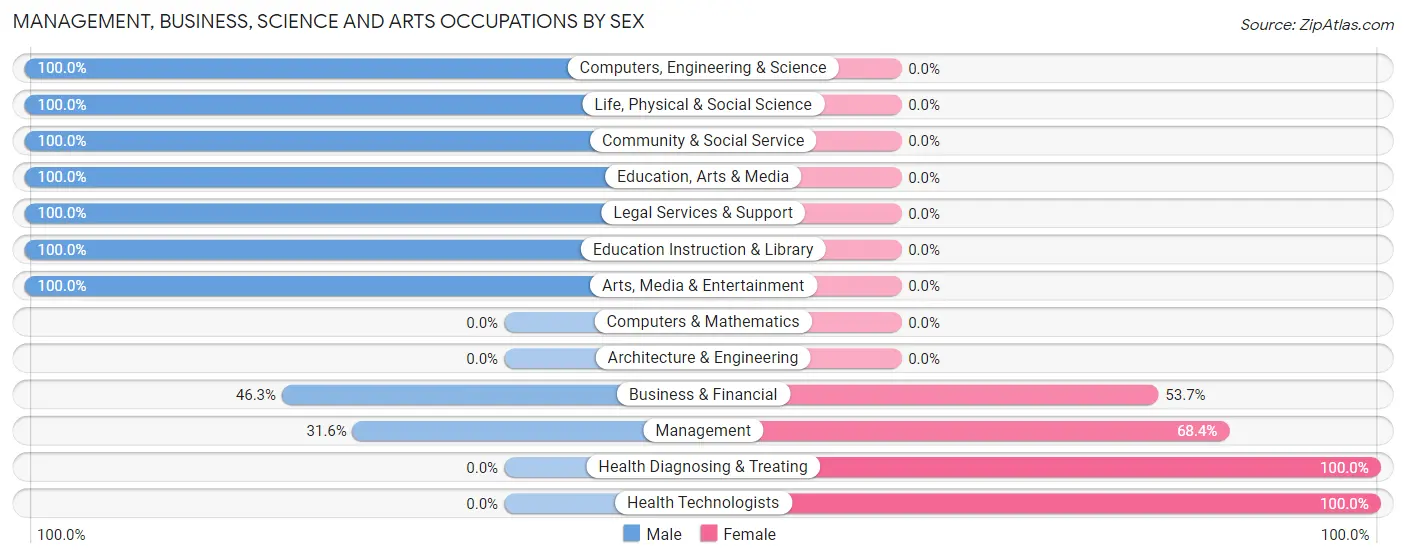
Management, Business, Science and Arts Occupations by Sex
Within the Management, Business, Science and Arts occupations in Freeport, the most male-oriented occupations are Computers, Engineering & Science (100.0%), Life, Physical & Social Science (100.0%), and Community & Social Service (100.0%), while the most female-oriented occupations are Health Diagnosing & Treating (100.0%), Health Technologists (100.0%), and Management (68.4%).
| Occupation | Male | Female |
| Management | 30 (31.6%) | 65 (68.4%) |
| Business & Financial | 19 (46.3%) | 22 (53.7%) |
| Computers, Engineering & Science | 51 (100.0%) | 0 (0.0%) |
| Computers & Mathematics | 0 (0.0%) | 0 (0.0%) |
| Architecture & Engineering | 0 (0.0%) | 0 (0.0%) |
| Life, Physical & Social Science | 51 (100.0%) | 0 (0.0%) |
| Community & Social Service | 137 (100.0%) | 0 (0.0%) |
| Education, Arts & Media | 21 (100.0%) | 0 (0.0%) |
| Legal Services & Support | 87 (100.0%) | 0 (0.0%) |
| Education Instruction & Library | 18 (100.0%) | 0 (0.0%) |
| Arts, Media & Entertainment | 11 (100.0%) | 0 (0.0%) |
| Health Diagnosing & Treating | 0 (0.0%) | 34 (100.0%) |
| Health Technologists | 0 (0.0%) | 34 (100.0%) |
| Total (Category) | 237 (66.2%) | 121 (33.8%) |
| Total (Overall) | 566 (54.5%) | 472 (45.5%) |
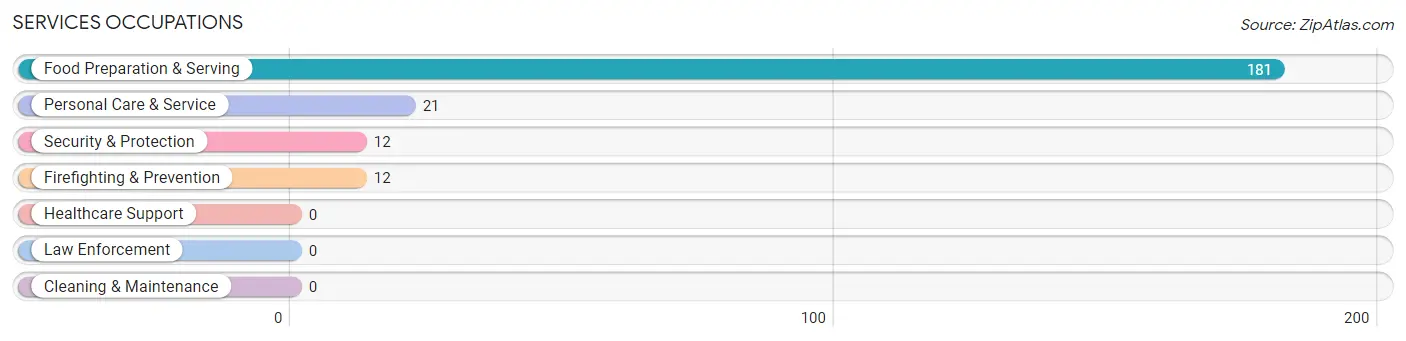
Services Occupations
The most common Services occupations in Freeport are Food Preparation & Serving (181 | 17.4%), Personal Care & Service (21 | 2.0%), Security & Protection (12 | 1.2%), and Firefighting & Prevention (12 | 1.2%).
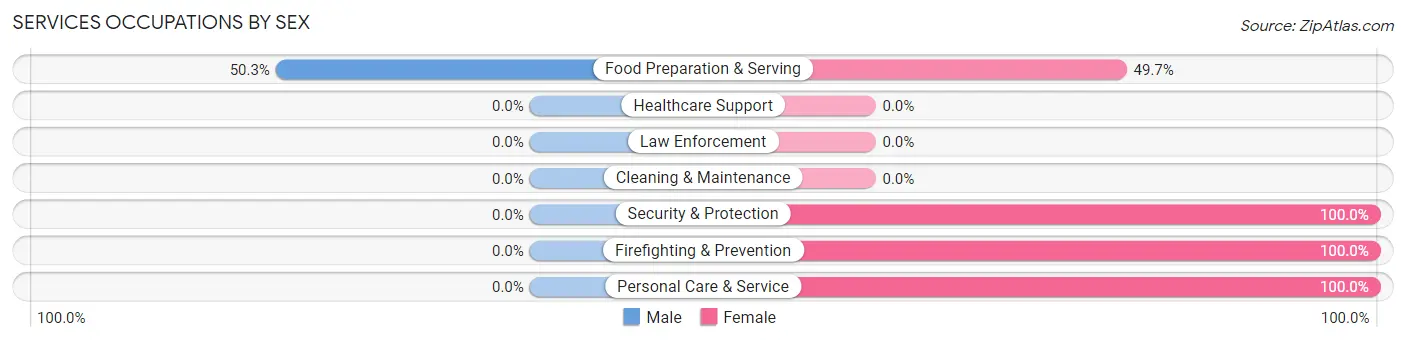
Services Occupations by Sex
| Occupation | Male | Female |
| Healthcare Support | 0 (0.0%) | 0 (0.0%) |
| Security & Protection | 0 (0.0%) | 12 (100.0%) |
| Firefighting & Prevention | 0 (0.0%) | 12 (100.0%) |
| Law Enforcement | 0 (0.0%) | 0 (0.0%) |
| Food Preparation & Serving | 91 (50.3%) | 90 (49.7%) |
| Cleaning & Maintenance | 0 (0.0%) | 0 (0.0%) |
| Personal Care & Service | 0 (0.0%) | 21 (100.0%) |
| Total (Category) | 91 (42.5%) | 123 (57.5%) |
| Total (Overall) | 566 (54.5%) | 472 (45.5%) |
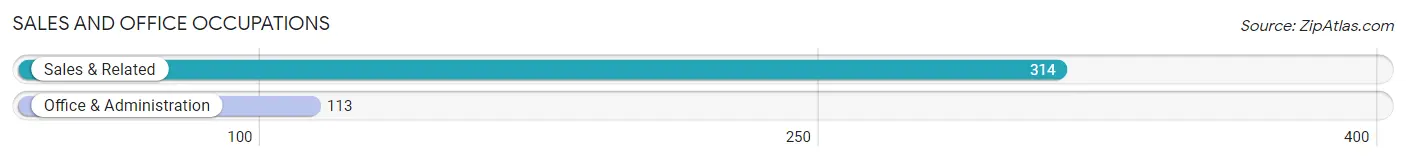
Sales and Office Occupations
The most common Sales and Office occupations in Freeport are Sales & Related (314 | 30.2%), and Office & Administration (113 | 10.9%).
Sales and Office Occupations by Sex
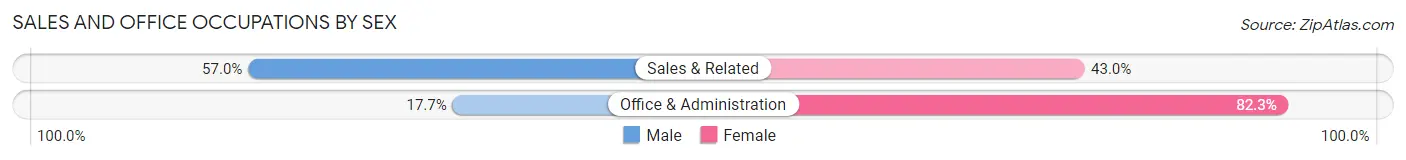
| Occupation | Male | Female |
| Sales & Related | 179 (57.0%) | 135 (43.0%) |
| Office & Administration | 20 (17.7%) | 93 (82.3%) |
| Total (Category) | 199 (46.6%) | 228 (53.4%) |
| Total (Overall) | 566 (54.5%) | 472 (45.5%) |
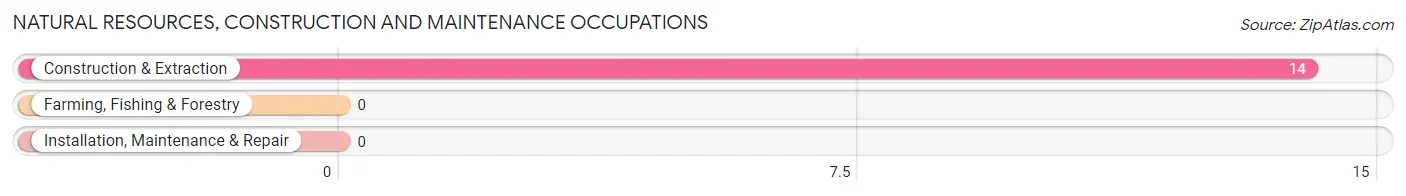
Natural Resources, Construction and Maintenance Occupations
The most common Natural Resources, Construction and Maintenance occupations in Freeport are , and Construction & Extraction (14 | 1.3%).
Natural Resources, Construction and Maintenance Occupations by Sex
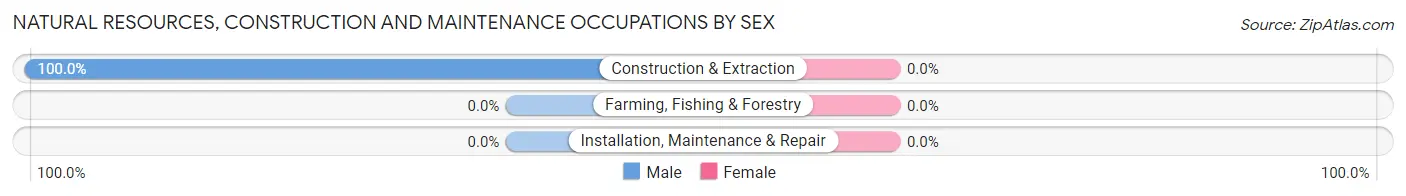
| Occupation | Male | Female |
| Farming, Fishing & Forestry | 0 (0.0%) | 0 (0.0%) |
| Construction & Extraction | 14 (100.0%) | 0 (0.0%) |
| Installation, Maintenance & Repair | 0 (0.0%) | 0 (0.0%) |
| Total (Category) | 14 (100.0%) | 0 (0.0%) |
| Total (Overall) | 566 (54.5%) | 472 (45.5%) |
Production, Transportation and Moving Occupations
The most common Production, Transportation and Moving occupations in Freeport are , and Transportation (25 | 2.4%).
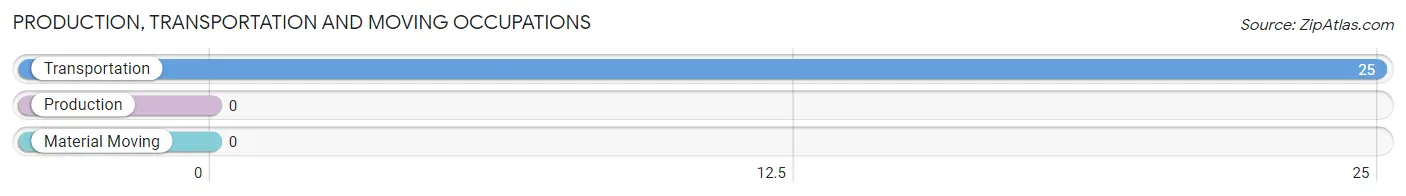
Production, Transportation and Moving Occupations by Sex
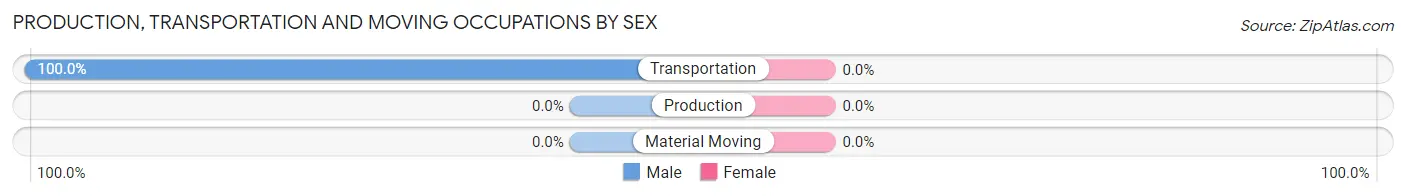
| Occupation | Male | Female |
| Production | 0 (0.0%) | 0 (0.0%) |
| Transportation | 25 (100.0%) | 0 (0.0%) |
| Material Moving | 0 (0.0%) | 0 (0.0%) |
| Total (Category) | 25 (100.0%) | 0 (0.0%) |
| Total (Overall) | 566 (54.5%) | 472 (45.5%) |
Employment Industries by Sex in Freeport
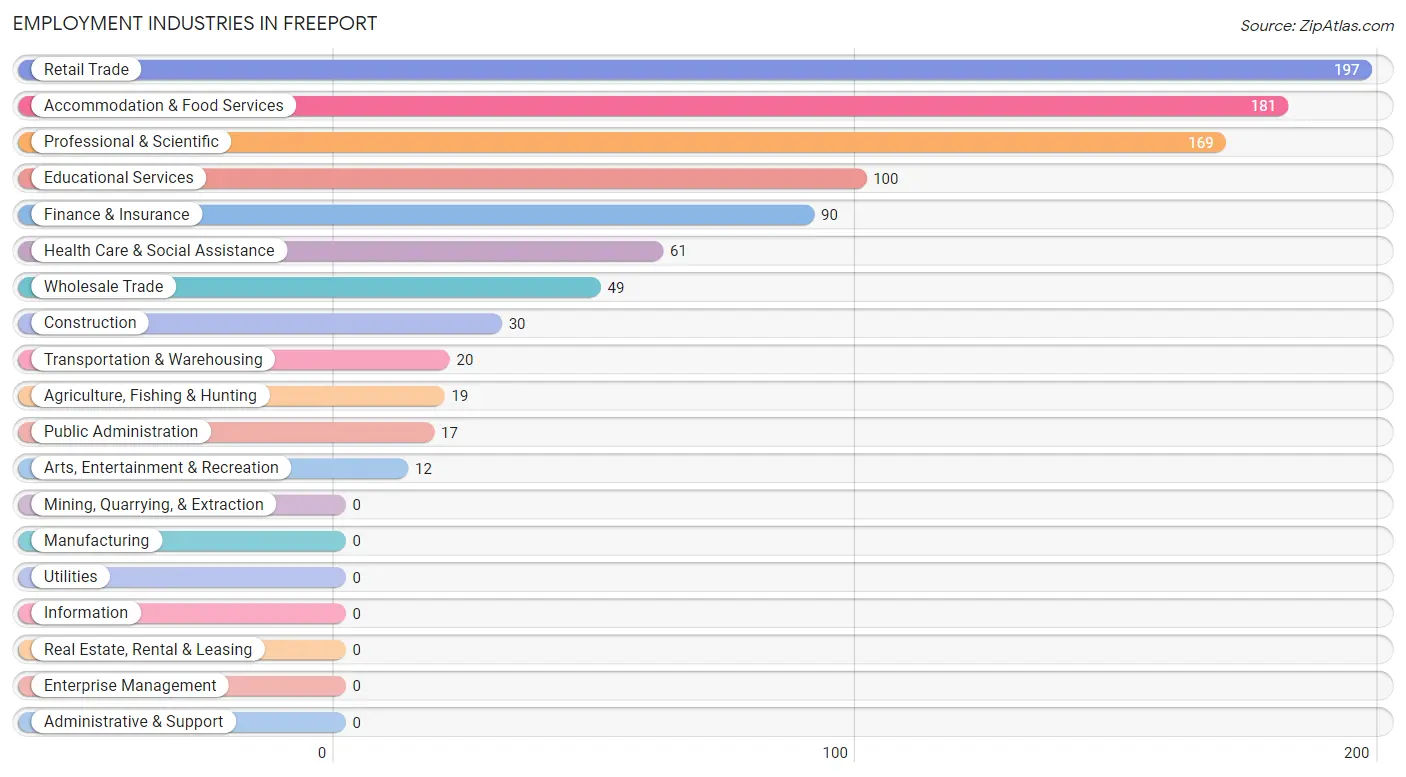
Employment Industries in Freeport
The major employment industries in Freeport include Retail Trade (197 | 19.0%), Accommodation & Food Services (181 | 17.4%), Professional & Scientific (169 | 16.3%), Educational Services (100 | 9.6%), and Finance & Insurance (90 | 8.7%).
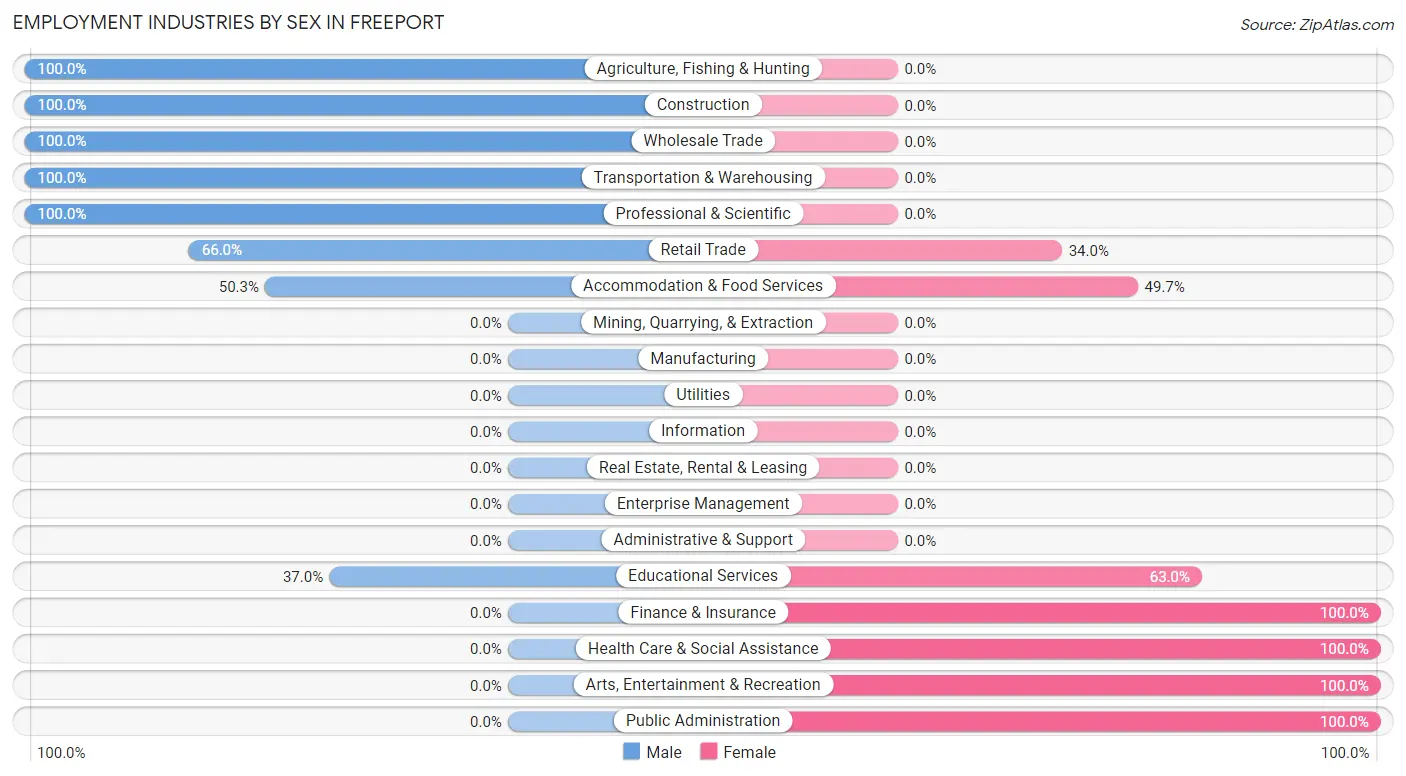
Employment Industries by Sex in Freeport
The Freeport industries that see more men than women are Agriculture, Fishing & Hunting (100.0%), Construction (100.0%), and Wholesale Trade (100.0%), whereas the industries that tend to have a higher number of women are Finance & Insurance (100.0%), Health Care & Social Assistance (100.0%), and Arts, Entertainment & Recreation (100.0%).
| Industry | Male | Female |
| Agriculture, Fishing & Hunting | 19 (100.0%) | 0 (0.0%) |
| Mining, Quarrying, & Extraction | 0 (0.0%) | 0 (0.0%) |
| Construction | 30 (100.0%) | 0 (0.0%) |
| Manufacturing | 0 (0.0%) | 0 (0.0%) |
| Wholesale Trade | 49 (100.0%) | 0 (0.0%) |
| Retail Trade | 130 (66.0%) | 67 (34.0%) |
| Transportation & Warehousing | 20 (100.0%) | 0 (0.0%) |
| Utilities | 0 (0.0%) | 0 (0.0%) |
| Information | 0 (0.0%) | 0 (0.0%) |
| Finance & Insurance | 0 (0.0%) | 90 (100.0%) |
| Real Estate, Rental & Leasing | 0 (0.0%) | 0 (0.0%) |
| Professional & Scientific | 169 (100.0%) | 0 (0.0%) |
| Enterprise Management | 0 (0.0%) | 0 (0.0%) |
| Administrative & Support | 0 (0.0%) | 0 (0.0%) |
| Educational Services | 37 (37.0%) | 63 (63.0%) |
| Health Care & Social Assistance | 0 (0.0%) | 61 (100.0%) |
| Arts, Entertainment & Recreation | 0 (0.0%) | 12 (100.0%) |
| Accommodation & Food Services | 91 (50.3%) | 90 (49.7%) |
| Public Administration | 0 (0.0%) | 17 (100.0%) |
| Total | 566 (54.5%) | 472 (45.5%) |
Education in Freeport
School Enrollment in Freeport
The most common levels of schooling among the 284 students in Freeport are high school (92 | 32.4%), middle school (90 | 31.7%), and kindergarten (43 | 15.1%).
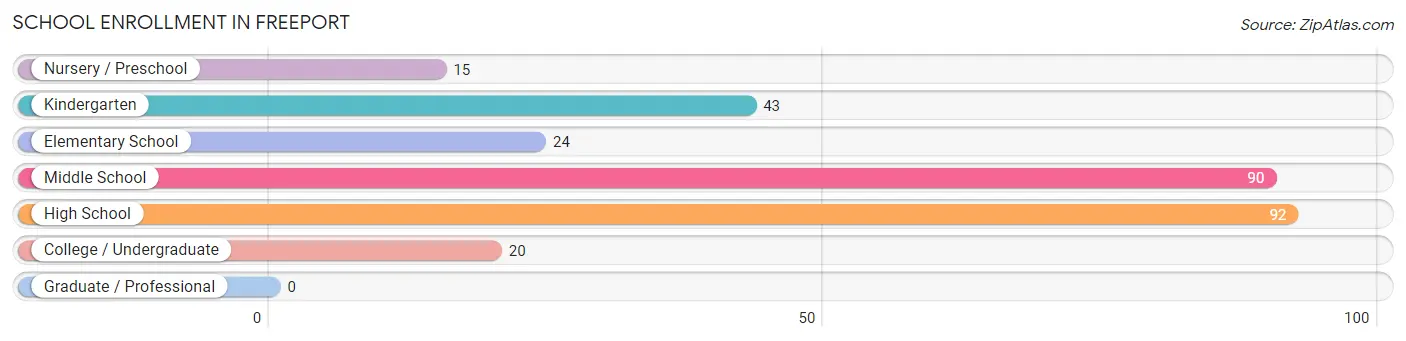
| School Level | # Students | % Students |
| Nursery / Preschool | 15 | 5.3% |
| Kindergarten | 43 | 15.1% |
| Elementary School | 24 | 8.5% |
| Middle School | 90 | 31.7% |
| High School | 92 | 32.4% |
| College / Undergraduate | 20 | 7.0% |
| Graduate / Professional | 0 | 0.0% |
| Total | 284 | 100.0% |
School Enrollment by Age by Funding Source in Freeport
Out of a total of 284 students who are enrolled in schools in Freeport, 55 (19.4%) attend a private institution, while the remaining 229 (80.6%) are enrolled in public schools. The age group of 3 to 4 year olds has the highest likelihood of being enrolled in private schools, with 15 (100.0% in the age bracket) enrolled. Conversely, the age group of 18 to 19 year olds has the lowest likelihood of being enrolled in a private school, with 20 (100.0% in the age bracket) attending a public institution.
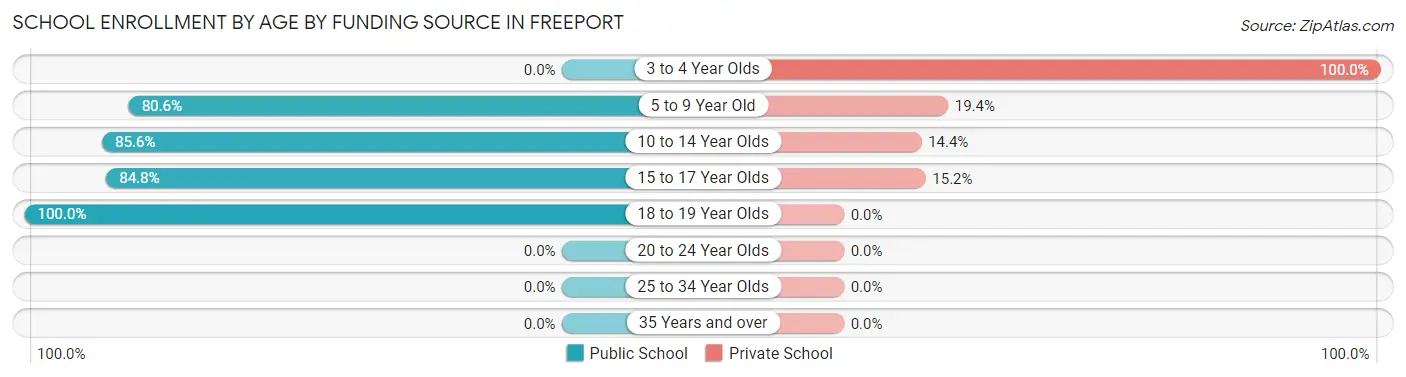
| Age Bracket | Public School | Private School |
| 3 to 4 Year Olds | 0 (0.0%) | 15 (100.0%) |
| 5 to 9 Year Old | 54 (80.6%) | 13 (19.4%) |
| 10 to 14 Year Olds | 77 (85.6%) | 13 (14.4%) |
| 15 to 17 Year Olds | 78 (84.8%) | 14 (15.2%) |
| 18 to 19 Year Olds | 20 (100.0%) | 0 (0.0%) |
| 20 to 24 Year Olds | 0 (0.0%) | 0 (0.0%) |
| 25 to 34 Year Olds | 0 (0.0%) | 0 (0.0%) |
| 35 Years and over | 0 (0.0%) | 0 (0.0%) |
| Total | 229 (80.6%) | 55 (19.4%) |
Educational Attainment by Field of Study in Freeport
Liberal arts & history (109 | 15.2%), visual & performing arts (103 | 14.4%), computers & mathematics (101 | 14.1%), education (96 | 13.4%), and social sciences (64 | 8.9%) are the most common fields of study among 717 individuals in Freeport who have obtained a bachelor's degree or higher.
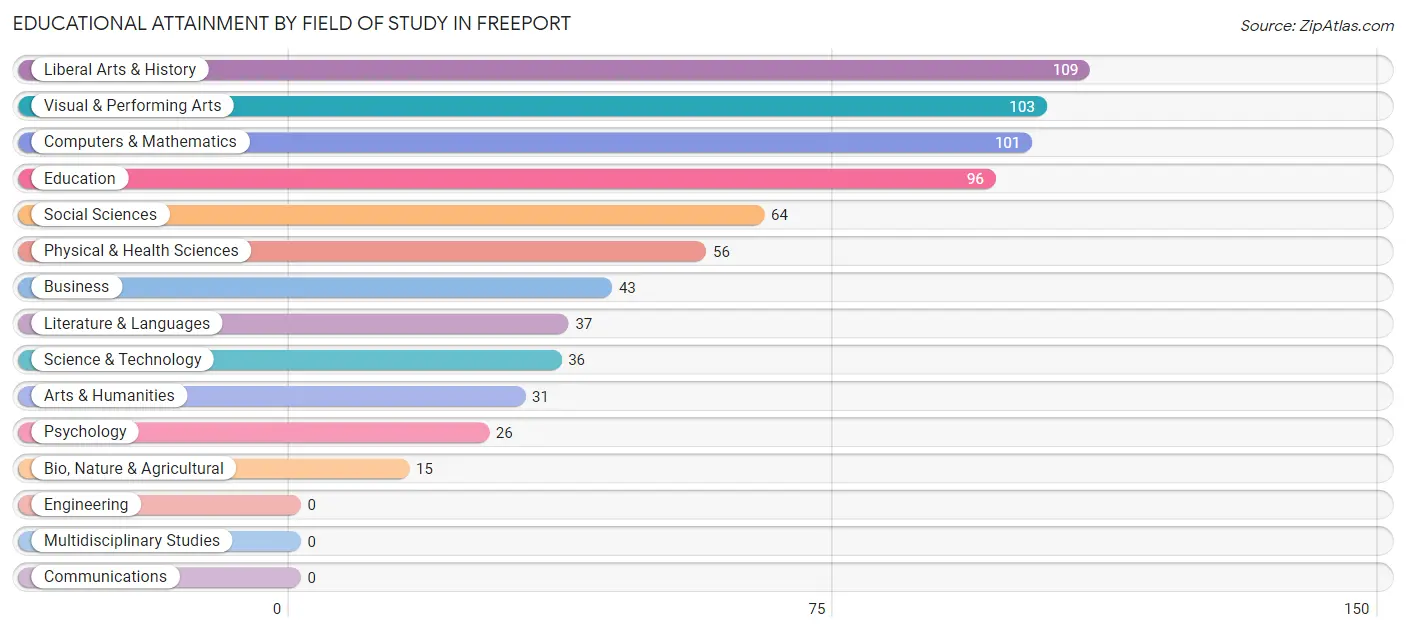
| Field of Study | # Graduates | % Graduates |
| Computers & Mathematics | 101 | 14.1% |
| Bio, Nature & Agricultural | 15 | 2.1% |
| Physical & Health Sciences | 56 | 7.8% |
| Psychology | 26 | 3.6% |
| Social Sciences | 64 | 8.9% |
| Engineering | 0 | 0.0% |
| Multidisciplinary Studies | 0 | 0.0% |
| Science & Technology | 36 | 5.0% |
| Business | 43 | 6.0% |
| Education | 96 | 13.4% |
| Literature & Languages | 37 | 5.2% |
| Liberal Arts & History | 109 | 15.2% |
| Visual & Performing Arts | 103 | 14.4% |
| Communications | 0 | 0.0% |
| Arts & Humanities | 31 | 4.3% |
| Total | 717 | 100.0% |
Transportation & Commute in Freeport
Vehicle Availability by Sex in Freeport
The most prevalent vehicle ownership categories in Freeport are males with 2 vehicles (365, accounting for 64.5%) and females with 2 vehicles (369, making up 77.3%).
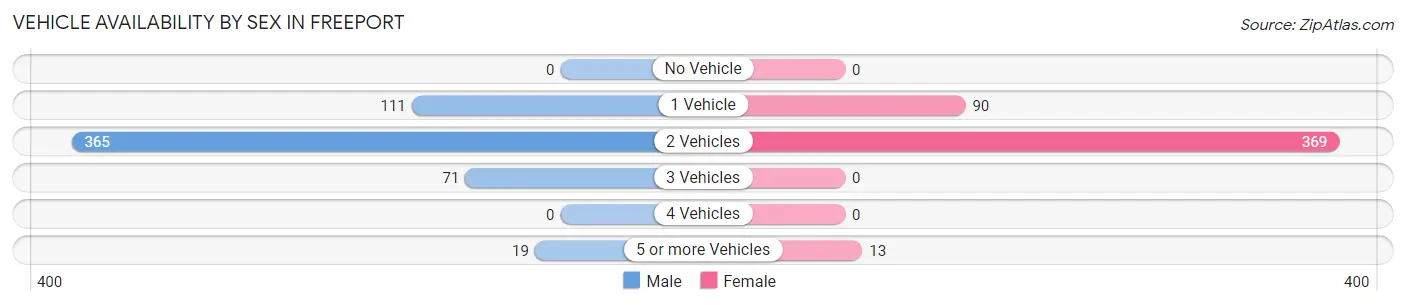
| Vehicles Available | Male | Female |
| No Vehicle | 0 (0.0%) | 0 (0.0%) |
| 1 Vehicle | 111 (19.6%) | 90 (19.1%) |
| 2 Vehicles | 365 (64.5%) | 369 (78.2%) |
| 3 Vehicles | 71 (12.5%) | 0 (0.0%) |
| 4 Vehicles | 0 (0.0%) | 0 (0.0%) |
| 5 or more Vehicles | 19 (3.4%) | 13 (2.8%) |
| Total | 566 (100.0%) | 472 (100.0%) |
Commute Time in Freeport
The most frequently occuring commute durations in Freeport are 5 to 9 minutes (305 commuters, 32.5%), 10 to 14 minutes (169 commuters, 18.0%), and 20 to 24 minutes (102 commuters, 10.9%).
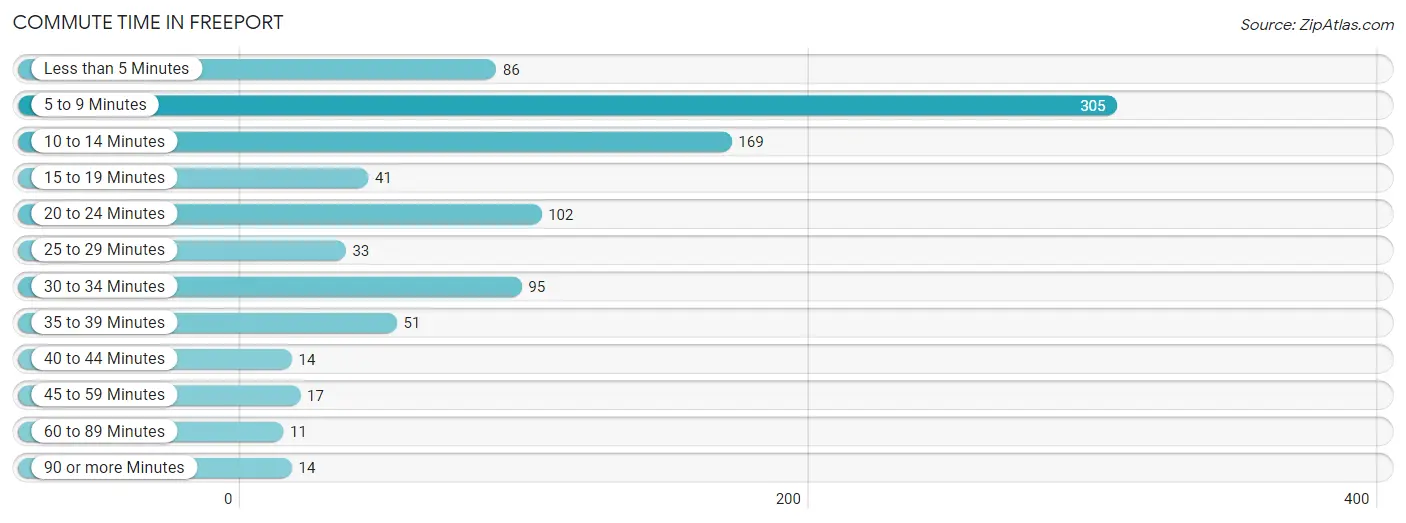
| Commute Time | # Commuters | % Commuters |
| Less than 5 Minutes | 86 | 9.2% |
| 5 to 9 Minutes | 305 | 32.5% |
| 10 to 14 Minutes | 169 | 18.0% |
| 15 to 19 Minutes | 41 | 4.4% |
| 20 to 24 Minutes | 102 | 10.9% |
| 25 to 29 Minutes | 33 | 3.5% |
| 30 to 34 Minutes | 95 | 10.1% |
| 35 to 39 Minutes | 51 | 5.4% |
| 40 to 44 Minutes | 14 | 1.5% |
| 45 to 59 Minutes | 17 | 1.8% |
| 60 to 89 Minutes | 11 | 1.2% |
| 90 or more Minutes | 14 | 1.5% |
Commute Time by Sex in Freeport
The most common commute times in Freeport are 5 to 9 minutes (261 commuters, 53.5%) for males and 10 to 14 minutes (130 commuters, 28.9%) for females.
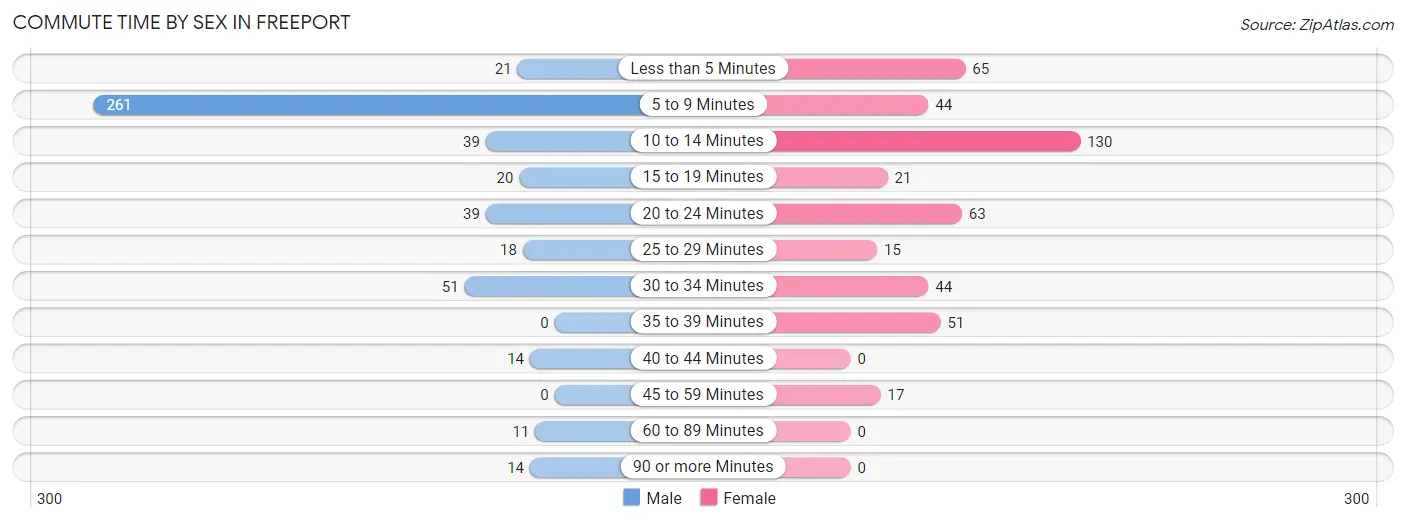
| Commute Time | Male | Female |
| Less than 5 Minutes | 21 (4.3%) | 65 (14.4%) |
| 5 to 9 Minutes | 261 (53.5%) | 44 (9.8%) |
| 10 to 14 Minutes | 39 (8.0%) | 130 (28.9%) |
| 15 to 19 Minutes | 20 (4.1%) | 21 (4.7%) |
| 20 to 24 Minutes | 39 (8.0%) | 63 (14.0%) |
| 25 to 29 Minutes | 18 (3.7%) | 15 (3.3%) |
| 30 to 34 Minutes | 51 (10.4%) | 44 (9.8%) |
| 35 to 39 Minutes | 0 (0.0%) | 51 (11.3%) |
| 40 to 44 Minutes | 14 (2.9%) | 0 (0.0%) |
| 45 to 59 Minutes | 0 (0.0%) | 17 (3.8%) |
| 60 to 89 Minutes | 11 (2.2%) | 0 (0.0%) |
| 90 or more Minutes | 14 (2.9%) | 0 (0.0%) |
Time of Departure to Work by Sex in Freeport
The most frequent times of departure to work in Freeport are 9:00 AM to 9:59 AM (181, 37.1%) for males and 8:00 AM to 8:29 AM (151, 33.6%) for females.
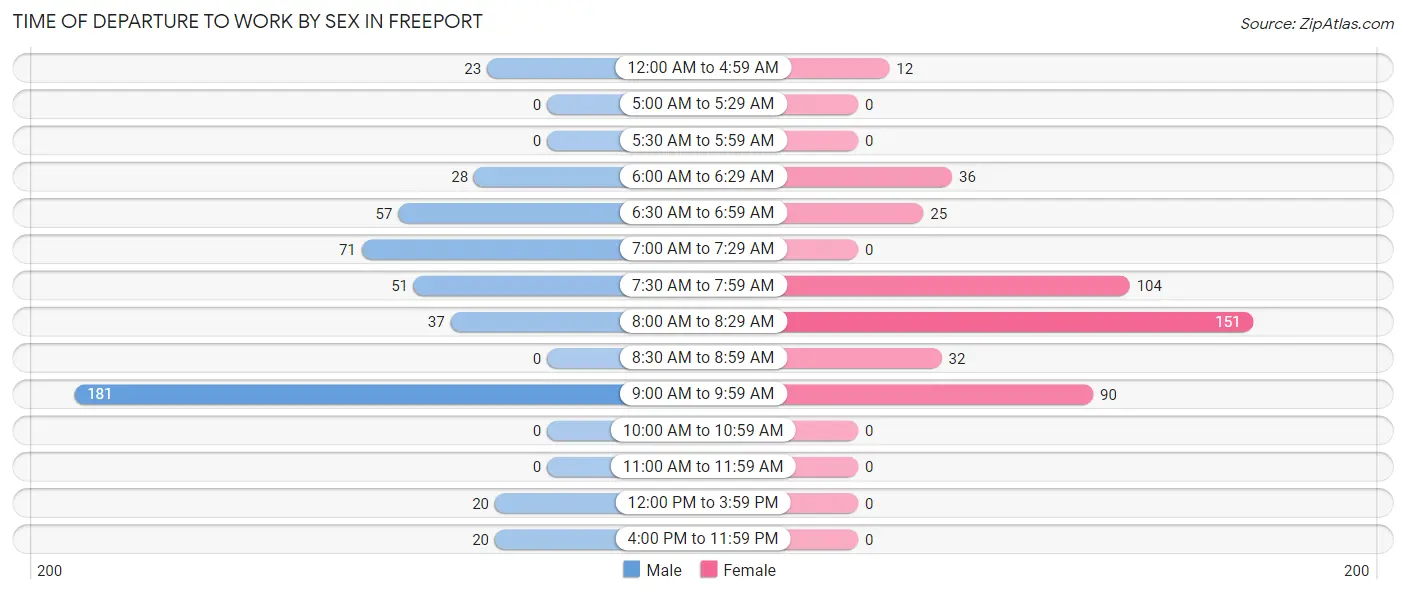
| Time of Departure | Male | Female |
| 12:00 AM to 4:59 AM | 23 (4.7%) | 12 (2.7%) |
| 5:00 AM to 5:29 AM | 0 (0.0%) | 0 (0.0%) |
| 5:30 AM to 5:59 AM | 0 (0.0%) | 0 (0.0%) |
| 6:00 AM to 6:29 AM | 28 (5.7%) | 36 (8.0%) |
| 6:30 AM to 6:59 AM | 57 (11.7%) | 25 (5.6%) |
| 7:00 AM to 7:29 AM | 71 (14.5%) | 0 (0.0%) |
| 7:30 AM to 7:59 AM | 51 (10.4%) | 104 (23.1%) |
| 8:00 AM to 8:29 AM | 37 (7.6%) | 151 (33.6%) |
| 8:30 AM to 8:59 AM | 0 (0.0%) | 32 (7.1%) |
| 9:00 AM to 9:59 AM | 181 (37.1%) | 90 (20.0%) |
| 10:00 AM to 10:59 AM | 0 (0.0%) | 0 (0.0%) |
| 11:00 AM to 11:59 AM | 0 (0.0%) | 0 (0.0%) |
| 12:00 PM to 3:59 PM | 20 (4.1%) | 0 (0.0%) |
| 4:00 PM to 11:59 PM | 20 (4.1%) | 0 (0.0%) |
| Total | 488 (100.0%) | 450 (100.0%) |
Housing Occupancy in Freeport
Occupancy by Ownership in Freeport
Of the total 831 dwellings in Freeport, owner-occupied units account for 383 (46.1%), while renter-occupied units make up 448 (53.9%).
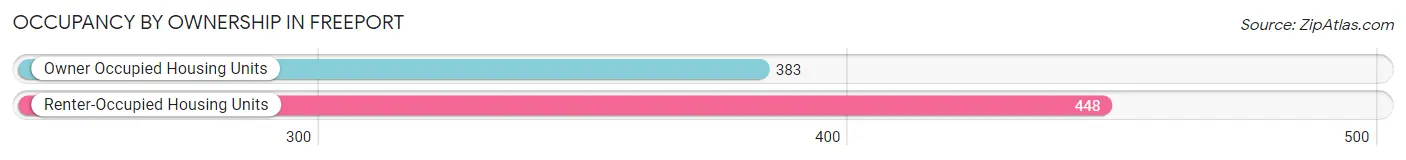
| Occupancy | # Housing Units | % Housing Units |
| Owner Occupied Housing Units | 383 | 46.1% |
| Renter-Occupied Housing Units | 448 | 53.9% |
| Total Occupied Housing Units | 831 | 100.0% |
Occupancy by Household Size in Freeport
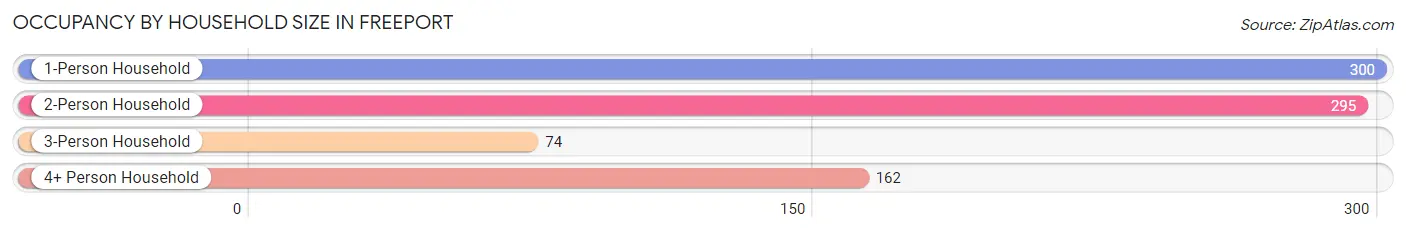
| Household Size | # Housing Units | % Housing Units |
| 1-Person Household | 300 | 36.1% |
| 2-Person Household | 295 | 35.5% |
| 3-Person Household | 74 | 8.9% |
| 4+ Person Household | 162 | 19.5% |
| Total Housing Units | 831 | 100.0% |
Occupancy by Ownership by Household Size in Freeport
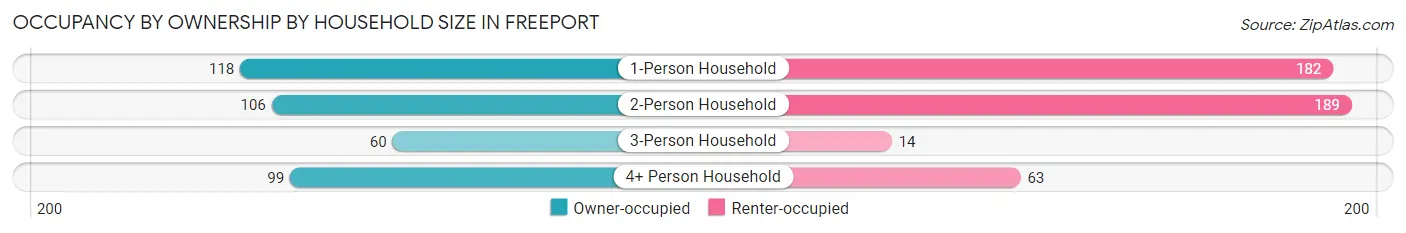
| Household Size | Owner-occupied | Renter-occupied |
| 1-Person Household | 118 (39.3%) | 182 (60.7%) |
| 2-Person Household | 106 (35.9%) | 189 (64.1%) |
| 3-Person Household | 60 (81.1%) | 14 (18.9%) |
| 4+ Person Household | 99 (61.1%) | 63 (38.9%) |
| Total Housing Units | 383 (46.1%) | 448 (53.9%) |
Occupancy by Educational Attainment in Freeport
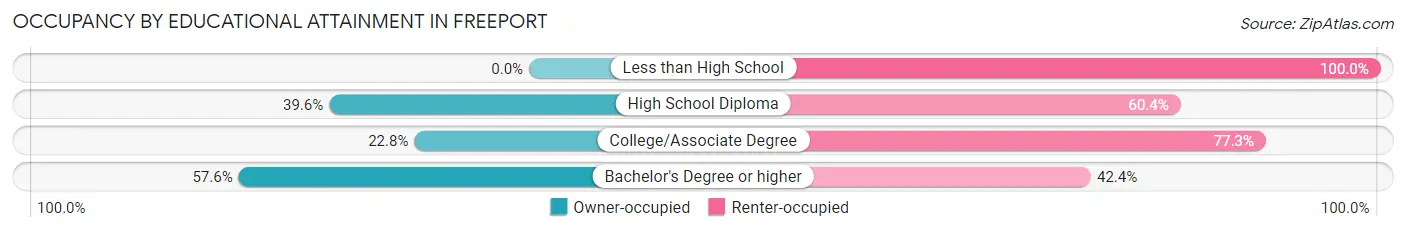
| Household Size | Owner-occupied | Renter-occupied |
| Less than High School | 0 (0.0%) | 17 (100.0%) |
| High School Diploma | 44 (39.6%) | 67 (60.4%) |
| College/Associate Degree | 43 (22.8%) | 146 (77.2%) |
| Bachelor's Degree or higher | 296 (57.6%) | 218 (42.4%) |
Occupancy by Age of Householder in Freeport
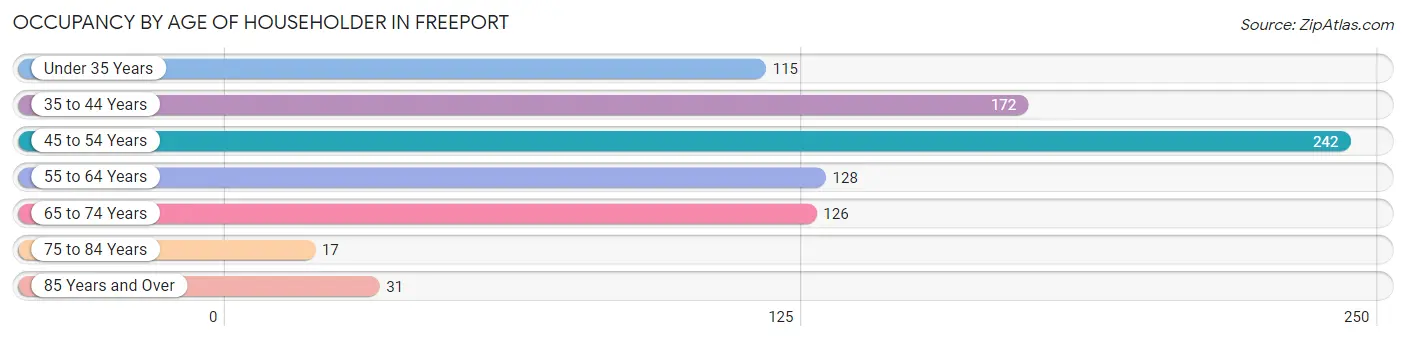
| Age Bracket | # Households | % Households |
| Under 35 Years | 115 | 13.8% |
| 35 to 44 Years | 172 | 20.7% |
| 45 to 54 Years | 242 | 29.1% |
| 55 to 64 Years | 128 | 15.4% |
| 65 to 74 Years | 126 | 15.2% |
| 75 to 84 Years | 17 | 2.1% |
| 85 Years and Over | 31 | 3.7% |
| Total | 831 | 100.0% |
Housing Finances in Freeport
Median Income by Occupancy in Freeport
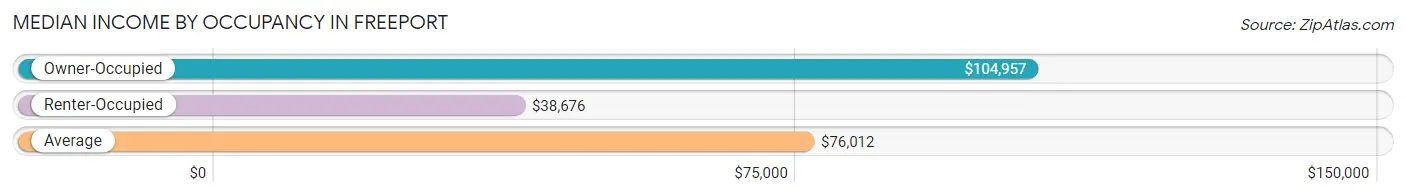
| Occupancy Type | # Households | Median Income |
| Owner-Occupied | 383 (46.1%) | $104,957 |
| Renter-Occupied | 448 (53.9%) | $38,676 |
| Average | 831 (100.0%) | $76,012 |
Occupancy by Householder Income Bracket in Freeport
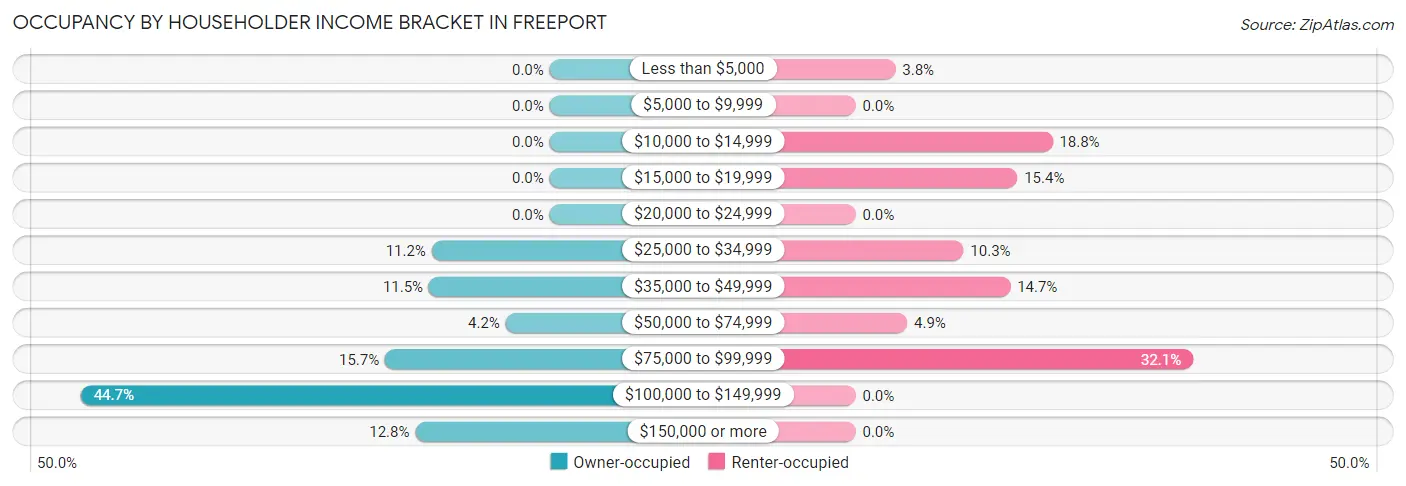
| Income Bracket | Owner-occupied | Renter-occupied |
| Less than $5,000 | 0 (0.0%) | 17 (3.8%) |
| $5,000 to $9,999 | 0 (0.0%) | 0 (0.0%) |
| $10,000 to $14,999 | 0 (0.0%) | 84 (18.8%) |
| $15,000 to $19,999 | 0 (0.0%) | 69 (15.4%) |
| $20,000 to $24,999 | 0 (0.0%) | 0 (0.0%) |
| $25,000 to $34,999 | 43 (11.2%) | 46 (10.3%) |
| $35,000 to $49,999 | 44 (11.5%) | 66 (14.7%) |
| $50,000 to $74,999 | 16 (4.2%) | 22 (4.9%) |
| $75,000 to $99,999 | 60 (15.7%) | 144 (32.1%) |
| $100,000 to $149,999 | 171 (44.7%) | 0 (0.0%) |
| $150,000 or more | 49 (12.8%) | 0 (0.0%) |
| Total | 383 (100.0%) | 448 (100.0%) |
Monthly Housing Cost Tiers in Freeport
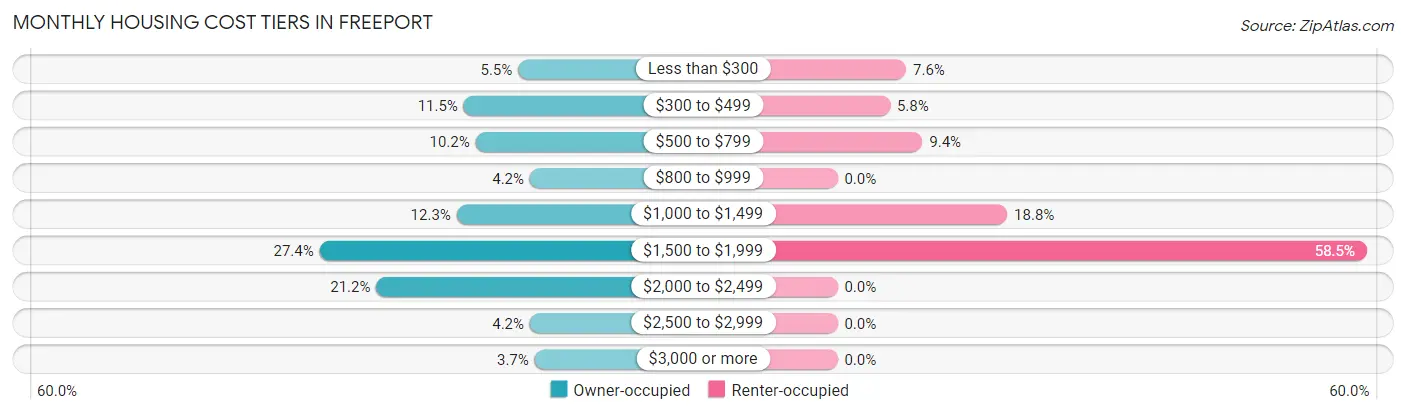
| Monthly Cost | Owner-occupied | Renter-occupied |
| Less than $300 | 21 (5.5%) | 34 (7.6%) |
| $300 to $499 | 44 (11.5%) | 26 (5.8%) |
| $500 to $799 | 39 (10.2%) | 42 (9.4%) |
| $800 to $999 | 16 (4.2%) | 0 (0.0%) |
| $1,000 to $1,499 | 47 (12.3%) | 84 (18.8%) |
| $1,500 to $1,999 | 105 (27.4%) | 262 (58.5%) |
| $2,000 to $2,499 | 81 (21.1%) | 0 (0.0%) |
| $2,500 to $2,999 | 16 (4.2%) | 0 (0.0%) |
| $3,000 or more | 14 (3.7%) | 0 (0.0%) |
| Total | 383 (100.0%) | 448 (100.0%) |
Physical Housing Characteristics in Freeport
Housing Structures in Freeport
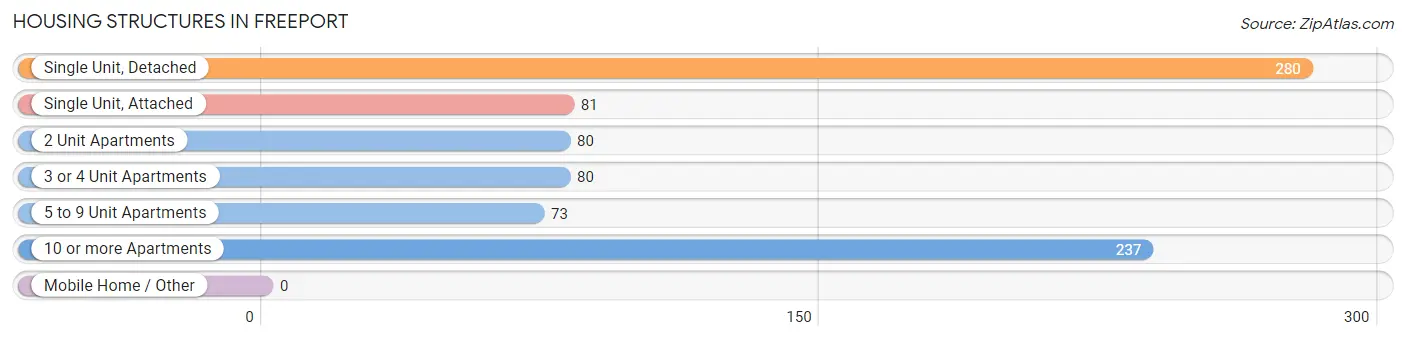
| Structure Type | # Housing Units | % Housing Units |
| Single Unit, Detached | 280 | 33.7% |
| Single Unit, Attached | 81 | 9.8% |
| 2 Unit Apartments | 80 | 9.6% |
| 3 or 4 Unit Apartments | 80 | 9.6% |
| 5 to 9 Unit Apartments | 73 | 8.8% |
| 10 or more Apartments | 237 | 28.5% |
| Mobile Home / Other | 0 | 0.0% |
| Total | 831 | 100.0% |
Housing Structures by Occupancy in Freeport
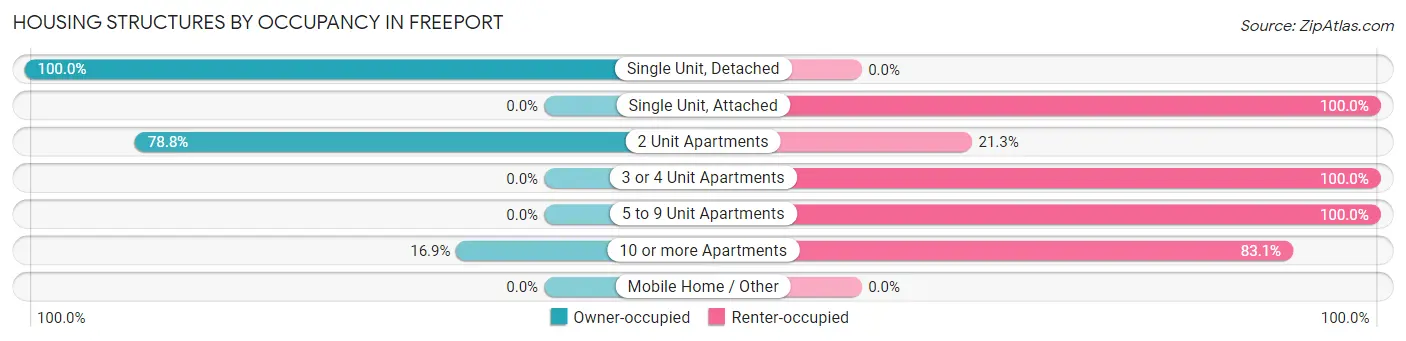
| Structure Type | Owner-occupied | Renter-occupied |
| Single Unit, Detached | 280 (100.0%) | 0 (0.0%) |
| Single Unit, Attached | 0 (0.0%) | 81 (100.0%) |
| 2 Unit Apartments | 63 (78.7%) | 17 (21.2%) |
| 3 or 4 Unit Apartments | 0 (0.0%) | 80 (100.0%) |
| 5 to 9 Unit Apartments | 0 (0.0%) | 73 (100.0%) |
| 10 or more Apartments | 40 (16.9%) | 197 (83.1%) |
| Mobile Home / Other | 0 (0.0%) | 0 (0.0%) |
| Total | 383 (46.1%) | 448 (53.9%) |
Housing Structures by Number of Rooms in Freeport
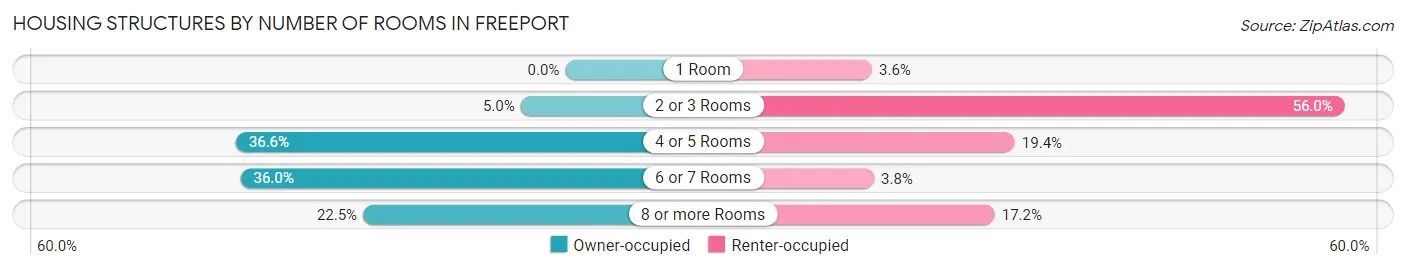
| Number of Rooms | Owner-occupied | Renter-occupied |
| 1 Room | 0 (0.0%) | 16 (3.6%) |
| 2 or 3 Rooms | 19 (5.0%) | 251 (56.0%) |
| 4 or 5 Rooms | 140 (36.5%) | 87 (19.4%) |
| 6 or 7 Rooms | 138 (36.0%) | 17 (3.8%) |
| 8 or more Rooms | 86 (22.5%) | 77 (17.2%) |
| Total | 383 (100.0%) | 448 (100.0%) |
Housing Structure by Heating Type in Freeport
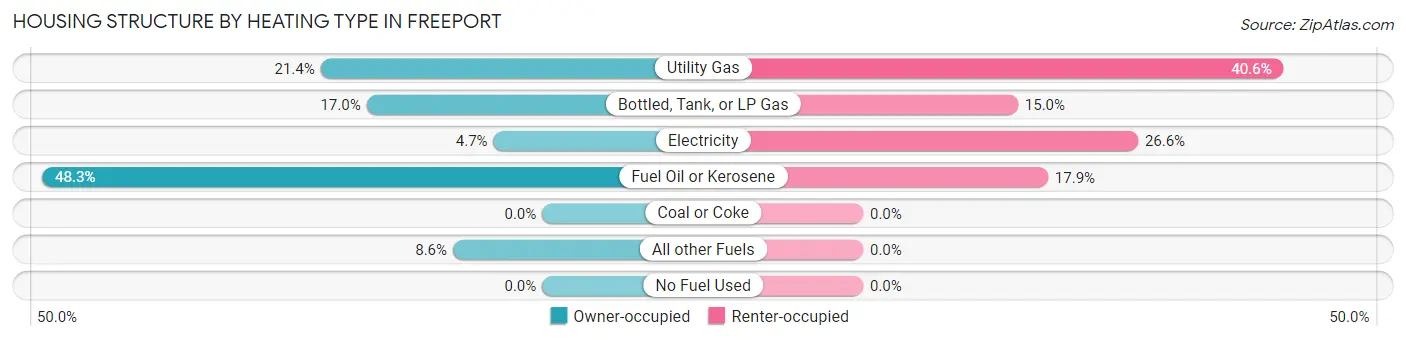
| Heating Type | Owner-occupied | Renter-occupied |
| Utility Gas | 82 (21.4%) | 182 (40.6%) |
| Bottled, Tank, or LP Gas | 65 (17.0%) | 67 (15.0%) |
| Electricity | 18 (4.7%) | 119 (26.6%) |
| Fuel Oil or Kerosene | 185 (48.3%) | 80 (17.9%) |
| Coal or Coke | 0 (0.0%) | 0 (0.0%) |
| All other Fuels | 33 (8.6%) | 0 (0.0%) |
| No Fuel Used | 0 (0.0%) | 0 (0.0%) |
| Total | 383 (100.0%) | 448 (100.0%) |
Household Vehicle Usage in Freeport
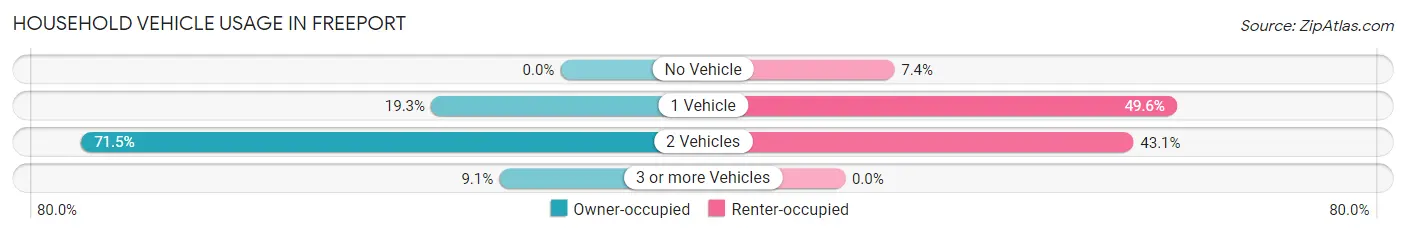
| Vehicles per Household | Owner-occupied | Renter-occupied |
| No Vehicle | 0 (0.0%) | 33 (7.4%) |
| 1 Vehicle | 74 (19.3%) | 222 (49.5%) |
| 2 Vehicles | 274 (71.5%) | 193 (43.1%) |
| 3 or more Vehicles | 35 (9.1%) | 0 (0.0%) |
| Total | 383 (100.0%) | 448 (100.0%) |
Real Estate & Mortgages in Freeport
Real Estate and Mortgage Overview in Freeport
| Characteristic | Without Mortgage | With Mortgage |
| Housing Units | 134 | 249 |
| Median Property Value | - | - |
| Median Household Income | $75,833 | $30 |
| Monthly Housing Costs | $611 | $14 |
| Real Estate Taxes | - | - |
Property Value by Mortgage Status in Freeport
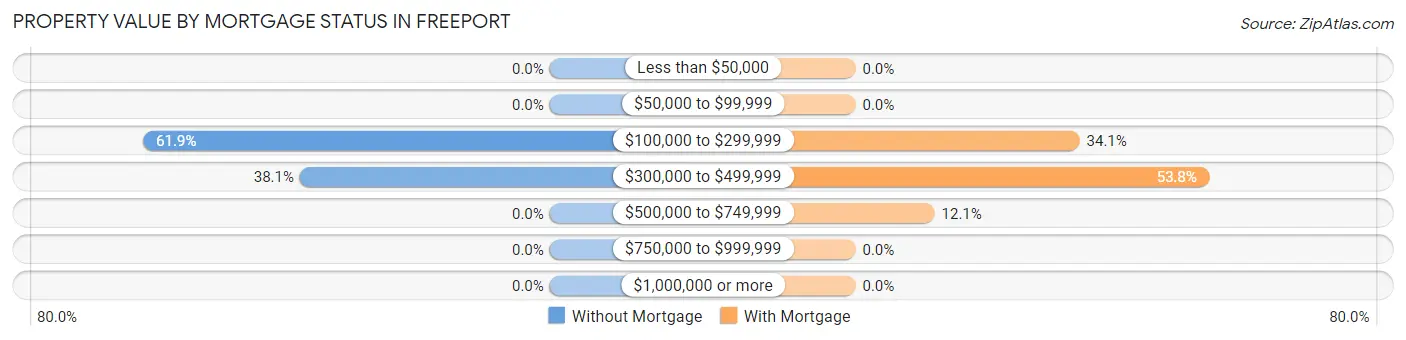
| Property Value | Without Mortgage | With Mortgage |
| Less than $50,000 | 0 (0.0%) | 0 (0.0%) |
| $50,000 to $99,999 | 0 (0.0%) | 0 (0.0%) |
| $100,000 to $299,999 | 83 (61.9%) | 85 (34.1%) |
| $300,000 to $499,999 | 51 (38.1%) | 134 (53.8%) |
| $500,000 to $749,999 | 0 (0.0%) | 30 (12.0%) |
| $750,000 to $999,999 | 0 (0.0%) | 0 (0.0%) |
| $1,000,000 or more | 0 (0.0%) | 0 (0.0%) |
| Total | 134 (100.0%) | 249 (100.0%) |
Household Income by Mortgage Status in Freeport
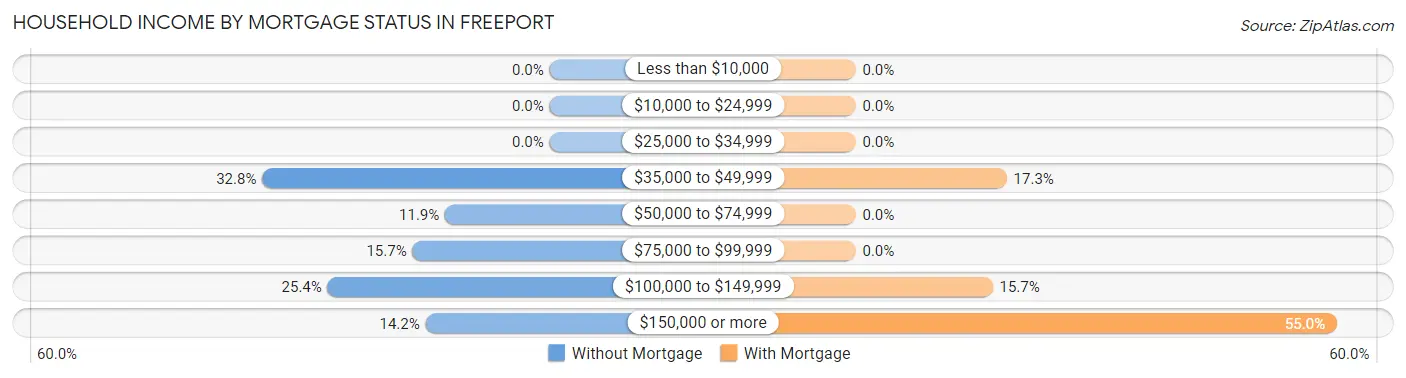
| Household Income | Without Mortgage | With Mortgage |
| Less than $10,000 | 0 (0.0%) | 0 (0.0%) |
| $10,000 to $24,999 | 0 (0.0%) | 0 (0.0%) |
| $25,000 to $34,999 | 0 (0.0%) | 0 (0.0%) |
| $35,000 to $49,999 | 44 (32.8%) | 43 (17.3%) |
| $50,000 to $74,999 | 16 (11.9%) | 0 (0.0%) |
| $75,000 to $99,999 | 21 (15.7%) | 0 (0.0%) |
| $100,000 to $149,999 | 34 (25.4%) | 39 (15.7%) |
| $150,000 or more | 19 (14.2%) | 137 (55.0%) |
| Total | 134 (100.0%) | 249 (100.0%) |
Property Value to Household Income Ratio in Freeport
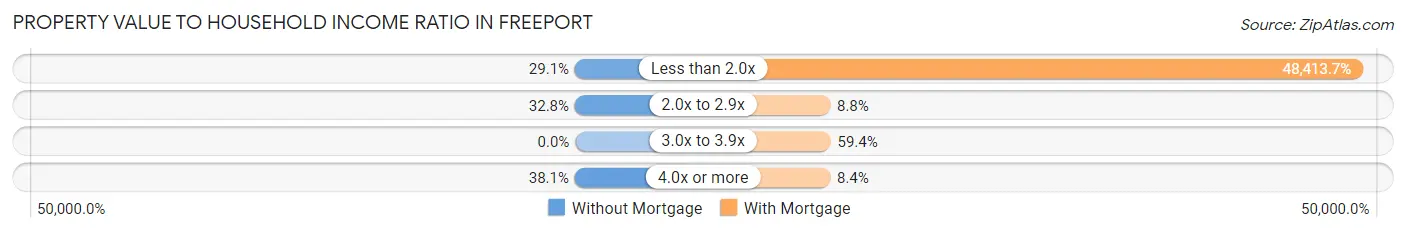
| Value-to-Income Ratio | Without Mortgage | With Mortgage |
| Less than 2.0x | 39 (29.1%) | 120,550 (48,413.7%) |
| 2.0x to 2.9x | 44 (32.8%) | 22 (8.8%) |
| 3.0x to 3.9x | 0 (0.0%) | 148 (59.4%) |
| 4.0x or more | 51 (38.1%) | 21 (8.4%) |
| Total | 134 (100.0%) | 249 (100.0%) |
Real Estate Taxes by Mortgage Status in Freeport
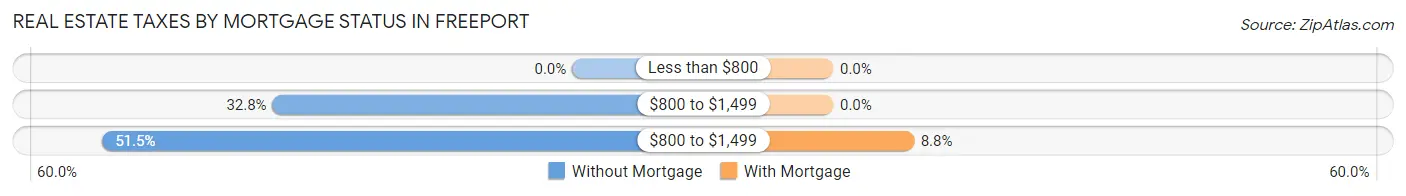
| Property Taxes | Without Mortgage | With Mortgage |
| Less than $800 | 0 (0.0%) | 0 (0.0%) |
| $800 to $1,499 | 44 (32.8%) | 0 (0.0%) |
| $800 to $1,499 | 69 (51.5%) | 22 (8.8%) |
| Total | 134 (100.0%) | 249 (100.0%) |
Health & Disability in Freeport
Health Insurance Coverage by Age in Freeport
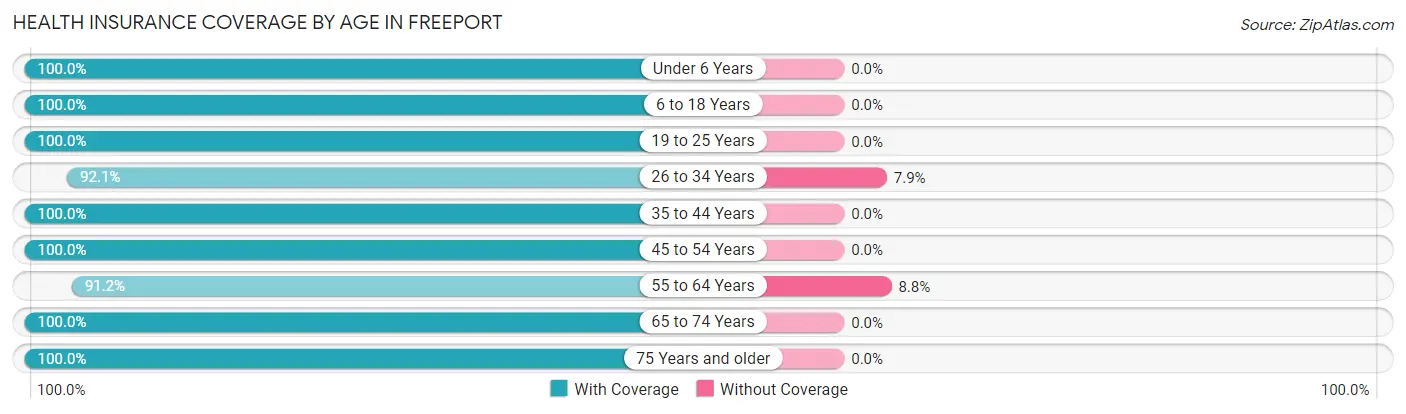
| Age Bracket | With Coverage | Without Coverage |
| Under 6 Years | 183 (100.0%) | 0 (0.0%) |
| 6 to 18 Years | 316 (100.0%) | 0 (0.0%) |
| 19 to 25 Years | 18 (100.0%) | 0 (0.0%) |
| 26 to 34 Years | 232 (92.1%) | 20 (7.9%) |
| 35 to 44 Years | 248 (100.0%) | 0 (0.0%) |
| 45 to 54 Years | 365 (100.0%) | 0 (0.0%) |
| 55 to 64 Years | 218 (91.2%) | 21 (8.8%) |
| 65 to 74 Years | 146 (100.0%) | 0 (0.0%) |
| 75 Years and older | 52 (100.0%) | 0 (0.0%) |
| Total | 1,778 (97.8%) | 41 (2.2%) |
Health Insurance Coverage by Citizenship Status in Freeport
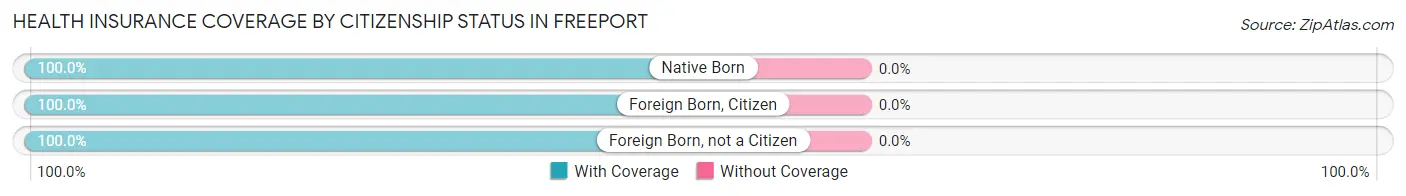
| Citizenship Status | With Coverage | Without Coverage |
| Native Born | 183 (100.0%) | 0 (0.0%) |
| Foreign Born, Citizen | 316 (100.0%) | 0 (0.0%) |
| Foreign Born, not a Citizen | 18 (100.0%) | 0 (0.0%) |
Health Insurance Coverage by Household Income in Freeport
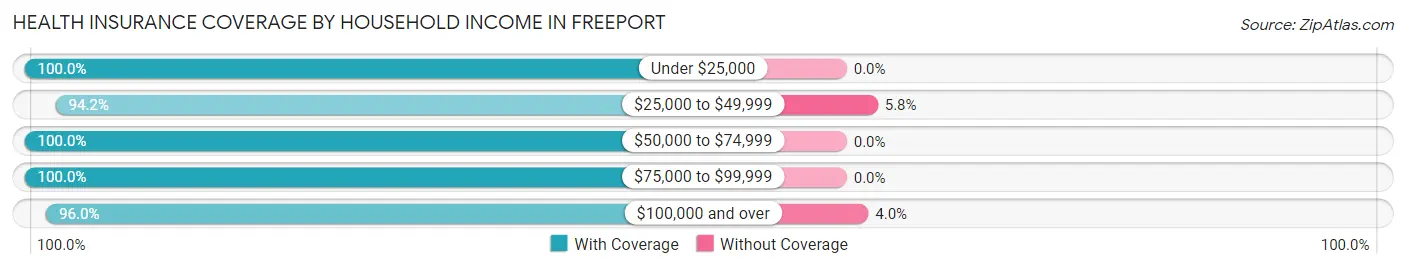
| Household Income | With Coverage | Without Coverage |
| Under $25,000 | 190 (100.0%) | 0 (0.0%) |
| $25,000 to $49,999 | 324 (94.2%) | 20 (5.8%) |
| $50,000 to $74,999 | 38 (100.0%) | 0 (0.0%) |
| $75,000 to $99,999 | 721 (100.0%) | 0 (0.0%) |
| $100,000 and over | 499 (96.0%) | 21 (4.0%) |
Public vs Private Health Insurance Coverage by Age in Freeport
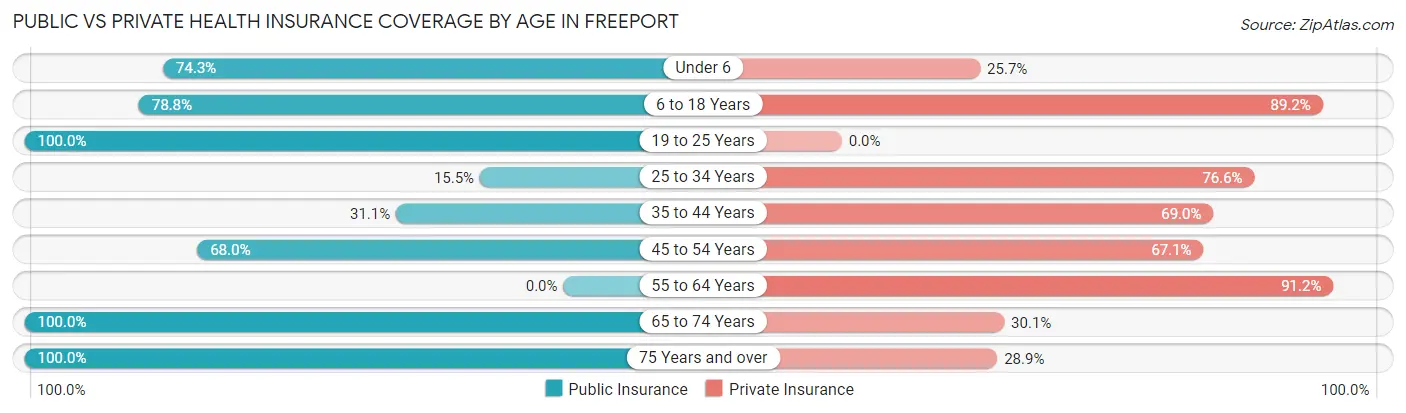
| Age Bracket | Public Insurance | Private Insurance |
| Under 6 | 136 (74.3%) | 47 (25.7%) |
| 6 to 18 Years | 249 (78.8%) | 282 (89.2%) |
| 19 to 25 Years | 18 (100.0%) | 0 (0.0%) |
| 25 to 34 Years | 39 (15.5%) | 193 (76.6%) |
| 35 to 44 Years | 77 (31.0%) | 171 (69.0%) |
| 45 to 54 Years | 248 (67.9%) | 245 (67.1%) |
| 55 to 64 Years | 0 (0.0%) | 218 (91.2%) |
| 65 to 74 Years | 146 (100.0%) | 44 (30.1%) |
| 75 Years and over | 52 (100.0%) | 15 (28.8%) |
| Total | 965 (53.0%) | 1,215 (66.8%) |
Disability Status by Sex by Age in Freeport
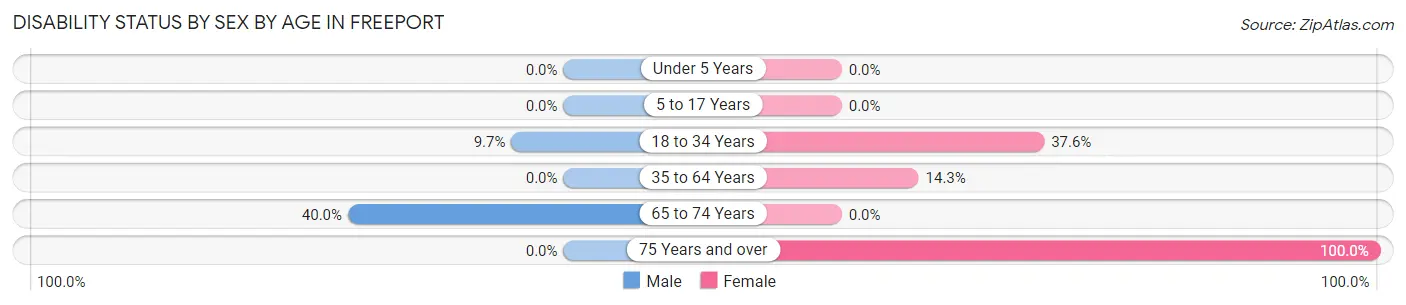
| Age Bracket | Male | Female |
| Under 5 Years | 0 (0.0%) | 0 (0.0%) |
| 5 to 17 Years | 0 (0.0%) | 0 (0.0%) |
| 18 to 34 Years | 20 (9.7%) | 65 (37.6%) |
| 35 to 64 Years | 0 (0.0%) | 69 (14.3%) |
| 65 to 74 Years | 18 (40.0%) | 0 (0.0%) |
| 75 Years and over | 0 (0.0%) | 37 (100.0%) |
Disability Class by Sex by Age in Freeport
Disability Class: Hearing Difficulty
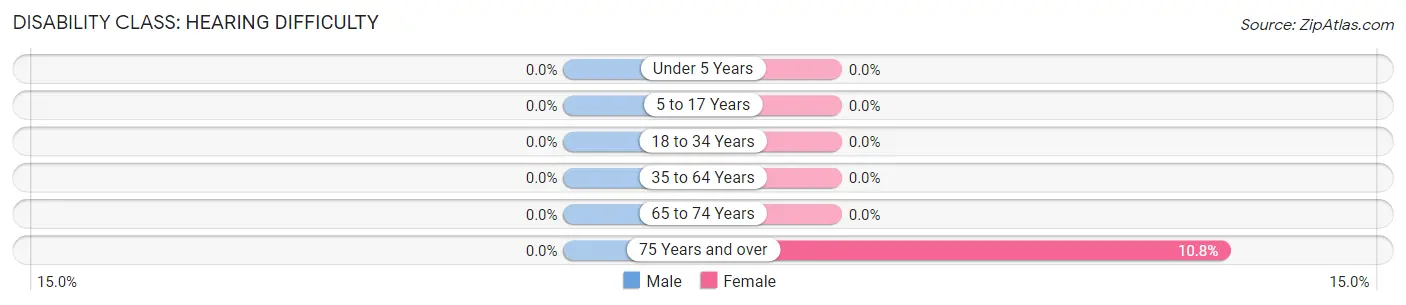
| Age Bracket | Male | Female |
| Under 5 Years | 0 (0.0%) | 0 (0.0%) |
| 5 to 17 Years | 0 (0.0%) | 0 (0.0%) |
| 18 to 34 Years | 0 (0.0%) | 0 (0.0%) |
| 35 to 64 Years | 0 (0.0%) | 0 (0.0%) |
| 65 to 74 Years | 0 (0.0%) | 0 (0.0%) |
| 75 Years and over | 0 (0.0%) | 4 (10.8%) |
Disability Class: Vision Difficulty
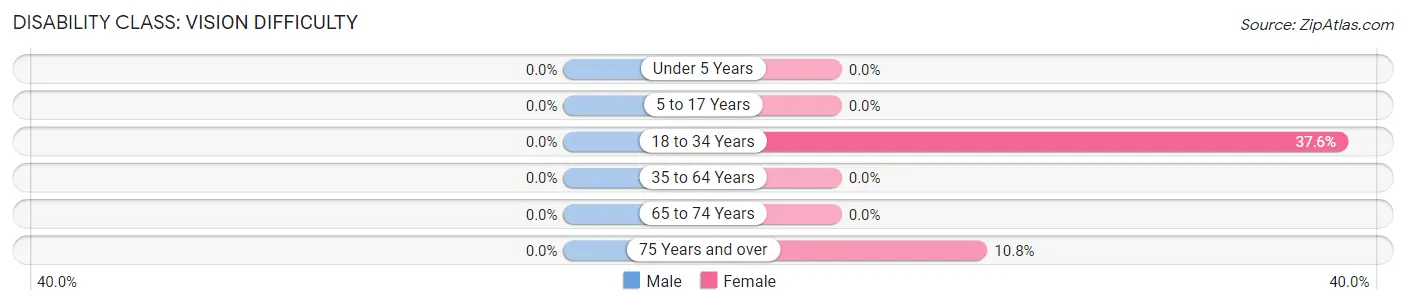
| Age Bracket | Male | Female |
| Under 5 Years | 0 (0.0%) | 0 (0.0%) |
| 5 to 17 Years | 0 (0.0%) | 0 (0.0%) |
| 18 to 34 Years | 0 (0.0%) | 65 (37.6%) |
| 35 to 64 Years | 0 (0.0%) | 0 (0.0%) |
| 65 to 74 Years | 0 (0.0%) | 0 (0.0%) |
| 75 Years and over | 0 (0.0%) | 4 (10.8%) |
Disability Class: Cognitive Difficulty
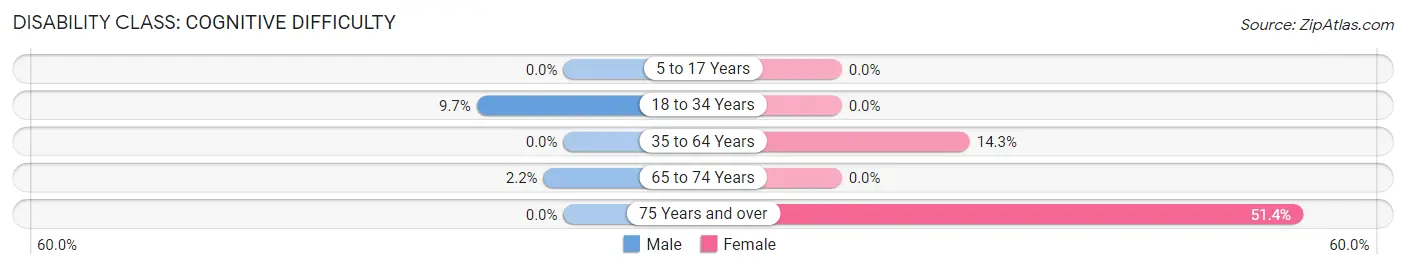
| Age Bracket | Male | Female |
| 5 to 17 Years | 0 (0.0%) | 0 (0.0%) |
| 18 to 34 Years | 20 (9.7%) | 0 (0.0%) |
| 35 to 64 Years | 0 (0.0%) | 69 (14.3%) |
| 65 to 74 Years | 1 (2.2%) | 0 (0.0%) |
| 75 Years and over | 0 (0.0%) | 19 (51.3%) |
Disability Class: Ambulatory Difficulty
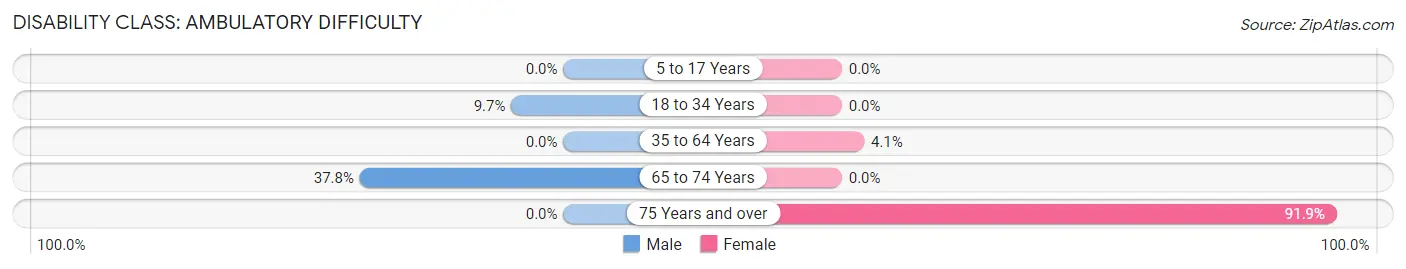
| Age Bracket | Male | Female |
| 5 to 17 Years | 0 (0.0%) | 0 (0.0%) |
| 18 to 34 Years | 20 (9.7%) | 0 (0.0%) |
| 35 to 64 Years | 0 (0.0%) | 20 (4.1%) |
| 65 to 74 Years | 17 (37.8%) | 0 (0.0%) |
| 75 Years and over | 0 (0.0%) | 34 (91.9%) |
Disability Class: Self-Care Difficulty
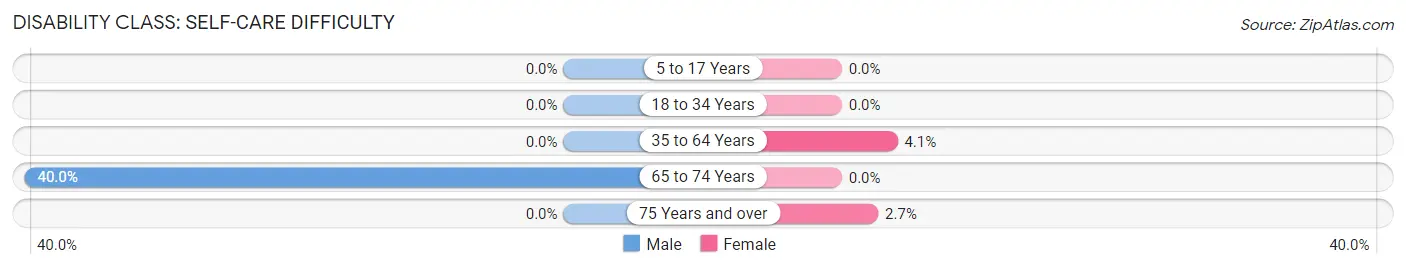
| Age Bracket | Male | Female |
| 5 to 17 Years | 0 (0.0%) | 0 (0.0%) |
| 18 to 34 Years | 0 (0.0%) | 0 (0.0%) |
| 35 to 64 Years | 0 (0.0%) | 20 (4.1%) |
| 65 to 74 Years | 18 (40.0%) | 0 (0.0%) |
| 75 Years and over | 0 (0.0%) | 1 (2.7%) |
Technology Access in Freeport
Computing Device Access in Freeport
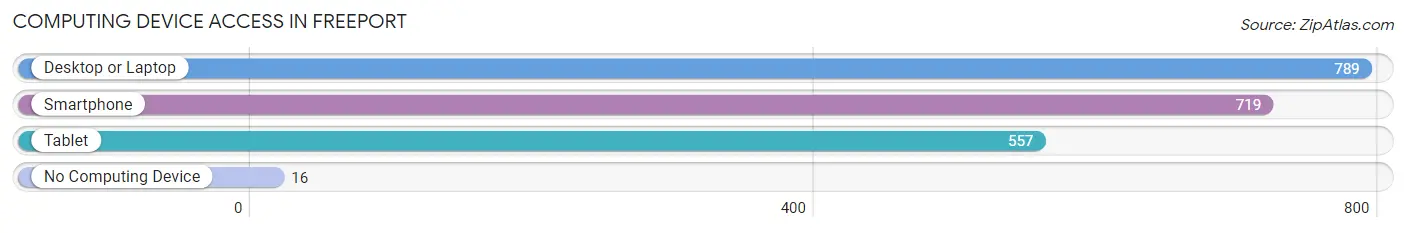
| Device Type | # Households | % Households |
| Desktop or Laptop | 789 | 95.0% |
| Smartphone | 719 | 86.5% |
| Tablet | 557 | 67.0% |
| No Computing Device | 16 | 1.9% |
| Total | 831 | 100.0% |
Internet Access in Freeport
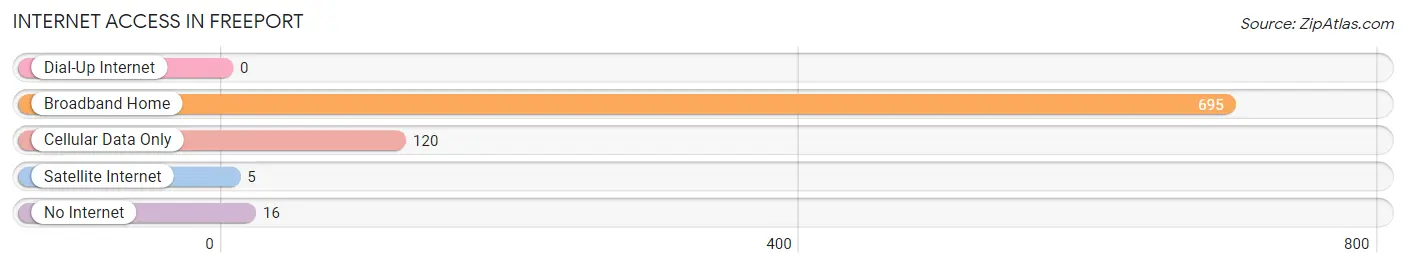
| Internet Type | # Households | % Households |
| Dial-Up Internet | 0 | 0.0% |
| Broadband Home | 695 | 83.6% |
| Cellular Data Only | 120 | 14.4% |
| Satellite Internet | 5 | 0.6% |
| No Internet | 16 | 1.9% |
| Total | 831 | 100.0% |
Freeport Summary
Freeport, Maine is a small town located in Cumberland County, Maine. It is situated on the banks of the Harraseeket River, and is part of the Portland-South Portland-Biddeford metropolitan area. The town has a population of 7,879 as of the 2010 census, and is home to the world-famous L.L. Bean retail store.
History
The area that is now Freeport was first settled in 1630 by Europeans, and was part of the town of North Yarmouth until 1789, when it was incorporated as a separate town. The town was named after the port of Freeport in the Bahamas, which was a popular destination for ships from Maine.
In the 19th century, Freeport was a major shipbuilding center, and the town was home to several shipyards. The town was also home to a number of mills, including a gristmill, a sawmill, and a paper mill.
In 1912, Leon Leonwood Bean opened his first retail store in Freeport, selling his patented Maine Hunting Shoe. The store was an immediate success, and L.L. Bean has since become one of the most successful retail stores in the world.
Geography
Freeport is located in southern Maine, about 20 miles north of Portland. The town is situated on the banks of the Harraseeket River, and is bordered by the towns of Durham to the north, Pownal to the east, and Brunswick to the south.
The town has a total area of 11.3 square miles, of which 10.9 square miles is land and 0.4 square miles is water. The town is mostly flat, with the highest point being just over 200 feet above sea level.
Economy
Freeport is home to the world-famous L.L. Bean retail store, which is the town's largest employer. The store employs over 4,000 people, and is the town's largest source of revenue.
The town is also home to several other businesses, including a number of restaurants, hotels, and retail stores. Freeport is also home to a number of manufacturing companies, including a paper mill, a boat builder, and a furniture maker.
Demographics
As of the 2010 census, there were 7,879 people, 3,093 households, and 2,072 families residing in the town. The population density was 717.3 people per square mile. The racial makeup of the town was 97.2% White, 0.7% African American, 0.3% Native American, 0.7% Asian, 0.1% Pacific Islander, 0.3% from other races, and 0.9% from two or more races. Hispanic or Latino of any race were 1.2% of the population.
The median income for a household in the town was $50,945, and the median income for a family was $62,917. The per capita income for the town was $27,945. About 4.3% of families and 6.3% of the population were below the poverty line, including 8.2% of those under age 18 and 4.2% of those age 65 or over.
Common Questions
What is Per Capita Income in Freeport?
Per Capita income in Freeport is $35,128.
What is the Median Family Income in Freeport?
Median Family Income in Freeport is $91,642.
What is the Median Household income in Freeport?
Median Household Income in Freeport is $76,012.
What is Income or Wage Gap in Freeport?
Income or Wage Gap in Freeport is 33.4%.
Women in Freeport earn 66.6 cents for every dollar earned by a man.
What is Inequality or Gini Index in Freeport?
Inequality or Gini Index in Freeport is 0.41.
What is the Total Population of Freeport?
Total Population of Freeport is 1,848.
What is the Total Male Population of Freeport?
Total Male Population of Freeport is 753.
What is the Total Female Population of Freeport?
Total Female Population of Freeport is 1,095.
What is the Ratio of Males per 100 Females in Freeport?
There are 68.77 Males per 100 Females in Freeport.
What is the Ratio of Females per 100 Males in Freeport?
There are 145.42 Females per 100 Males in Freeport.
What is the Median Population Age in Freeport?
Median Population Age in Freeport is 37.9 Years.
What is the Average Family Size in Freeport
Average Family Size in Freeport is 2.8 People.
What is the Average Household Size in Freeport
Average Household Size in Freeport is 2.2 People.
How Large is the Labor Force in Freeport?
There are 1,162 People in the Labor Forcein in Freeport.
What is the Percentage of People in the Labor Force in Freeport?
76.3% of People are in the Labor Force in Freeport.
What is the Unemployment Rate in Freeport?
Unemployment Rate in Freeport is 10.7%.