Fort Fairfield, ME
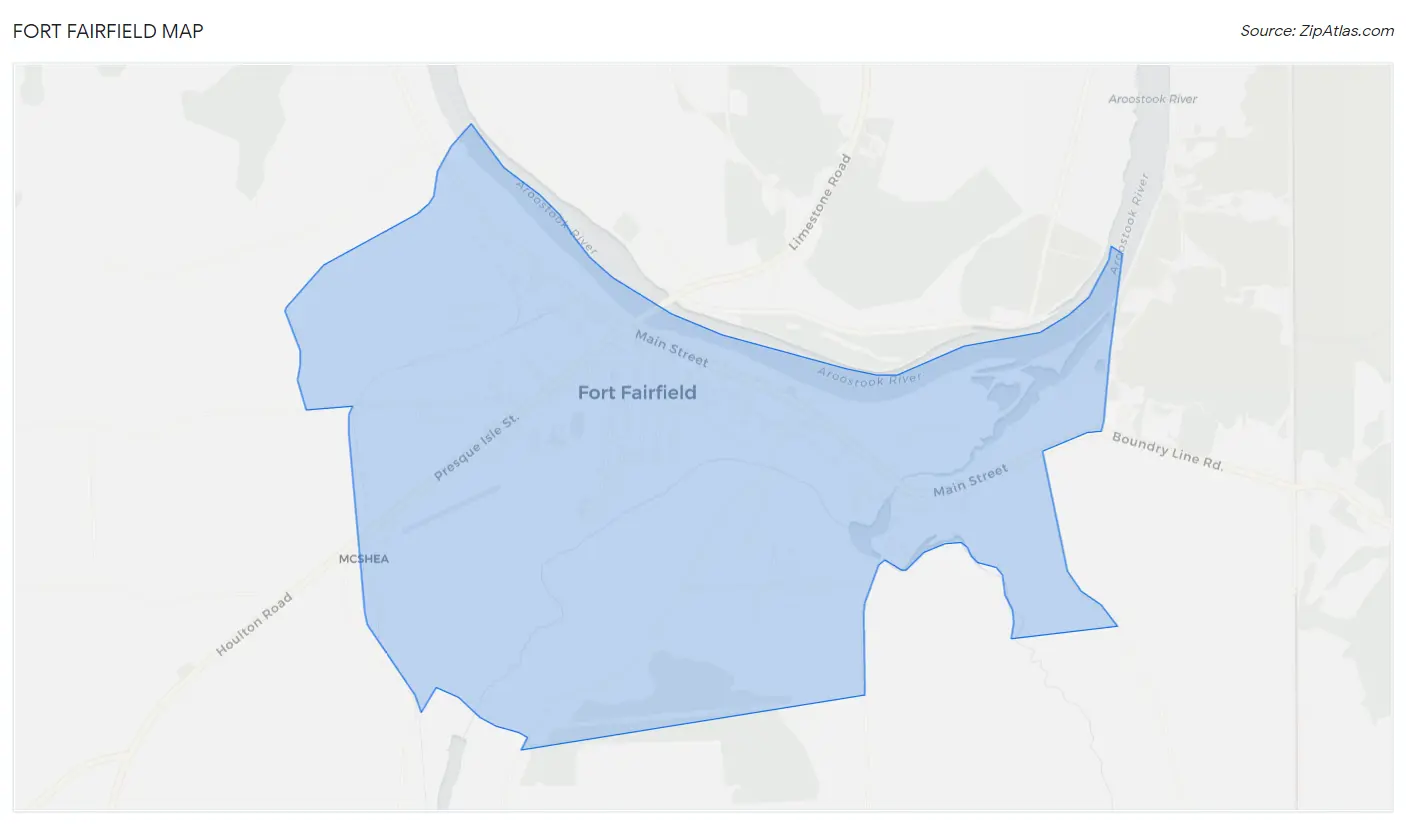
Fort Fairfield Map
Fort Fairfield Overview
1,566
TOTAL POPULATION
804
MALE POPULATION
762
FEMALE POPULATION
105.51
MALES / 100 FEMALES
94.78
FEMALES / 100 MALES
47.6
MEDIAN AGE
2.8
AVG FAMILY SIZE
2.3
AVG HOUSEHOLD SIZE
$28,202
PER CAPITA INCOME
$78,021
AVG FAMILY INCOME
$55,625
AVG HOUSEHOLD INCOME
13.5%
WAGE / INCOME GAP [ % ]
86.5¢/ $1
WAGE / INCOME GAP [ $ ]
0.35
INEQUALITY / GINI INDEX
657
LABOR FORCE [ PEOPLE ]
49.0%
PERCENT IN LABOR FORCE
13.7%
UNEMPLOYMENT RATE
Fort Fairfield Zip Codes
Fort Fairfield Area Codes
Race in Fort Fairfield
The most populous races in Fort Fairfield are White / Caucasian (1,496 | 95.5%), Two or more Races (44 | 2.8%), and Native / Alaskan (26 | 1.7%).
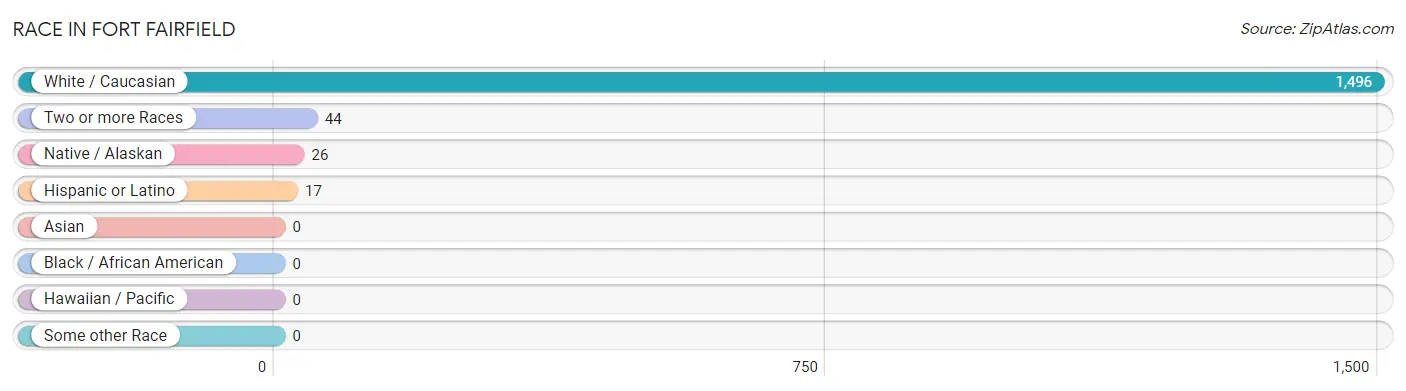
| Race | # Population | % Population |
| Asian | 0 | 0.0% |
| Black / African American | 0 | 0.0% |
| Hawaiian / Pacific | 0 | 0.0% |
| Hispanic or Latino | 17 | 1.1% |
| Native / Alaskan | 26 | 1.7% |
| White / Caucasian | 1,496 | 95.5% |
| Two or more Races | 44 | 2.8% |
| Some other Race | 0 | 0.0% |
| Total | 1,566 | 100.0% |
Ancestry in Fort Fairfield
The most populous ancestries reported in Fort Fairfield are English (428 | 27.3%), French (358 | 22.9%), Irish (216 | 13.8%), American (183 | 11.7%), and Canadian (169 | 10.8%), together accounting for 86.5% of all Fort Fairfield residents.
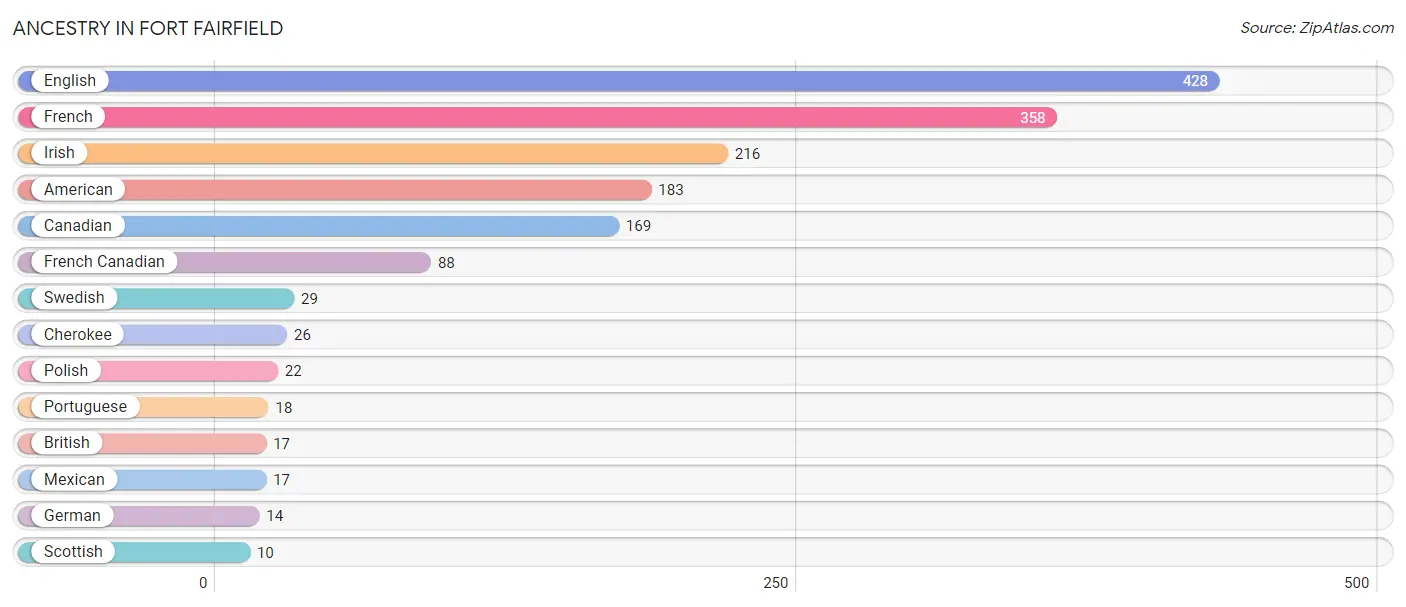
| Ancestry | # Population | % Population |
| American | 183 | 11.7% |
| British | 17 | 1.1% |
| Canadian | 169 | 10.8% |
| Cherokee | 26 | 1.7% |
| English | 428 | 27.3% |
| French | 358 | 22.9% |
| French Canadian | 88 | 5.6% |
| German | 14 | 0.9% |
| Irish | 216 | 13.8% |
| Mexican | 17 | 1.1% |
| Polish | 22 | 1.4% |
| Portuguese | 18 | 1.1% |
| Scottish | 10 | 0.6% |
| Swedish | 29 | 1.8% | View All 14 Rows |
Immigrants in Fort Fairfield
The most numerous immigrant groups reported in Fort Fairfield came from Canada (27 | 1.7%), Central America (12 | 0.8%), Latin America (12 | 0.8%), and Mexico (12 | 0.8%), together accounting for 4.0% of all Fort Fairfield residents.
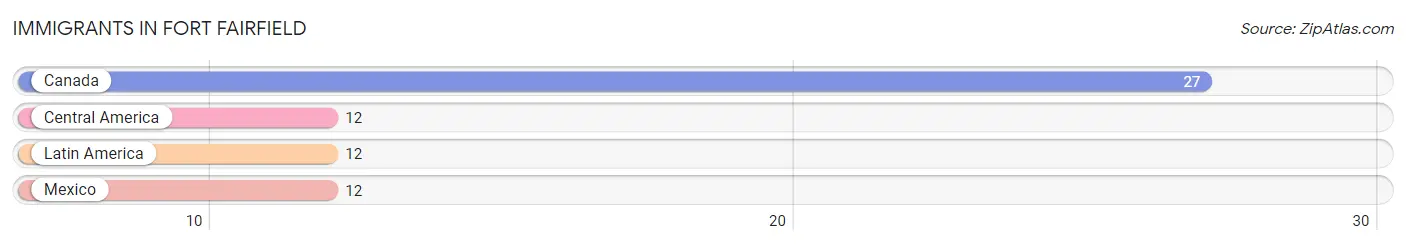
| Immigration Origin | # Population | % Population |
| Canada | 27 | 1.7% |
| Central America | 12 | 0.8% |
| Latin America | 12 | 0.8% |
| Mexico | 12 | 0.8% | View All 4 Rows |
Sex and Age in Fort Fairfield
Sex and Age in Fort Fairfield
The most populous age groups in Fort Fairfield are 45 to 49 Years (165 | 20.5%) for men and 60 to 64 Years (128 | 16.8%) for women.
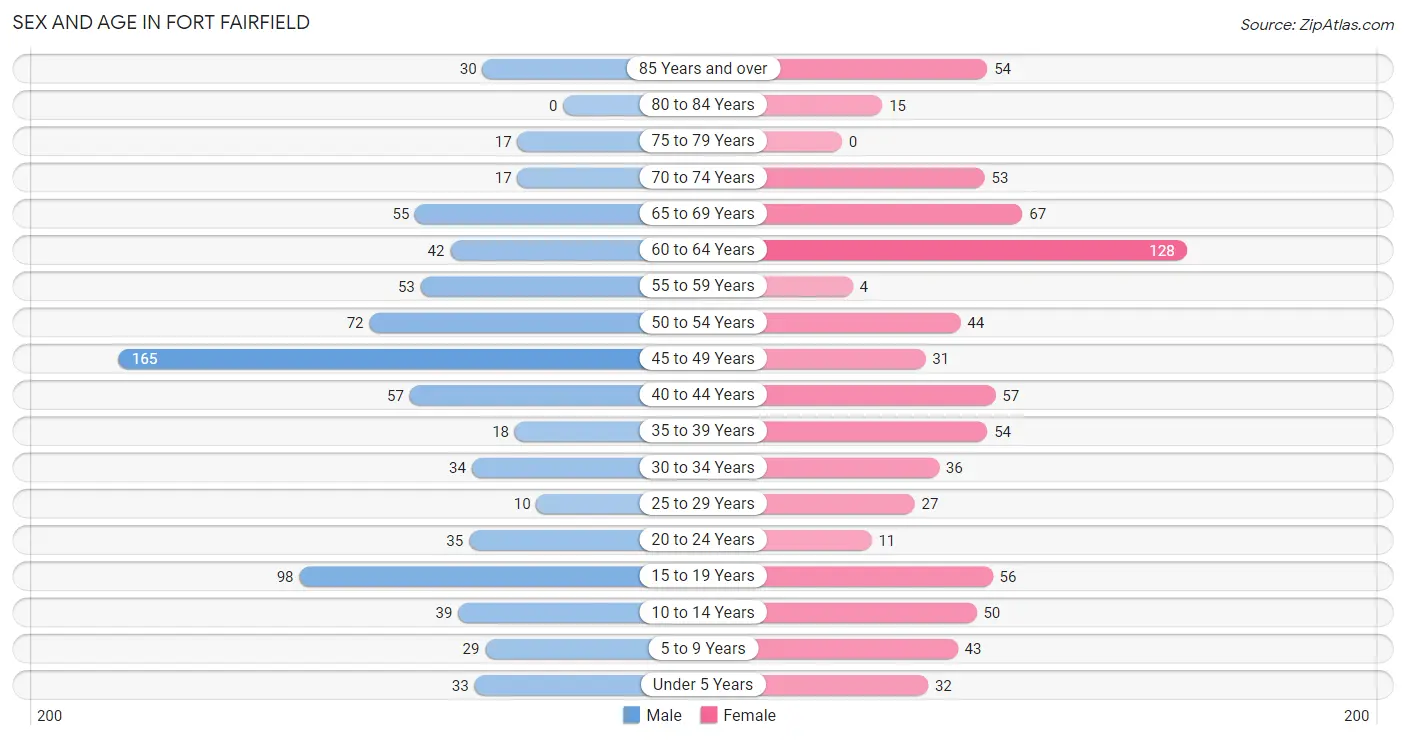
| Age Bracket | Male | Female |
| Under 5 Years | 33 (4.1%) | 32 (4.2%) |
| 5 to 9 Years | 29 (3.6%) | 43 (5.6%) |
| 10 to 14 Years | 39 (4.9%) | 50 (6.6%) |
| 15 to 19 Years | 98 (12.2%) | 56 (7.3%) |
| 20 to 24 Years | 35 (4.3%) | 11 (1.4%) |
| 25 to 29 Years | 10 (1.2%) | 27 (3.5%) |
| 30 to 34 Years | 34 (4.2%) | 36 (4.7%) |
| 35 to 39 Years | 18 (2.2%) | 54 (7.1%) |
| 40 to 44 Years | 57 (7.1%) | 57 (7.5%) |
| 45 to 49 Years | 165 (20.5%) | 31 (4.1%) |
| 50 to 54 Years | 72 (9.0%) | 44 (5.8%) |
| 55 to 59 Years | 53 (6.6%) | 4 (0.5%) |
| 60 to 64 Years | 42 (5.2%) | 128 (16.8%) |
| 65 to 69 Years | 55 (6.8%) | 67 (8.8%) |
| 70 to 74 Years | 17 (2.1%) | 53 (7.0%) |
| 75 to 79 Years | 17 (2.1%) | 0 (0.0%) |
| 80 to 84 Years | 0 (0.0%) | 15 (2.0%) |
| 85 Years and over | 30 (3.7%) | 54 (7.1%) |
| Total | 804 (100.0%) | 762 (100.0%) |
Families and Households in Fort Fairfield
Median Family Size in Fort Fairfield
The median family size in Fort Fairfield is 2.83 persons per family, with single male/father families (114 | 26.1%) accounting for the largest median family size of 3.48 persons per family. On the other hand, married-couple families (269 | 61.6%) represent the smallest median family size with 2.57 persons per family.
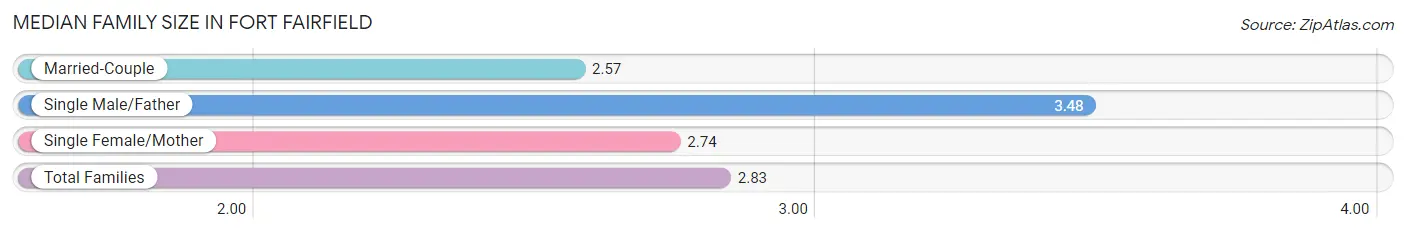
| Family Type | # Families | Family Size |
| Married-Couple | 269 (61.6%) | 2.57 |
| Single Male/Father | 114 (26.1%) | 3.48 |
| Single Female/Mother | 54 (12.4%) | 2.74 |
| Total Families | 437 (100.0%) | 2.83 |
Median Household Size in Fort Fairfield
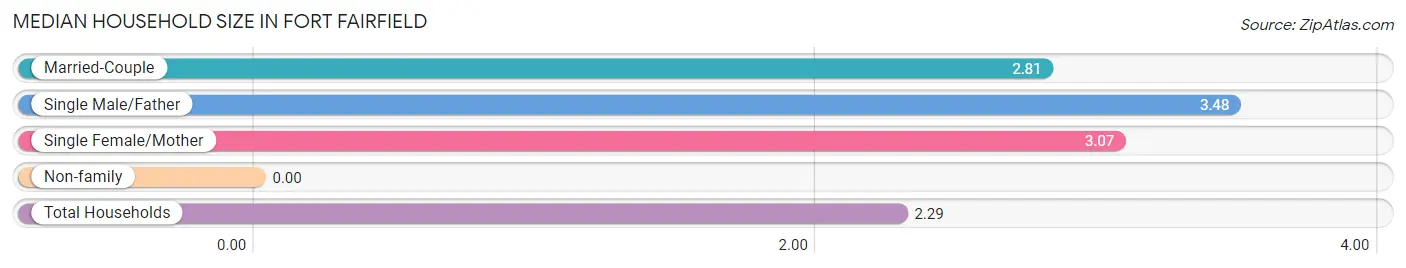
| Household Type | # Households | Household Size |
| Married-Couple | 269 (39.3%) | 2.81 |
| Single Male/Father | 114 (16.6%) | 3.48 |
| Single Female/Mother | 54 (7.9%) | 3.07 |
| Non-family | 248 (36.2%) | - |
| Total Households | 685 (100.0%) | 2.29 |
Household Size by Marriage Status in Fort Fairfield
Out of a total of 685 households in Fort Fairfield, 437 (63.8%) are family households, while 248 (36.2%) are nonfamily households. The most numerous type of family households are 3-person households, comprising 177, and the most common type of nonfamily households are 1-person households, comprising 248.
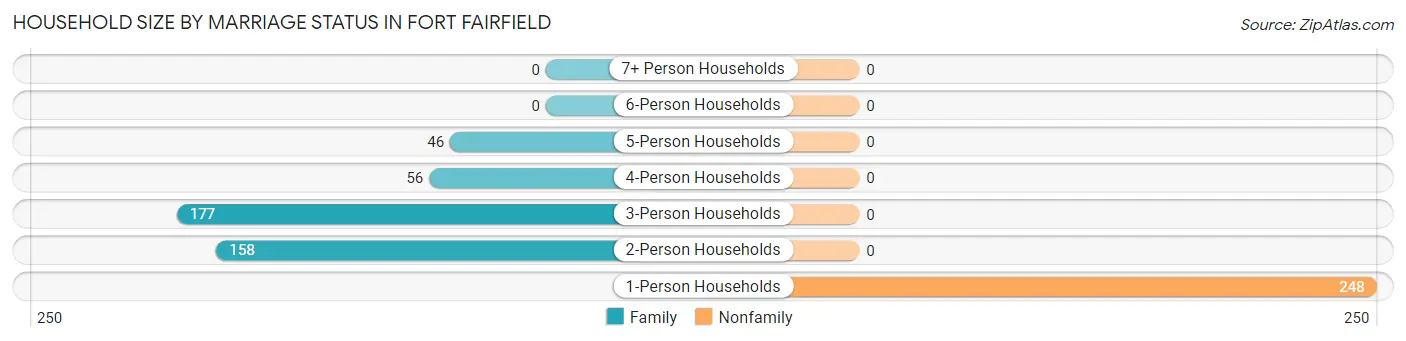
| Household Size | Family Households | Nonfamily Households |
| 1-Person Households | - | 248 (36.2%) |
| 2-Person Households | 158 (23.1%) | 0 (0.0%) |
| 3-Person Households | 177 (25.8%) | 0 (0.0%) |
| 4-Person Households | 56 (8.2%) | 0 (0.0%) |
| 5-Person Households | 46 (6.7%) | 0 (0.0%) |
| 6-Person Households | 0 (0.0%) | 0 (0.0%) |
| 7+ Person Households | 0 (0.0%) | 0 (0.0%) |
| Total | 437 (63.8%) | 248 (36.2%) |
Female Fertility in Fort Fairfield
Fertility by Age in Fort Fairfield
Average fertility rate in Fort Fairfield is 44.0 births per 1,000 women. Women in the age bracket of 20 to 34 years have the highest fertility rate with 176.0 births per 1,000 women. Women in the age bracket of 20 to 34 years acount for 100.0% of all women with births.
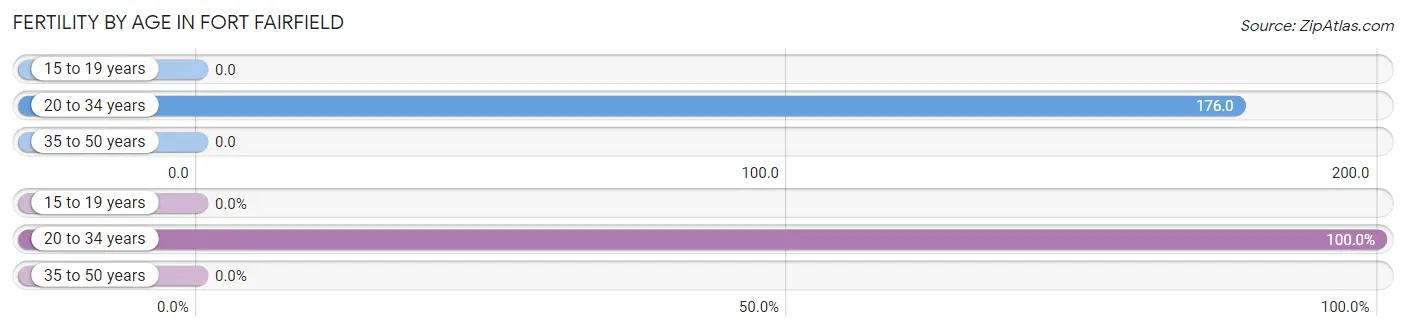
| Age Bracket | Women with Births | Births / 1,000 Women |
| 15 to 19 years | 0 (0.0%) | 0.0 |
| 20 to 34 years | 13 (100.0%) | 176.0 |
| 35 to 50 years | 0 (0.0%) | 0.0 |
| Total | 13 (100.0%) | 44.0 |
Fertility by Age by Marriage Status in Fort Fairfield
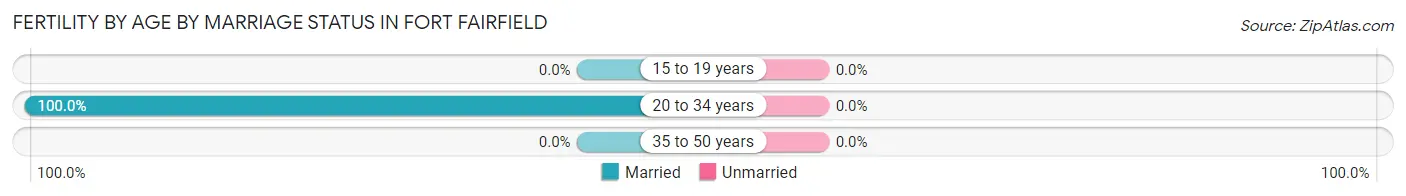
| Age Bracket | Married | Unmarried |
| 15 to 19 years | 0 (0.0%) | 0 (0.0%) |
| 20 to 34 years | 13 (100.0%) | 0 (0.0%) |
| 35 to 50 years | 0 (0.0%) | 0 (0.0%) |
| Total | 13 (100.0%) | 0 (0.0%) |
Fertility by Education in Fort Fairfield
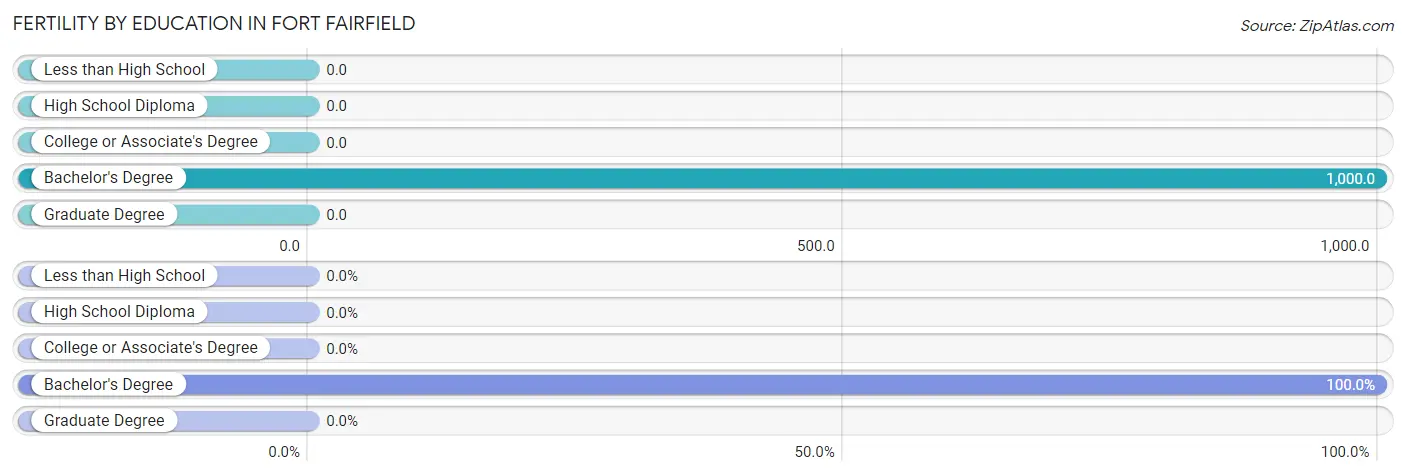
| Educational Attainment | Women with Births | Births / 1,000 Women |
| Less than High School | 0 (0.0%) | 0.0 |
| High School Diploma | 0 (0.0%) | 0.0 |
| College or Associate's Degree | 0 (0.0%) | 0.0 |
| Bachelor's Degree | 13 (100.0%) | 1,000.0 |
| Graduate Degree | 0 (0.0%) | 0.0 |
| Total | 13 (100.0%) | 44.0 |
Fertility by Education by Marriage Status in Fort Fairfield
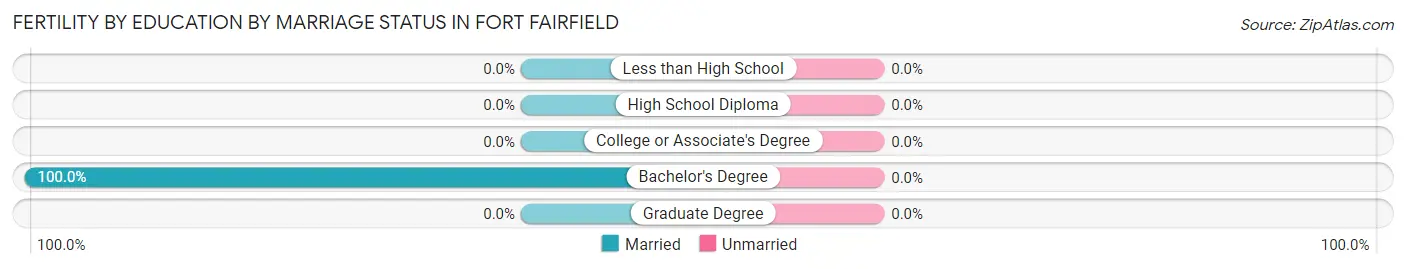
| Educational Attainment | Married | Unmarried |
| Less than High School | 0 (0.0%) | 0 (0.0%) |
| High School Diploma | 0 (0.0%) | 0 (0.0%) |
| College or Associate's Degree | 0 (0.0%) | 0 (0.0%) |
| Bachelor's Degree | 13 (100.0%) | 0 (0.0%) |
| Graduate Degree | 0 (0.0%) | 0 (0.0%) |
| Total | 13 (100.0%) | 0 (0.0%) |
Income in Fort Fairfield
Income Overview in Fort Fairfield
Per Capita Income in Fort Fairfield is $28,202, while median incomes of families and households are $78,021 and $55,625 respectively.
| Characteristic | Number | Measure |
| Per Capita Income | 1,566 | $28,202 |
| Median Family Income | 437 | $78,021 |
| Mean Family Income | 437 | $75,578 |
| Median Household Income | 685 | $55,625 |
| Mean Household Income | 685 | $61,525 |
| Income Deficit | 437 | $0 |
| Wage / Income Gap (%) | 1,566 | 13.46% |
| Wage / Income Gap ($) | 1,566 | 86.54¢ per $1 |
| Gini / Inequality Index | 1,566 | 0.35 |
Earnings by Sex in Fort Fairfield
Average Earnings in Fort Fairfield are $38,069, $33,796 for men and $39,051 for women, a difference of 13.5%.
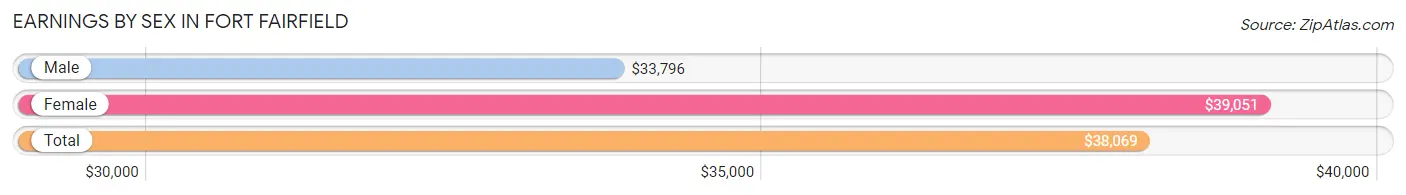
| Sex | Number | Average Earnings |
| Male | 400 (62.0%) | $33,796 |
| Female | 245 (38.0%) | $39,051 |
| Total | 645 (100.0%) | $38,069 |
Earnings by Sex by Income Bracket in Fort Fairfield
The most common earnings brackets in Fort Fairfield are $25,000 to $29,999 for men (64 | 16.0%) and $35,000 to $39,999 for women (65 | 26.5%).
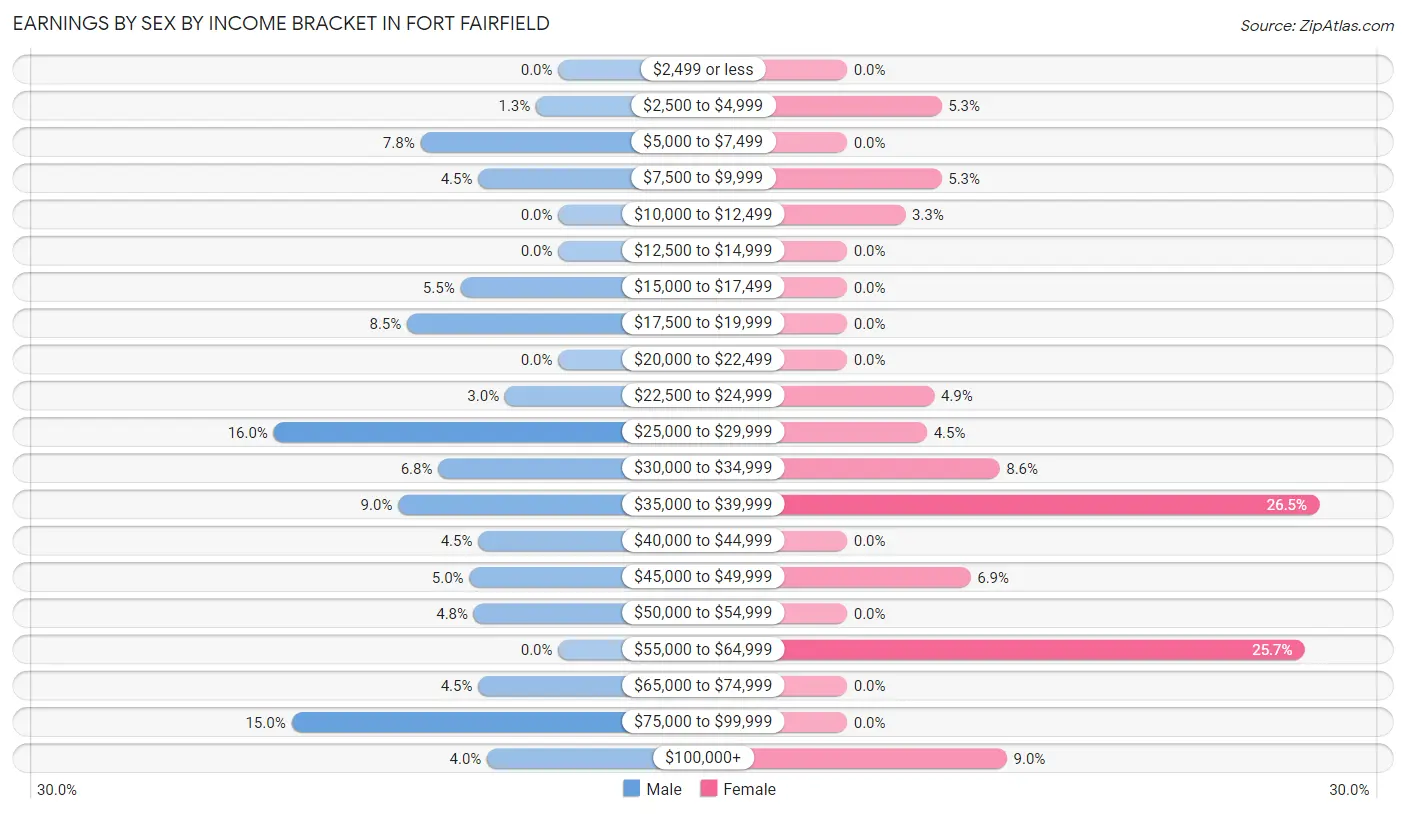
| Income | Male | Female |
| $2,499 or less | 0 (0.0%) | 0 (0.0%) |
| $2,500 to $4,999 | 5 (1.3%) | 13 (5.3%) |
| $5,000 to $7,499 | 31 (7.7%) | 0 (0.0%) |
| $7,500 to $9,999 | 18 (4.5%) | 13 (5.3%) |
| $10,000 to $12,499 | 0 (0.0%) | 8 (3.3%) |
| $12,500 to $14,999 | 0 (0.0%) | 0 (0.0%) |
| $15,000 to $17,499 | 22 (5.5%) | 0 (0.0%) |
| $17,500 to $19,999 | 34 (8.5%) | 0 (0.0%) |
| $20,000 to $22,499 | 0 (0.0%) | 0 (0.0%) |
| $22,500 to $24,999 | 12 (3.0%) | 12 (4.9%) |
| $25,000 to $29,999 | 64 (16.0%) | 11 (4.5%) |
| $30,000 to $34,999 | 27 (6.8%) | 21 (8.6%) |
| $35,000 to $39,999 | 36 (9.0%) | 65 (26.5%) |
| $40,000 to $44,999 | 18 (4.5%) | 0 (0.0%) |
| $45,000 to $49,999 | 20 (5.0%) | 17 (6.9%) |
| $50,000 to $54,999 | 19 (4.8%) | 0 (0.0%) |
| $55,000 to $64,999 | 0 (0.0%) | 63 (25.7%) |
| $65,000 to $74,999 | 18 (4.5%) | 0 (0.0%) |
| $75,000 to $99,999 | 60 (15.0%) | 0 (0.0%) |
| $100,000+ | 16 (4.0%) | 22 (9.0%) |
| Total | 400 (100.0%) | 245 (100.0%) |
Earnings by Sex by Educational Attainment in Fort Fairfield
Average earnings in Fort Fairfield are $37,813 for men and $39,306 for women, a difference of 3.8%. Men with an educational attainment of bachelor's degree enjoy the highest average annual earnings of $83,271, while those with high school diploma education earn the least with $28,516. Women with an educational attainment of college or associate's degree earn the most with the average annual earnings of $38,649, while those with college or associate's degree education have the smallest earnings of $38,649.
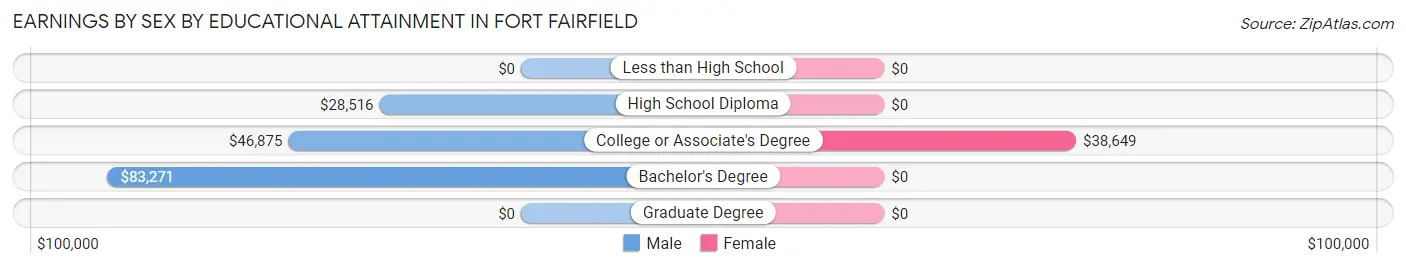
| Educational Attainment | Male Income | Female Income |
| Less than High School | - | - |
| High School Diploma | $28,516 | $0 |
| College or Associate's Degree | $46,875 | $38,649 |
| Bachelor's Degree | $83,271 | $0 |
| Graduate Degree | - | - |
| Total | $37,813 | $39,306 |
Family Income in Fort Fairfield
Family Income Brackets in Fort Fairfield
According to the Fort Fairfield family income data, there are 200 families falling into the $75,000 to $99,999 income range, which is the most common income bracket and makes up 45.8% of all families.
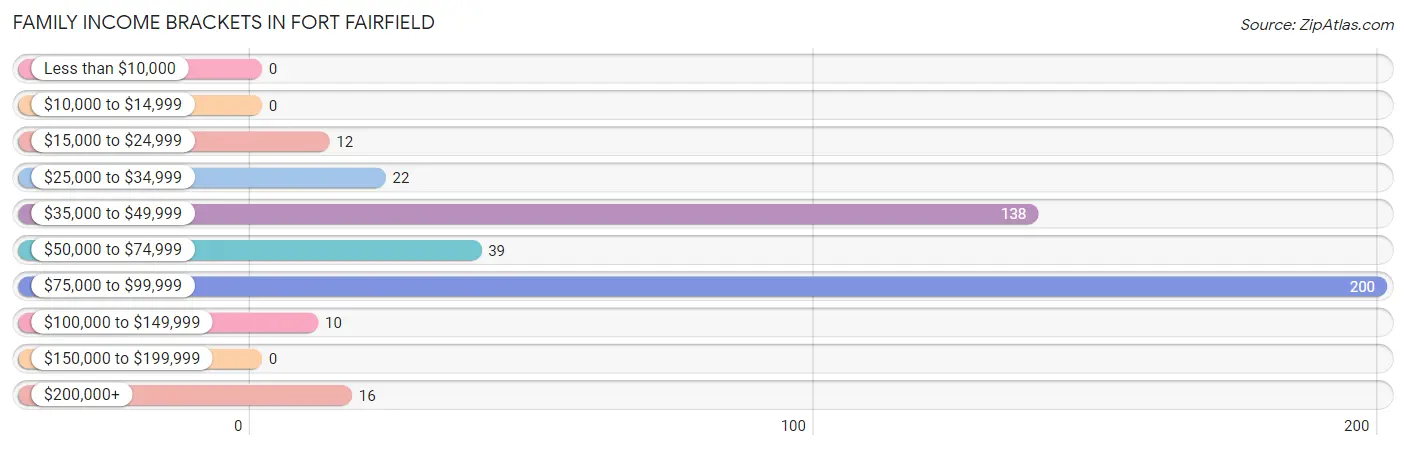
| Income Bracket | # Families | % Families |
| Less than $10,000 | 0 | 0.0% |
| $10,000 to $14,999 | 0 | 0.0% |
| $15,000 to $24,999 | 12 | 2.7% |
| $25,000 to $34,999 | 22 | 5.0% |
| $35,000 to $49,999 | 138 | 31.6% |
| $50,000 to $74,999 | 39 | 8.9% |
| $75,000 to $99,999 | 200 | 45.8% |
| $100,000 to $149,999 | 10 | 2.3% |
| $150,000 to $199,999 | 0 | 0.0% |
| $200,000+ | 16 | 3.7% |
Family Income by Famaliy Size in Fort Fairfield
3-person families (225 | 51.5%) account for the highest median family income in Fort Fairfield with $79,549 per family, while 2-person families (158 | 36.2%) have the highest median income of $35,860 per family member.
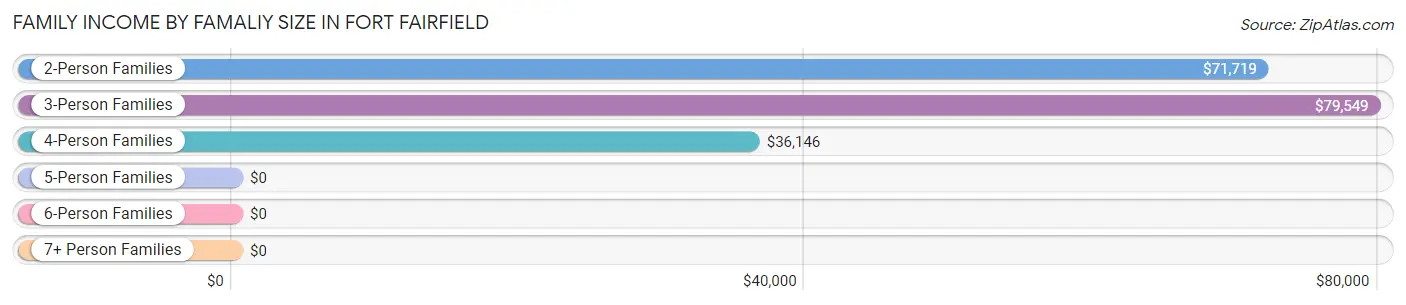
| Income Bracket | # Families | Median Income |
| 2-Person Families | 158 (36.2%) | $71,719 |
| 3-Person Families | 225 (51.5%) | $79,549 |
| 4-Person Families | 44 (10.1%) | $36,146 |
| 5-Person Families | 10 (2.3%) | $0 |
| 6-Person Families | 0 (0.0%) | $0 |
| 7+ Person Families | 0 (0.0%) | $0 |
| Total | 437 (100.0%) | $78,021 |
Family Income by Number of Earners in Fort Fairfield
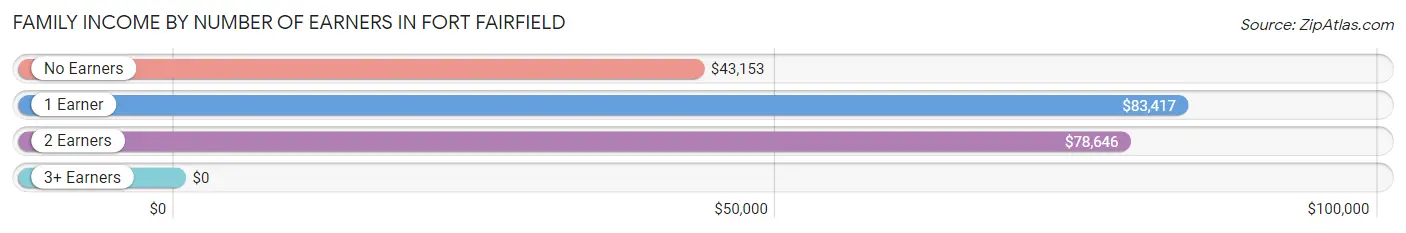
| Number of Earners | # Families | Median Income |
| No Earners | 131 (30.0%) | $43,153 |
| 1 Earner | 172 (39.4%) | $83,417 |
| 2 Earners | 113 (25.9%) | $78,646 |
| 3+ Earners | 21 (4.8%) | $0 |
| Total | 437 (100.0%) | $78,021 |
Household Income in Fort Fairfield
Household Income Brackets in Fort Fairfield
With 200 households falling in the category, the $75,000 to $99,999 income range is the most frequent in Fort Fairfield, accounting for 29.2% of all households.
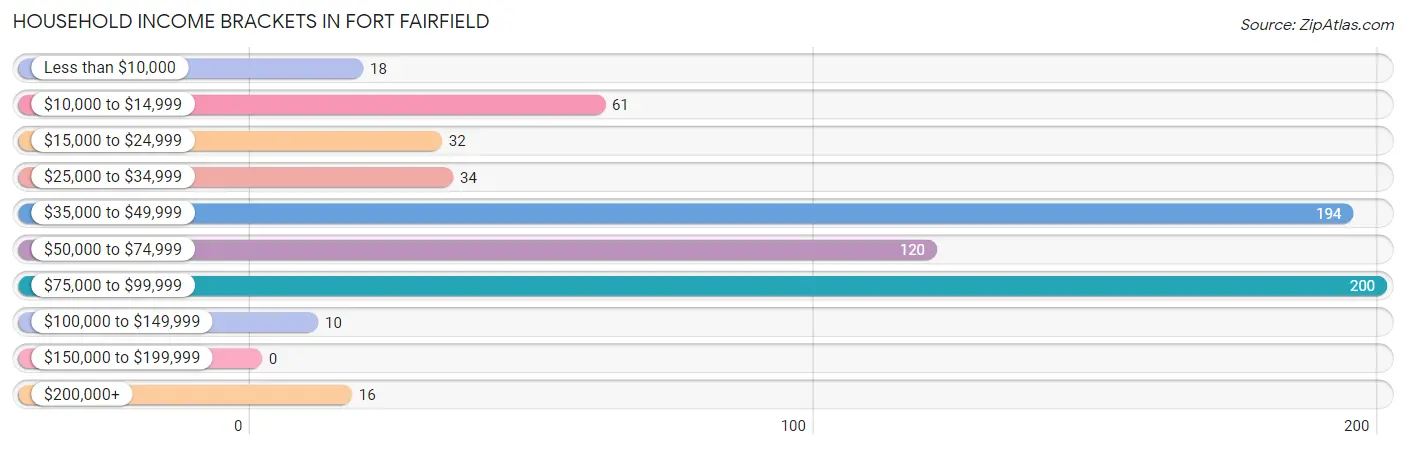
| Income Bracket | # Households | % Households |
| Less than $10,000 | 18 | 2.6% |
| $10,000 to $14,999 | 61 | 8.9% |
| $15,000 to $24,999 | 32 | 4.7% |
| $25,000 to $34,999 | 34 | 5.0% |
| $35,000 to $49,999 | 194 | 28.3% |
| $50,000 to $74,999 | 120 | 17.5% |
| $75,000 to $99,999 | 200 | 29.2% |
| $100,000 to $149,999 | 10 | 1.5% |
| $150,000 to $199,999 | 0 | 0.0% |
| $200,000+ | 16 | 2.3% |
Household Income by Householder Age in Fort Fairfield
The median household income in Fort Fairfield is $55,625, with the highest median household income of $70,547 found in the 65+ years age bracket for the primary householder. A total of 179 households (26.1%) fall into this category.
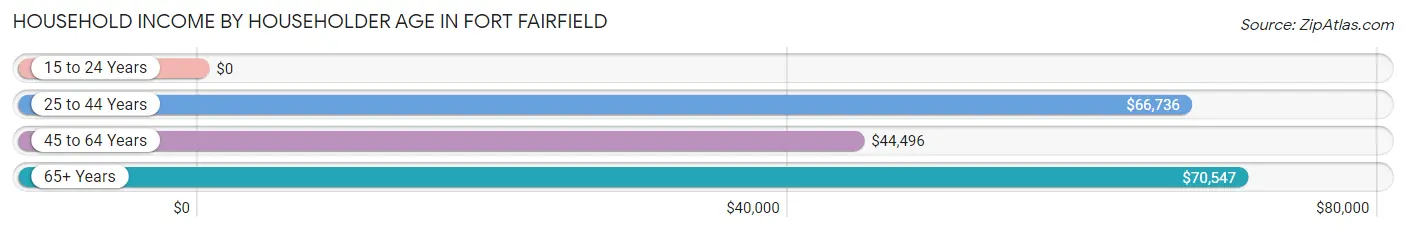
| Income Bracket | # Households | Median Income |
| 15 to 24 Years | 0 (0.0%) | $0 |
| 25 to 44 Years | 157 (22.9%) | $66,736 |
| 45 to 64 Years | 349 (50.9%) | $44,496 |
| 65+ Years | 179 (26.1%) | $70,547 |
| Total | 685 (100.0%) | $55,625 |
Poverty in Fort Fairfield
Income Below Poverty by Sex and Age in Fort Fairfield
With 6.6% poverty level for males and 11.9% for females among the residents of Fort Fairfield, 35 to 44 year old males and 45 to 54 year old females are the most vulnerable to poverty, with 18 males (24.0%) and 44 females (58.7%) in their respective age groups living below the poverty level.
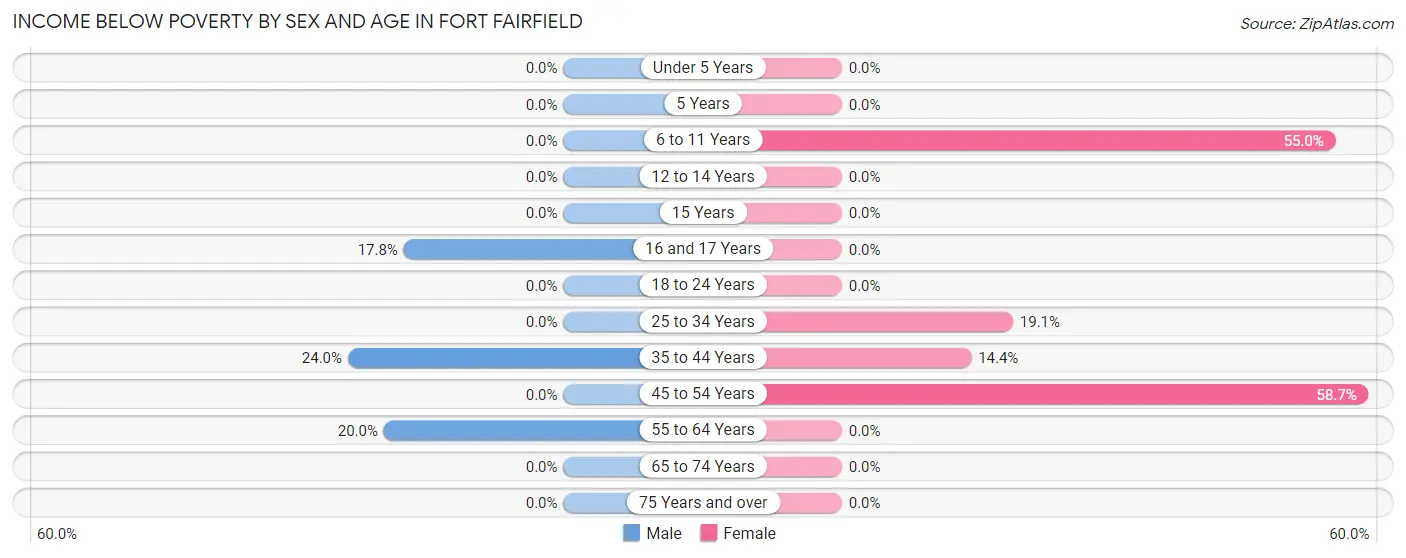
| Age Bracket | Male | Female |
| Under 5 Years | 0 (0.0%) | 0 (0.0%) |
| 5 Years | 0 (0.0%) | 0 (0.0%) |
| 6 to 11 Years | 0 (0.0%) | 11 (55.0%) |
| 12 to 14 Years | 0 (0.0%) | 0 (0.0%) |
| 15 Years | 0 (0.0%) | 0 (0.0%) |
| 16 and 17 Years | 16 (17.8%) | 0 (0.0%) |
| 18 to 24 Years | 0 (0.0%) | 0 (0.0%) |
| 25 to 34 Years | 0 (0.0%) | 12 (19.1%) |
| 35 to 44 Years | 18 (24.0%) | 16 (14.4%) |
| 45 to 54 Years | 0 (0.0%) | 44 (58.7%) |
| 55 to 64 Years | 19 (20.0%) | 0 (0.0%) |
| 65 to 74 Years | 0 (0.0%) | 0 (0.0%) |
| 75 Years and over | 0 (0.0%) | 0 (0.0%) |
| Total | 53 (6.6%) | 83 (11.9%) |
Income Above Poverty by Sex and Age in Fort Fairfield
According to the poverty statistics in Fort Fairfield, males aged under 5 years and females aged under 5 years are the age groups that are most secure financially, with 100.0% of males and 100.0% of females in these age groups living above the poverty line.
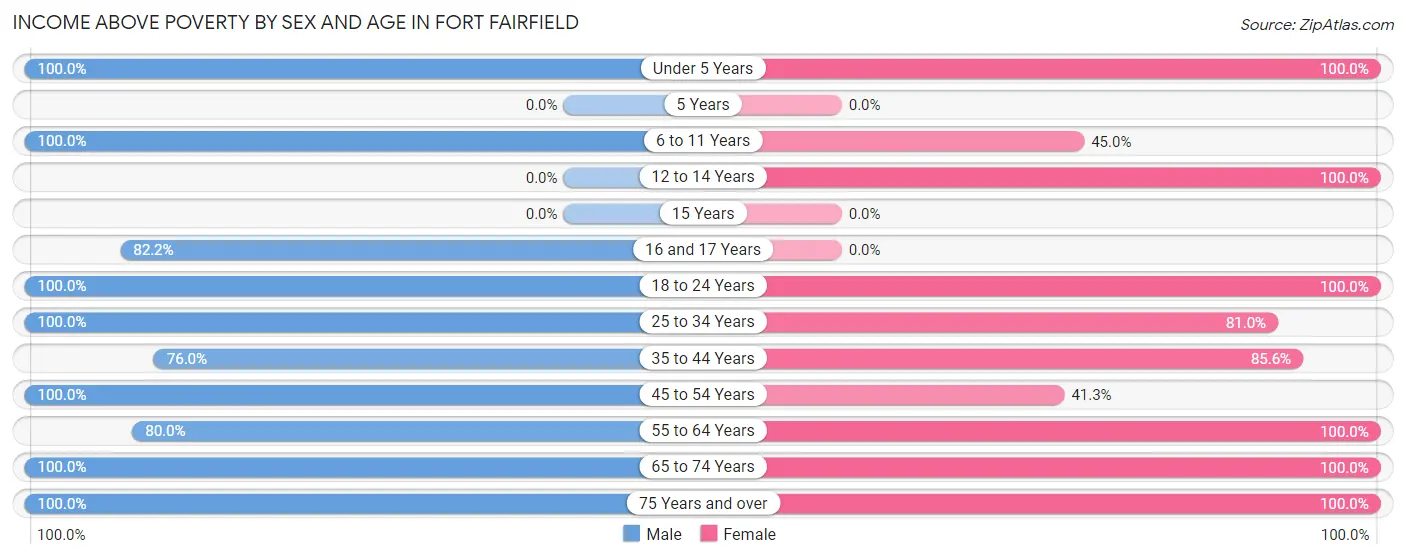
| Age Bracket | Male | Female |
| Under 5 Years | 33 (100.0%) | 32 (100.0%) |
| 5 Years | 0 (0.0%) | 0 (0.0%) |
| 6 to 11 Years | 68 (100.0%) | 9 (45.0%) |
| 12 to 14 Years | 0 (0.0%) | 9 (100.0%) |
| 15 Years | 0 (0.0%) | 0 (0.0%) |
| 16 and 17 Years | 74 (82.2%) | 0 (0.0%) |
| 18 to 24 Years | 43 (100.0%) | 67 (100.0%) |
| 25 to 34 Years | 44 (100.0%) | 51 (80.9%) |
| 35 to 44 Years | 57 (76.0%) | 95 (85.6%) |
| 45 to 54 Years | 237 (100.0%) | 31 (41.3%) |
| 55 to 64 Years | 76 (80.0%) | 132 (100.0%) |
| 65 to 74 Years | 72 (100.0%) | 120 (100.0%) |
| 75 Years and over | 47 (100.0%) | 69 (100.0%) |
| Total | 751 (93.4%) | 615 (88.1%) |
Income Below Poverty Among Married-Couple Families in Fort Fairfield
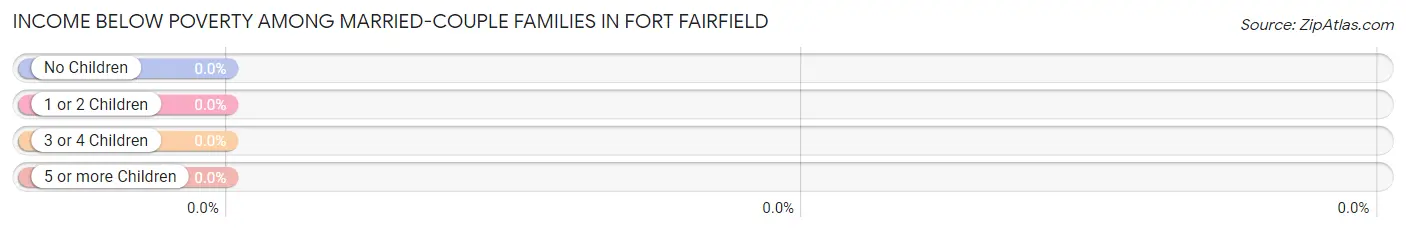
| Children | Above Poverty | Below Poverty |
| No Children | 140 (100.0%) | 0 (0.0%) |
| 1 or 2 Children | 119 (100.0%) | 0 (0.0%) |
| 3 or 4 Children | 10 (100.0%) | 0 (0.0%) |
| 5 or more Children | 0 (0.0%) | 0 (0.0%) |
| Total | 269 (100.0%) | 0 (0.0%) |
Income Below Poverty Among Single-Parent Households in Fort Fairfield
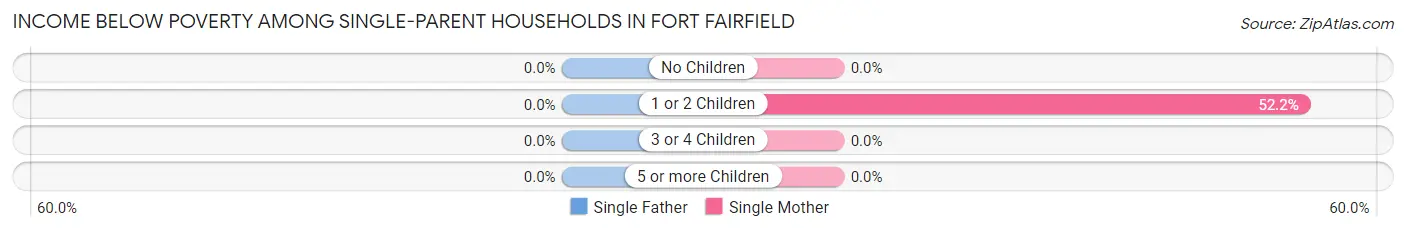
| Children | Single Father | Single Mother |
| No Children | 0 (0.0%) | 0 (0.0%) |
| 1 or 2 Children | 0 (0.0%) | 12 (52.2%) |
| 3 or 4 Children | 0 (0.0%) | 0 (0.0%) |
| 5 or more Children | 0 (0.0%) | 0 (0.0%) |
| Total | 0 (0.0%) | 12 (22.2%) |
Income Below Poverty Among Married-Couple vs Single-Parent Households in Fort Fairfield
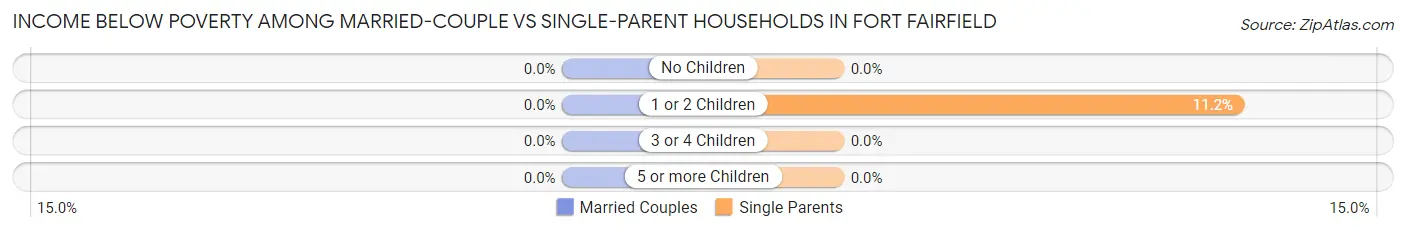
| Children | Married-Couple Families | Single-Parent Households |
| No Children | 0 (0.0%) | 0 (0.0%) |
| 1 or 2 Children | 0 (0.0%) | 12 (11.2%) |
| 3 or 4 Children | 0 (0.0%) | 0 (0.0%) |
| 5 or more Children | 0 (0.0%) | 0 (0.0%) |
| Total | 0 (0.0%) | 12 (7.1%) |
Employment Characteristics in Fort Fairfield
Employment by Class of Employer in Fort Fairfield
Among the 567 employed individuals in Fort Fairfield, private company employees (409 | 72.1%), not-for-profit organizations (79 | 13.9%), and federal government employees (61 | 10.8%) make up the most common classes of employment.
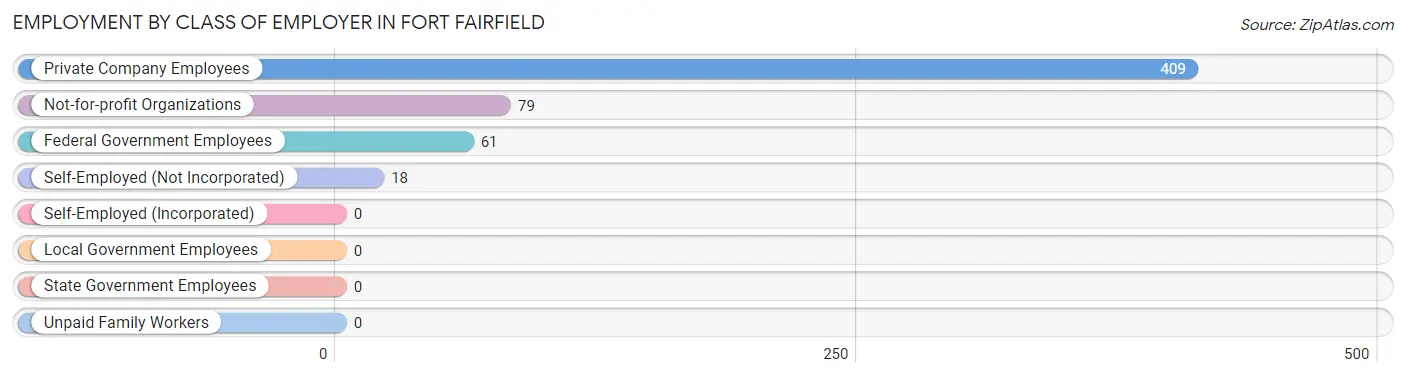
| Employer Class | # Employees | % Employees |
| Private Company Employees | 409 | 72.1% |
| Self-Employed (Incorporated) | 0 | 0.0% |
| Self-Employed (Not Incorporated) | 18 | 3.2% |
| Not-for-profit Organizations | 79 | 13.9% |
| Local Government Employees | 0 | 0.0% |
| State Government Employees | 0 | 0.0% |
| Federal Government Employees | 61 | 10.8% |
| Unpaid Family Workers | 0 | 0.0% |
| Total | 567 | 100.0% |
Employment Status by Age in Fort Fairfield
According to the labor force statistics for Fort Fairfield, out of the total population over 16 years of age (1,340), 49.0% or 657 individuals are in the labor force, with 13.7% or 90 of them unemployed. The age group with the highest labor force participation rate is 35 to 44 years, with 91.4% or 170 individuals in the labor force. Within the labor force, the 65 to 74 years age range has the highest percentage of unemployed individuals, with 36.1% or 13 of them being unemployed.
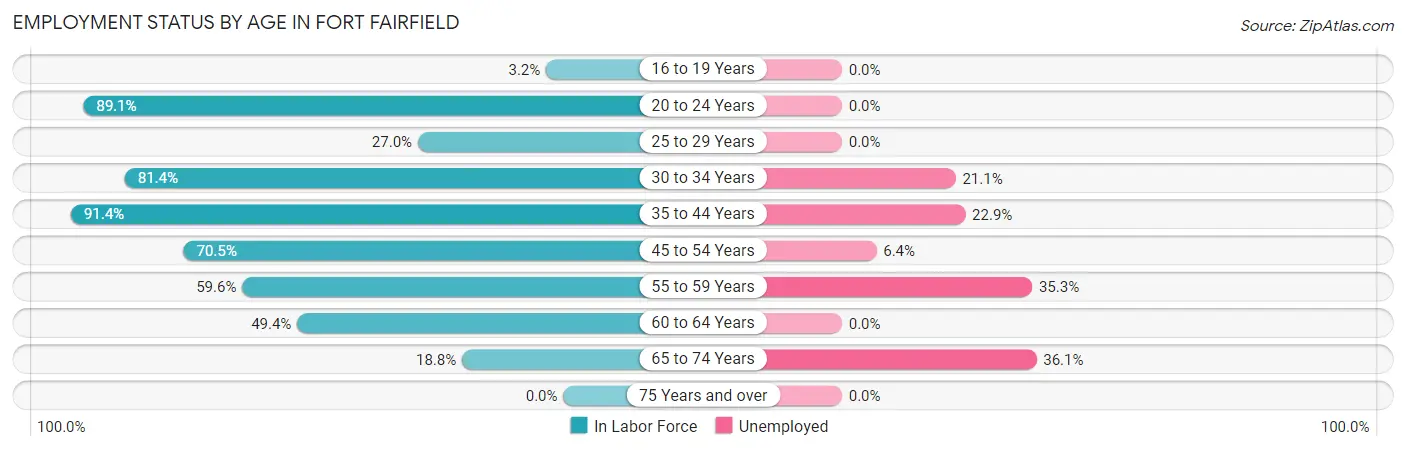
| Age Bracket | In Labor Force | Unemployed |
| 16 to 19 Years | 5 (3.2%) | 0 (0.0%) |
| 20 to 24 Years | 41 (89.1%) | 0 (0.0%) |
| 25 to 29 Years | 10 (27.0%) | 0 (0.0%) |
| 30 to 34 Years | 57 (81.4%) | 12 (21.1%) |
| 35 to 44 Years | 170 (91.4%) | 39 (22.9%) |
| 45 to 54 Years | 220 (70.5%) | 14 (6.4%) |
| 55 to 59 Years | 34 (59.6%) | 12 (35.3%) |
| 60 to 64 Years | 84 (49.4%) | 0 (0.0%) |
| 65 to 74 Years | 36 (18.8%) | 13 (36.1%) |
| 75 Years and over | 0 (0.0%) | 0 (0.0%) |
| Total | 657 (49.0%) | 90 (13.7%) |
Employment Status by Educational Attainment in Fort Fairfield
According to labor force statistics for Fort Fairfield, 69.1% of individuals (575) out of the total population between 25 and 64 years of age (832) are in the labor force, with 13.4% or 77 of them being unemployed. The group with the highest labor force participation rate are those with the educational attainment of bachelor's degree or higher, with 92.3% or 205 individuals in the labor force. Within the labor force, individuals with less than high school education have the highest percentage of unemployment, with 100.0% or 30 of them being unemployed.
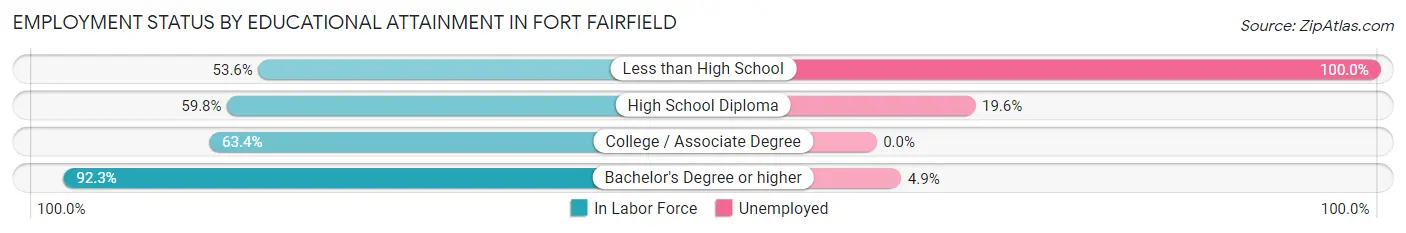
| Educational Attainment | In Labor Force | Unemployed |
| Less than High School | 30 (53.6%) | 56 (100.0%) |
| High School Diploma | 189 (59.8%) | 62 (19.6%) |
| College / Associate Degree | 151 (63.4%) | 0 (0.0%) |
| Bachelor's Degree or higher | 205 (92.3%) | 11 (4.9%) |
| Total | 575 (69.1%) | 111 (13.4%) |
Employment Occupations by Sex in Fort Fairfield
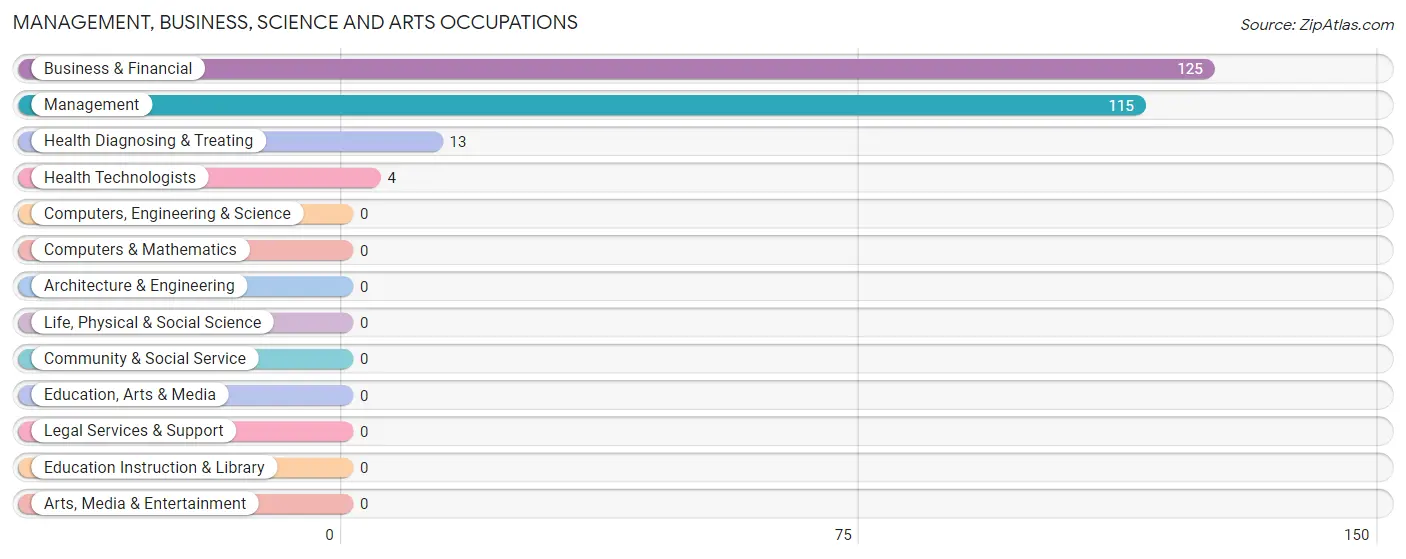
Management, Business, Science and Arts Occupations
The most common Management, Business, Science and Arts occupations in Fort Fairfield are Business & Financial (125 | 22.1%), Management (115 | 20.3%), Health Diagnosing & Treating (13 | 2.3%), and Health Technologists (4 | 0.7%).
Management, Business, Science and Arts Occupations by Sex
Within the Management, Business, Science and Arts occupations in Fort Fairfield, the most male-oriented occupations are Health Diagnosing & Treating (100.0%), Health Technologists (100.0%), and Business & Financial (86.4%), while the most female-oriented occupations are Management (63.5%), and Business & Financial (13.6%).
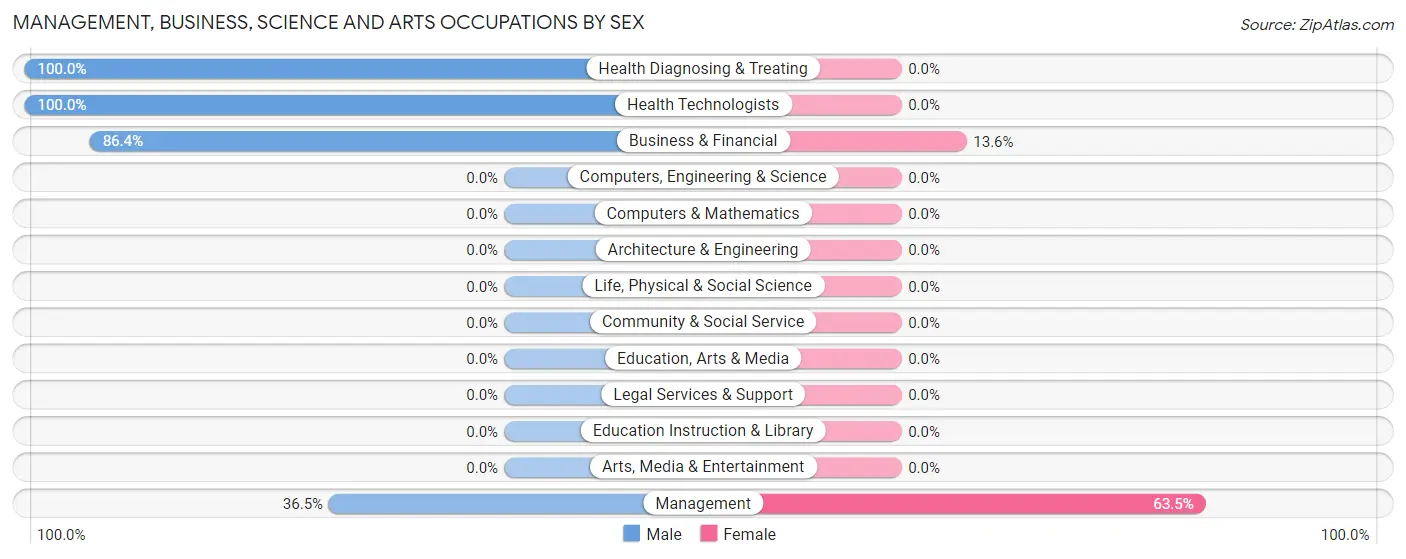
| Occupation | Male | Female |
| Management | 42 (36.5%) | 73 (63.5%) |
| Business & Financial | 108 (86.4%) | 17 (13.6%) |
| Computers, Engineering & Science | 0 (0.0%) | 0 (0.0%) |
| Computers & Mathematics | 0 (0.0%) | 0 (0.0%) |
| Architecture & Engineering | 0 (0.0%) | 0 (0.0%) |
| Life, Physical & Social Science | 0 (0.0%) | 0 (0.0%) |
| Community & Social Service | 0 (0.0%) | 0 (0.0%) |
| Education, Arts & Media | 0 (0.0%) | 0 (0.0%) |
| Legal Services & Support | 0 (0.0%) | 0 (0.0%) |
| Education Instruction & Library | 0 (0.0%) | 0 (0.0%) |
| Arts, Media & Entertainment | 0 (0.0%) | 0 (0.0%) |
| Health Diagnosing & Treating | 13 (100.0%) | 0 (0.0%) |
| Health Technologists | 4 (100.0%) | 0 (0.0%) |
| Total (Category) | 163 (64.4%) | 90 (35.6%) |
| Total (Overall) | 360 (63.5%) | 207 (36.5%) |
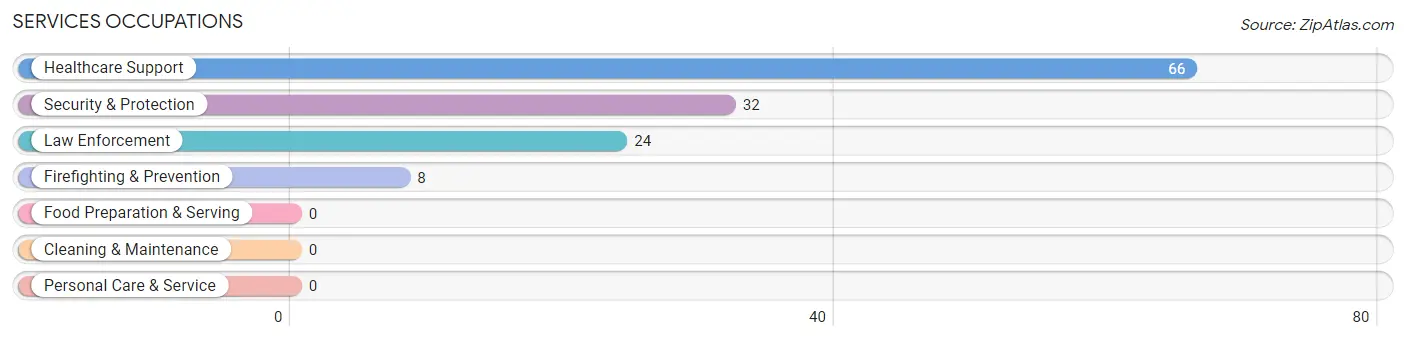
Services Occupations
The most common Services occupations in Fort Fairfield are Healthcare Support (66 | 11.6%), Security & Protection (32 | 5.6%), Law Enforcement (24 | 4.2%), and Firefighting & Prevention (8 | 1.4%).
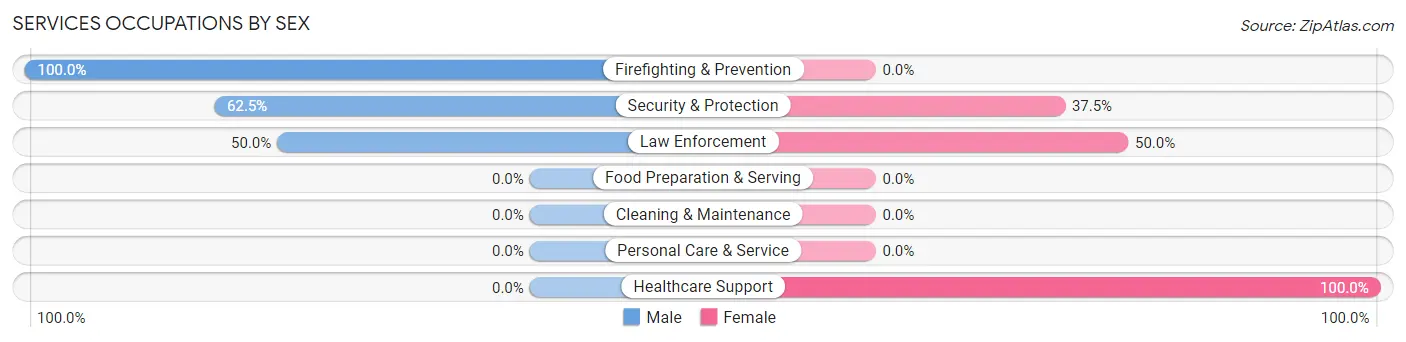
Services Occupations by Sex
Within the Services occupations in Fort Fairfield, the most male-oriented occupations are Firefighting & Prevention (100.0%), Security & Protection (62.5%), and Law Enforcement (50.0%), while the most female-oriented occupations are Healthcare Support (100.0%), Law Enforcement (50.0%), and Security & Protection (37.5%).
| Occupation | Male | Female |
| Healthcare Support | 0 (0.0%) | 66 (100.0%) |
| Security & Protection | 20 (62.5%) | 12 (37.5%) |
| Firefighting & Prevention | 8 (100.0%) | 0 (0.0%) |
| Law Enforcement | 12 (50.0%) | 12 (50.0%) |
| Food Preparation & Serving | 0 (0.0%) | 0 (0.0%) |
| Cleaning & Maintenance | 0 (0.0%) | 0 (0.0%) |
| Personal Care & Service | 0 (0.0%) | 0 (0.0%) |
| Total (Category) | 20 (20.4%) | 78 (79.6%) |
| Total (Overall) | 360 (63.5%) | 207 (36.5%) |
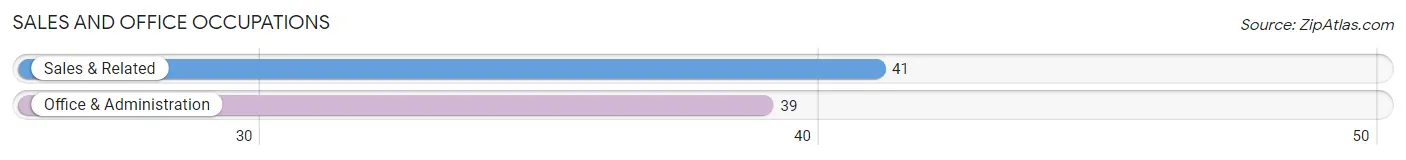
Sales and Office Occupations
The most common Sales and Office occupations in Fort Fairfield are Sales & Related (41 | 7.2%), and Office & Administration (39 | 6.9%).
Sales and Office Occupations by Sex
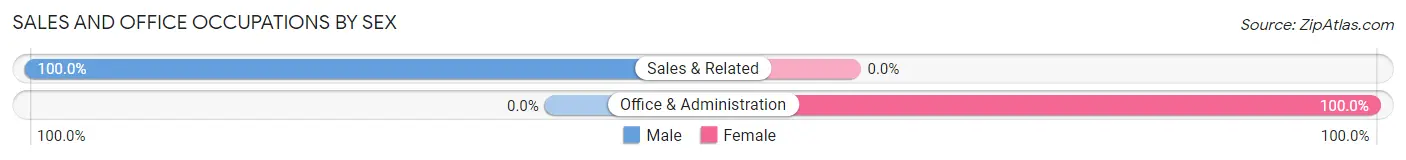
| Occupation | Male | Female |
| Sales & Related | 41 (100.0%) | 0 (0.0%) |
| Office & Administration | 0 (0.0%) | 39 (100.0%) |
| Total (Category) | 41 (51.2%) | 39 (48.7%) |
| Total (Overall) | 360 (63.5%) | 207 (36.5%) |
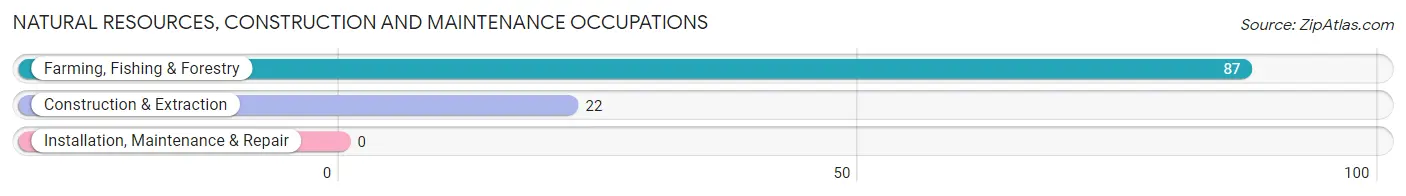
Natural Resources, Construction and Maintenance Occupations
The most common Natural Resources, Construction and Maintenance occupations in Fort Fairfield are Farming, Fishing & Forestry (87 | 15.3%), and Construction & Extraction (22 | 3.9%).
Natural Resources, Construction and Maintenance Occupations by Sex
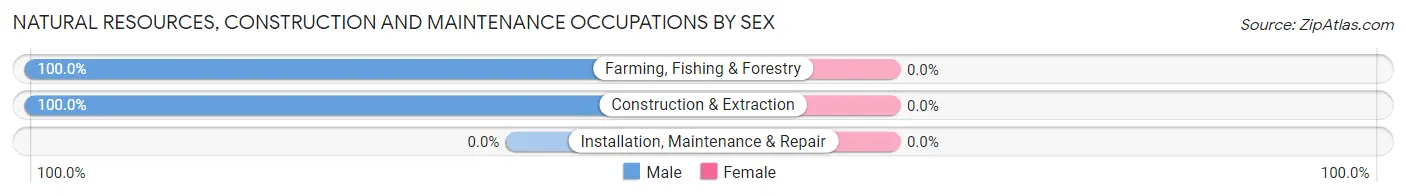
| Occupation | Male | Female |
| Farming, Fishing & Forestry | 87 (100.0%) | 0 (0.0%) |
| Construction & Extraction | 22 (100.0%) | 0 (0.0%) |
| Installation, Maintenance & Repair | 0 (0.0%) | 0 (0.0%) |
| Total (Category) | 109 (100.0%) | 0 (0.0%) |
| Total (Overall) | 360 (63.5%) | 207 (36.5%) |
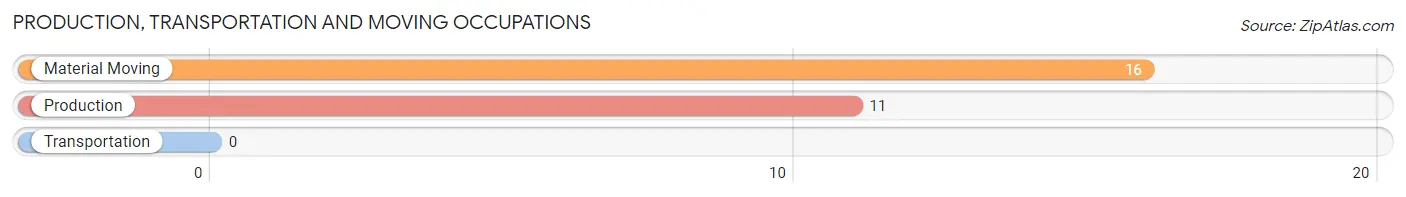
Production, Transportation and Moving Occupations
The most common Production, Transportation and Moving occupations in Fort Fairfield are Material Moving (16 | 2.8%), and Production (11 | 1.9%).
Production, Transportation and Moving Occupations by Sex
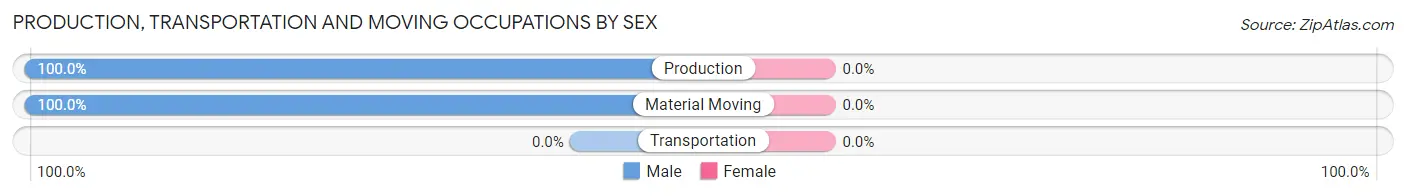
| Occupation | Male | Female |
| Production | 11 (100.0%) | 0 (0.0%) |
| Transportation | 0 (0.0%) | 0 (0.0%) |
| Material Moving | 16 (100.0%) | 0 (0.0%) |
| Total (Category) | 27 (100.0%) | 0 (0.0%) |
| Total (Overall) | 360 (63.5%) | 207 (36.5%) |
Employment Industries by Sex in Fort Fairfield
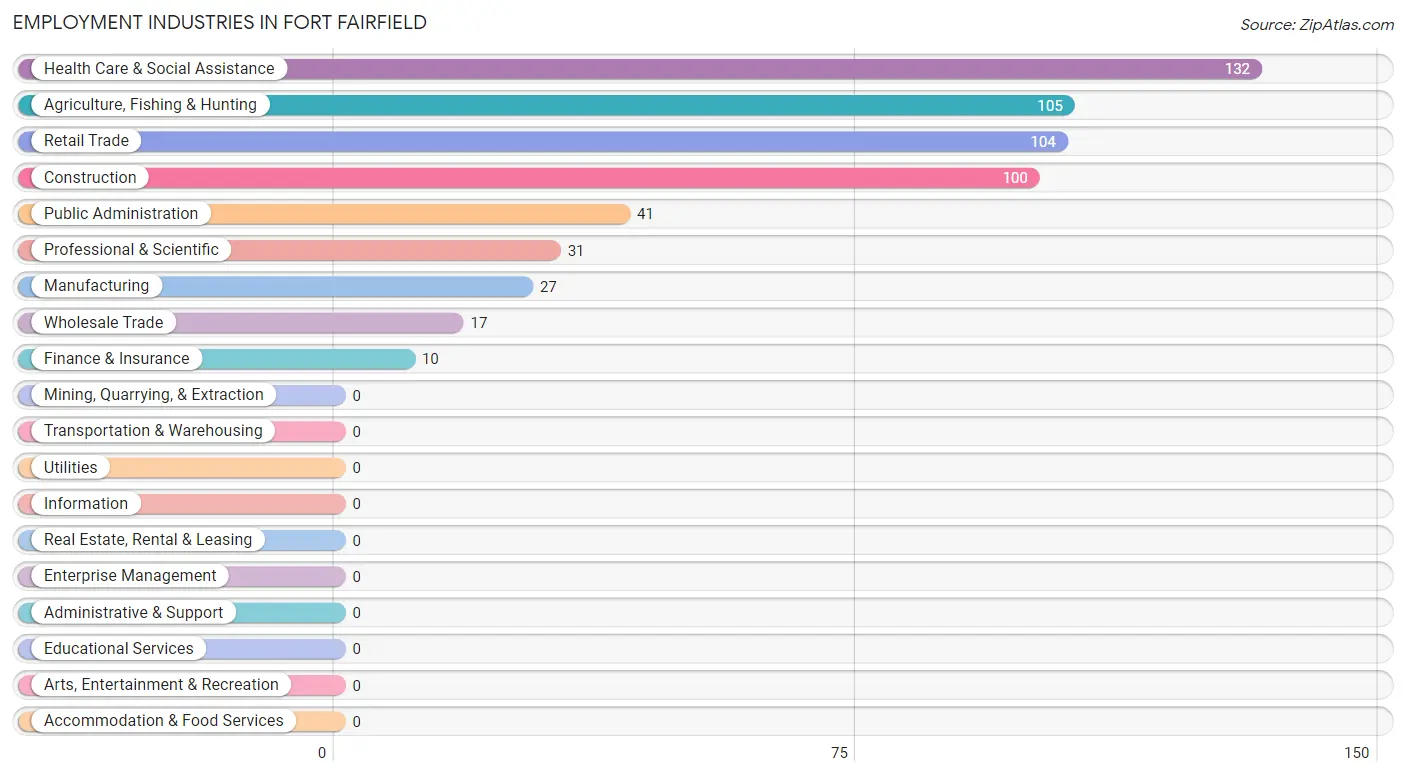
Employment Industries in Fort Fairfield
The major employment industries in Fort Fairfield include Health Care & Social Assistance (132 | 23.3%), Agriculture, Fishing & Hunting (105 | 18.5%), Retail Trade (104 | 18.3%), Construction (100 | 17.6%), and Public Administration (41 | 7.2%).
Employment Industries by Sex in Fort Fairfield
The Fort Fairfield industries that see more men than women are Agriculture, Fishing & Hunting (100.0%), Construction (100.0%), and Manufacturing (100.0%), whereas the industries that tend to have a higher number of women are Wholesale Trade (100.0%), Public Administration (70.7%), and Health Care & Social Assistance (65.9%).
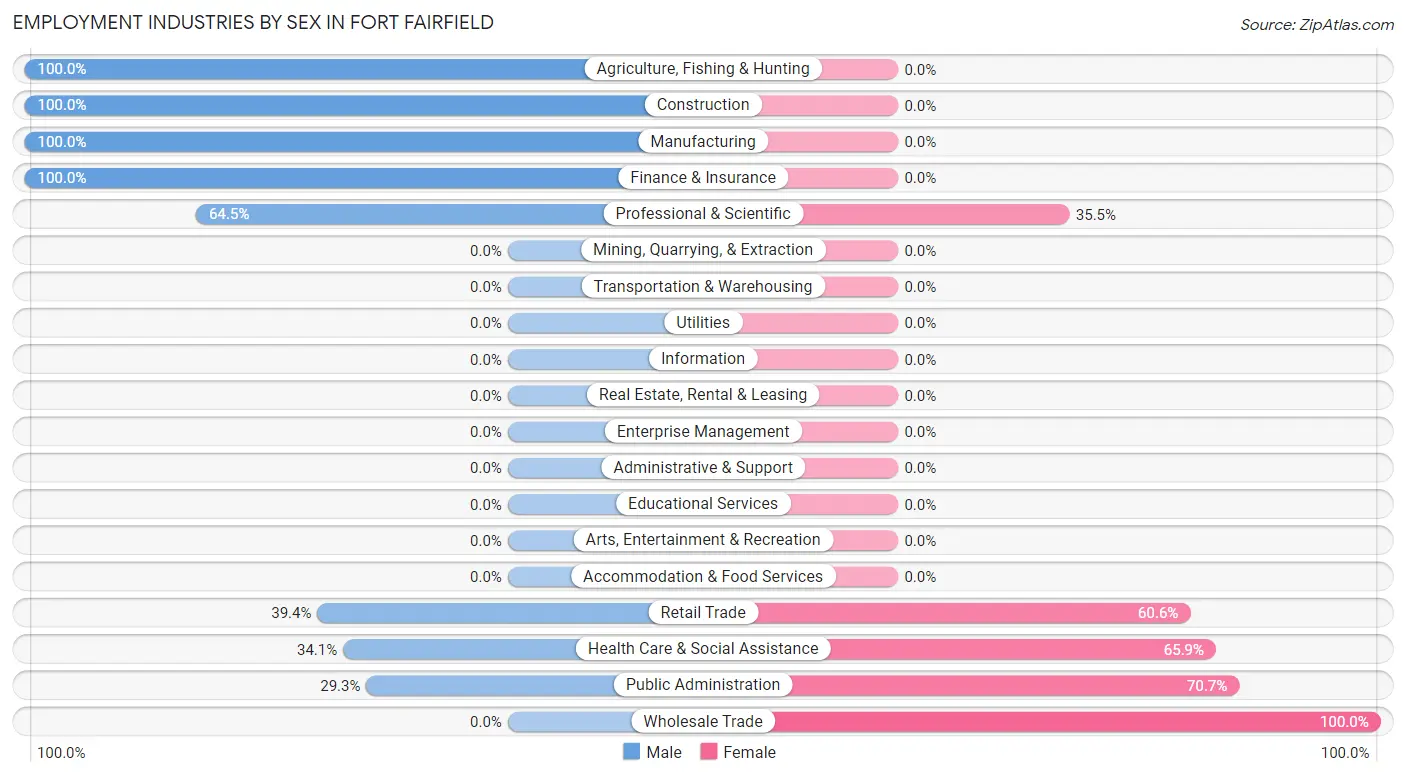
| Industry | Male | Female |
| Agriculture, Fishing & Hunting | 105 (100.0%) | 0 (0.0%) |
| Mining, Quarrying, & Extraction | 0 (0.0%) | 0 (0.0%) |
| Construction | 100 (100.0%) | 0 (0.0%) |
| Manufacturing | 27 (100.0%) | 0 (0.0%) |
| Wholesale Trade | 0 (0.0%) | 17 (100.0%) |
| Retail Trade | 41 (39.4%) | 63 (60.6%) |
| Transportation & Warehousing | 0 (0.0%) | 0 (0.0%) |
| Utilities | 0 (0.0%) | 0 (0.0%) |
| Information | 0 (0.0%) | 0 (0.0%) |
| Finance & Insurance | 10 (100.0%) | 0 (0.0%) |
| Real Estate, Rental & Leasing | 0 (0.0%) | 0 (0.0%) |
| Professional & Scientific | 20 (64.5%) | 11 (35.5%) |
| Enterprise Management | 0 (0.0%) | 0 (0.0%) |
| Administrative & Support | 0 (0.0%) | 0 (0.0%) |
| Educational Services | 0 (0.0%) | 0 (0.0%) |
| Health Care & Social Assistance | 45 (34.1%) | 87 (65.9%) |
| Arts, Entertainment & Recreation | 0 (0.0%) | 0 (0.0%) |
| Accommodation & Food Services | 0 (0.0%) | 0 (0.0%) |
| Public Administration | 12 (29.3%) | 29 (70.7%) |
| Total | 360 (63.5%) | 207 (36.5%) |
Education in Fort Fairfield
School Enrollment in Fort Fairfield
The most common levels of schooling among the 382 students in Fort Fairfield are high school (177 | 46.3%), elementary school (82 | 21.5%), and college / undergraduate (53 | 13.9%).
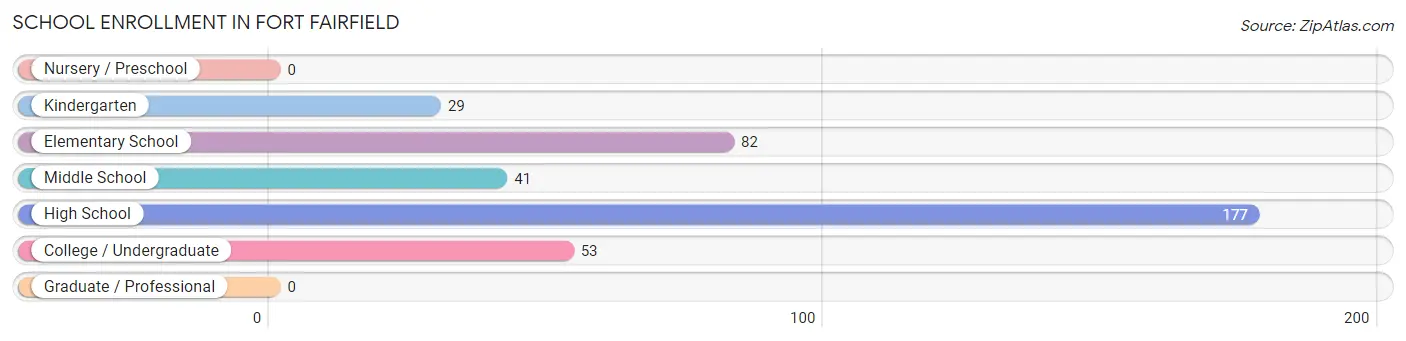
| School Level | # Students | % Students |
| Nursery / Preschool | 0 | 0.0% |
| Kindergarten | 29 | 7.6% |
| Elementary School | 82 | 21.5% |
| Middle School | 41 | 10.7% |
| High School | 177 | 46.3% |
| College / Undergraduate | 53 | 13.9% |
| Graduate / Professional | 0 | 0.0% |
| Total | 382 | 100.0% |
School Enrollment by Age by Funding Source in Fort Fairfield

| Age Bracket | Public School | Private School |
| 3 to 4 Year Olds | 0 (0.0%) | 0 (0.0%) |
| 5 to 9 Year Old | 72 (100.0%) | 0 (0.0%) |
| 10 to 14 Year Olds | 89 (100.0%) | 0 (0.0%) |
| 15 to 17 Year Olds | 90 (100.0%) | 0 (0.0%) |
| 18 to 19 Year Olds | 56 (100.0%) | 0 (0.0%) |
| 20 to 24 Year Olds | 27 (100.0%) | 0 (0.0%) |
| 25 to 34 Year Olds | 11 (100.0%) | 0 (0.0%) |
| 35 Years and over | 37 (100.0%) | 0 (0.0%) |
| Total | 382 (100.0%) | 0 (0.0%) |
Educational Attainment by Field of Study in Fort Fairfield
Education (127 | 39.2%), business (88 | 27.2%), communications (38 | 11.7%), social sciences (22 | 6.8%), and arts & humanities (12 | 3.7%) are the most common fields of study among 324 individuals in Fort Fairfield who have obtained a bachelor's degree or higher.
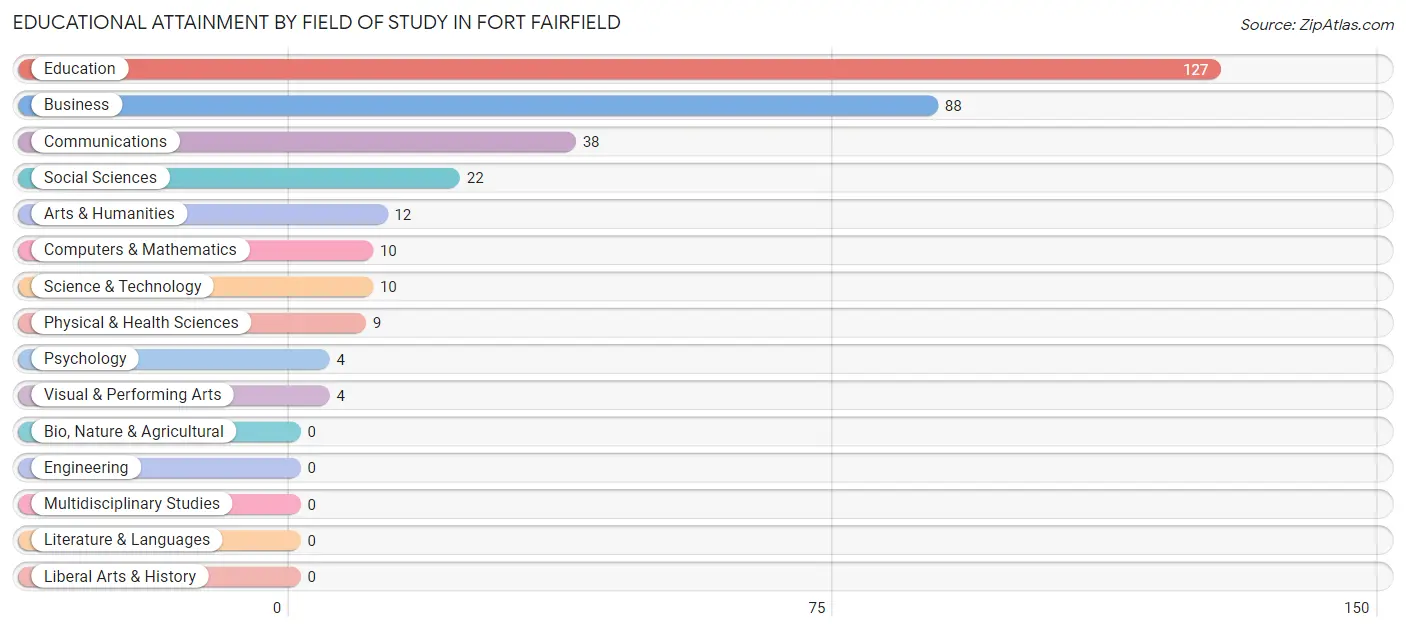
| Field of Study | # Graduates | % Graduates |
| Computers & Mathematics | 10 | 3.1% |
| Bio, Nature & Agricultural | 0 | 0.0% |
| Physical & Health Sciences | 9 | 2.8% |
| Psychology | 4 | 1.2% |
| Social Sciences | 22 | 6.8% |
| Engineering | 0 | 0.0% |
| Multidisciplinary Studies | 0 | 0.0% |
| Science & Technology | 10 | 3.1% |
| Business | 88 | 27.2% |
| Education | 127 | 39.2% |
| Literature & Languages | 0 | 0.0% |
| Liberal Arts & History | 0 | 0.0% |
| Visual & Performing Arts | 4 | 1.2% |
| Communications | 38 | 11.7% |
| Arts & Humanities | 12 | 3.7% |
| Total | 324 | 100.0% |
Transportation & Commute in Fort Fairfield
Vehicle Availability by Sex in Fort Fairfield
The most prevalent vehicle ownership categories in Fort Fairfield are males with 2 vehicles (242, accounting for 67.2%) and females with 2 vehicles (148, making up 116.9%).
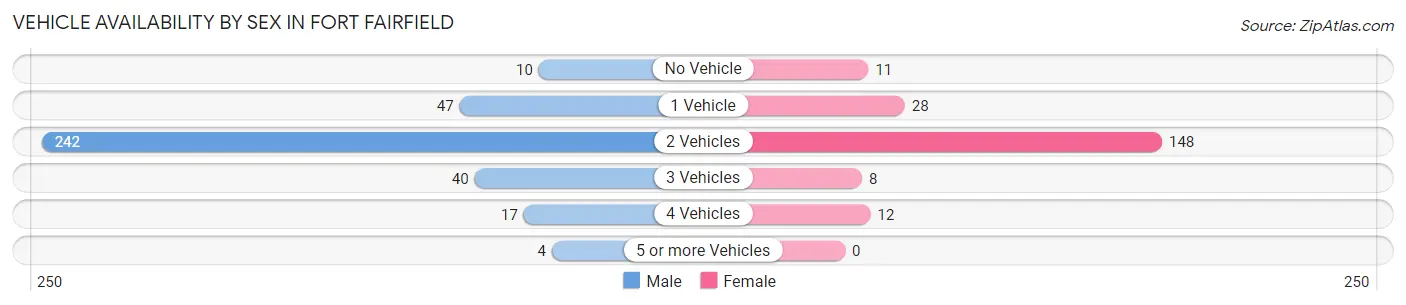
| Vehicles Available | Male | Female |
| No Vehicle | 10 (2.8%) | 11 (5.3%) |
| 1 Vehicle | 47 (13.1%) | 28 (13.5%) |
| 2 Vehicles | 242 (67.2%) | 148 (71.5%) |
| 3 Vehicles | 40 (11.1%) | 8 (3.9%) |
| 4 Vehicles | 17 (4.7%) | 12 (5.8%) |
| 5 or more Vehicles | 4 (1.1%) | 0 (0.0%) |
| Total | 360 (100.0%) | 207 (100.0%) |
Commute Time in Fort Fairfield
The most frequently occuring commute durations in Fort Fairfield are 15 to 19 minutes (223 commuters, 40.6%), less than 5 minutes (123 commuters, 22.4%), and 5 to 9 minutes (63 commuters, 11.5%).
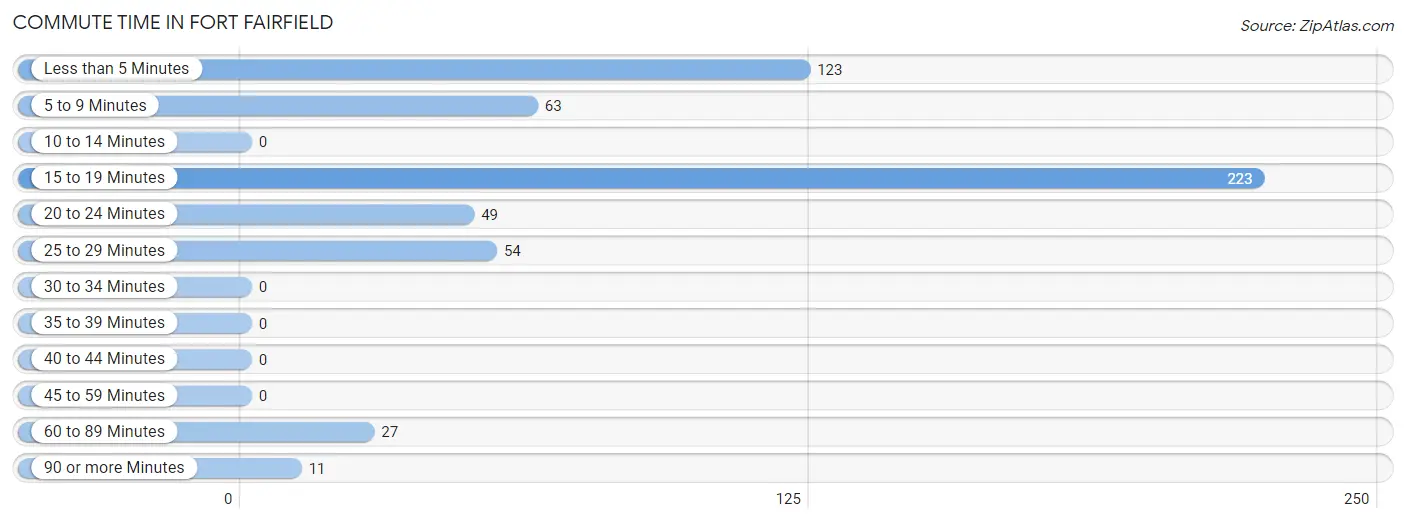
| Commute Time | # Commuters | % Commuters |
| Less than 5 Minutes | 123 | 22.4% |
| 5 to 9 Minutes | 63 | 11.5% |
| 10 to 14 Minutes | 0 | 0.0% |
| 15 to 19 Minutes | 223 | 40.6% |
| 20 to 24 Minutes | 49 | 8.9% |
| 25 to 29 Minutes | 54 | 9.8% |
| 30 to 34 Minutes | 0 | 0.0% |
| 35 to 39 Minutes | 0 | 0.0% |
| 40 to 44 Minutes | 0 | 0.0% |
| 45 to 59 Minutes | 0 | 0.0% |
| 60 to 89 Minutes | 27 | 4.9% |
| 90 or more Minutes | 11 | 2.0% |
Commute Time by Sex in Fort Fairfield
The most common commute times in Fort Fairfield are 15 to 19 minutes (168 commuters, 46.7%) for males and 5 to 9 minutes (63 commuters, 33.2%) for females.
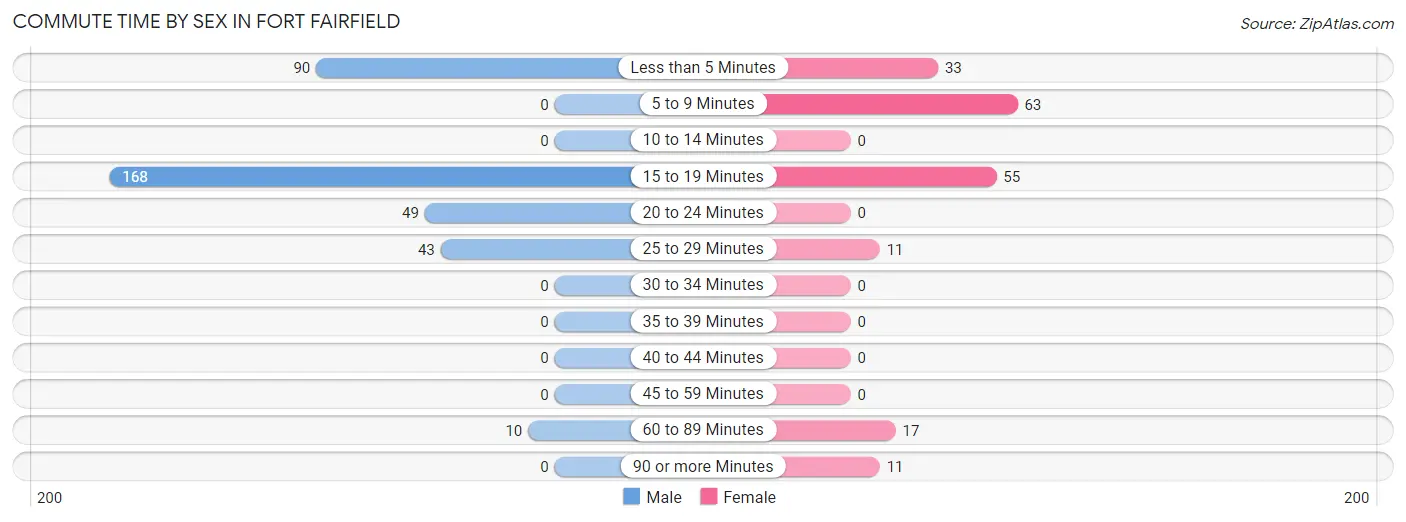
| Commute Time | Male | Female |
| Less than 5 Minutes | 90 (25.0%) | 33 (17.4%) |
| 5 to 9 Minutes | 0 (0.0%) | 63 (33.2%) |
| 10 to 14 Minutes | 0 (0.0%) | 0 (0.0%) |
| 15 to 19 Minutes | 168 (46.7%) | 55 (28.9%) |
| 20 to 24 Minutes | 49 (13.6%) | 0 (0.0%) |
| 25 to 29 Minutes | 43 (11.9%) | 11 (5.8%) |
| 30 to 34 Minutes | 0 (0.0%) | 0 (0.0%) |
| 35 to 39 Minutes | 0 (0.0%) | 0 (0.0%) |
| 40 to 44 Minutes | 0 (0.0%) | 0 (0.0%) |
| 45 to 59 Minutes | 0 (0.0%) | 0 (0.0%) |
| 60 to 89 Minutes | 10 (2.8%) | 17 (8.9%) |
| 90 or more Minutes | 0 (0.0%) | 11 (5.8%) |
Time of Departure to Work by Sex in Fort Fairfield
The most frequent times of departure to work in Fort Fairfield are 7:30 AM to 7:59 AM (104, 28.9%) for males and 7:00 AM to 7:29 AM (69, 36.3%) for females.
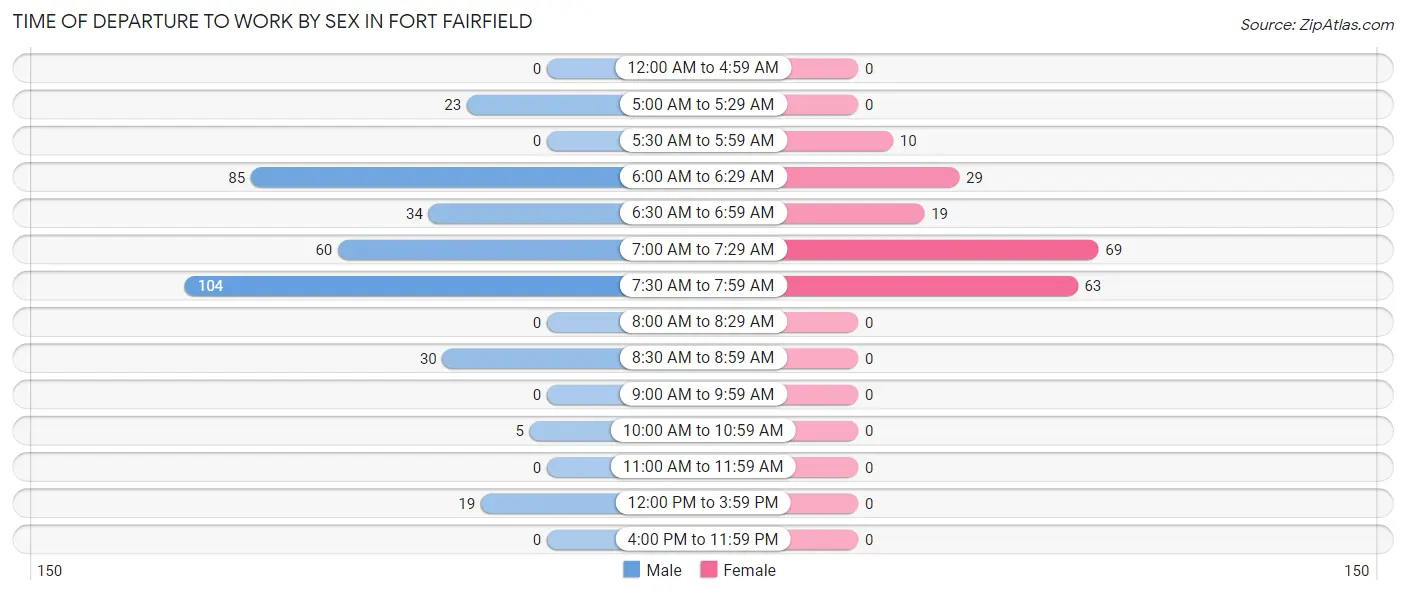
| Time of Departure | Male | Female |
| 12:00 AM to 4:59 AM | 0 (0.0%) | 0 (0.0%) |
| 5:00 AM to 5:29 AM | 23 (6.4%) | 0 (0.0%) |
| 5:30 AM to 5:59 AM | 0 (0.0%) | 10 (5.3%) |
| 6:00 AM to 6:29 AM | 85 (23.6%) | 29 (15.3%) |
| 6:30 AM to 6:59 AM | 34 (9.4%) | 19 (10.0%) |
| 7:00 AM to 7:29 AM | 60 (16.7%) | 69 (36.3%) |
| 7:30 AM to 7:59 AM | 104 (28.9%) | 63 (33.2%) |
| 8:00 AM to 8:29 AM | 0 (0.0%) | 0 (0.0%) |
| 8:30 AM to 8:59 AM | 30 (8.3%) | 0 (0.0%) |
| 9:00 AM to 9:59 AM | 0 (0.0%) | 0 (0.0%) |
| 10:00 AM to 10:59 AM | 5 (1.4%) | 0 (0.0%) |
| 11:00 AM to 11:59 AM | 0 (0.0%) | 0 (0.0%) |
| 12:00 PM to 3:59 PM | 19 (5.3%) | 0 (0.0%) |
| 4:00 PM to 11:59 PM | 0 (0.0%) | 0 (0.0%) |
| Total | 360 (100.0%) | 190 (100.0%) |
Housing Occupancy in Fort Fairfield
Occupancy by Ownership in Fort Fairfield
Of the total 685 dwellings in Fort Fairfield, owner-occupied units account for 564 (82.3%), while renter-occupied units make up 121 (17.7%).
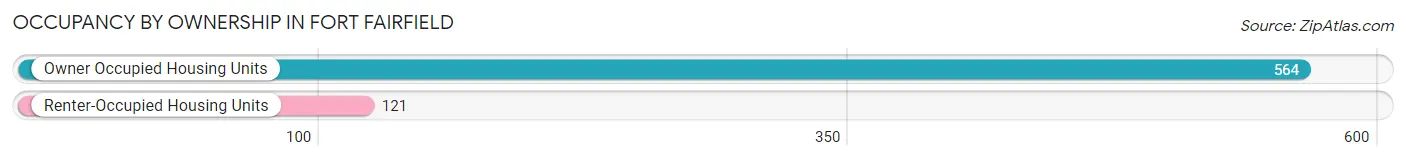
| Occupancy | # Housing Units | % Housing Units |
| Owner Occupied Housing Units | 564 | 82.3% |
| Renter-Occupied Housing Units | 121 | 17.7% |
| Total Occupied Housing Units | 685 | 100.0% |
Occupancy by Household Size in Fort Fairfield
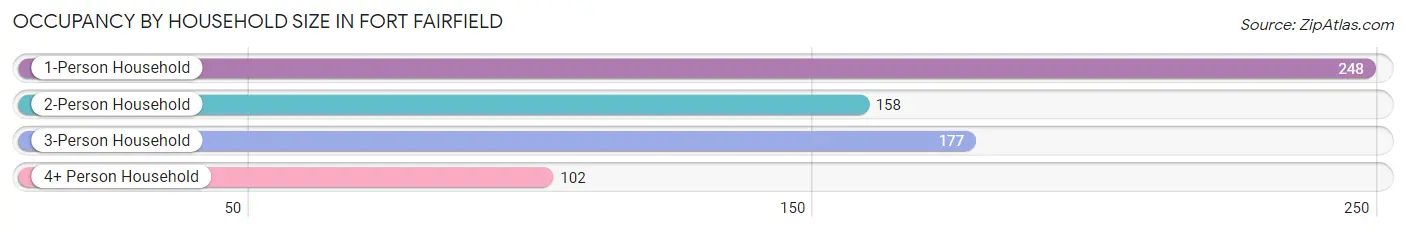
| Household Size | # Housing Units | % Housing Units |
| 1-Person Household | 248 | 36.2% |
| 2-Person Household | 158 | 23.1% |
| 3-Person Household | 177 | 25.8% |
| 4+ Person Household | 102 | 14.9% |
| Total Housing Units | 685 | 100.0% |
Occupancy by Ownership by Household Size in Fort Fairfield
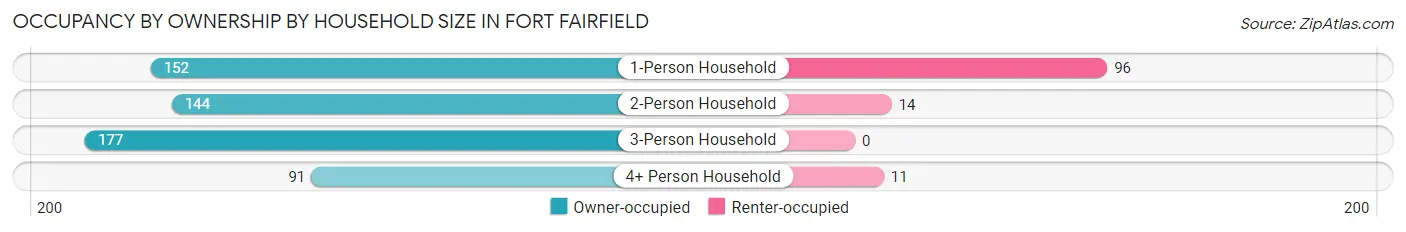
| Household Size | Owner-occupied | Renter-occupied |
| 1-Person Household | 152 (61.3%) | 96 (38.7%) |
| 2-Person Household | 144 (91.1%) | 14 (8.9%) |
| 3-Person Household | 177 (100.0%) | 0 (0.0%) |
| 4+ Person Household | 91 (89.2%) | 11 (10.8%) |
| Total Housing Units | 564 (82.3%) | 121 (17.7%) |
Occupancy by Educational Attainment in Fort Fairfield
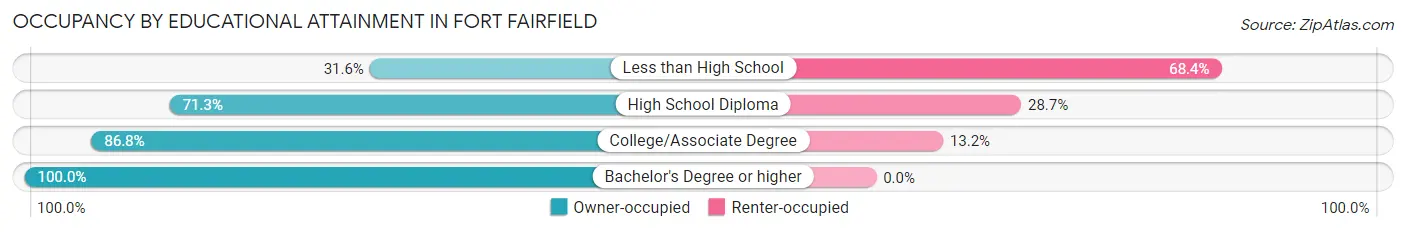
| Household Size | Owner-occupied | Renter-occupied |
| Less than High School | 12 (31.6%) | 26 (68.4%) |
| High School Diploma | 191 (71.3%) | 77 (28.7%) |
| College/Associate Degree | 118 (86.8%) | 18 (13.2%) |
| Bachelor's Degree or higher | 243 (100.0%) | 0 (0.0%) |
Occupancy by Age of Householder in Fort Fairfield
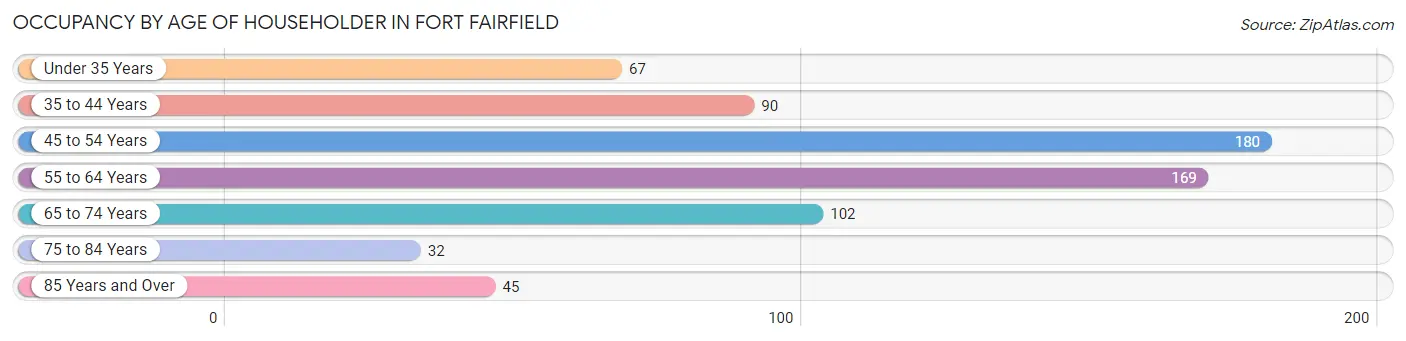
| Age Bracket | # Households | % Households |
| Under 35 Years | 67 | 9.8% |
| 35 to 44 Years | 90 | 13.1% |
| 45 to 54 Years | 180 | 26.3% |
| 55 to 64 Years | 169 | 24.7% |
| 65 to 74 Years | 102 | 14.9% |
| 75 to 84 Years | 32 | 4.7% |
| 85 Years and Over | 45 | 6.6% |
| Total | 685 | 100.0% |
Housing Finances in Fort Fairfield
Median Income by Occupancy in Fort Fairfield
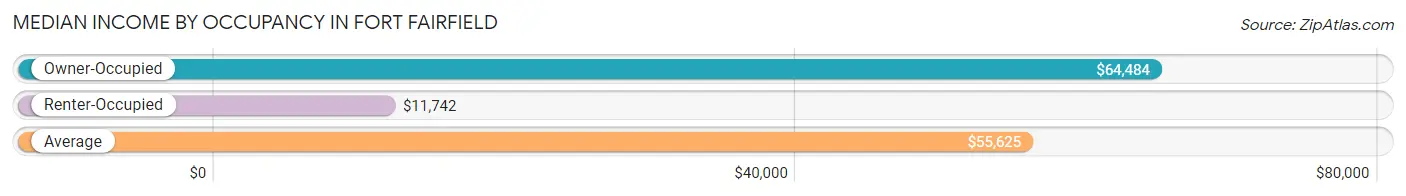
| Occupancy Type | # Households | Median Income |
| Owner-Occupied | 564 (82.3%) | $64,484 |
| Renter-Occupied | 121 (17.7%) | $11,742 |
| Average | 685 (100.0%) | $55,625 |
Occupancy by Householder Income Bracket in Fort Fairfield
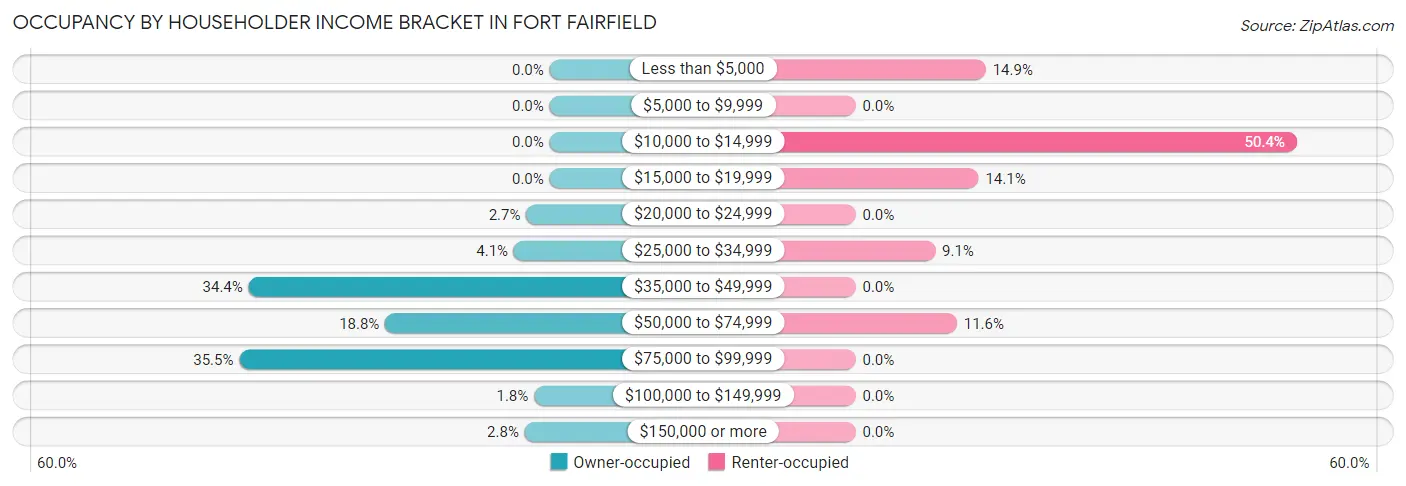
| Income Bracket | Owner-occupied | Renter-occupied |
| Less than $5,000 | 0 (0.0%) | 18 (14.9%) |
| $5,000 to $9,999 | 0 (0.0%) | 0 (0.0%) |
| $10,000 to $14,999 | 0 (0.0%) | 61 (50.4%) |
| $15,000 to $19,999 | 0 (0.0%) | 17 (14.1%) |
| $20,000 to $24,999 | 15 (2.7%) | 0 (0.0%) |
| $25,000 to $34,999 | 23 (4.1%) | 11 (9.1%) |
| $35,000 to $49,999 | 194 (34.4%) | 0 (0.0%) |
| $50,000 to $74,999 | 106 (18.8%) | 14 (11.6%) |
| $75,000 to $99,999 | 200 (35.5%) | 0 (0.0%) |
| $100,000 to $149,999 | 10 (1.8%) | 0 (0.0%) |
| $150,000 or more | 16 (2.8%) | 0 (0.0%) |
| Total | 564 (100.0%) | 121 (100.0%) |
Monthly Housing Cost Tiers in Fort Fairfield
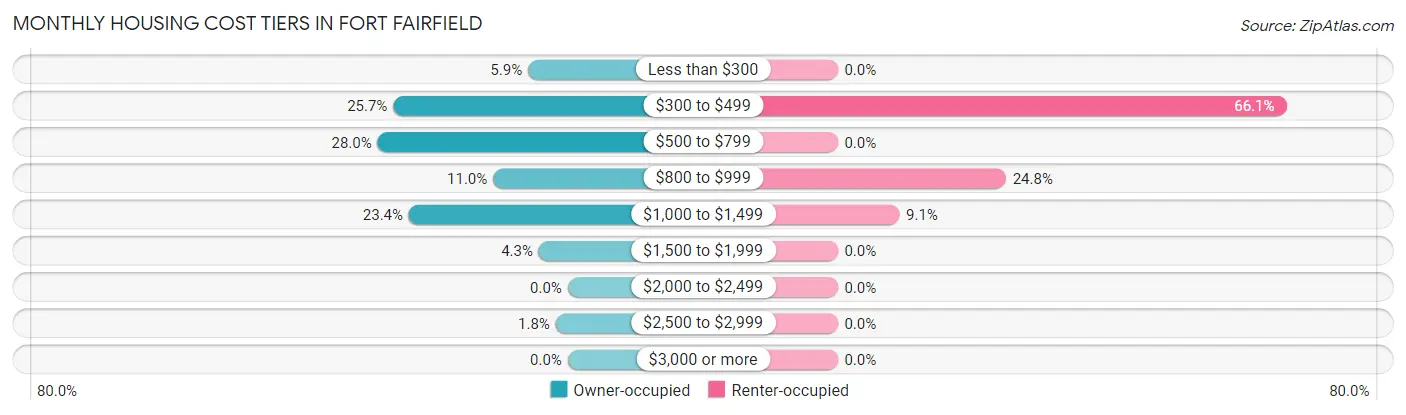
| Monthly Cost | Owner-occupied | Renter-occupied |
| Less than $300 | 33 (5.9%) | 0 (0.0%) |
| $300 to $499 | 145 (25.7%) | 80 (66.1%) |
| $500 to $799 | 158 (28.0%) | 0 (0.0%) |
| $800 to $999 | 62 (11.0%) | 30 (24.8%) |
| $1,000 to $1,499 | 132 (23.4%) | 11 (9.1%) |
| $1,500 to $1,999 | 24 (4.3%) | 0 (0.0%) |
| $2,000 to $2,499 | 0 (0.0%) | 0 (0.0%) |
| $2,500 to $2,999 | 10 (1.8%) | 0 (0.0%) |
| $3,000 or more | 0 (0.0%) | 0 (0.0%) |
| Total | 564 (100.0%) | 121 (100.0%) |
Physical Housing Characteristics in Fort Fairfield
Housing Structures in Fort Fairfield
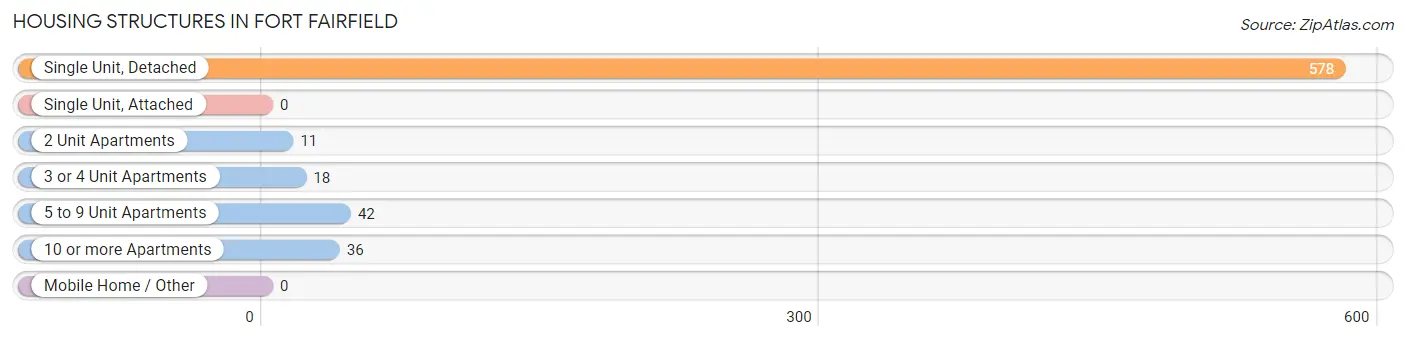
| Structure Type | # Housing Units | % Housing Units |
| Single Unit, Detached | 578 | 84.4% |
| Single Unit, Attached | 0 | 0.0% |
| 2 Unit Apartments | 11 | 1.6% |
| 3 or 4 Unit Apartments | 18 | 2.6% |
| 5 to 9 Unit Apartments | 42 | 6.1% |
| 10 or more Apartments | 36 | 5.3% |
| Mobile Home / Other | 0 | 0.0% |
| Total | 685 | 100.0% |
Housing Structures by Occupancy in Fort Fairfield
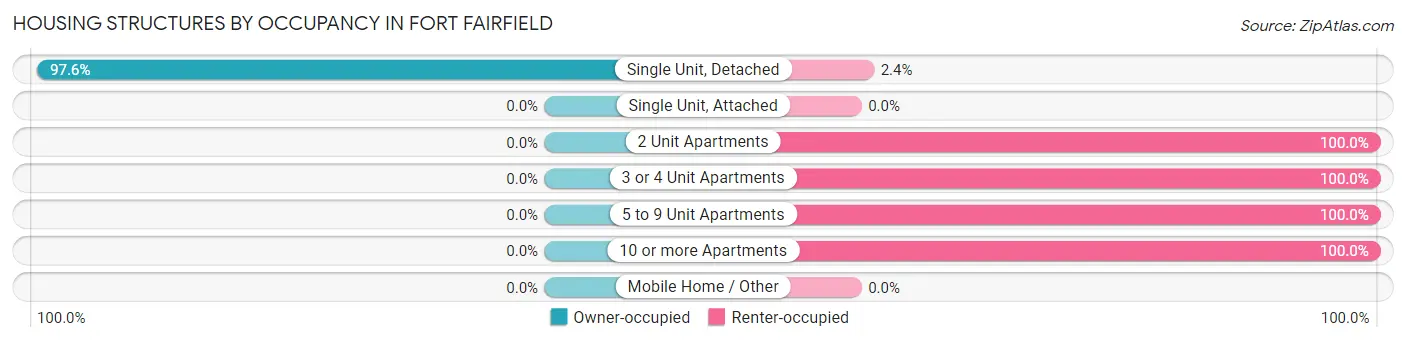
| Structure Type | Owner-occupied | Renter-occupied |
| Single Unit, Detached | 564 (97.6%) | 14 (2.4%) |
| Single Unit, Attached | 0 (0.0%) | 0 (0.0%) |
| 2 Unit Apartments | 0 (0.0%) | 11 (100.0%) |
| 3 or 4 Unit Apartments | 0 (0.0%) | 18 (100.0%) |
| 5 to 9 Unit Apartments | 0 (0.0%) | 42 (100.0%) |
| 10 or more Apartments | 0 (0.0%) | 36 (100.0%) |
| Mobile Home / Other | 0 (0.0%) | 0 (0.0%) |
| Total | 564 (82.3%) | 121 (17.7%) |
Housing Structures by Number of Rooms in Fort Fairfield
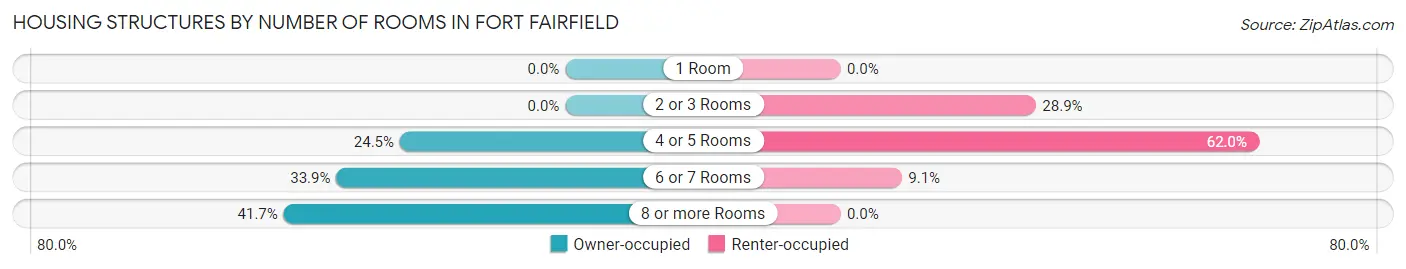
| Number of Rooms | Owner-occupied | Renter-occupied |
| 1 Room | 0 (0.0%) | 0 (0.0%) |
| 2 or 3 Rooms | 0 (0.0%) | 35 (28.9%) |
| 4 or 5 Rooms | 138 (24.5%) | 75 (62.0%) |
| 6 or 7 Rooms | 191 (33.9%) | 11 (9.1%) |
| 8 or more Rooms | 235 (41.7%) | 0 (0.0%) |
| Total | 564 (100.0%) | 121 (100.0%) |
Housing Structure by Heating Type in Fort Fairfield
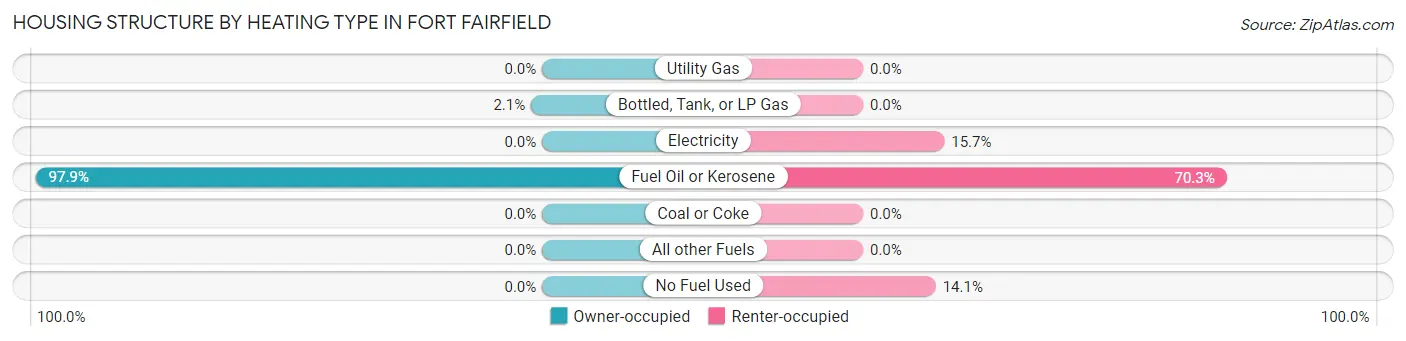
| Heating Type | Owner-occupied | Renter-occupied |
| Utility Gas | 0 (0.0%) | 0 (0.0%) |
| Bottled, Tank, or LP Gas | 12 (2.1%) | 0 (0.0%) |
| Electricity | 0 (0.0%) | 19 (15.7%) |
| Fuel Oil or Kerosene | 552 (97.9%) | 85 (70.3%) |
| Coal or Coke | 0 (0.0%) | 0 (0.0%) |
| All other Fuels | 0 (0.0%) | 0 (0.0%) |
| No Fuel Used | 0 (0.0%) | 17 (14.1%) |
| Total | 564 (100.0%) | 121 (100.0%) |
Household Vehicle Usage in Fort Fairfield
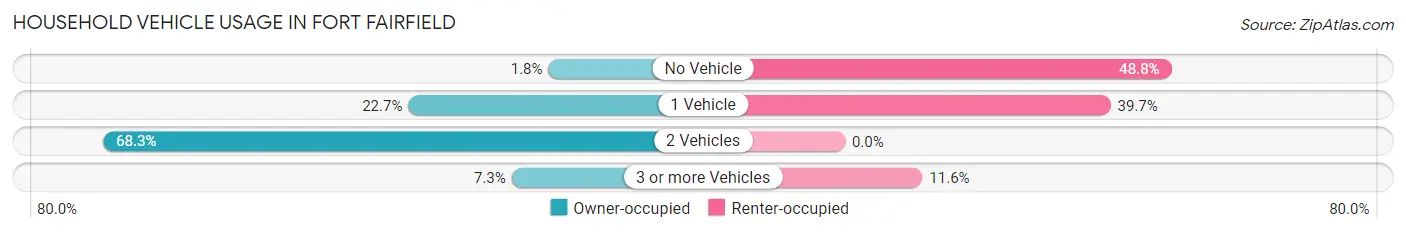
| Vehicles per Household | Owner-occupied | Renter-occupied |
| No Vehicle | 10 (1.8%) | 59 (48.8%) |
| 1 Vehicle | 128 (22.7%) | 48 (39.7%) |
| 2 Vehicles | 385 (68.3%) | 0 (0.0%) |
| 3 or more Vehicles | 41 (7.3%) | 14 (11.6%) |
| Total | 564 (100.0%) | 121 (100.0%) |
Real Estate & Mortgages in Fort Fairfield
Real Estate and Mortgage Overview in Fort Fairfield
| Characteristic | Without Mortgage | With Mortgage |
| Housing Units | 253 | 311 |
| Median Property Value | $141,200 | $155,200 |
| Median Household Income | $63,790 | $12 |
| Monthly Housing Costs | $458 | $0 |
| Real Estate Taxes | $1,220 | $0 |
Property Value by Mortgage Status in Fort Fairfield
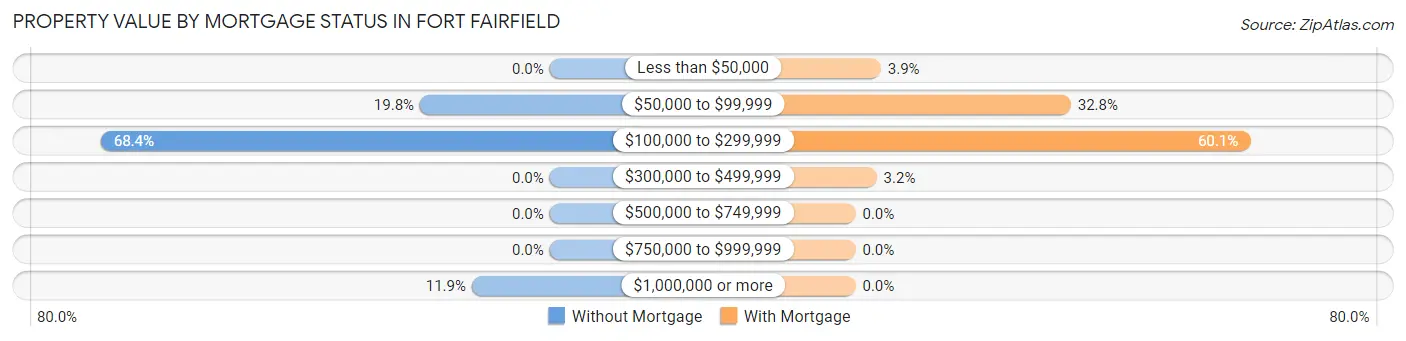
| Property Value | Without Mortgage | With Mortgage |
| Less than $50,000 | 0 (0.0%) | 12 (3.9%) |
| $50,000 to $99,999 | 50 (19.8%) | 102 (32.8%) |
| $100,000 to $299,999 | 173 (68.4%) | 187 (60.1%) |
| $300,000 to $499,999 | 0 (0.0%) | 10 (3.2%) |
| $500,000 to $749,999 | 0 (0.0%) | 0 (0.0%) |
| $750,000 to $999,999 | 0 (0.0%) | 0 (0.0%) |
| $1,000,000 or more | 30 (11.9%) | 0 (0.0%) |
| Total | 253 (100.0%) | 311 (100.0%) |
Household Income by Mortgage Status in Fort Fairfield
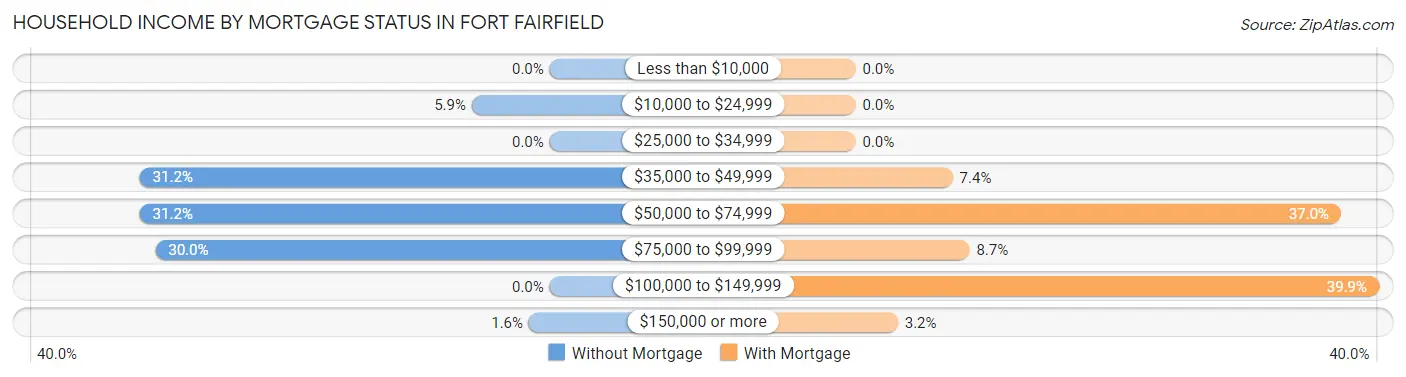
| Household Income | Without Mortgage | With Mortgage |
| Less than $10,000 | 0 (0.0%) | 0 (0.0%) |
| $10,000 to $24,999 | 15 (5.9%) | 0 (0.0%) |
| $25,000 to $34,999 | 0 (0.0%) | 0 (0.0%) |
| $35,000 to $49,999 | 79 (31.2%) | 23 (7.4%) |
| $50,000 to $74,999 | 79 (31.2%) | 115 (37.0%) |
| $75,000 to $99,999 | 76 (30.0%) | 27 (8.7%) |
| $100,000 to $149,999 | 0 (0.0%) | 124 (39.9%) |
| $150,000 or more | 4 (1.6%) | 10 (3.2%) |
| Total | 253 (100.0%) | 311 (100.0%) |
Property Value to Household Income Ratio in Fort Fairfield
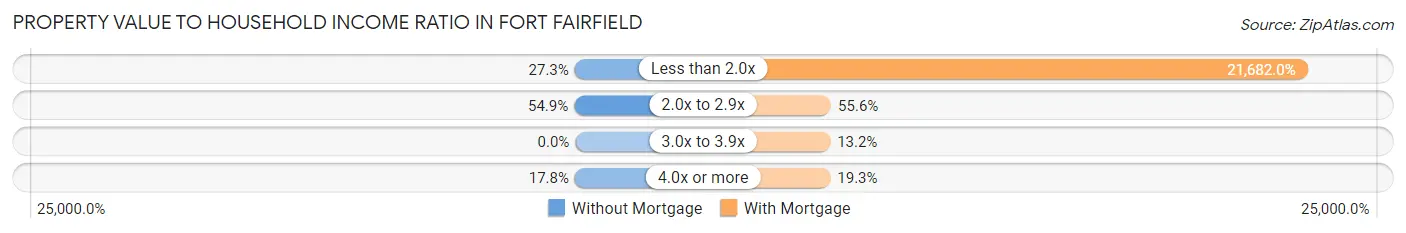
| Value-to-Income Ratio | Without Mortgage | With Mortgage |
| Less than 2.0x | 69 (27.3%) | 67,431 (21,682.0%) |
| 2.0x to 2.9x | 139 (54.9%) | 173 (55.6%) |
| 3.0x to 3.9x | 0 (0.0%) | 41 (13.2%) |
| 4.0x or more | 45 (17.8%) | 60 (19.3%) |
| Total | 253 (100.0%) | 311 (100.0%) |
Real Estate Taxes by Mortgage Status in Fort Fairfield
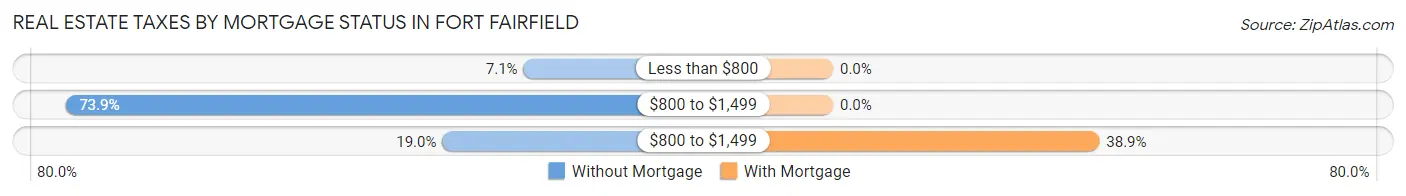
| Property Taxes | Without Mortgage | With Mortgage |
| Less than $800 | 18 (7.1%) | 0 (0.0%) |
| $800 to $1,499 | 187 (73.9%) | 0 (0.0%) |
| $800 to $1,499 | 48 (19.0%) | 121 (38.9%) |
| Total | 253 (100.0%) | 311 (100.0%) |
Health & Disability in Fort Fairfield
Health Insurance Coverage by Age in Fort Fairfield
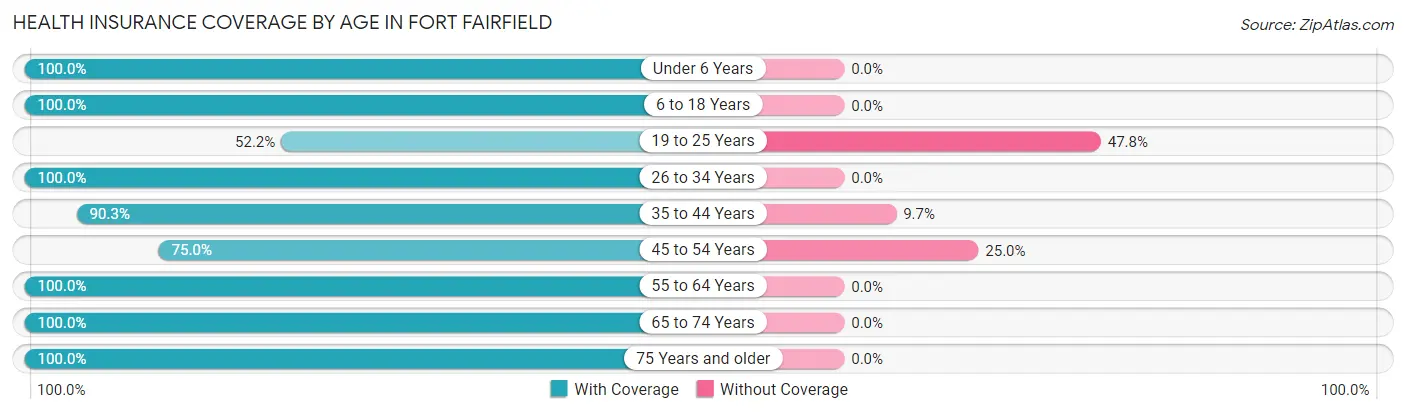
| Age Bracket | With Coverage | Without Coverage |
| Under 6 Years | 65 (100.0%) | 0 (0.0%) |
| 6 to 18 Years | 315 (100.0%) | 0 (0.0%) |
| 19 to 25 Years | 24 (52.2%) | 22 (47.8%) |
| 26 to 34 Years | 107 (100.0%) | 0 (0.0%) |
| 35 to 44 Years | 168 (90.3%) | 18 (9.7%) |
| 45 to 54 Years | 234 (75.0%) | 78 (25.0%) |
| 55 to 64 Years | 227 (100.0%) | 0 (0.0%) |
| 65 to 74 Years | 192 (100.0%) | 0 (0.0%) |
| 75 Years and older | 116 (100.0%) | 0 (0.0%) |
| Total | 1,448 (92.5%) | 118 (7.5%) |
Health Insurance Coverage by Citizenship Status in Fort Fairfield
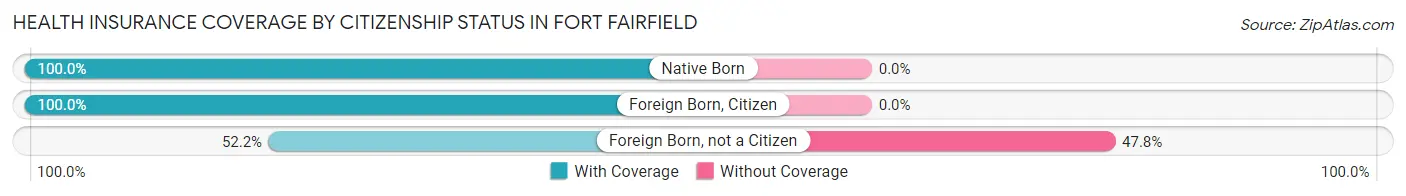
| Citizenship Status | With Coverage | Without Coverage |
| Native Born | 65 (100.0%) | 0 (0.0%) |
| Foreign Born, Citizen | 315 (100.0%) | 0 (0.0%) |
| Foreign Born, not a Citizen | 24 (52.2%) | 22 (47.8%) |
Health Insurance Coverage by Household Income in Fort Fairfield
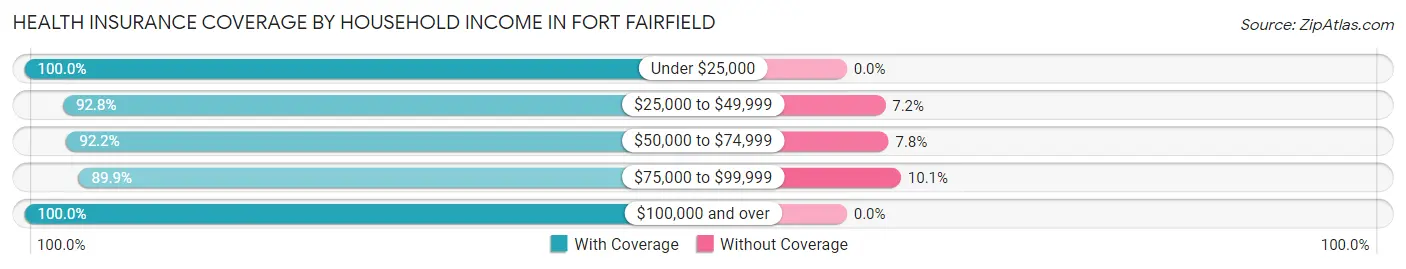
| Household Income | With Coverage | Without Coverage |
| Under $25,000 | 111 (100.0%) | 0 (0.0%) |
| $25,000 to $49,999 | 515 (92.8%) | 40 (7.2%) |
| $50,000 to $74,999 | 165 (92.2%) | 14 (7.8%) |
| $75,000 to $99,999 | 568 (89.9%) | 64 (10.1%) |
| $100,000 and over | 89 (100.0%) | 0 (0.0%) |
Public vs Private Health Insurance Coverage by Age in Fort Fairfield
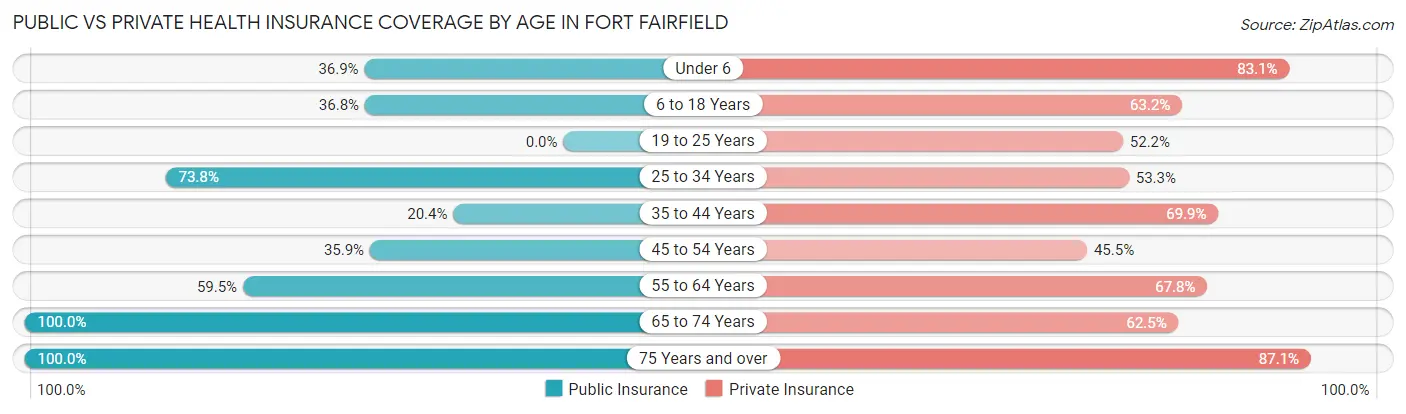
| Age Bracket | Public Insurance | Private Insurance |
| Under 6 | 24 (36.9%) | 54 (83.1%) |
| 6 to 18 Years | 116 (36.8%) | 199 (63.2%) |
| 19 to 25 Years | 0 (0.0%) | 24 (52.2%) |
| 25 to 34 Years | 79 (73.8%) | 57 (53.3%) |
| 35 to 44 Years | 38 (20.4%) | 130 (69.9%) |
| 45 to 54 Years | 112 (35.9%) | 142 (45.5%) |
| 55 to 64 Years | 135 (59.5%) | 154 (67.8%) |
| 65 to 74 Years | 192 (100.0%) | 120 (62.5%) |
| 75 Years and over | 116 (100.0%) | 101 (87.1%) |
| Total | 812 (51.8%) | 981 (62.6%) |
Disability Status by Sex by Age in Fort Fairfield
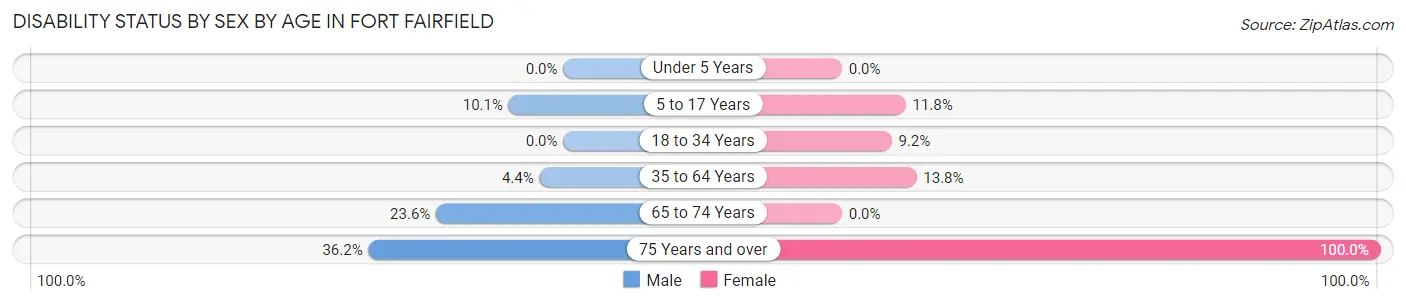
| Age Bracket | Male | Female |
| Under 5 Years | 0 (0.0%) | 0 (0.0%) |
| 5 to 17 Years | 16 (10.1%) | 11 (11.8%) |
| 18 to 34 Years | 0 (0.0%) | 12 (9.2%) |
| 35 to 64 Years | 18 (4.4%) | 44 (13.8%) |
| 65 to 74 Years | 17 (23.6%) | 0 (0.0%) |
| 75 Years and over | 17 (36.2%) | 69 (100.0%) |
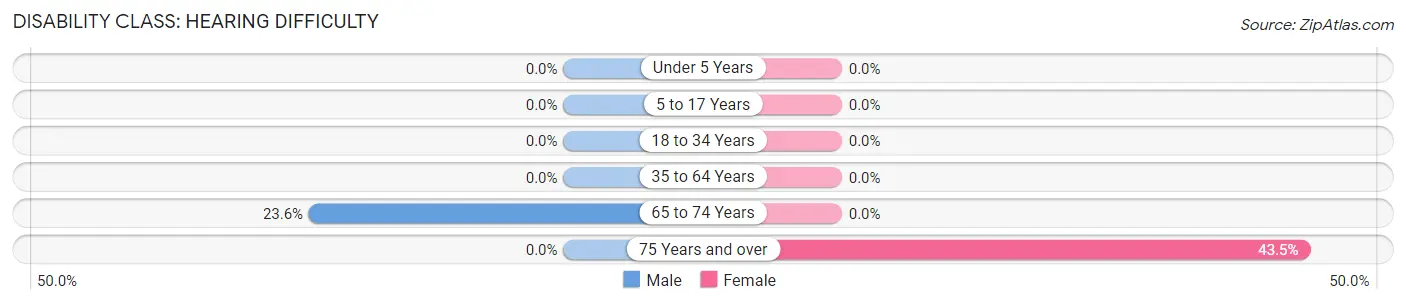
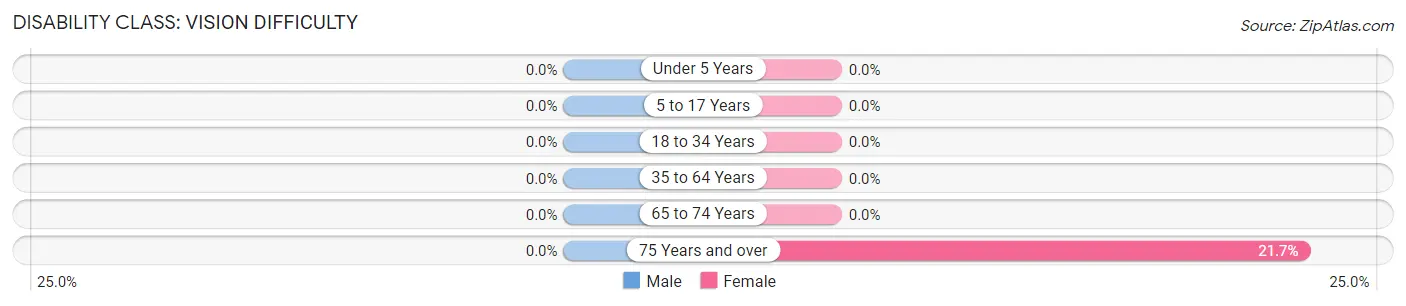
Disability Class by Sex by Age in Fort Fairfield
Disability Class: Hearing Difficulty
| Age Bracket | Male | Female |
| Under 5 Years | 0 (0.0%) | 0 (0.0%) |
| 5 to 17 Years | 0 (0.0%) | 0 (0.0%) |
| 18 to 34 Years | 0 (0.0%) | 0 (0.0%) |
| 35 to 64 Years | 0 (0.0%) | 0 (0.0%) |
| 65 to 74 Years | 17 (23.6%) | 0 (0.0%) |
| 75 Years and over | 0 (0.0%) | 30 (43.5%) |
Disability Class: Vision Difficulty
| Age Bracket | Male | Female |
| Under 5 Years | 0 (0.0%) | 0 (0.0%) |
| 5 to 17 Years | 0 (0.0%) | 0 (0.0%) |
| 18 to 34 Years | 0 (0.0%) | 0 (0.0%) |
| 35 to 64 Years | 0 (0.0%) | 0 (0.0%) |
| 65 to 74 Years | 0 (0.0%) | 0 (0.0%) |
| 75 Years and over | 0 (0.0%) | 15 (21.7%) |
Disability Class: Cognitive Difficulty
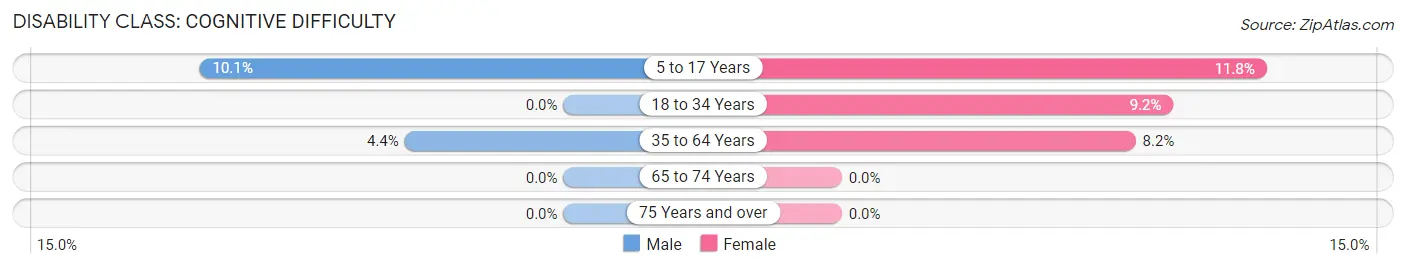
| Age Bracket | Male | Female |
| 5 to 17 Years | 16 (10.1%) | 11 (11.8%) |
| 18 to 34 Years | 0 (0.0%) | 12 (9.2%) |
| 35 to 64 Years | 18 (4.4%) | 26 (8.2%) |
| 65 to 74 Years | 0 (0.0%) | 0 (0.0%) |
| 75 Years and over | 0 (0.0%) | 0 (0.0%) |
Disability Class: Ambulatory Difficulty
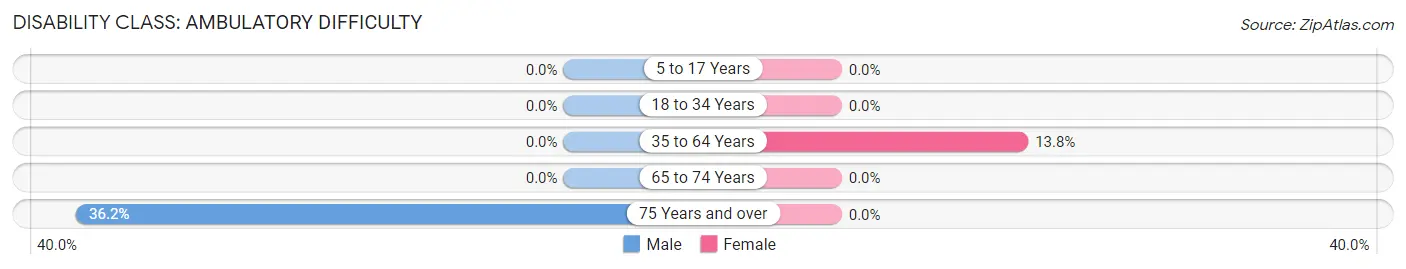
| Age Bracket | Male | Female |
| 5 to 17 Years | 0 (0.0%) | 0 (0.0%) |
| 18 to 34 Years | 0 (0.0%) | 0 (0.0%) |
| 35 to 64 Years | 0 (0.0%) | 44 (13.8%) |
| 65 to 74 Years | 0 (0.0%) | 0 (0.0%) |
| 75 Years and over | 17 (36.2%) | 0 (0.0%) |
Disability Class: Self-Care Difficulty
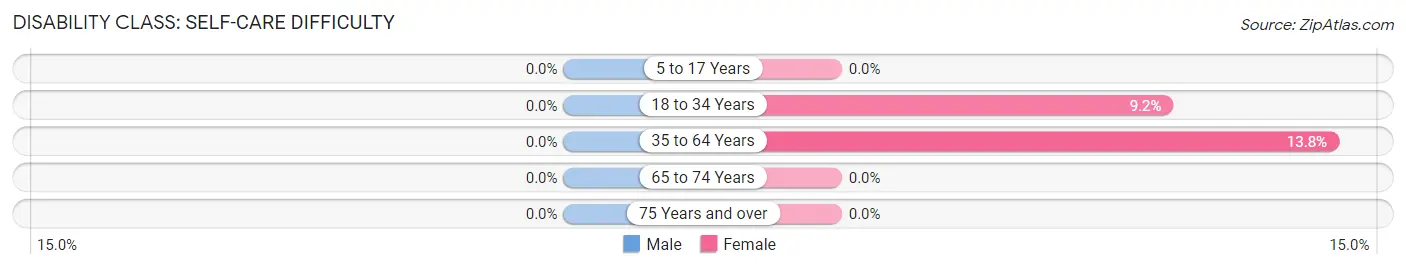
| Age Bracket | Male | Female |
| 5 to 17 Years | 0 (0.0%) | 0 (0.0%) |
| 18 to 34 Years | 0 (0.0%) | 12 (9.2%) |
| 35 to 64 Years | 0 (0.0%) | 44 (13.8%) |
| 65 to 74 Years | 0 (0.0%) | 0 (0.0%) |
| 75 Years and over | 0 (0.0%) | 0 (0.0%) |
Technology Access in Fort Fairfield
Computing Device Access in Fort Fairfield
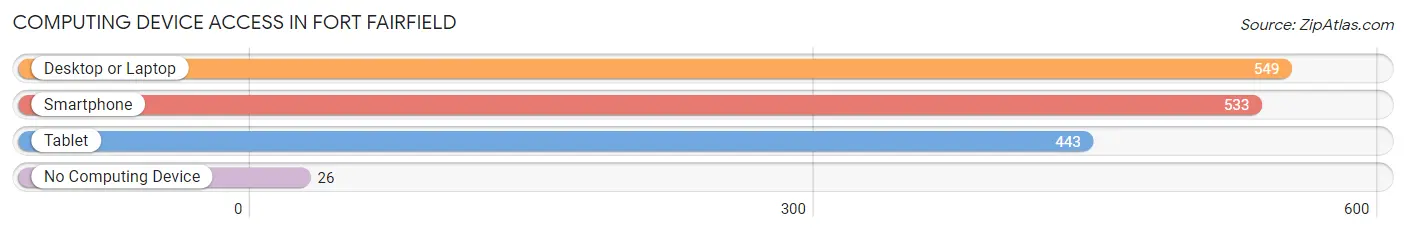
| Device Type | # Households | % Households |
| Desktop or Laptop | 549 | 80.1% |
| Smartphone | 533 | 77.8% |
| Tablet | 443 | 64.7% |
| No Computing Device | 26 | 3.8% |
| Total | 685 | 100.0% |
Internet Access in Fort Fairfield
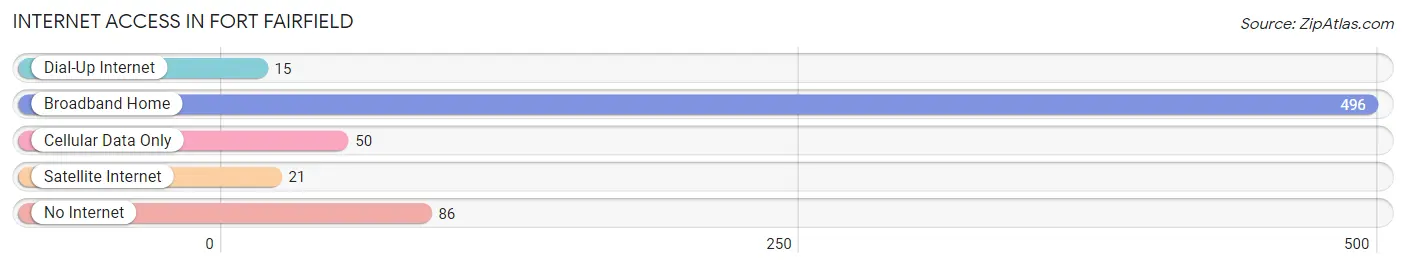
| Internet Type | # Households | % Households |
| Dial-Up Internet | 15 | 2.2% |
| Broadband Home | 496 | 72.4% |
| Cellular Data Only | 50 | 7.3% |
| Satellite Internet | 21 | 3.1% |
| No Internet | 86 | 12.6% |
| Total | 685 | 100.0% |
Fort Fairfield Summary
History
The town of Fairfield, Maine was first settled in 1790 by a group of settlers from Massachusetts. The town was originally called Township No. 4, but was later renamed Fairfield in 1802. The town was named after Fairfield, Connecticut, which was the hometown of many of the settlers.
The town of Fairfield was originally part of the Aroostook County, but in 1827 it was annexed to the newly formed town of Fort Fairfield. The town was named after a fort that was built in the area in 1839 to protect the settlers from the local Native American tribes. The fort was abandoned in 1845, but the town kept the name.
The town of Fort Fairfield was incorporated in 1851 and was primarily an agricultural community. The town was home to several sawmills, gristmills, and a woolen mill. The town also had a thriving lumber industry, which was the main source of income for many of the residents.
In the late 19th century, the town of Fort Fairfield began to experience a period of growth and prosperity. The town was home to several businesses, including a bank, a hotel, a newspaper, and a variety of stores. The town also had a railroad station, which allowed for easy transportation of goods and people.
The town of Fort Fairfield continued to grow and prosper throughout the 20th century. The town was home to several factories, including a paper mill, a shoe factory, and a canning factory. The town also had a variety of stores, restaurants, and other businesses.
Geography
Fort Fairfield is located in Aroostook County, Maine. The town is situated on the Aroostook River, which is a tributary of the Saint John River. The town is bordered by the towns of Presque Isle, Caribou, and Limestone.
The town of Fort Fairfield has a total area of 24.2 square miles, of which 24.1 square miles is land and 0.1 square miles is water. The town is located at an elevation of 545 feet above sea level.
The town of Fort Fairfield has a humid continental climate, with cold winters and warm summers. The average temperature in the winter is around 20 degrees Fahrenheit, and the average temperature in the summer is around 70 degrees Fahrenheit.
Economy
The economy of Fort Fairfield is largely based on agriculture and manufacturing. The town is home to several farms, which produce a variety of crops, including potatoes, hay, and grains. The town also has several factories, which produce a variety of products, including paper, shoes, and canned goods.
The town of Fort Fairfield also has a thriving tourism industry. The town is home to several attractions, including the Aroostook State Park, the Fort Fairfield Historical Society, and the Fort Fairfield Museum. The town also has several restaurants, hotels, and other businesses that cater to tourists.
Demographics
As of the 2010 census, the town of Fort Fairfield had a population of 4,097. The population was spread out, with 25.3% under the age of 18, 8.2% from 18 to 24, 28.2% from 25 to 44, 24.2% from 45 to 64, and 13.9% who were 65 years of age or older. The median age was 38.3 years.
The median income for a household in the town was $37,917, and the median income for a family was $45,938. The per capita income for the town was $18,945. About 11.2% of families and 14.2% of the population were below the poverty line, including 19.2% of those under age 18 and 8.2% of those age 65 or over.
Common Questions
What is the Total Population of Fort Fairfield?
Total Population of Fort Fairfield is 1,566.
What is the Total Male Population of Fort Fairfield?
Total Male Population of Fort Fairfield is 804.
What is the Total Female Population of Fort Fairfield?
Total Female Population of Fort Fairfield is 762.
What is the Ratio of Males per 100 Females in Fort Fairfield?
There are 105.51 Males per 100 Females in Fort Fairfield.
What is the Ratio of Females per 100 Males in Fort Fairfield?
There are 94.78 Females per 100 Males in Fort Fairfield.
What is the Median Population Age in Fort Fairfield?
Median Population Age in Fort Fairfield is 47.6 Years.
What is the Average Family Size in Fort Fairfield
Average Family Size in Fort Fairfield is 2.8 People.
What is the Average Household Size in Fort Fairfield
Average Household Size in Fort Fairfield is 2.3 People.
What is Per Capita Income in Fort Fairfield?
Per Capita income in Fort Fairfield is $28,202.
What is the Median Family Income in Fort Fairfield?
Median Family Income in Fort Fairfield is $78,021.
What is the Median Household income in Fort Fairfield?
Median Household Income in Fort Fairfield is $55,625.
What is Income or Wage Gap in Fort Fairfield?
Income or Wage Gap in Fort Fairfield is 13.5%.
Women in Fort Fairfield earn 86.5 cents for every dollar earned by a man.
What is Inequality or Gini Index in Fort Fairfield?
Inequality or Gini Index in Fort Fairfield is 0.35.
How Large is the Labor Force in Fort Fairfield?
There are 657 People in the Labor Forcein in Fort Fairfield.
What is the Percentage of People in the Labor Force in Fort Fairfield?
49.0% of People are in the Labor Force in Fort Fairfield.
What is the Unemployment Rate in Fort Fairfield?
Unemployment Rate in Fort Fairfield is 13.7%.