Zip Codes with the Highest Percentage of Population Employed in Agriculture, Fishing & Hunting in Silver Spring, MD
RELATED REPORTS & OPTIONS
Agriculture, Fishing & Hunting
Silver Spring
Compare Zip Codes
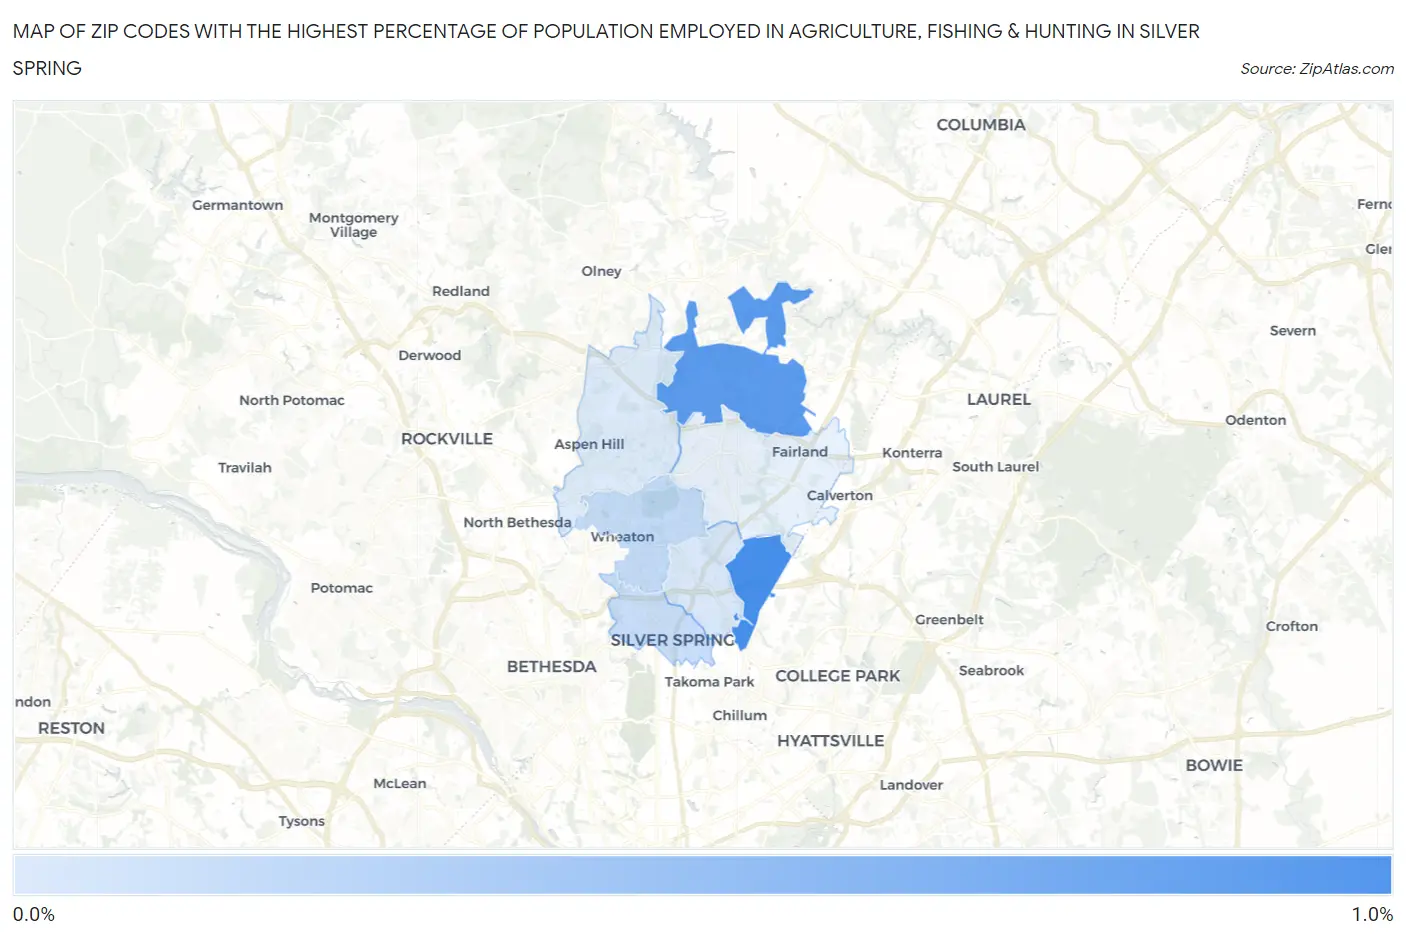
Map of Zip Codes with the Highest Percentage of Population Employed in Agriculture, Fishing & Hunting in Silver Spring
0.070%
0.83%
Zip Codes with the Highest Percentage of Population Employed in Agriculture, Fishing & Hunting in Silver Spring, MD
| Zip Code | % Employed | vs State | vs National | |
| 1. | 20903 | 0.83% | 0.50%(+0.329)#142 | 1.2%(-0.366)#17,046 |
| 2. | 20905 | 0.73% | 0.50%(+0.229)#157 | 1.2%(-0.466)#17,646 |
| 3. | 20902 | 0.20% | 0.50%(-0.304)#236 | 1.2%(-0.999)#22,360 |
| 4. | 20910 | 0.17% | 0.50%(-0.332)#244 | 1.2%(-1.03)#22,694 |
| 5. | 20901 | 0.089% | 0.50%(-0.416)#277 | 1.2%(-1.11)#23,842 |
| 6. | 20906 | 0.070% | 0.50%(-0.434)#284 | 1.2%(-1.13)#24,098 |
1
Common Questions
What are the Top 5 Zip Codes with the Highest Percentage of Population Employed in Agriculture, Fishing & Hunting in Silver Spring, MD?
Top 5 Zip Codes with the Highest Percentage of Population Employed in Agriculture, Fishing & Hunting in Silver Spring, MD are:
What zip code has the Highest Percentage of Population Employed in Agriculture, Fishing & Hunting in Silver Spring, MD?
20903 has the Highest Percentage of Population Employed in Agriculture, Fishing & Hunting in Silver Spring, MD with 0.83%.
What is the Percentage of Population Employed in Agriculture, Fishing & Hunting in Silver Spring, MD?
Percentage of Population Employed in Agriculture, Fishing & Hunting in Silver Spring is 0.17%.
What is the Percentage of Population Employed in Agriculture, Fishing & Hunting in Maryland?
Percentage of Population Employed in Agriculture, Fishing & Hunting in Maryland is 0.50%.
What is the Percentage of Population Employed in Agriculture, Fishing & Hunting in the United States?
Percentage of Population Employed in Agriculture, Fishing & Hunting in the United States is 1.2%.