Zip Codes with the Highest Percentage of Population Employed in Arts, Media & Entertainment in Bethesda, MD
RELATED REPORTS & OPTIONS
Arts, Media & Entertainment
Bethesda
Compare Zip Codes
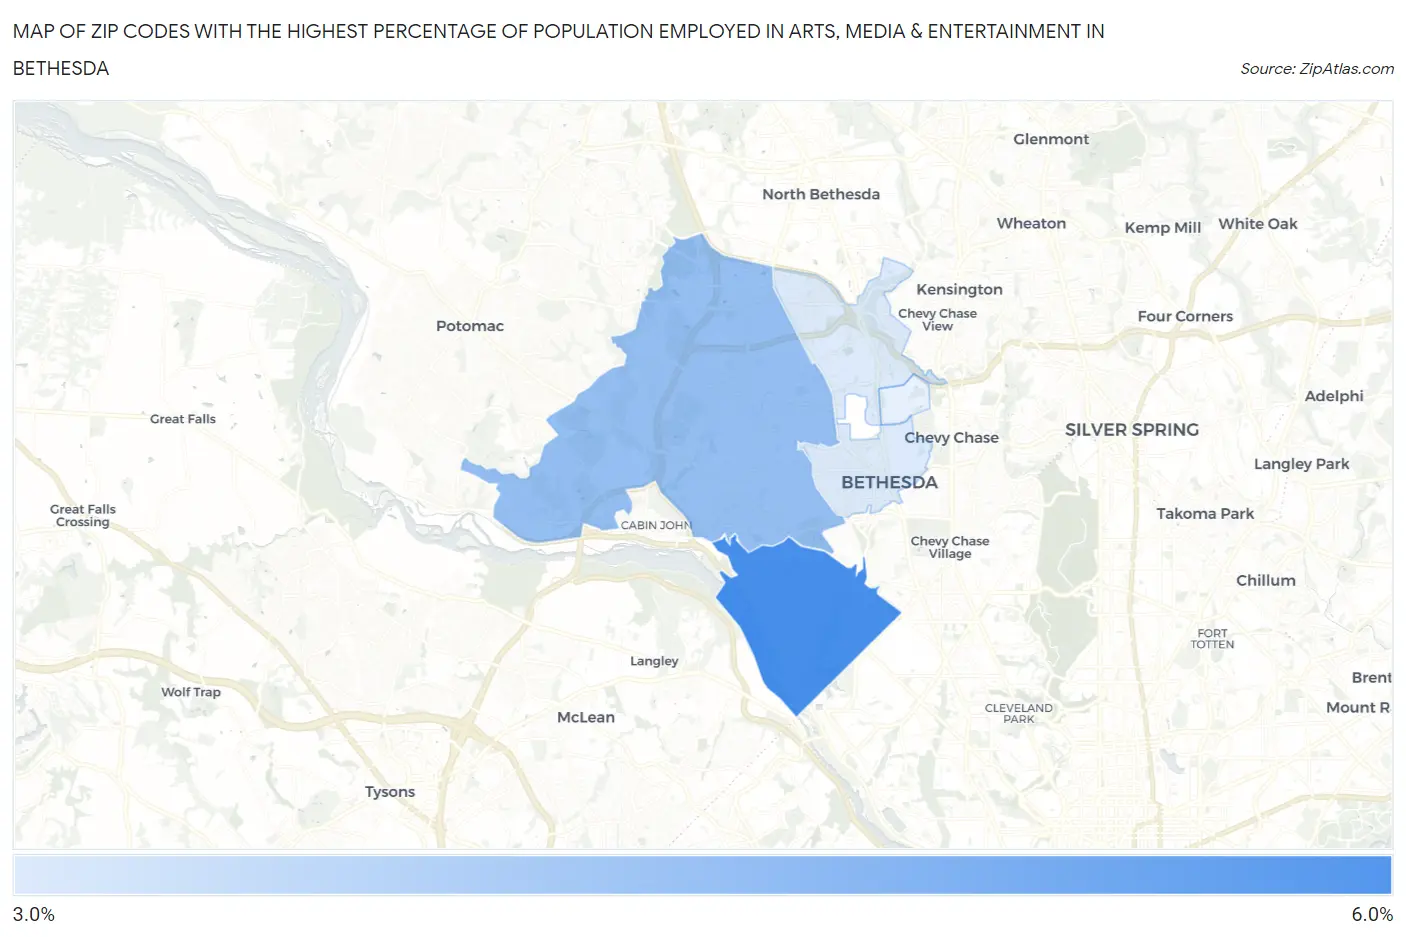
Map of Zip Codes with the Highest Percentage of Population Employed in Arts, Media & Entertainment in Bethesda
4.0%
6.0%
Zip Codes with the Highest Percentage of Population Employed in Arts, Media & Entertainment in Bethesda, MD
| Zip Code | % Employed | vs State | vs National | |
| 1. | 20816 | 6.0% | 2.2%(+3.75)#14 | 2.1%(+3.90)#1,046 |
| 2. | 20817 | 4.9% | 2.2%(+2.72)#29 | 2.1%(+2.88)#1,538 |
| 3. | 20814 | 4.0% | 2.2%(+1.78)#51 | 2.1%(+1.93)#2,371 |
1
Common Questions
What are the Top 3 Zip Codes with the Highest Percentage of Population Employed in Arts, Media & Entertainment in Bethesda, MD?
Top 3 Zip Codes with the Highest Percentage of Population Employed in Arts, Media & Entertainment in Bethesda, MD are:
What zip code has the Highest Percentage of Population Employed in Arts, Media & Entertainment in Bethesda, MD?
20816 has the Highest Percentage of Population Employed in Arts, Media & Entertainment in Bethesda, MD with 6.0%.
What is the Percentage of Population Employed in Arts, Media & Entertainment in Bethesda, MD?
Percentage of Population Employed in Arts, Media & Entertainment in Bethesda is 5.2%.
What is the Percentage of Population Employed in Arts, Media & Entertainment in Maryland?
Percentage of Population Employed in Arts, Media & Entertainment in Maryland is 2.2%.
What is the Percentage of Population Employed in Arts, Media & Entertainment in the United States?
Percentage of Population Employed in Arts, Media & Entertainment in the United States is 2.1%.