Zip Codes with the Highest Percentage of Population Employed in Arts, Entertainment & Recreation in Baltimore, MD
RELATED REPORTS & OPTIONS
Arts, Entertainment & Recreation
Baltimore
Compare Zip Codes
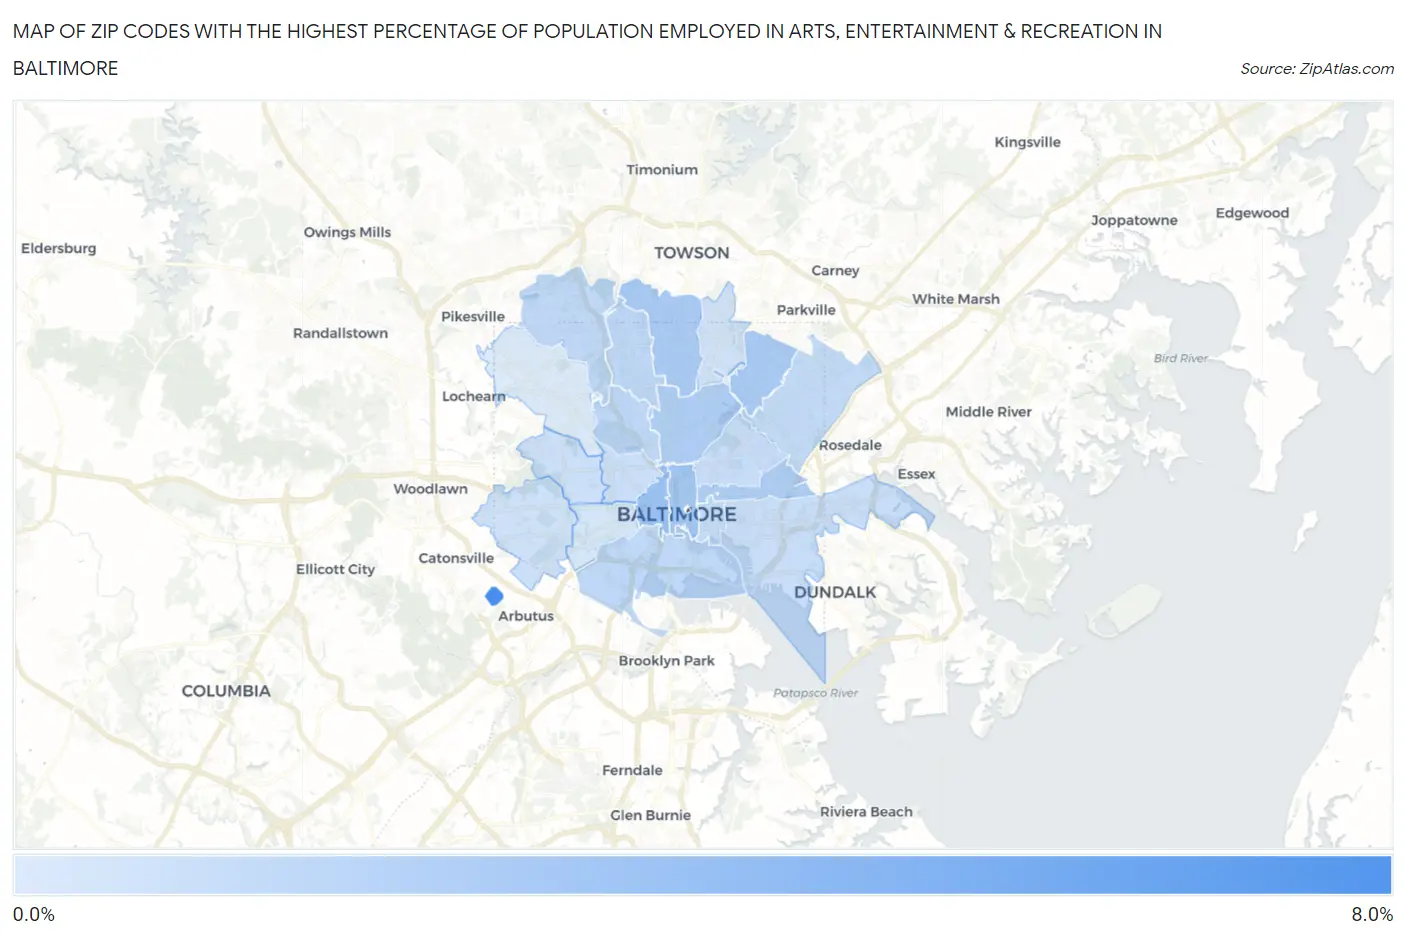
Map of Zip Codes with the Highest Percentage of Population Employed in Arts, Entertainment & Recreation in Baltimore
0.0%
8.0%
Zip Codes with the Highest Percentage of Population Employed in Arts, Entertainment & Recreation in Baltimore, MD
| Zip Code | % Employed | vs State | vs National | |
| 1. | 21250 | 6.9% | 1.9%(+4.94)#16 | 2.1%(+4.77)#1,377 |
| 2. | 21201 | 3.3% | 1.9%(+1.41)#58 | 2.1%(+1.23)#4,536 |
| 3. | 21202 | 3.1% | 1.9%(+1.16)#68 | 2.1%(+0.989)#5,157 |
| 4. | 21214 | 2.8% | 1.9%(+0.877)#86 | 2.1%(+0.706)#6,045 |
| 5. | 21212 | 2.7% | 1.9%(+0.834)#87 | 2.1%(+0.662)#6,212 |
| 6. | 21218 | 2.6% | 1.9%(+0.663)#99 | 2.1%(+0.492)#6,854 |
| 7. | 21205 | 2.5% | 1.9%(+0.638)#100 | 2.1%(+0.467)#6,958 |
| 8. | 21230 | 2.0% | 1.9%(+0.043)#176 | 2.1%(-0.129)#10,049 |
| 9. | 21210 | 1.9% | 1.9%(+0.020)#179 | 2.1%(-0.151)#10,188 |
| 10. | 21211 | 1.9% | 1.9%(-0.017)#187 | 2.1%(-0.188)#10,409 |
| 11. | 21209 | 1.9% | 1.9%(-0.048)#190 | 2.1%(-0.220)#10,597 |
| 12. | 21206 | 1.8% | 1.9%(-0.158)#202 | 2.1%(-0.330)#11,353 |
| 13. | 21231 | 1.7% | 1.9%(-0.164)#203 | 2.1%(-0.335)#11,393 |
| 14. | 21213 | 1.6% | 1.9%(-0.354)#231 | 2.1%(-0.525)#12,793 |
| 15. | 21224 | 1.5% | 1.9%(-0.364)#234 | 2.1%(-0.536)#12,893 |
| 16. | 21217 | 1.5% | 1.9%(-0.458)#245 | 2.1%(-0.630)#13,578 |
| 17. | 21216 | 1.4% | 1.9%(-0.534)#259 | 2.1%(-0.706)#14,158 |
| 18. | 21229 | 1.3% | 1.9%(-0.604)#264 | 2.1%(-0.776)#14,673 |
| 19. | 21239 | 1.1% | 1.9%(-0.768)#278 | 2.1%(-0.939)#15,916 |
| 20. | 21223 | 1.0% | 1.9%(-0.910)#292 | 2.1%(-1.08)#16,952 |
| 21. | 21215 | 0.71% | 1.9%(-1.20)#320 | 2.1%(-1.37)#19,063 |
1
Common Questions
What are the Top 10 Zip Codes with the Highest Percentage of Population Employed in Arts, Entertainment & Recreation in Baltimore, MD?
Top 10 Zip Codes with the Highest Percentage of Population Employed in Arts, Entertainment & Recreation in Baltimore, MD are:
What zip code has the Highest Percentage of Population Employed in Arts, Entertainment & Recreation in Baltimore, MD?
21250 has the Highest Percentage of Population Employed in Arts, Entertainment & Recreation in Baltimore, MD with 6.9%.
What is the Percentage of Population Employed in Arts, Entertainment & Recreation in Baltimore, MD?
Percentage of Population Employed in Arts, Entertainment & Recreation in Baltimore is 1.8%.
What is the Percentage of Population Employed in Arts, Entertainment & Recreation in Maryland?
Percentage of Population Employed in Arts, Entertainment & Recreation in Maryland is 1.9%.
What is the Percentage of Population Employed in Arts, Entertainment & Recreation in the United States?
Percentage of Population Employed in Arts, Entertainment & Recreation in the United States is 2.1%.