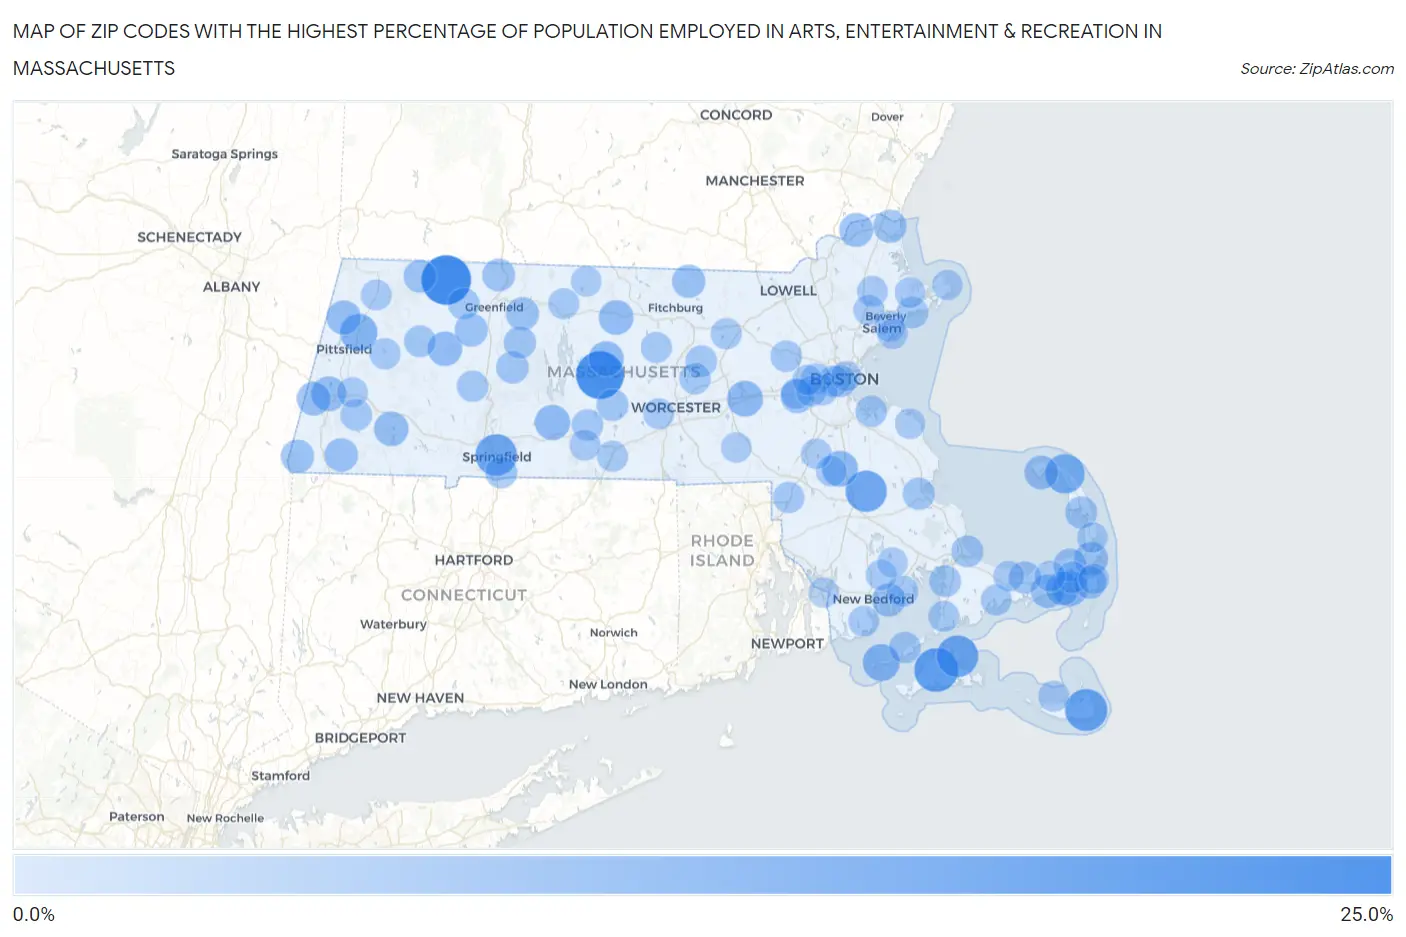
Zip Codes with the Highest Percentage of Population Employed in Arts, Entertainment & Recreation in Massachusetts
RELATED REPORTS & OPTIONS
Arts, Entertainment & Recreation
Massachusetts
Compare Zip Codes
Map of Zip Codes with the Highest Percentage of Population Employed in Arts, Entertainment & Recreation in Massachusetts
0.0%
25.0%
Zip Codes with the Highest Percentage of Population Employed in Arts, Entertainment & Recreation in Massachusetts
| Zip Code | % Employed | vs State | vs National | |
| 1. | 01346 | 21.6% | 2.0%(+19.7)#1 | 2.1%(+19.6)#155 |
| 2. | 01094 | 20.0% | 2.0%(+18.0)#2 | 2.1%(+17.9)#186 |
| 3. | 02575 | 16.2% | 2.0%(+14.2)#3 | 2.1%(+14.1)#283 |
| 4. | 02564 | 14.5% | 2.0%(+12.5)#4 | 2.1%(+12.4)#362 |
| 5. | 02557 | 14.0% | 2.0%(+12.0)#5 | 2.1%(+11.9)#388 |
| 6. | 01103 | 13.9% | 2.0%(+11.9)#6 | 2.1%(+11.8)#396 |
| 7. | 02325 | 13.7% | 2.0%(+11.7)#7 | 2.1%(+11.6)#406 |
| 8. | 02652 | 11.8% | 2.0%(+9.85)#8 | 2.1%(+9.74)#525 |
| 9. | 01224 | 9.8% | 2.0%(+7.83)#9 | 2.1%(+7.72)#736 |
| 10. | 02713 | 9.5% | 2.0%(+7.55)#10 | 2.1%(+7.44)#779 |
| 11. | 01745 | 8.5% | 2.0%(+6.48)#11 | 2.1%(+6.37)#951 |
| 12. | 02357 | 8.4% | 2.0%(+6.45)#12 | 2.1%(+6.34)#962 |
| 13. | 01009 | 8.0% | 2.0%(+5.98)#13 | 2.1%(+5.88)#1,066 |
| 14. | 02646 | 7.9% | 2.0%(+5.94)#14 | 2.1%(+5.84)#1,081 |
| 15. | 01005 | 7.6% | 2.0%(+5.62)#15 | 2.1%(+5.52)#1,154 |
| 16. | 01262 | 7.4% | 2.0%(+5.43)#16 | 2.1%(+5.33)#1,202 |
| 17. | 01468 | 7.4% | 2.0%(+5.41)#17 | 2.1%(+5.31)#1,209 |
| 18. | 01032 | 7.2% | 2.0%(+5.24)#18 | 2.1%(+5.13)#1,260 |
| 19. | 01029 | 7.1% | 2.0%(+5.11)#19 | 2.1%(+5.01)#1,304 |
| 20. | 01237 | 6.9% | 2.0%(+4.96)#20 | 2.1%(+4.86)#1,351 |
| 21. | 01860 | 6.7% | 2.0%(+4.74)#21 | 2.1%(+4.63)#1,411 |
| 22. | 02653 | 6.7% | 2.0%(+4.69)#22 | 2.1%(+4.59)#1,425 |
| 23. | 02657 | 6.5% | 2.0%(+4.52)#23 | 2.1%(+4.42)#1,499 |
| 24. | 01266 | 6.5% | 2.0%(+4.52)#24 | 2.1%(+4.42)#1,500 |
| 25. | 02457 | 6.4% | 2.0%(+4.44)#25 | 2.1%(+4.33)#1,536 |
| 26. | 01244 | 6.3% | 2.0%(+4.37)#26 | 2.1%(+4.27)#1,563 |
| 27. | 02670 | 6.3% | 2.0%(+4.31)#27 | 2.1%(+4.20)#1,594 |
| 28. | 02671 | 6.2% | 2.0%(+4.25)#28 | 2.1%(+4.15)#1,615 |
| 29. | 02719 | 6.1% | 2.0%(+4.10)#29 | 2.1%(+3.99)#1,664 |
| 30. | 01474 | 6.0% | 2.0%(+4.07)#30 | 2.1%(+3.97)#1,674 |
| 31. | 01258 | 5.9% | 2.0%(+3.96)#31 | 2.1%(+3.86)#1,730 |
| 32. | 01341 | 5.9% | 2.0%(+3.95)#32 | 2.1%(+3.85)#1,736 |
| 33. | 02631 | 5.9% | 2.0%(+3.92)#33 | 2.1%(+3.82)#1,746 |
| 34. | 01952 | 5.8% | 2.0%(+3.84)#34 | 2.1%(+3.74)#1,796 |
| 35. | 01349 | 5.8% | 2.0%(+3.83)#35 | 2.1%(+3.73)#1,800 |
| 36. | 02633 | 5.7% | 2.0%(+3.73)#36 | 2.1%(+3.63)#1,851 |
| 37. | 01367 | 5.6% | 2.0%(+3.63)#37 | 2.1%(+3.52)#1,905 |
| 38. | 01337 | 5.6% | 2.0%(+3.59)#38 | 2.1%(+3.49)#1,925 |
| 39. | 01003 | 5.2% | 2.0%(+3.26)#39 | 2.1%(+3.16)#2,124 |
| 40. | 02637 | 5.2% | 2.0%(+3.25)#40 | 2.1%(+3.14)#2,139 |
| 41. | 01054 | 5.1% | 2.0%(+3.12)#41 | 2.1%(+3.01)#2,216 |
| 42. | 02667 | 5.1% | 2.0%(+3.08)#42 | 2.1%(+2.97)#2,247 |
| 43. | 02364 | 5.0% | 2.0%(+2.99)#43 | 2.1%(+2.88)#2,314 |
| 44. | 02199 | 4.9% | 2.0%(+2.90)#44 | 2.1%(+2.80)#2,380 |
| 45. | 02562 | 4.8% | 2.0%(+2.83)#45 | 2.1%(+2.72)#2,437 |
| 46. | 01535 | 4.8% | 2.0%(+2.79)#46 | 2.1%(+2.69)#2,461 |
| 47. | 02645 | 4.7% | 2.0%(+2.70)#47 | 2.1%(+2.60)#2,552 |
| 48. | 02559 | 4.7% | 2.0%(+2.67)#48 | 2.1%(+2.57)#2,574 |
| 49. | 01106 | 4.6% | 2.0%(+2.64)#49 | 2.1%(+2.54)#2,609 |
| 50. | 01026 | 4.6% | 2.0%(+2.59)#50 | 2.1%(+2.49)#2,661 |
| 51. | 01370 | 4.5% | 2.0%(+2.54)#51 | 2.1%(+2.43)#2,724 |
| 52. | 01944 | 4.5% | 2.0%(+2.50)#52 | 2.1%(+2.40)#2,765 |
| 53. | 01510 | 4.5% | 2.0%(+2.48)#53 | 2.1%(+2.38)#2,788 |
| 54. | 02543 | 4.5% | 2.0%(+2.47)#54 | 2.1%(+2.37)#2,798 |
| 55. | 01264 | 4.4% | 2.0%(+2.41)#55 | 2.1%(+2.30)#2,862 |
| 56. | 01773 | 4.4% | 2.0%(+2.40)#56 | 2.1%(+2.30)#2,863 |
| 57. | 02215 | 4.3% | 2.0%(+2.37)#57 | 2.1%(+2.27)#2,903 |
| 58. | 01083 | 4.3% | 2.0%(+2.32)#58 | 2.1%(+2.21)#2,970 |
| 59. | 02191 | 4.3% | 2.0%(+2.32)#59 | 2.1%(+2.21)#2,972 |
| 60. | 01062 | 4.3% | 2.0%(+2.28)#60 | 2.1%(+2.17)#3,015 |
| 61. | 02739 | 4.2% | 2.0%(+2.25)#61 | 2.1%(+2.14)#3,052 |
| 62. | 01505 | 4.2% | 2.0%(+2.22)#62 | 2.1%(+2.11)#3,085 |
| 63. | 02763 | 4.2% | 2.0%(+2.19)#63 | 2.1%(+2.08)#3,122 |
| 64. | 01235 | 4.0% | 2.0%(+2.00)#64 | 2.1%(+1.90)#3,366 |
| 65. | 01364 | 4.0% | 2.0%(+1.99)#65 | 2.1%(+1.88)#3,387 |
| 66. | 02540 | 3.9% | 2.0%(+1.97)#66 | 2.1%(+1.86)#3,412 |
| 67. | 01541 | 3.9% | 2.0%(+1.96)#67 | 2.1%(+1.86)#3,413 |
| 68. | 01451 | 3.9% | 2.0%(+1.93)#68 | 2.1%(+1.83)#3,464 |
| 69. | 01566 | 3.9% | 2.0%(+1.89)#69 | 2.1%(+1.79)#3,523 |
| 70. | 02655 | 3.8% | 2.0%(+1.85)#70 | 2.1%(+1.74)#3,588 |
| 71. | 02660 | 3.8% | 2.0%(+1.84)#71 | 2.1%(+1.74)#3,598 |
| 72. | 02748 | 3.8% | 2.0%(+1.82)#72 | 2.1%(+1.72)#3,627 |
| 73. | 02554 | 3.8% | 2.0%(+1.81)#73 | 2.1%(+1.71)#3,650 |
| 74. | 02458 | 3.8% | 2.0%(+1.80)#74 | 2.1%(+1.70)#3,661 |
| 75. | 01220 | 3.8% | 2.0%(+1.80)#75 | 2.1%(+1.69)#3,668 |
| 76. | 01611 | 3.8% | 2.0%(+1.79)#76 | 2.1%(+1.69)#3,672 |
| 77. | 01929 | 3.7% | 2.0%(+1.77)#77 | 2.1%(+1.66)#3,712 |
| 78. | 02668 | 3.7% | 2.0%(+1.75)#78 | 2.1%(+1.65)#3,732 |
| 79. | 01010 | 3.7% | 2.0%(+1.73)#79 | 2.1%(+1.63)#3,762 |
| 80. | 02467 | 3.7% | 2.0%(+1.70)#80 | 2.1%(+1.59)#3,813 |
| 81. | 02743 | 3.6% | 2.0%(+1.67)#81 | 2.1%(+1.56)#3,866 |
| 82. | 01983 | 3.6% | 2.0%(+1.66)#82 | 2.1%(+1.56)#3,879 |
| 83. | 01923 | 3.6% | 2.0%(+1.66)#83 | 2.1%(+1.55)#3,889 |
| 84. | 01970 | 3.6% | 2.0%(+1.61)#84 | 2.1%(+1.50)#3,978 |
| 85. | 02481 | 3.6% | 2.0%(+1.60)#85 | 2.1%(+1.50)#3,984 |
| 86. | 01238 | 3.5% | 2.0%(+1.56)#86 | 2.1%(+1.46)#4,050 |
| 87. | 02642 | 3.5% | 2.0%(+1.56)#87 | 2.1%(+1.45)#4,053 |
| 88. | 02356 | 3.5% | 2.0%(+1.53)#88 | 2.1%(+1.43)#4,105 |
| 89. | 02650 | 3.5% | 2.0%(+1.53)#89 | 2.1%(+1.42)#4,121 |
| 90. | 01368 | 3.5% | 2.0%(+1.49)#90 | 2.1%(+1.39)#4,196 |
| 91. | 01945 | 3.5% | 2.0%(+1.49)#91 | 2.1%(+1.38)#4,210 |
| 92. | 02461 | 3.4% | 2.0%(+1.46)#92 | 2.1%(+1.36)#4,261 |
| 93. | 02067 | 3.4% | 2.0%(+1.40)#93 | 2.1%(+1.29)#4,409 |
| 94. | 01747 | 3.4% | 2.0%(+1.40)#94 | 2.1%(+1.29)#4,416 |
| 95. | 02066 | 3.4% | 2.0%(+1.38)#95 | 2.1%(+1.28)#4,442 |
| 96. | 02721 | 3.3% | 2.0%(+1.34)#96 | 2.1%(+1.24)#4,524 |
| 97. | 02109 | 3.3% | 2.0%(+1.32)#97 | 2.1%(+1.22)#4,558 |
| 98. | 02770 | 3.3% | 2.0%(+1.32)#98 | 2.1%(+1.21)#4,582 |
| 99. | 01966 | 3.3% | 2.0%(+1.28)#99 | 2.1%(+1.17)#4,675 |
| 100. | 02465 | 3.2% | 2.0%(+1.26)#100 | 2.1%(+1.16)#4,702 |
Common Questions
What are the Top 10 Zip Codes with the Highest Percentage of Population Employed in Arts, Entertainment & Recreation in Massachusetts?
Top 10 Zip Codes with the Highest Percentage of Population Employed in Arts, Entertainment & Recreation in Massachusetts are:
What zip code has the Highest Percentage of Population Employed in Arts, Entertainment & Recreation in Massachusetts?
01346 has the Highest Percentage of Population Employed in Arts, Entertainment & Recreation in Massachusetts with 21.6%.
What is the Percentage of Population Employed in Arts, Entertainment & Recreation in the State of Massachusetts?
Percentage of Population Employed in Arts, Entertainment & Recreation in Massachusetts is 2.0%.
What is the Percentage of Population Employed in Arts, Entertainment & Recreation in the United States?
Percentage of Population Employed in Arts, Entertainment & Recreation in the United States is 2.1%.