Zwolle, LA Map & Demographics
Zwolle Map
Zwolle Overview
$16,798
PER CAPITA INCOME
$35,341
AVG FAMILY INCOME
$29,464
AVG HOUSEHOLD INCOME
34.9%
WAGE / INCOME GAP [ % ]
65.1¢/ $1
WAGE / INCOME GAP [ $ ]
0.46
INEQUALITY / GINI INDEX
1,860
TOTAL POPULATION
964
MALE POPULATION
896
FEMALE POPULATION
107.59
MALES / 100 FEMALES
92.95
FEMALES / 100 MALES
37.9
MEDIAN AGE
3.8
AVG FAMILY SIZE
2.9
AVG HOUSEHOLD SIZE
667
LABOR FORCE [ PEOPLE ]
46.9%
PERCENT IN LABOR FORCE
9.7%
UNEMPLOYMENT RATE
Zwolle Zip Codes
Zwolle Area Codes
Income in Zwolle
Income Overview in Zwolle
Per Capita Income in Zwolle is $16,798, while median incomes of families and households are $35,341 and $29,464 respectively.
| Characteristic | Number | Measure |
| Per Capita Income | 1,860 | $16,798 |
| Median Family Income | 387 | $35,341 |
| Mean Family Income | 387 | $49,236 |
| Median Household Income | 607 | $29,464 |
| Mean Household Income | 607 | $42,971 |
| Income Deficit | 387 | $0 |
| Wage / Income Gap (%) | 1,860 | 34.89% |
| Wage / Income Gap ($) | 1,860 | 65.11¢ per $1 |
| Gini / Inequality Index | 1,860 | 0.46 |
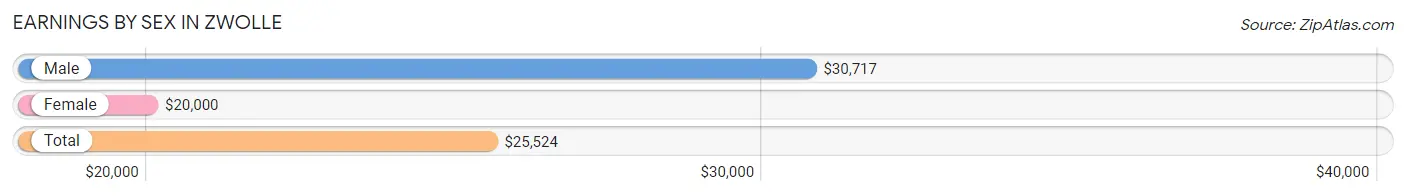
Earnings by Sex in Zwolle
Average Earnings in Zwolle are $25,524, $30,717 for men and $20,000 for women, a difference of 34.9%.
| Sex | Number | Average Earnings |
| Male | 395 (58.0%) | $30,717 |
| Female | 286 (42.0%) | $20,000 |
| Total | 681 (100.0%) | $25,524 |
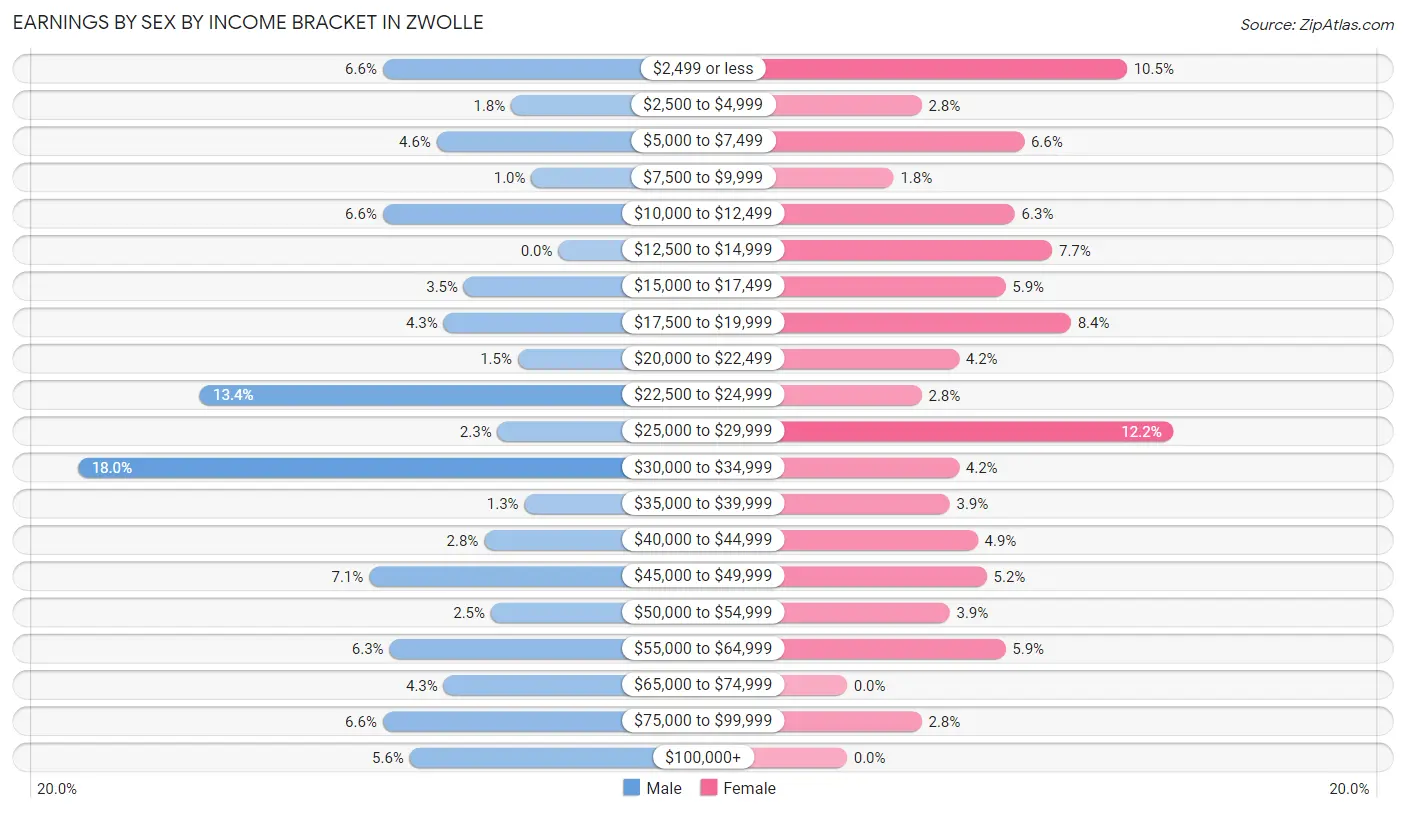
Earnings by Sex by Income Bracket in Zwolle
The most common earnings brackets in Zwolle are $30,000 to $34,999 for men (71 | 18.0%) and $25,000 to $29,999 for women (35 | 12.2%).
| Income | Male | Female |
| $2,499 or less | 26 (6.6%) | 30 (10.5%) |
| $2,500 to $4,999 | 7 (1.8%) | 8 (2.8%) |
| $5,000 to $7,499 | 18 (4.6%) | 19 (6.6%) |
| $7,500 to $9,999 | 4 (1.0%) | 5 (1.8%) |
| $10,000 to $12,499 | 26 (6.6%) | 18 (6.3%) |
| $12,500 to $14,999 | 0 (0.0%) | 22 (7.7%) |
| $15,000 to $17,499 | 14 (3.5%) | 17 (5.9%) |
| $17,500 to $19,999 | 17 (4.3%) | 24 (8.4%) |
| $20,000 to $22,499 | 6 (1.5%) | 12 (4.2%) |
| $22,500 to $24,999 | 53 (13.4%) | 8 (2.8%) |
| $25,000 to $29,999 | 9 (2.3%) | 35 (12.2%) |
| $30,000 to $34,999 | 71 (18.0%) | 12 (4.2%) |
| $35,000 to $39,999 | 5 (1.3%) | 11 (3.8%) |
| $40,000 to $44,999 | 11 (2.8%) | 14 (4.9%) |
| $45,000 to $49,999 | 28 (7.1%) | 15 (5.2%) |
| $50,000 to $54,999 | 10 (2.5%) | 11 (3.8%) |
| $55,000 to $64,999 | 25 (6.3%) | 17 (5.9%) |
| $65,000 to $74,999 | 17 (4.3%) | 0 (0.0%) |
| $75,000 to $99,999 | 26 (6.6%) | 8 (2.8%) |
| $100,000+ | 22 (5.6%) | 0 (0.0%) |
| Total | 395 (100.0%) | 286 (100.0%) |
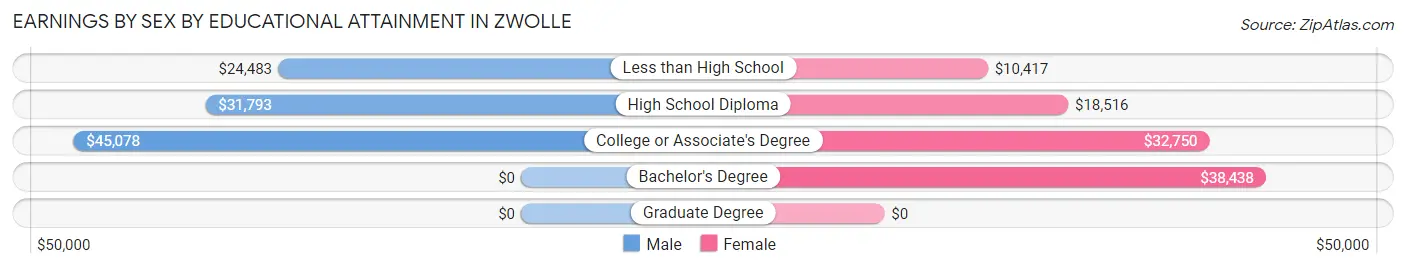
Earnings by Sex by Educational Attainment in Zwolle
Average earnings in Zwolle are $30,820 for men and $22,500 for women, a difference of 27.0%. Men with an educational attainment of college or associate's degree enjoy the highest average annual earnings of $45,078, while those with less than high school education earn the least with $24,483. Women with an educational attainment of bachelor's degree earn the most with the average annual earnings of $38,438, while those with less than high school education have the smallest earnings of $10,417.
| Educational Attainment | Male Income | Female Income |
| Less than High School | $24,483 | $10,417 |
| High School Diploma | $31,793 | $18,516 |
| College or Associate's Degree | $45,078 | $32,750 |
| Bachelor's Degree | - | - |
| Graduate Degree | - | - |
| Total | $30,820 | $22,500 |
Family Income in Zwolle
Family Income Brackets in Zwolle
According to the Zwolle family income data, there are 76 families falling into the $50,000 to $74,999 income range, which is the most common income bracket and makes up 19.6% of all families. Conversely, the $200,000+ income bracket is the least frequent group with only 5 families (1.3%) belonging to this category.
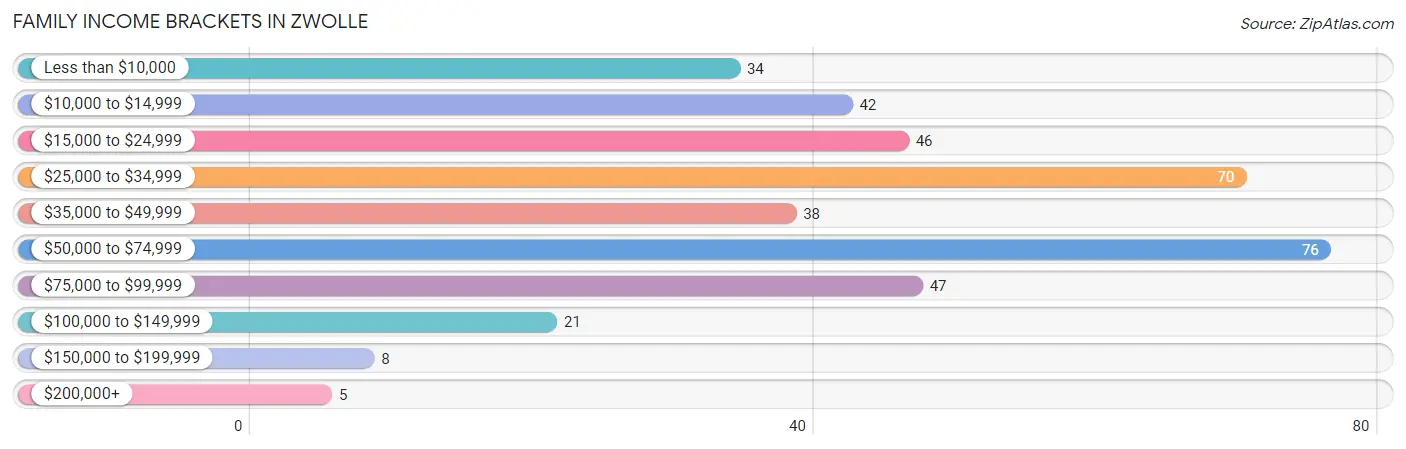
| Income Bracket | # Families | % Families |
| Less than $10,000 | 34 | 8.8% |
| $10,000 to $14,999 | 42 | 10.9% |
| $15,000 to $24,999 | 46 | 11.9% |
| $25,000 to $34,999 | 70 | 18.1% |
| $35,000 to $49,999 | 38 | 9.8% |
| $50,000 to $74,999 | 76 | 19.6% |
| $75,000 to $99,999 | 47 | 12.1% |
| $100,000 to $149,999 | 21 | 5.4% |
| $150,000 to $199,999 | 8 | 2.1% |
| $200,000+ | 5 | 1.3% |
Family Income by Famaliy Size in Zwolle
6-person families (11 | 2.8%) account for the highest median family income in Zwolle with $51,563 per family, while 2-person families (141 | 36.4%) have the highest median income of $20,208 per family member.
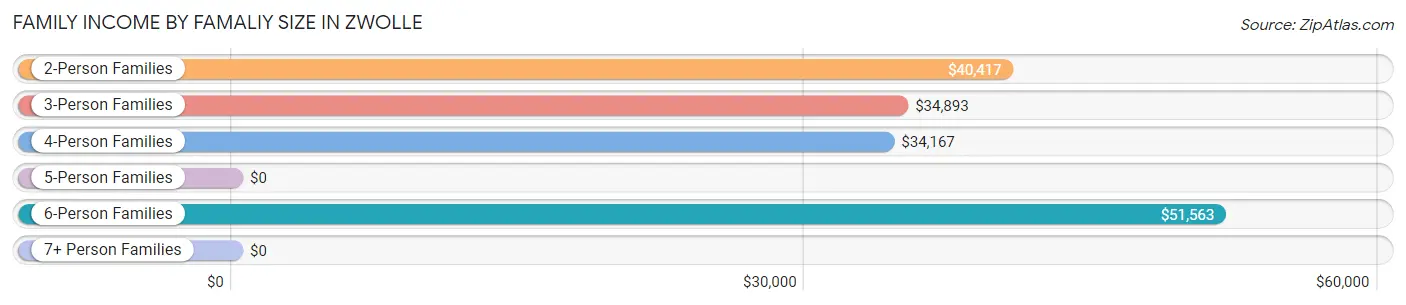
| Income Bracket | # Families | Median Income |
| 2-Person Families | 141 (36.4%) | $40,417 |
| 3-Person Families | 149 (38.5%) | $34,893 |
| 4-Person Families | 66 (17.1%) | $34,167 |
| 5-Person Families | 20 (5.2%) | $0 |
| 6-Person Families | 11 (2.8%) | $51,563 |
| 7+ Person Families | 0 (0.0%) | $0 |
| Total | 387 (100.0%) | $35,341 |
Family Income by Number of Earners in Zwolle
The median family income in Zwolle is $35,341, with families comprising 3+ earners (22) having the highest median family income of $88,750, while families with no earners (74) have the lowest median family income of $15,000, accounting for 5.7% and 19.1% of families, respectively.
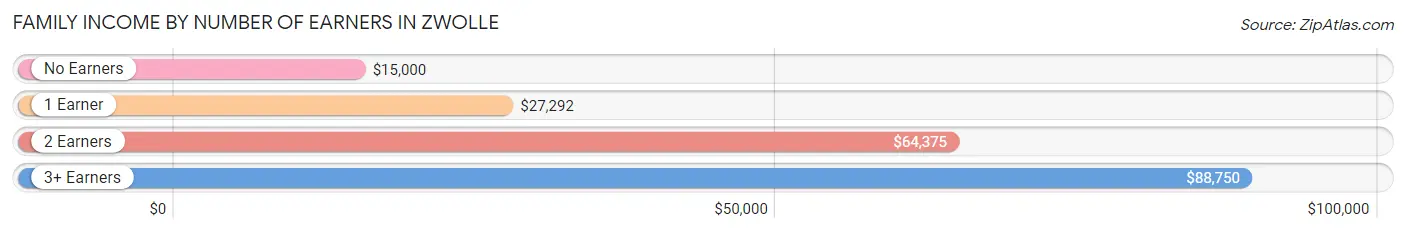
| Number of Earners | # Families | Median Income |
| No Earners | 74 (19.1%) | $15,000 |
| 1 Earner | 167 (43.1%) | $27,292 |
| 2 Earners | 124 (32.0%) | $64,375 |
| 3+ Earners | 22 (5.7%) | $88,750 |
| Total | 387 (100.0%) | $35,341 |
Household Income in Zwolle
Household Income Brackets in Zwolle
With 122 households falling in the category, the $50,000 to $74,999 income range is the most frequent in Zwolle, accounting for 20.1% of all households. In contrast, only 8 households (1.3%) fall into the $150,000 to $199,999 income bracket, making it the least populous group.
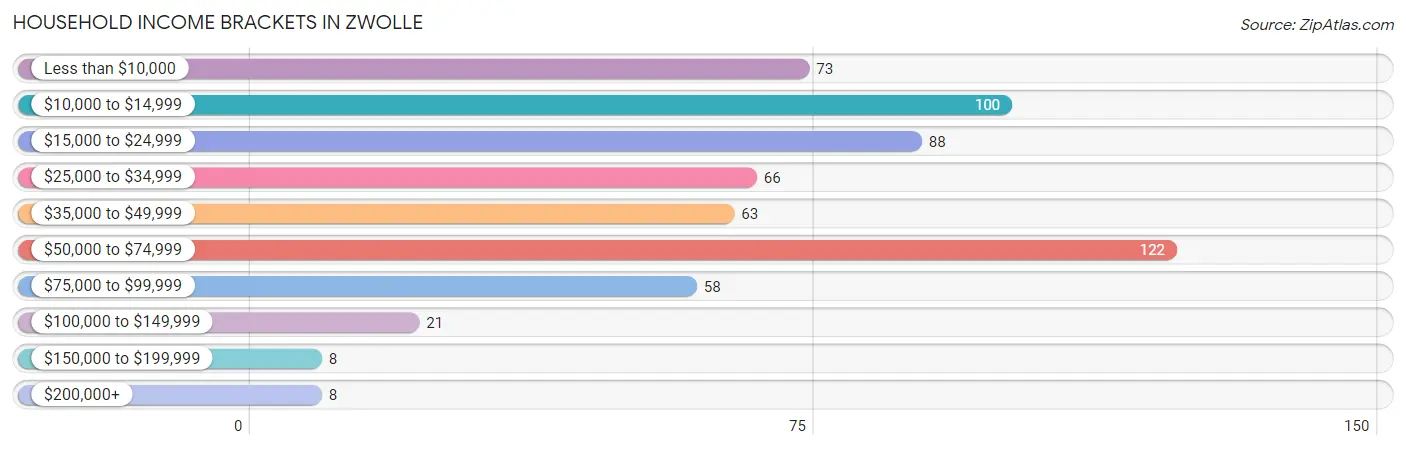
| Income Bracket | # Households | % Households |
| Less than $10,000 | 73 | 12.0% |
| $10,000 to $14,999 | 100 | 16.5% |
| $15,000 to $24,999 | 88 | 14.5% |
| $25,000 to $34,999 | 66 | 10.9% |
| $35,000 to $49,999 | 63 | 10.4% |
| $50,000 to $74,999 | 122 | 20.1% |
| $75,000 to $99,999 | 58 | 9.6% |
| $100,000 to $149,999 | 21 | 3.5% |
| $150,000 to $199,999 | 8 | 1.3% |
| $200,000+ | 8 | 1.3% |
Household Income by Householder Age in Zwolle
The median household income in Zwolle is $29,464, with the highest median household income of $46,875 found in the 25 to 44 years age bracket for the primary householder. A total of 190 households (31.3%) fall into this category. Meanwhile, the 15 to 24 years age bracket for the primary householder has the lowest median household income of $0, with 29 households (4.8%) in this group.
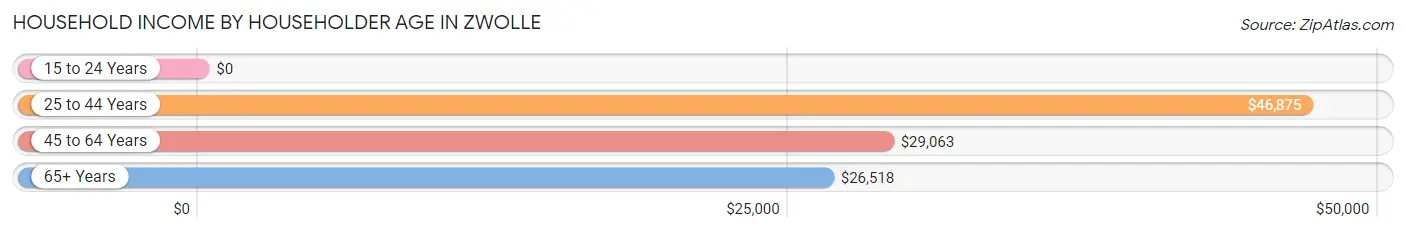
| Income Bracket | # Households | Median Income |
| 15 to 24 Years | 29 (4.8%) | $0 |
| 25 to 44 Years | 190 (31.3%) | $46,875 |
| 45 to 64 Years | 197 (32.5%) | $29,063 |
| 65+ Years | 191 (31.5%) | $26,518 |
| Total | 607 (100.0%) | $29,464 |
Poverty in Zwolle
Income Below Poverty by Sex and Age in Zwolle
With 34.9% poverty level for males and 38.4% for females among the residents of Zwolle, 5 year old males and 6 to 11 year old females are the most vulnerable to poverty, with 5 males (100.0%) and 11 females (68.8%) in their respective age groups living below the poverty level.
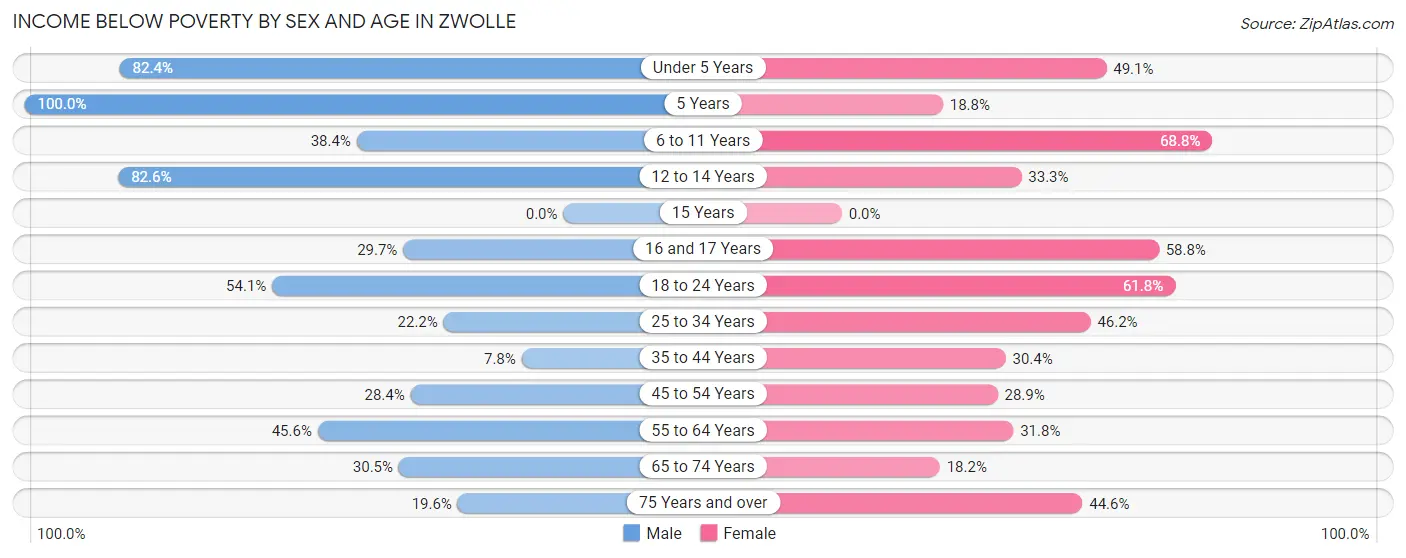
| Age Bracket | Male | Female |
| Under 5 Years | 42 (82.4%) | 81 (49.1%) |
| 5 Years | 5 (100.0%) | 3 (18.8%) |
| 6 to 11 Years | 28 (38.4%) | 11 (68.8%) |
| 12 to 14 Years | 38 (82.6%) | 12 (33.3%) |
| 15 Years | 0 (0.0%) | 0 (0.0%) |
| 16 and 17 Years | 11 (29.7%) | 10 (58.8%) |
| 18 to 24 Years | 60 (54.0%) | 47 (61.8%) |
| 25 to 34 Years | 28 (22.2%) | 30 (46.2%) |
| 35 to 44 Years | 10 (7.7%) | 38 (30.4%) |
| 45 to 54 Years | 38 (28.4%) | 37 (28.9%) |
| 55 to 64 Years | 31 (45.6%) | 21 (31.8%) |
| 65 to 74 Years | 29 (30.5%) | 16 (18.2%) |
| 75 Years and over | 10 (19.6%) | 25 (44.6%) |
| Total | 330 (34.9%) | 331 (38.4%) |
Income Above Poverty by Sex and Age in Zwolle
According to the poverty statistics in Zwolle, males aged 15 years and females aged 15 years are the age groups that are most secure financially, with 100.0% of males and 100.0% of females in these age groups living above the poverty line.
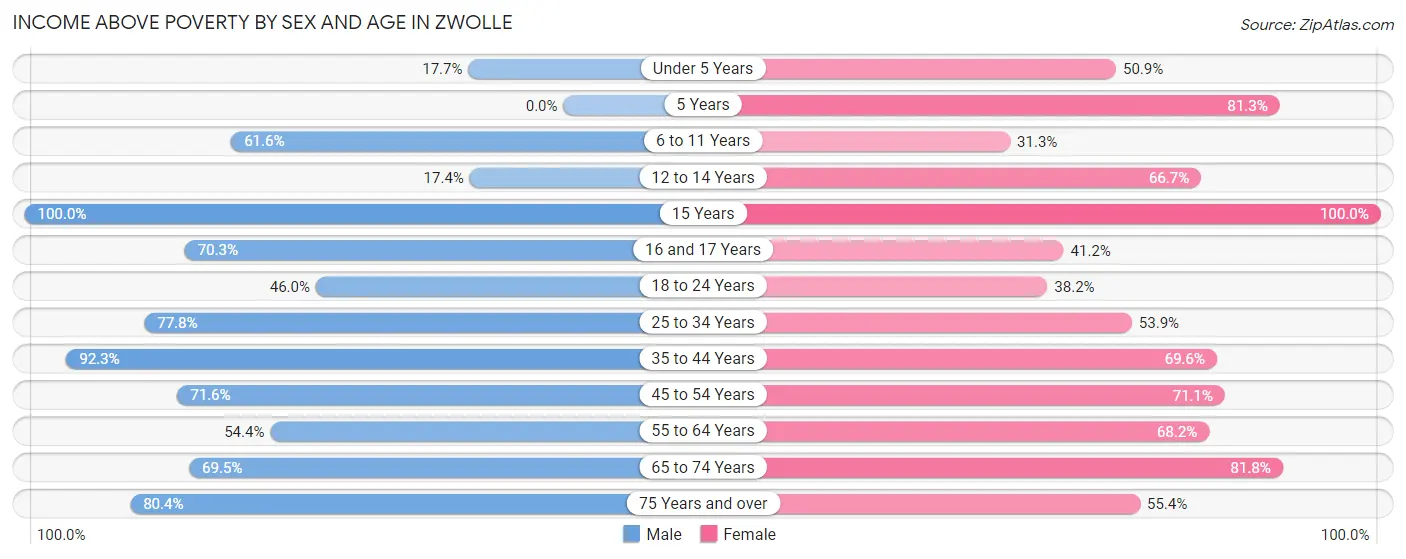
| Age Bracket | Male | Female |
| Under 5 Years | 9 (17.6%) | 84 (50.9%) |
| 5 Years | 0 (0.0%) | 13 (81.2%) |
| 6 to 11 Years | 45 (61.6%) | 5 (31.2%) |
| 12 to 14 Years | 8 (17.4%) | 24 (66.7%) |
| 15 Years | 20 (100.0%) | 9 (100.0%) |
| 16 and 17 Years | 26 (70.3%) | 7 (41.2%) |
| 18 to 24 Years | 51 (46.0%) | 29 (38.2%) |
| 25 to 34 Years | 98 (77.8%) | 35 (53.8%) |
| 35 to 44 Years | 119 (92.2%) | 87 (69.6%) |
| 45 to 54 Years | 96 (71.6%) | 91 (71.1%) |
| 55 to 64 Years | 37 (54.4%) | 45 (68.2%) |
| 65 to 74 Years | 66 (69.5%) | 72 (81.8%) |
| 75 Years and over | 41 (80.4%) | 31 (55.4%) |
| Total | 616 (65.1%) | 532 (61.7%) |
Income Below Poverty Among Married-Couple Families in Zwolle
The poverty statistics for married-couple families in Zwolle show that 12.9% or 26 of the total 202 families live below the poverty line. Families with 1 or 2 children have the highest poverty rate of 14.6%, comprising of 13 families. On the other hand, families with 3 or 4 children have the lowest poverty rate of 0.0%, which includes 0 families.
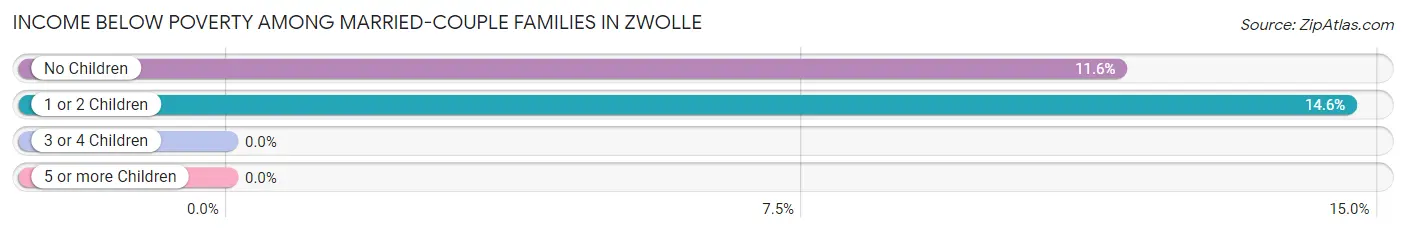
| Children | Above Poverty | Below Poverty |
| No Children | 99 (88.4%) | 13 (11.6%) |
| 1 or 2 Children | 76 (85.4%) | 13 (14.6%) |
| 3 or 4 Children | 1 (100.0%) | 0 (0.0%) |
| 5 or more Children | 0 (0.0%) | 0 (0.0%) |
| Total | 176 (87.1%) | 26 (12.9%) |
Income Below Poverty Among Single-Parent Households in Zwolle
According to the poverty data in Zwolle, 12.2% or 6 single-father households and 56.6% or 77 single-mother households are living below the poverty line. Among single-father households, those with no children have the highest poverty rate, with 5 households (62.5%) experiencing poverty. Likewise, among single-mother households, those with 3 or 4 children have the highest poverty rate, with 20 households (80.0%) falling below the poverty line.
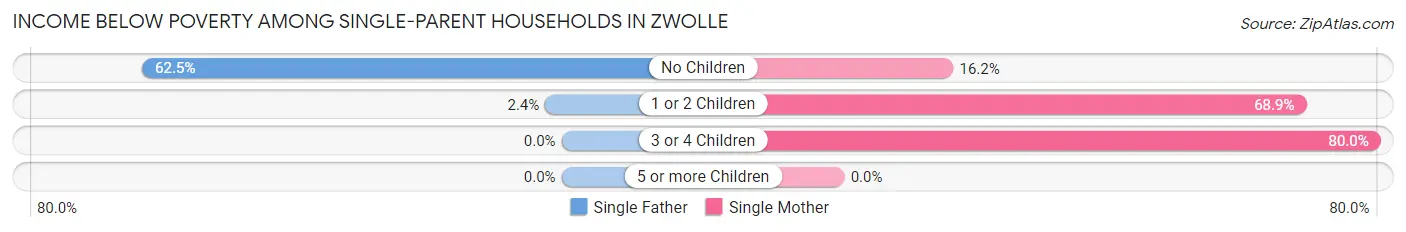
| Children | Single Father | Single Mother |
| No Children | 5 (62.5%) | 6 (16.2%) |
| 1 or 2 Children | 1 (2.4%) | 51 (68.9%) |
| 3 or 4 Children | 0 (0.0%) | 20 (80.0%) |
| 5 or more Children | 0 (0.0%) | 0 (0.0%) |
| Total | 6 (12.2%) | 77 (56.6%) |
Income Below Poverty Among Married-Couple vs Single-Parent Households in Zwolle
The poverty data for Zwolle shows that 26 of the married-couple family households (12.9%) and 83 of the single-parent households (44.9%) are living below the poverty level. Within the married-couple family households, those with 1 or 2 children have the highest poverty rate, with 13 households (14.6%) falling below the poverty line. Among the single-parent households, those with 3 or 4 children have the highest poverty rate, with 20 household (80.0%) living below poverty.
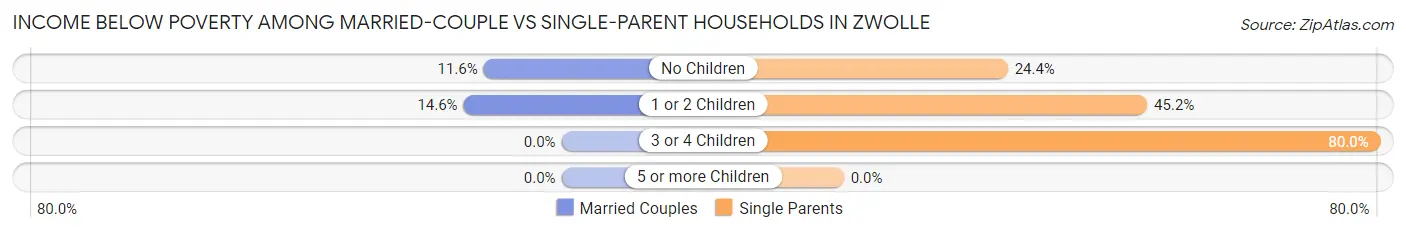
| Children | Married-Couple Families | Single-Parent Households |
| No Children | 13 (11.6%) | 11 (24.4%) |
| 1 or 2 Children | 13 (14.6%) | 52 (45.2%) |
| 3 or 4 Children | 0 (0.0%) | 20 (80.0%) |
| 5 or more Children | 0 (0.0%) | 0 (0.0%) |
| Total | 26 (12.9%) | 83 (44.9%) |
Race in Zwolle
The most populous races in Zwolle are Black / African American (736 | 39.6%), White / Caucasian (551 | 29.6%), and Two or more Races (328 | 17.6%).
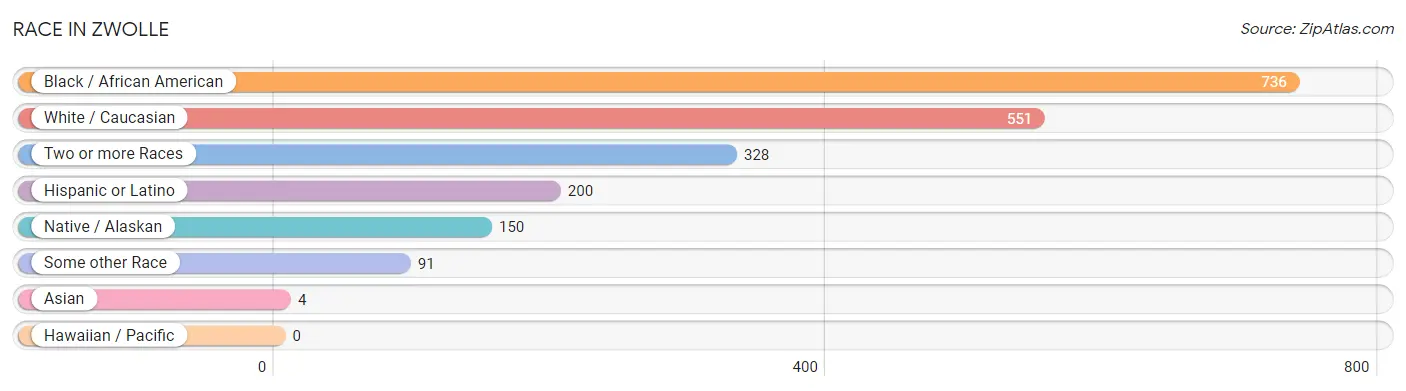
| Race | # Population | % Population |
| Asian | 4 | 0.2% |
| Black / African American | 736 | 39.6% |
| Hawaiian / Pacific | 0 | 0.0% |
| Hispanic or Latino | 200 | 10.7% |
| Native / Alaskan | 150 | 8.1% |
| White / Caucasian | 551 | 29.6% |
| Two or more Races | 328 | 17.6% |
| Some other Race | 91 | 4.9% |
| Total | 1,860 | 100.0% |
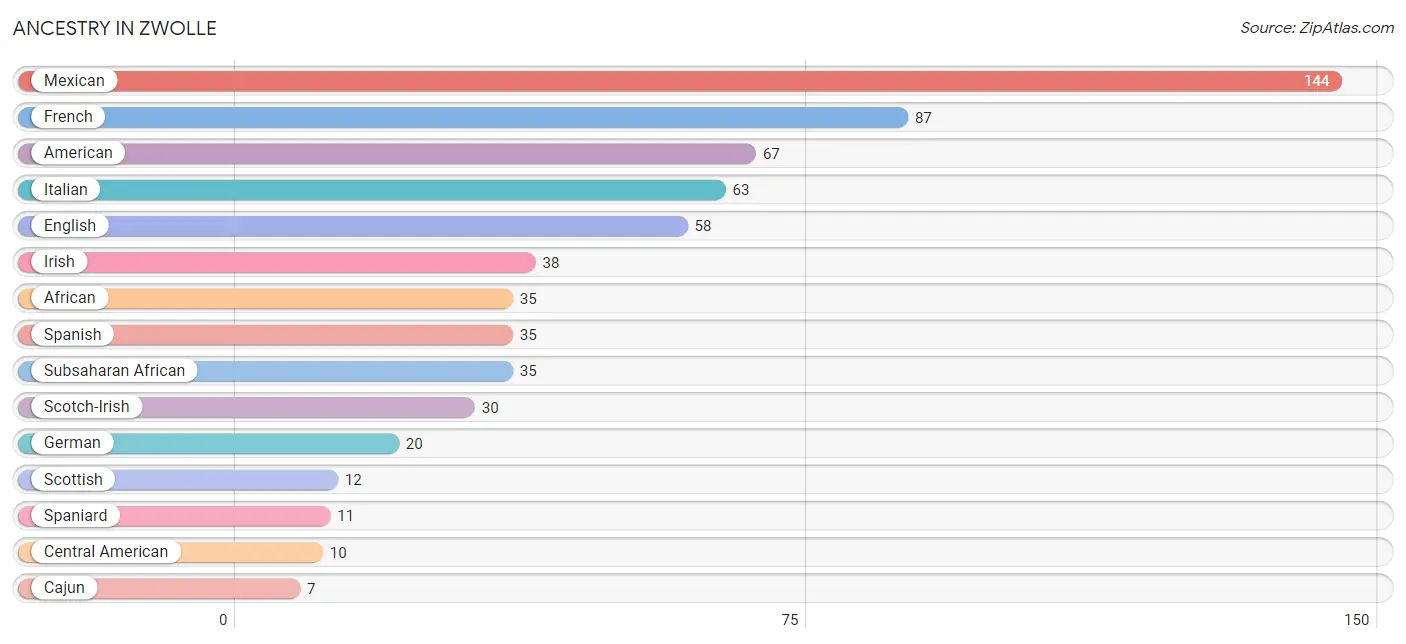
Ancestry in Zwolle
The most populous ancestries reported in Zwolle are Mexican (144 | 7.7%), French (87 | 4.7%), American (67 | 3.6%), Italian (63 | 3.4%), and English (58 | 3.1%), together accounting for 22.5% of all Zwolle residents.
| Ancestry | # Population | % Population |
| African | 35 | 1.9% |
| American | 67 | 3.6% |
| Apache | 5 | 0.3% |
| Blackfeet | 2 | 0.1% |
| British | 3 | 0.2% |
| Cajun | 7 | 0.4% |
| Central American | 10 | 0.5% |
| Cherokee | 4 | 0.2% |
| Cheyenne | 4 | 0.2% |
| Choctaw | 6 | 0.3% |
| Dutch | 5 | 0.3% |
| English | 58 | 3.1% |
| French | 87 | 4.7% |
| French Canadian | 1 | 0.1% |
| German | 20 | 1.1% |
| German Russian | 2 | 0.1% |
| Guamanian / Chamorro | 5 | 0.3% |
| Guatemalan | 5 | 0.3% |
| Irish | 38 | 2.0% |
| Italian | 63 | 3.4% |
| Laotian | 4 | 0.2% |
| Mexican | 144 | 7.7% |
| Norwegian | 3 | 0.2% |
| Panamanian | 5 | 0.3% |
| Portuguese | 4 | 0.2% |
| Scotch-Irish | 30 | 1.6% |
| Scottish | 12 | 0.6% |
| Spaniard | 11 | 0.6% |
| Spanish | 35 | 1.9% |
| Spanish American Indian | 2 | 0.1% |
| Subsaharan African | 35 | 1.9% | View All 31 Rows |
Immigrants in Zwolle
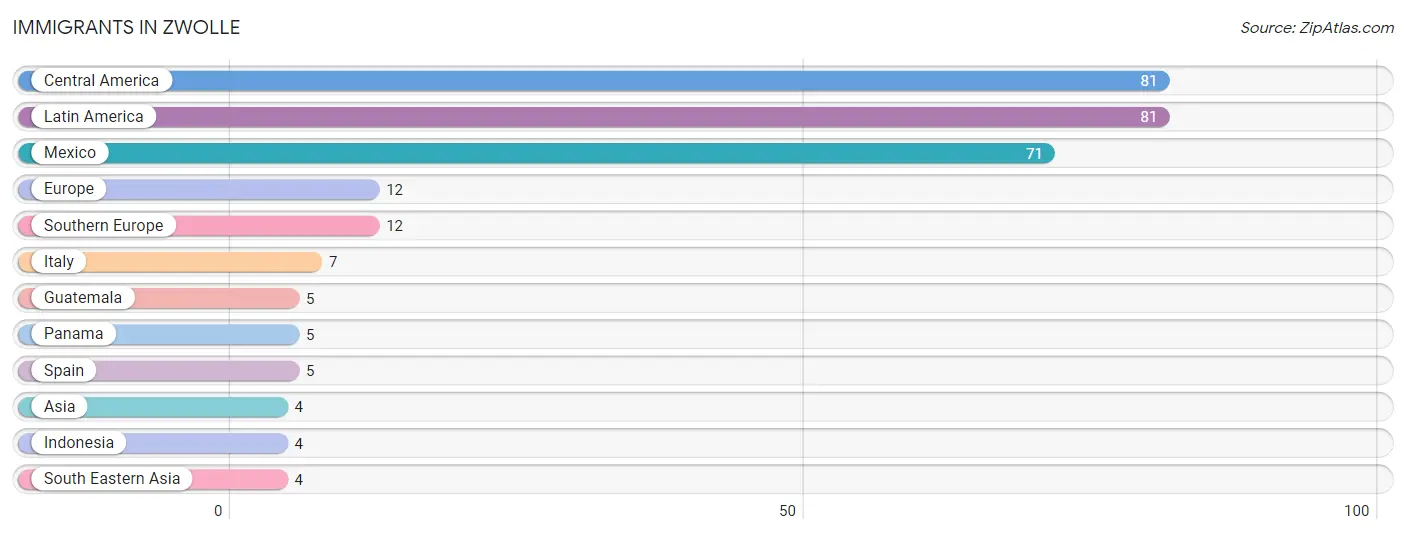
The most numerous immigrant groups reported in Zwolle came from Central America (81 | 4.3%), Latin America (81 | 4.3%), Mexico (71 | 3.8%), Europe (12 | 0.6%), and Southern Europe (12 | 0.6%), together accounting for 13.8% of all Zwolle residents.
| Immigration Origin | # Population | % Population |
| Asia | 4 | 0.2% |
| Central America | 81 | 4.3% |
| Europe | 12 | 0.6% |
| Guatemala | 5 | 0.3% |
| Indonesia | 4 | 0.2% |
| Italy | 7 | 0.4% |
| Latin America | 81 | 4.3% |
| Mexico | 71 | 3.8% |
| Panama | 5 | 0.3% |
| South Eastern Asia | 4 | 0.2% |
| Southern Europe | 12 | 0.6% |
| Spain | 5 | 0.3% | View All 12 Rows |
Sex and Age in Zwolle
Sex and Age in Zwolle
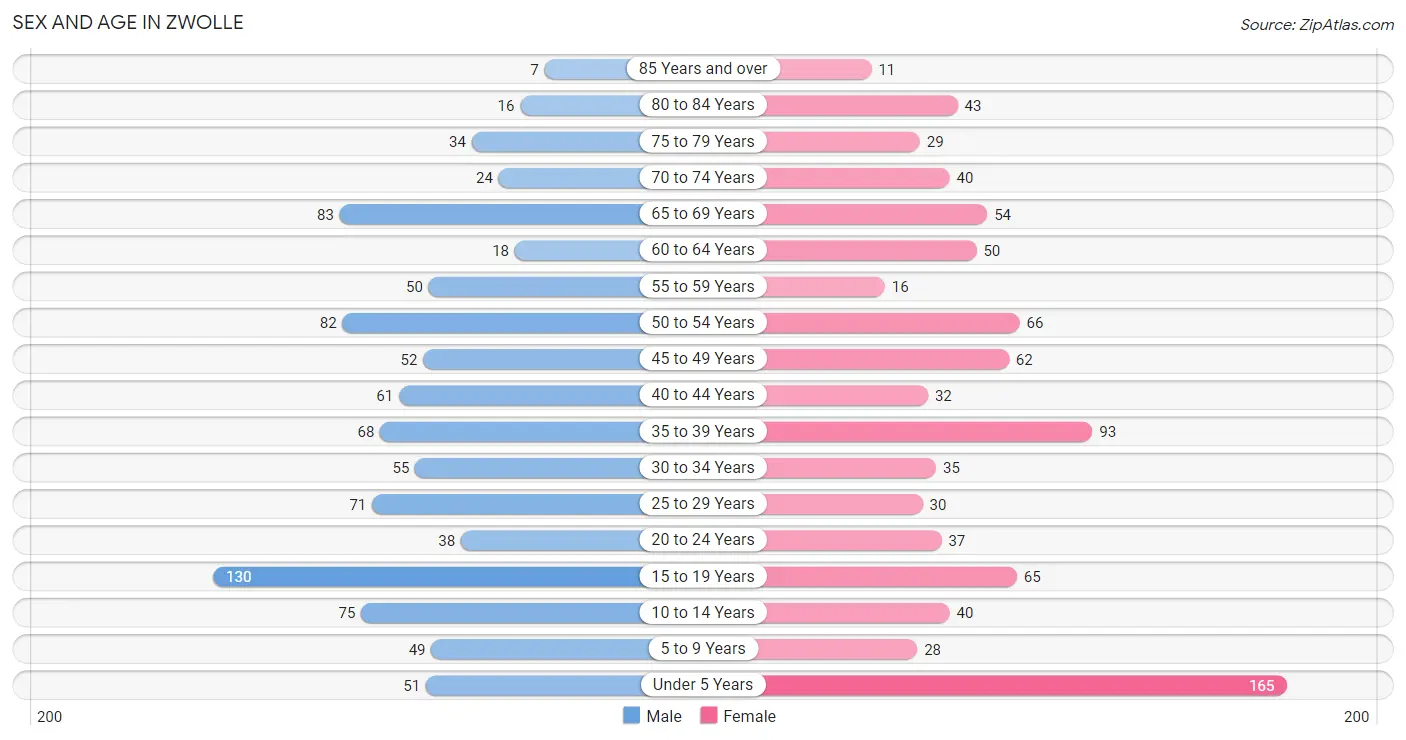
The most populous age groups in Zwolle are 15 to 19 Years (130 | 13.5%) for men and Under 5 Years (165 | 18.4%) for women.
| Age Bracket | Male | Female |
| Under 5 Years | 51 (5.3%) | 165 (18.4%) |
| 5 to 9 Years | 49 (5.1%) | 28 (3.1%) |
| 10 to 14 Years | 75 (7.8%) | 40 (4.5%) |
| 15 to 19 Years | 130 (13.5%) | 65 (7.2%) |
| 20 to 24 Years | 38 (3.9%) | 37 (4.1%) |
| 25 to 29 Years | 71 (7.4%) | 30 (3.4%) |
| 30 to 34 Years | 55 (5.7%) | 35 (3.9%) |
| 35 to 39 Years | 68 (7.0%) | 93 (10.4%) |
| 40 to 44 Years | 61 (6.3%) | 32 (3.6%) |
| 45 to 49 Years | 52 (5.4%) | 62 (6.9%) |
| 50 to 54 Years | 82 (8.5%) | 66 (7.4%) |
| 55 to 59 Years | 50 (5.2%) | 16 (1.8%) |
| 60 to 64 Years | 18 (1.9%) | 50 (5.6%) |
| 65 to 69 Years | 83 (8.6%) | 54 (6.0%) |
| 70 to 74 Years | 24 (2.5%) | 40 (4.5%) |
| 75 to 79 Years | 34 (3.5%) | 29 (3.2%) |
| 80 to 84 Years | 16 (1.7%) | 43 (4.8%) |
| 85 Years and over | 7 (0.7%) | 11 (1.2%) |
| Total | 964 (100.0%) | 896 (100.0%) |
Families and Households in Zwolle
Median Family Size in Zwolle
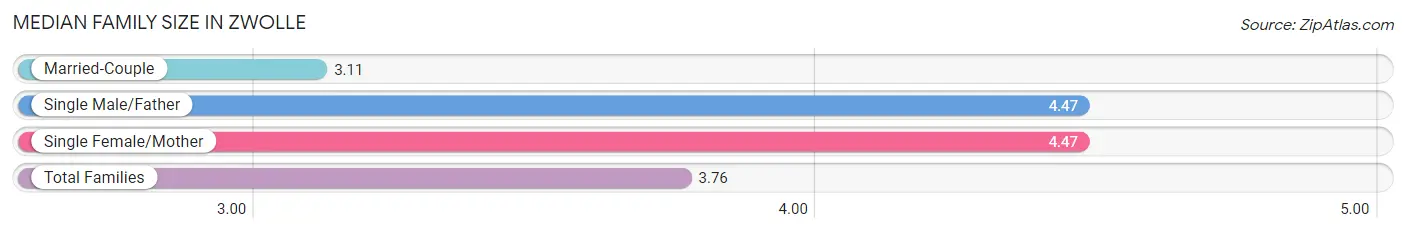
The median family size in Zwolle is 3.76 persons per family, with single male/father families (49 | 12.7%) accounting for the largest median family size of 4.47 persons per family. On the other hand, married-couple families (202 | 52.2%) represent the smallest median family size with 3.11 persons per family.
| Family Type | # Families | Family Size |
| Married-Couple | 202 (52.2%) | 3.11 |
| Single Male/Father | 49 (12.7%) | 4.47 |
| Single Female/Mother | 136 (35.1%) | 4.47 |
| Total Families | 387 (100.0%) | 3.76 |
Median Household Size in Zwolle
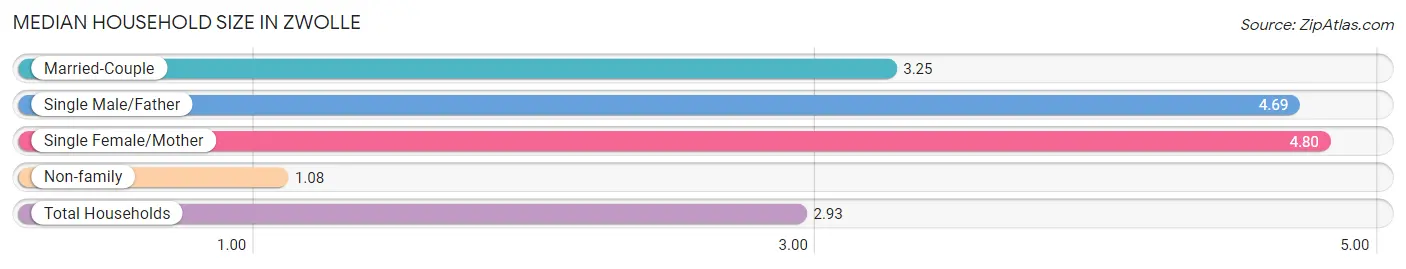
The median household size in Zwolle is 2.93 persons per household, with single female/mother households (136 | 22.4%) accounting for the largest median household size of 4.8 persons per household. non-family households (220 | 36.2%) represent the smallest median household size with 1.08 persons per household.
| Household Type | # Households | Household Size |
| Married-Couple | 202 (33.3%) | 3.25 |
| Single Male/Father | 49 (8.1%) | 4.69 |
| Single Female/Mother | 136 (22.4%) | 4.80 |
| Non-family | 220 (36.2%) | 1.08 |
| Total Households | 607 (100.0%) | 2.93 |
Household Size by Marriage Status in Zwolle
Out of a total of 607 households in Zwolle, 387 (63.8%) are family households, while 220 (36.2%) are nonfamily households. The most numerous type of family households are 2-person households, comprising 133, and the most common type of nonfamily households are 1-person households, comprising 208.
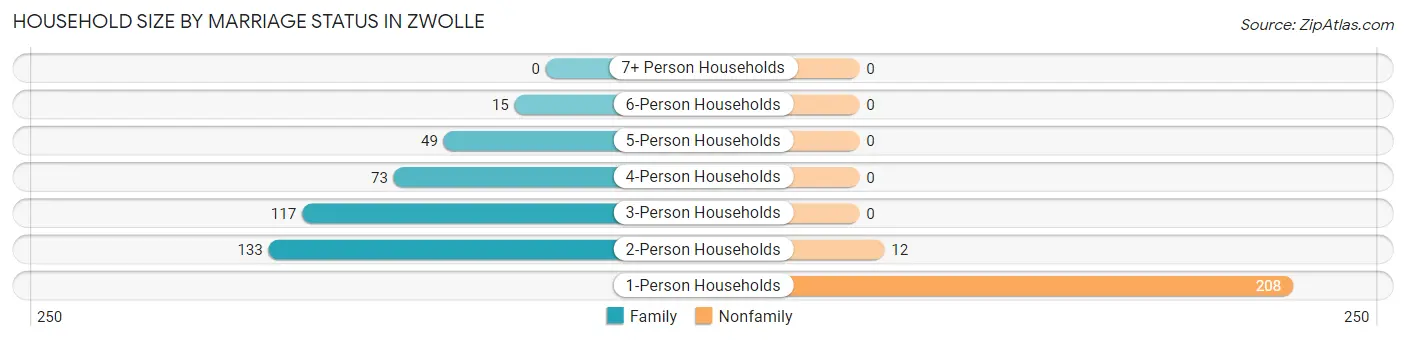
| Household Size | Family Households | Nonfamily Households |
| 1-Person Households | - | 208 (34.3%) |
| 2-Person Households | 133 (21.9%) | 12 (2.0%) |
| 3-Person Households | 117 (19.3%) | 0 (0.0%) |
| 4-Person Households | 73 (12.0%) | 0 (0.0%) |
| 5-Person Households | 49 (8.1%) | 0 (0.0%) |
| 6-Person Households | 15 (2.5%) | 0 (0.0%) |
| 7+ Person Households | 0 (0.0%) | 0 (0.0%) |
| Total | 387 (63.8%) | 220 (36.2%) |
Female Fertility in Zwolle
Fertility by Age in Zwolle
Average fertility rate in Zwolle is 124.0 births per 1,000 women. Women in the age bracket of 20 to 34 years have the highest fertility rate with 167.0 births per 1,000 women. Women in the age bracket of 35 to 50 years acount for 44.4% of all women with births.
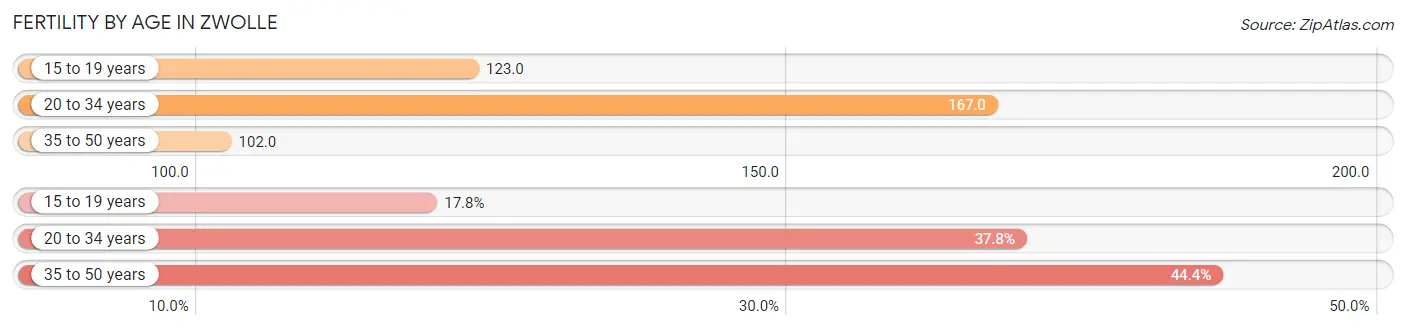
| Age Bracket | Women with Births | Births / 1,000 Women |
| 15 to 19 years | 8 (17.8%) | 123.0 |
| 20 to 34 years | 17 (37.8%) | 167.0 |
| 35 to 50 years | 20 (44.4%) | 102.0 |
| Total | 45 (100.0%) | 124.0 |
Fertility by Age by Marriage Status in Zwolle
8.9% of women with births (45) in Zwolle are married. The highest percentage of unmarried women with births falls into 15 to 19 years age bracket with 100.0% of them unmarried at the time of birth, while the lowest percentage of unmarried women with births belong to 20 to 34 years age bracket with 76.5% of them unmarried.
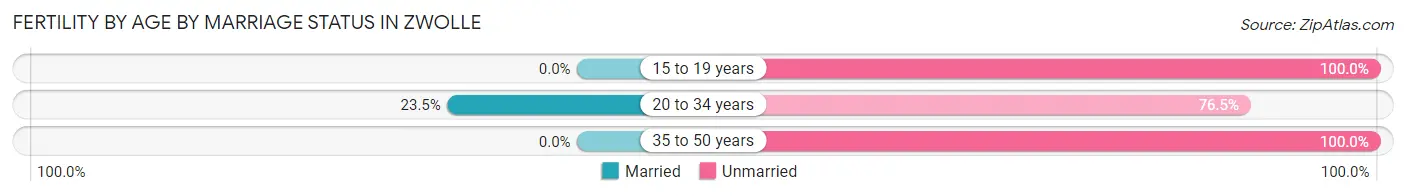
| Age Bracket | Married | Unmarried |
| 15 to 19 years | 0 (0.0%) | 8 (100.0%) |
| 20 to 34 years | 4 (23.5%) | 13 (76.5%) |
| 35 to 50 years | 0 (0.0%) | 20 (100.0%) |
| Total | 4 (8.9%) | 41 (91.1%) |
Fertility by Education in Zwolle
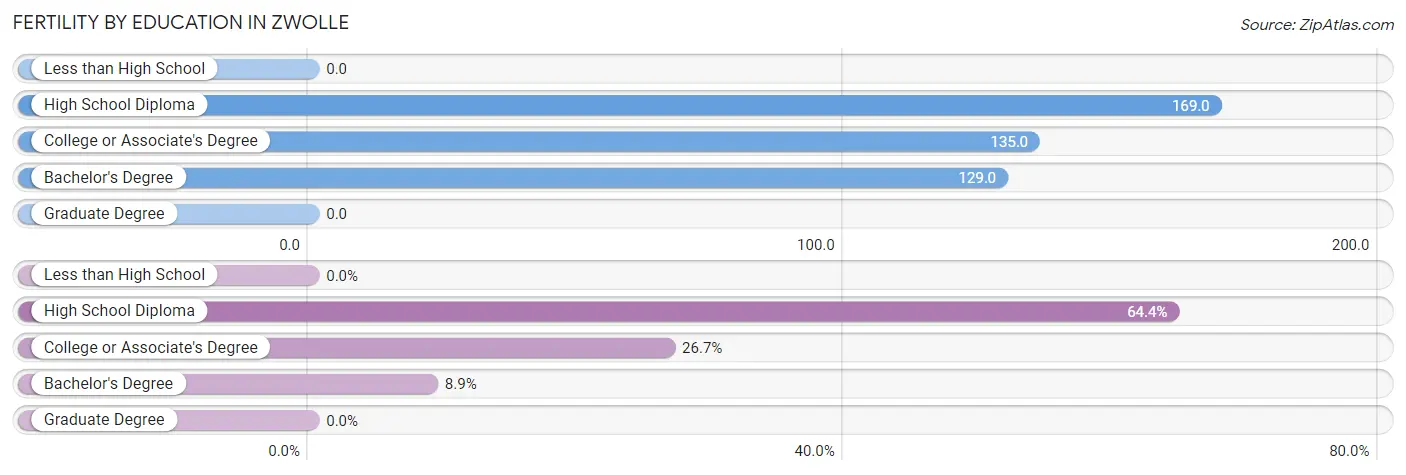
| Educational Attainment | Women with Births | Births / 1,000 Women |
| Less than High School | 0 (0.0%) | 0.0 |
| High School Diploma | 29 (64.4%) | 169.0 |
| College or Associate's Degree | 12 (26.7%) | 135.0 |
| Bachelor's Degree | 4 (8.9%) | 129.0 |
| Graduate Degree | 0 (0.0%) | 0.0 |
| Total | 45 (100.0%) | 124.0 |
Fertility by Education by Marriage Status in Zwolle
91.1% of women with births in Zwolle are unmarried. Women with the educational attainment of bachelor's degree are most likely to be married with 100.0% of them married at childbirth, while women with the educational attainment of high school diploma are least likely to be married with 100.0% of them unmarried at childbirth.
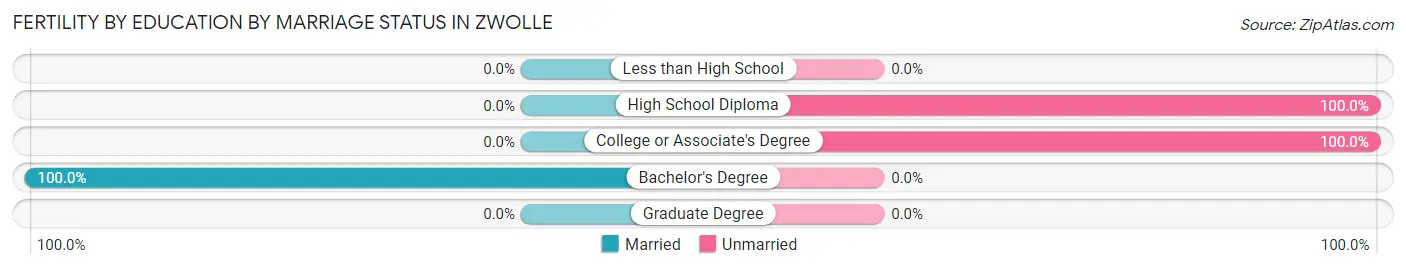
| Educational Attainment | Married | Unmarried |
| Less than High School | 0 (0.0%) | 0 (0.0%) |
| High School Diploma | 0 (0.0%) | 29 (100.0%) |
| College or Associate's Degree | 0 (0.0%) | 12 (100.0%) |
| Bachelor's Degree | 4 (100.0%) | 0 (0.0%) |
| Graduate Degree | 0 (0.0%) | 0 (0.0%) |
| Total | 4 (8.9%) | 41 (91.1%) |
Employment Characteristics in Zwolle
Employment by Class of Employer in Zwolle
Among the 587 employed individuals in Zwolle, private company employees (432 | 73.6%), self-employed (not incorporated) (57 | 9.7%), and state government employees (49 | 8.4%) make up the most common classes of employment.
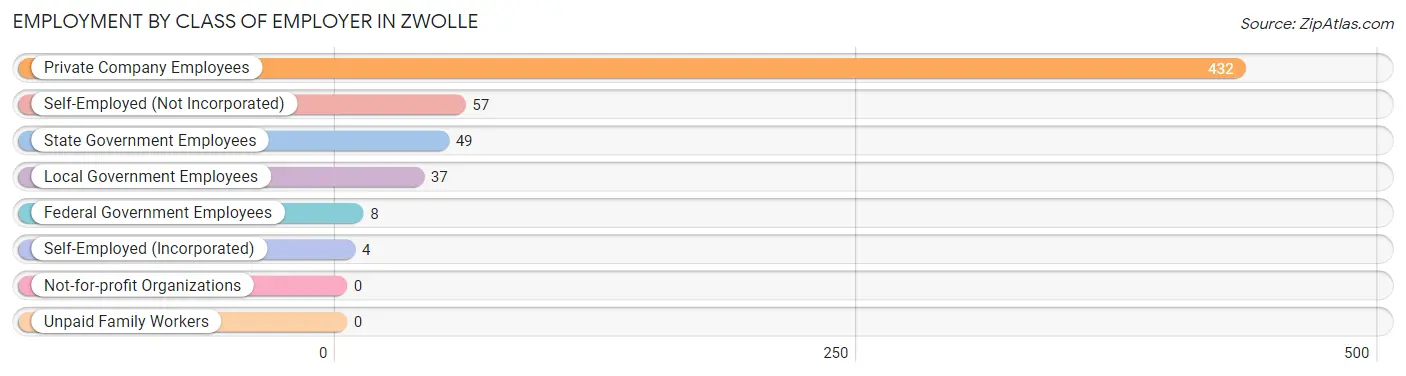
| Employer Class | # Employees | % Employees |
| Private Company Employees | 432 | 73.6% |
| Self-Employed (Incorporated) | 4 | 0.7% |
| Self-Employed (Not Incorporated) | 57 | 9.7% |
| Not-for-profit Organizations | 0 | 0.0% |
| Local Government Employees | 37 | 6.3% |
| State Government Employees | 49 | 8.4% |
| Federal Government Employees | 8 | 1.4% |
| Unpaid Family Workers | 0 | 0.0% |
| Total | 587 | 100.0% |
Employment Status by Age in Zwolle
According to the labor force statistics for Zwolle, out of the total population over 16 years of age (1,423), 46.9% or 667 individuals are in the labor force, with 9.7% or 65 of them unemployed. The age group with the highest labor force participation rate is 25 to 29 years, with 76.2% or 77 individuals in the labor force. Within the labor force, the 16 to 19 years age range has the highest percentage of unemployed individuals, with 28.3% or 13 of them being unemployed.
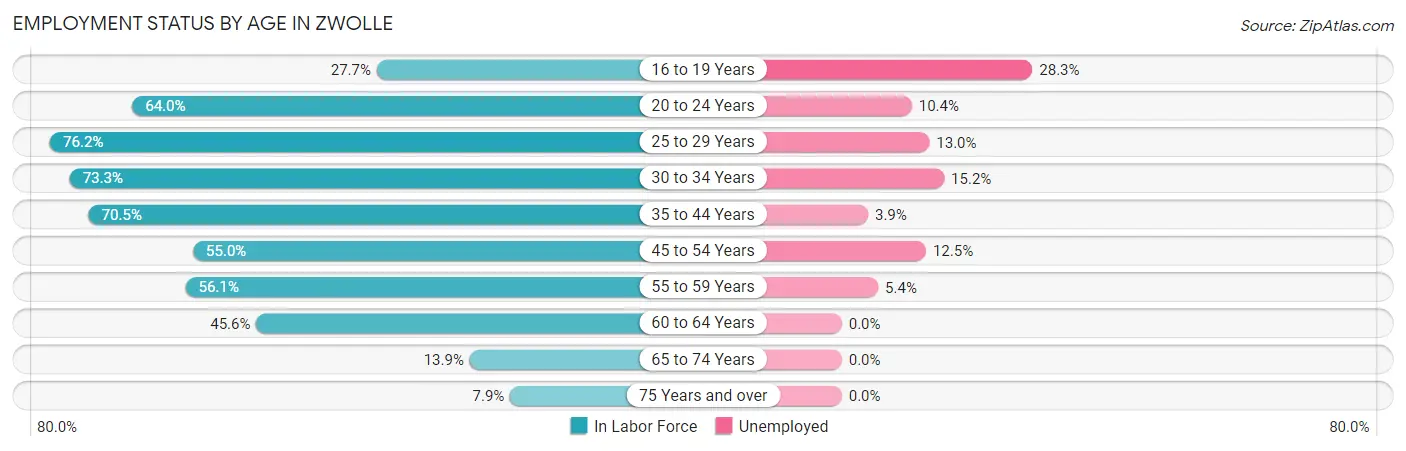
| Age Bracket | In Labor Force | Unemployed |
| 16 to 19 Years | 46 (27.7%) | 13 (28.3%) |
| 20 to 24 Years | 48 (64.0%) | 5 (10.4%) |
| 25 to 29 Years | 77 (76.2%) | 10 (13.0%) |
| 30 to 34 Years | 66 (73.3%) | 10 (15.2%) |
| 35 to 44 Years | 179 (70.5%) | 7 (3.9%) |
| 45 to 54 Years | 144 (55.0%) | 18 (12.5%) |
| 55 to 59 Years | 37 (56.1%) | 2 (5.4%) |
| 60 to 64 Years | 31 (45.6%) | 0 (0.0%) |
| 65 to 74 Years | 28 (13.9%) | 0 (0.0%) |
| 75 Years and over | 11 (7.9%) | 0 (0.0%) |
| Total | 667 (46.9%) | 65 (9.7%) |
Employment Status by Educational Attainment in Zwolle
According to labor force statistics for Zwolle, 63.5% of individuals (534) out of the total population between 25 and 64 years of age (841) are in the labor force, with 8.8% or 47 of them being unemployed. The group with the highest labor force participation rate are those with the educational attainment of college / associate degree, with 80.1% or 133 individuals in the labor force. Within the labor force, individuals with college / associate degree education have the highest percentage of unemployment, with 14.3% or 19 of them being unemployed.
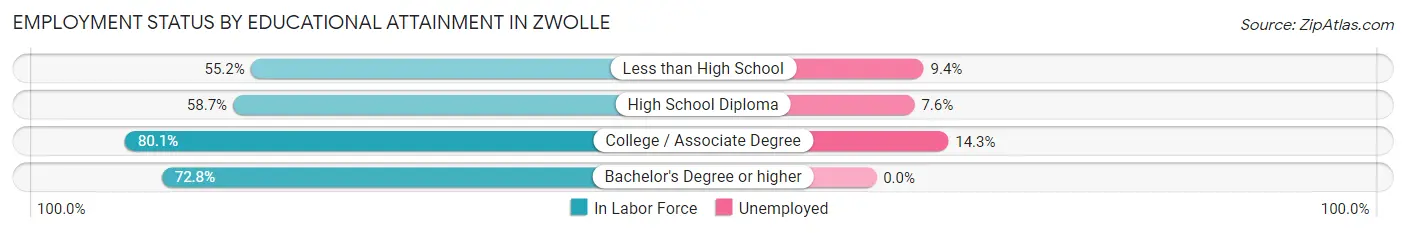
| Educational Attainment | In Labor Force | Unemployed |
| Less than High School | 106 (55.2%) | 18 (9.4%) |
| High School Diploma | 236 (58.7%) | 31 (7.6%) |
| College / Associate Degree | 133 (80.1%) | 24 (14.3%) |
| Bachelor's Degree or higher | 59 (72.8%) | 0 (0.0%) |
| Total | 534 (63.5%) | 74 (8.8%) |
Employment Occupations by Sex in Zwolle
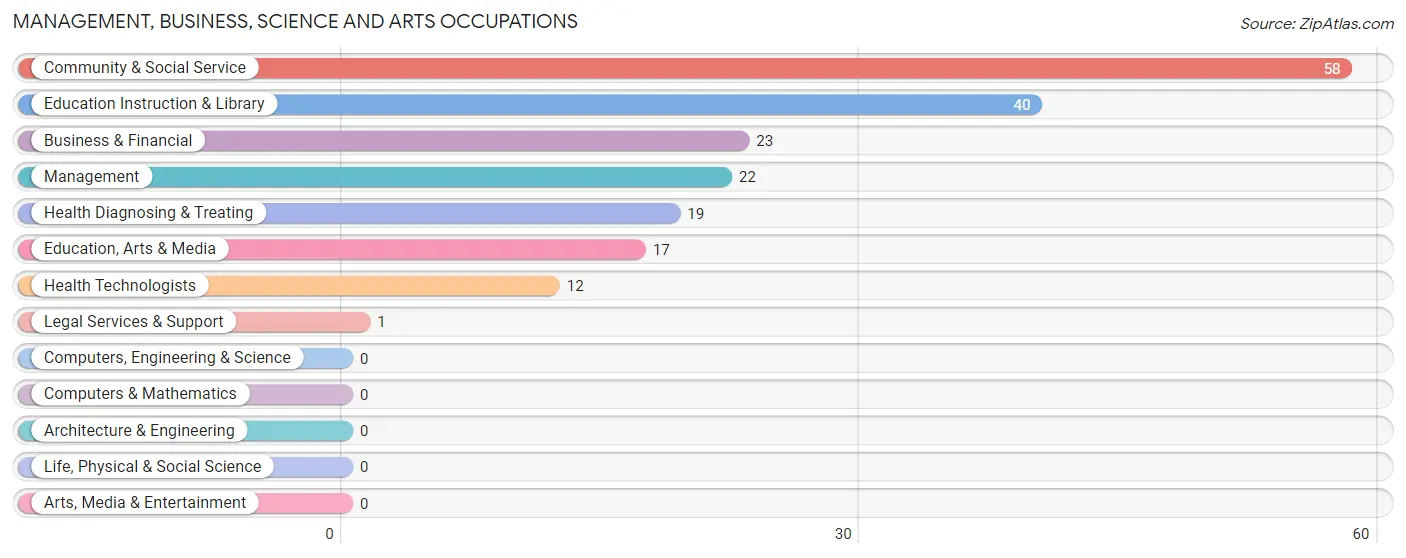
Management, Business, Science and Arts Occupations
The most common Management, Business, Science and Arts occupations in Zwolle are Community & Social Service (58 | 9.6%), Education Instruction & Library (40 | 6.6%), Business & Financial (23 | 3.8%), Management (22 | 3.6%), and Health Diagnosing & Treating (19 | 3.2%).
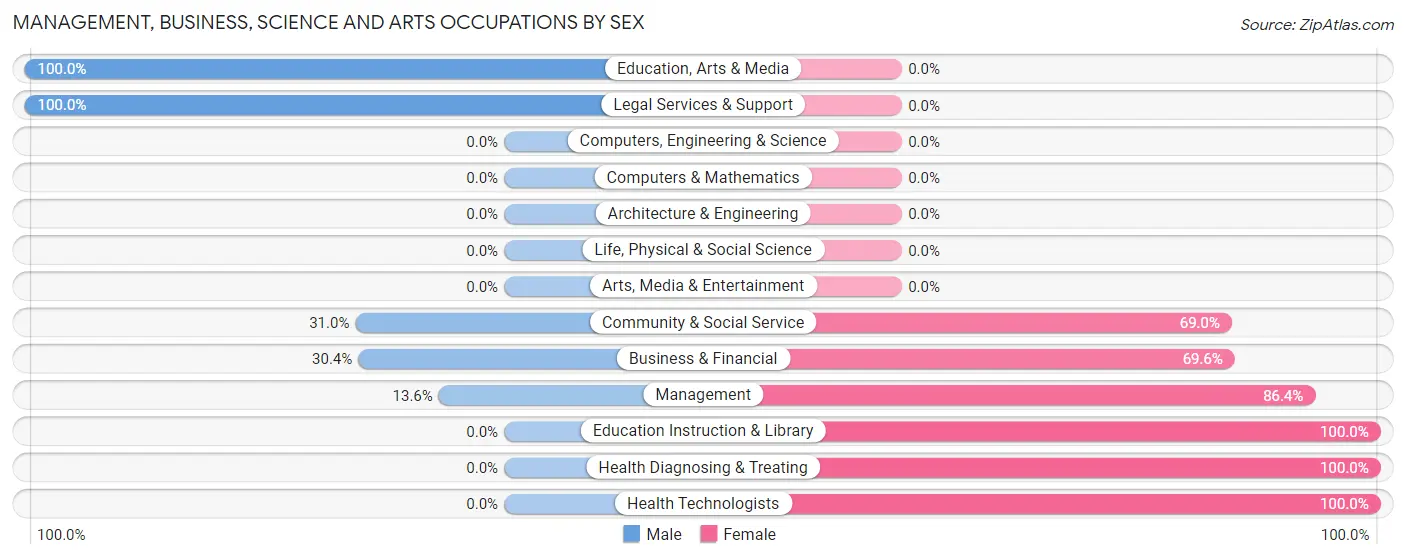
Management, Business, Science and Arts Occupations by Sex
Within the Management, Business, Science and Arts occupations in Zwolle, the most male-oriented occupations are Education, Arts & Media (100.0%), Legal Services & Support (100.0%), and Community & Social Service (31.0%), while the most female-oriented occupations are Education Instruction & Library (100.0%), Health Diagnosing & Treating (100.0%), and Health Technologists (100.0%).
| Occupation | Male | Female |
| Management | 3 (13.6%) | 19 (86.4%) |
| Business & Financial | 7 (30.4%) | 16 (69.6%) |
| Computers, Engineering & Science | 0 (0.0%) | 0 (0.0%) |
| Computers & Mathematics | 0 (0.0%) | 0 (0.0%) |
| Architecture & Engineering | 0 (0.0%) | 0 (0.0%) |
| Life, Physical & Social Science | 0 (0.0%) | 0 (0.0%) |
| Community & Social Service | 18 (31.0%) | 40 (69.0%) |
| Education, Arts & Media | 17 (100.0%) | 0 (0.0%) |
| Legal Services & Support | 1 (100.0%) | 0 (0.0%) |
| Education Instruction & Library | 0 (0.0%) | 40 (100.0%) |
| Arts, Media & Entertainment | 0 (0.0%) | 0 (0.0%) |
| Health Diagnosing & Treating | 0 (0.0%) | 19 (100.0%) |
| Health Technologists | 0 (0.0%) | 12 (100.0%) |
| Total (Category) | 28 (23.0%) | 94 (77.0%) |
| Total (Overall) | 351 (58.3%) | 251 (41.7%) |
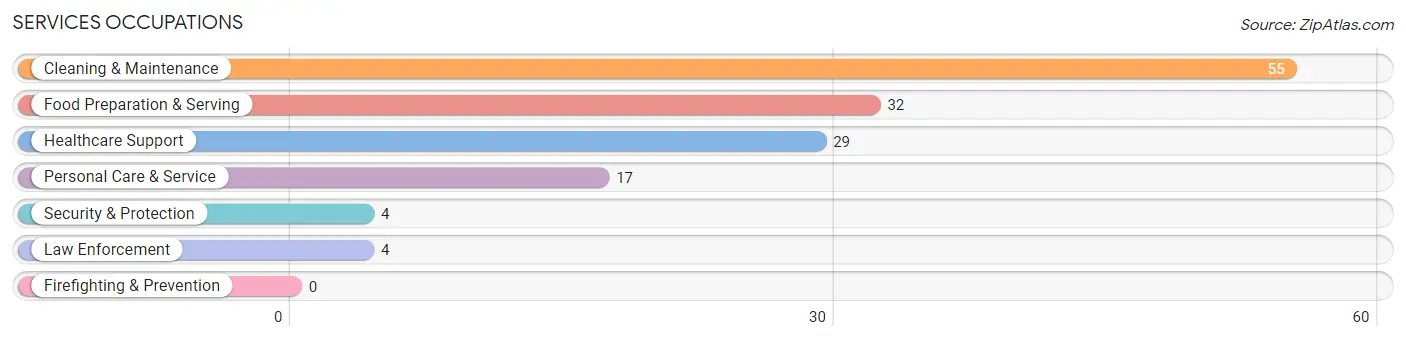
Services Occupations
The most common Services occupations in Zwolle are Cleaning & Maintenance (55 | 9.1%), Food Preparation & Serving (32 | 5.3%), Healthcare Support (29 | 4.8%), Personal Care & Service (17 | 2.8%), and Security & Protection (4 | 0.7%).
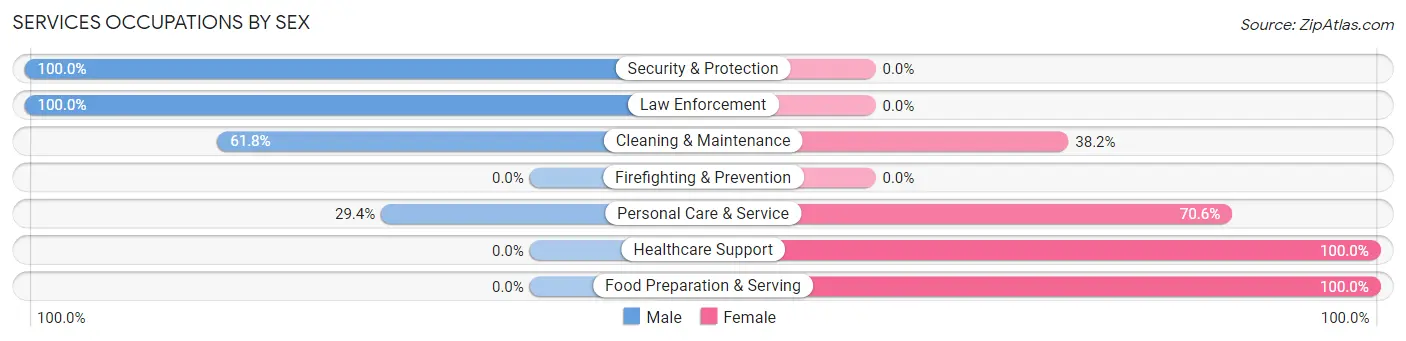
Services Occupations by Sex
Within the Services occupations in Zwolle, the most male-oriented occupations are Security & Protection (100.0%), Law Enforcement (100.0%), and Cleaning & Maintenance (61.8%), while the most female-oriented occupations are Healthcare Support (100.0%), Food Preparation & Serving (100.0%), and Personal Care & Service (70.6%).
| Occupation | Male | Female |
| Healthcare Support | 0 (0.0%) | 29 (100.0%) |
| Security & Protection | 4 (100.0%) | 0 (0.0%) |
| Firefighting & Prevention | 0 (0.0%) | 0 (0.0%) |
| Law Enforcement | 4 (100.0%) | 0 (0.0%) |
| Food Preparation & Serving | 0 (0.0%) | 32 (100.0%) |
| Cleaning & Maintenance | 34 (61.8%) | 21 (38.2%) |
| Personal Care & Service | 5 (29.4%) | 12 (70.6%) |
| Total (Category) | 43 (31.4%) | 94 (68.6%) |
| Total (Overall) | 351 (58.3%) | 251 (41.7%) |
Sales and Office Occupations
The most common Sales and Office occupations in Zwolle are Office & Administration (56 | 9.3%), and Sales & Related (36 | 6.0%).
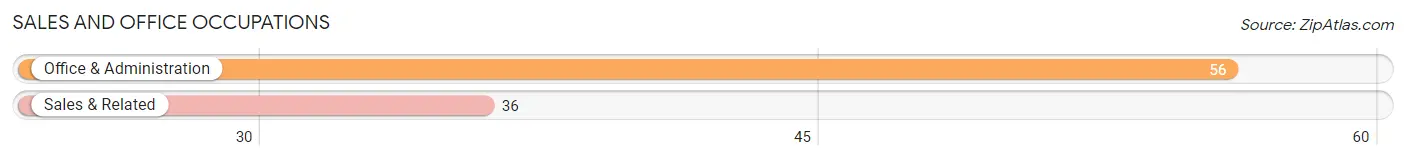
Sales and Office Occupations by Sex
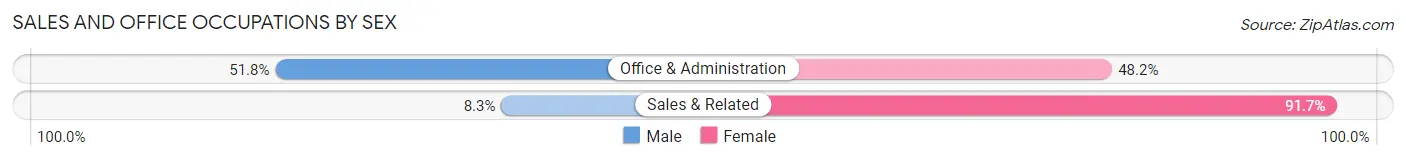
| Occupation | Male | Female |
| Sales & Related | 3 (8.3%) | 33 (91.7%) |
| Office & Administration | 29 (51.8%) | 27 (48.2%) |
| Total (Category) | 32 (34.8%) | 60 (65.2%) |
| Total (Overall) | 351 (58.3%) | 251 (41.7%) |
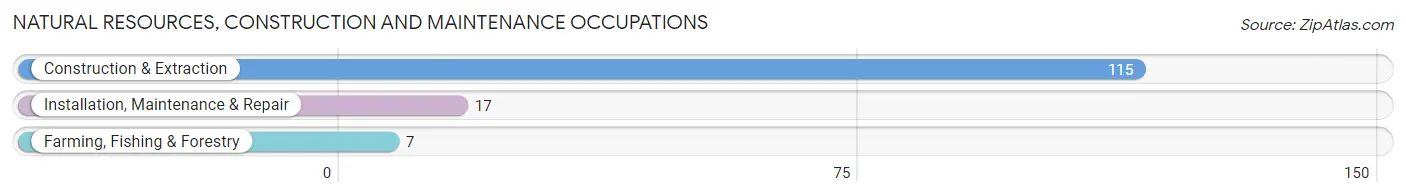
Natural Resources, Construction and Maintenance Occupations
The most common Natural Resources, Construction and Maintenance occupations in Zwolle are Construction & Extraction (115 | 19.1%), Installation, Maintenance & Repair (17 | 2.8%), and Farming, Fishing & Forestry (7 | 1.2%).
Natural Resources, Construction and Maintenance Occupations by Sex
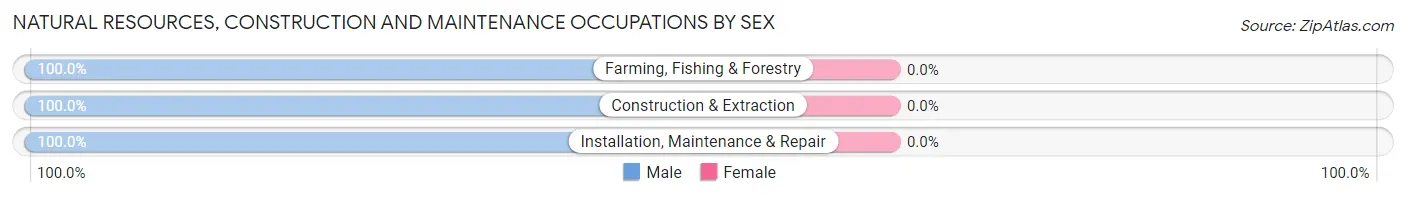
| Occupation | Male | Female |
| Farming, Fishing & Forestry | 7 (100.0%) | 0 (0.0%) |
| Construction & Extraction | 115 (100.0%) | 0 (0.0%) |
| Installation, Maintenance & Repair | 17 (100.0%) | 0 (0.0%) |
| Total (Category) | 139 (100.0%) | 0 (0.0%) |
| Total (Overall) | 351 (58.3%) | 251 (41.7%) |
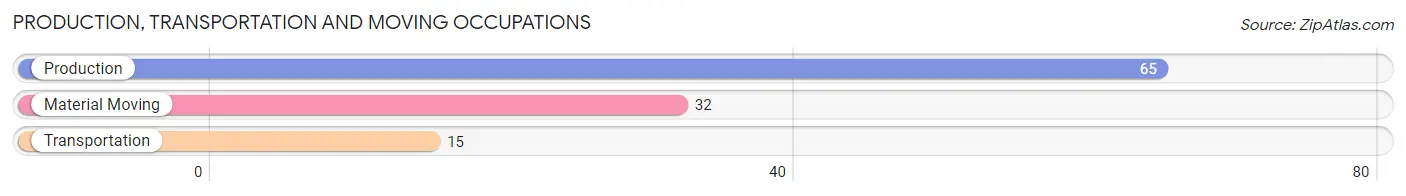
Production, Transportation and Moving Occupations
The most common Production, Transportation and Moving occupations in Zwolle are Production (65 | 10.8%), Material Moving (32 | 5.3%), and Transportation (15 | 2.5%).
Production, Transportation and Moving Occupations by Sex
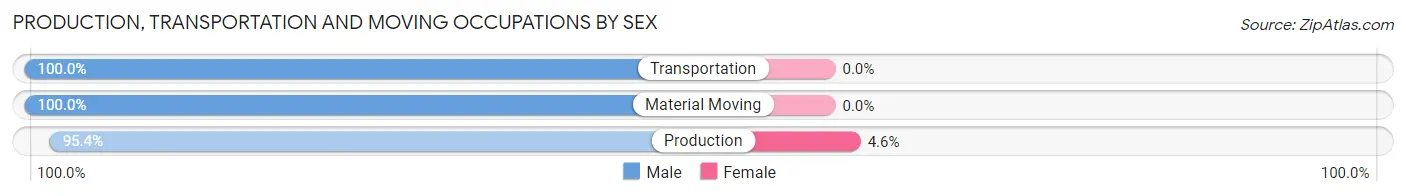
| Occupation | Male | Female |
| Production | 62 (95.4%) | 3 (4.6%) |
| Transportation | 15 (100.0%) | 0 (0.0%) |
| Material Moving | 32 (100.0%) | 0 (0.0%) |
| Total (Category) | 109 (97.3%) | 3 (2.7%) |
| Total (Overall) | 351 (58.3%) | 251 (41.7%) |
Employment Industries by Sex in Zwolle
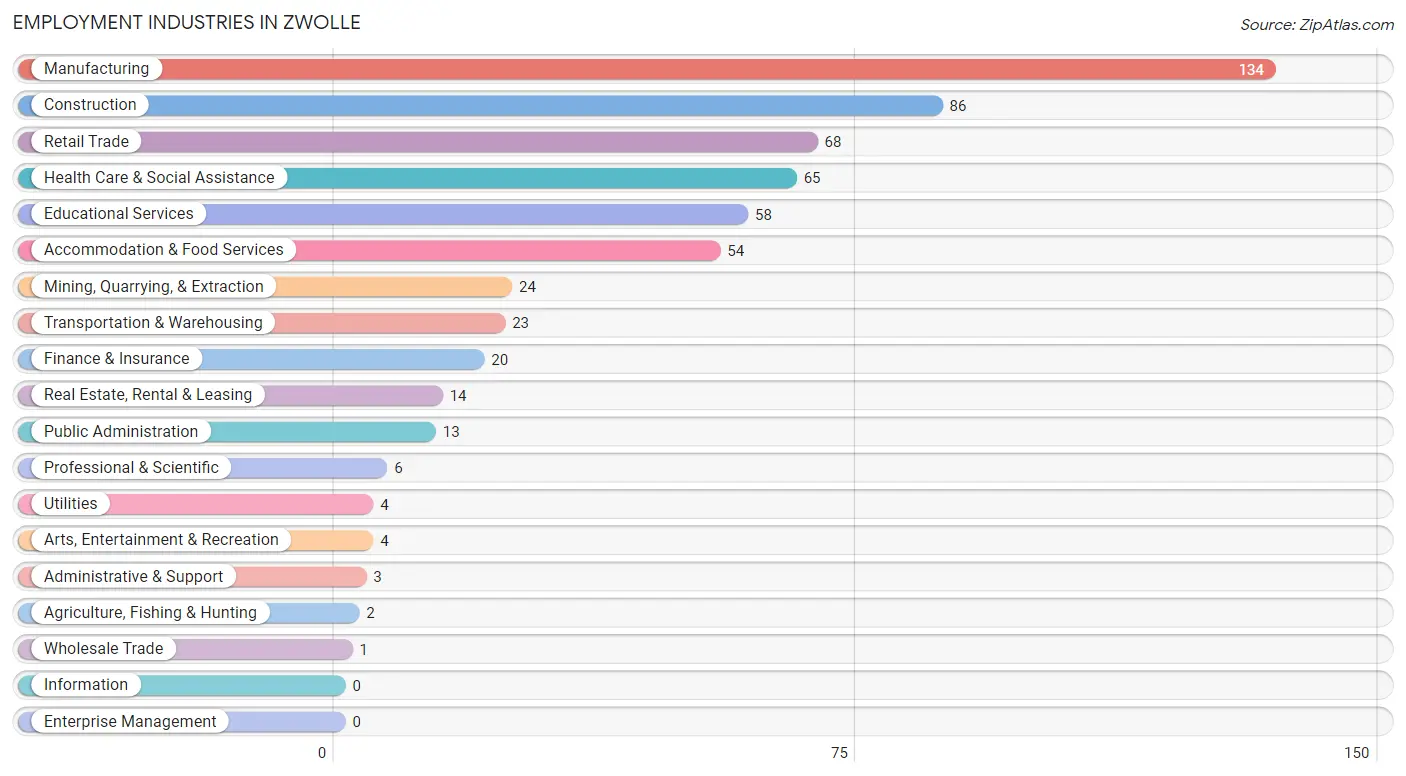
Employment Industries in Zwolle
The major employment industries in Zwolle include Manufacturing (134 | 22.3%), Construction (86 | 14.3%), Retail Trade (68 | 11.3%), Health Care & Social Assistance (65 | 10.8%), and Educational Services (58 | 9.6%).
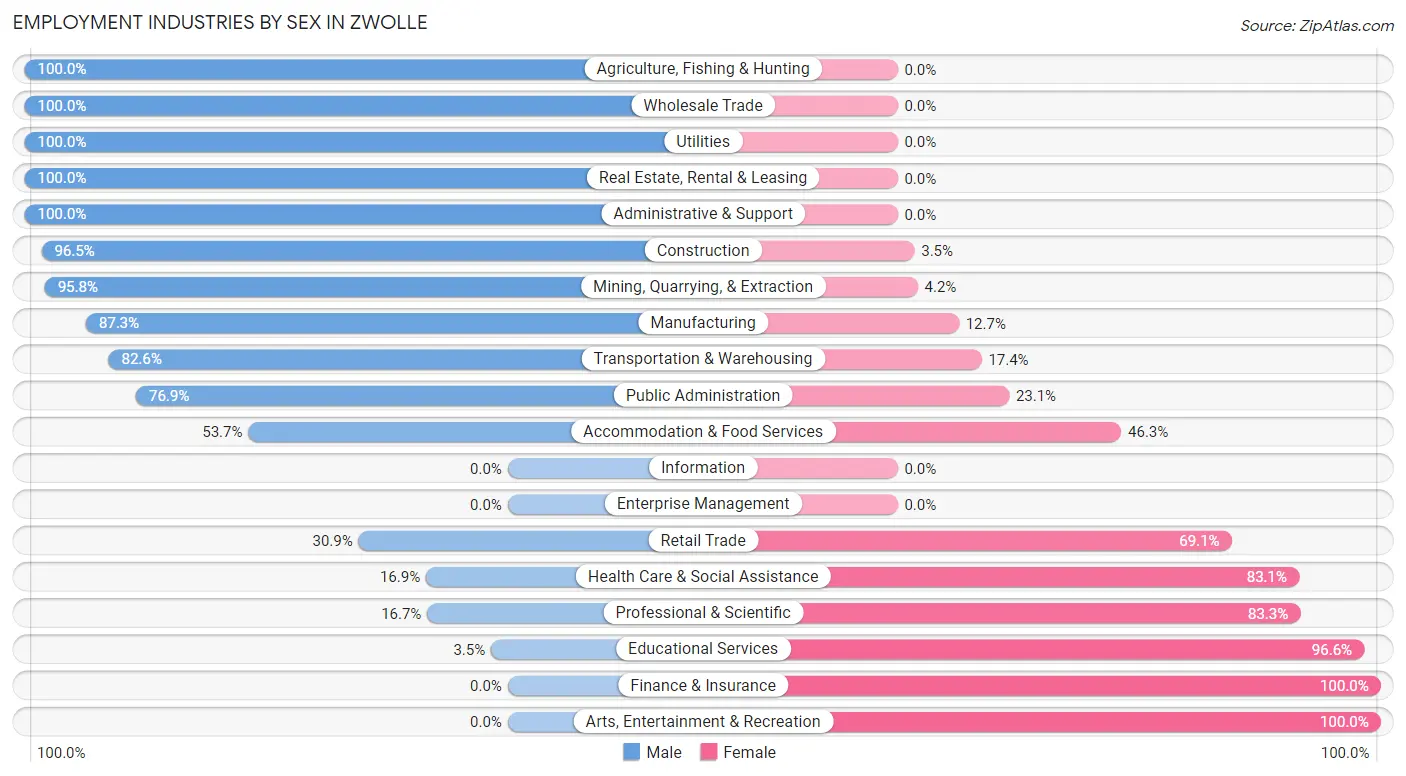
Employment Industries by Sex in Zwolle
The Zwolle industries that see more men than women are Agriculture, Fishing & Hunting (100.0%), Wholesale Trade (100.0%), and Utilities (100.0%), whereas the industries that tend to have a higher number of women are Finance & Insurance (100.0%), Arts, Entertainment & Recreation (100.0%), and Educational Services (96.6%).
| Industry | Male | Female |
| Agriculture, Fishing & Hunting | 2 (100.0%) | 0 (0.0%) |
| Mining, Quarrying, & Extraction | 23 (95.8%) | 1 (4.2%) |
| Construction | 83 (96.5%) | 3 (3.5%) |
| Manufacturing | 117 (87.3%) | 17 (12.7%) |
| Wholesale Trade | 1 (100.0%) | 0 (0.0%) |
| Retail Trade | 21 (30.9%) | 47 (69.1%) |
| Transportation & Warehousing | 19 (82.6%) | 4 (17.4%) |
| Utilities | 4 (100.0%) | 0 (0.0%) |
| Information | 0 (0.0%) | 0 (0.0%) |
| Finance & Insurance | 0 (0.0%) | 20 (100.0%) |
| Real Estate, Rental & Leasing | 14 (100.0%) | 0 (0.0%) |
| Professional & Scientific | 1 (16.7%) | 5 (83.3%) |
| Enterprise Management | 0 (0.0%) | 0 (0.0%) |
| Administrative & Support | 3 (100.0%) | 0 (0.0%) |
| Educational Services | 2 (3.5%) | 56 (96.6%) |
| Health Care & Social Assistance | 11 (16.9%) | 54 (83.1%) |
| Arts, Entertainment & Recreation | 0 (0.0%) | 4 (100.0%) |
| Accommodation & Food Services | 29 (53.7%) | 25 (46.3%) |
| Public Administration | 10 (76.9%) | 3 (23.1%) |
| Total | 351 (58.3%) | 251 (41.7%) |
Education in Zwolle
School Enrollment in Zwolle
The most common levels of schooling among the 412 students in Zwolle are high school (143 | 34.7%), middle school (91 | 22.1%), and elementary school (66 | 16.0%).
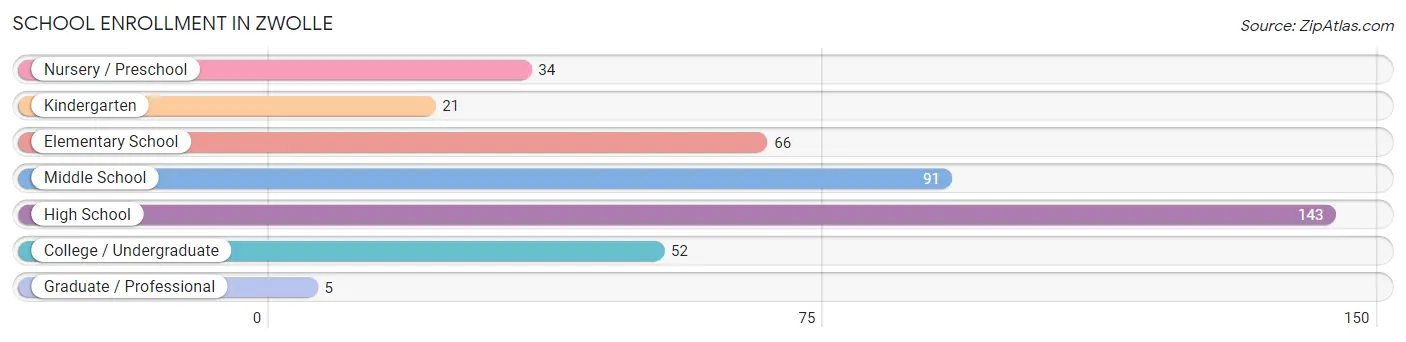
| School Level | # Students | % Students |
| Nursery / Preschool | 34 | 8.3% |
| Kindergarten | 21 | 5.1% |
| Elementary School | 66 | 16.0% |
| Middle School | 91 | 22.1% |
| High School | 143 | 34.7% |
| College / Undergraduate | 52 | 12.6% |
| Graduate / Professional | 5 | 1.2% |
| Total | 412 | 100.0% |
School Enrollment by Age by Funding Source in Zwolle
Out of a total of 412 students who are enrolled in schools in Zwolle, 26 (6.3%) attend a private institution, while the remaining 386 (93.7%) are enrolled in public schools. The age group of 3 to 4 year olds has the highest likelihood of being enrolled in private schools, with 15 (44.1% in the age bracket) enrolled. Conversely, the age group of 5 to 9 year old has the lowest likelihood of being enrolled in a private school, with 77 (100.0% in the age bracket) attending a public institution.
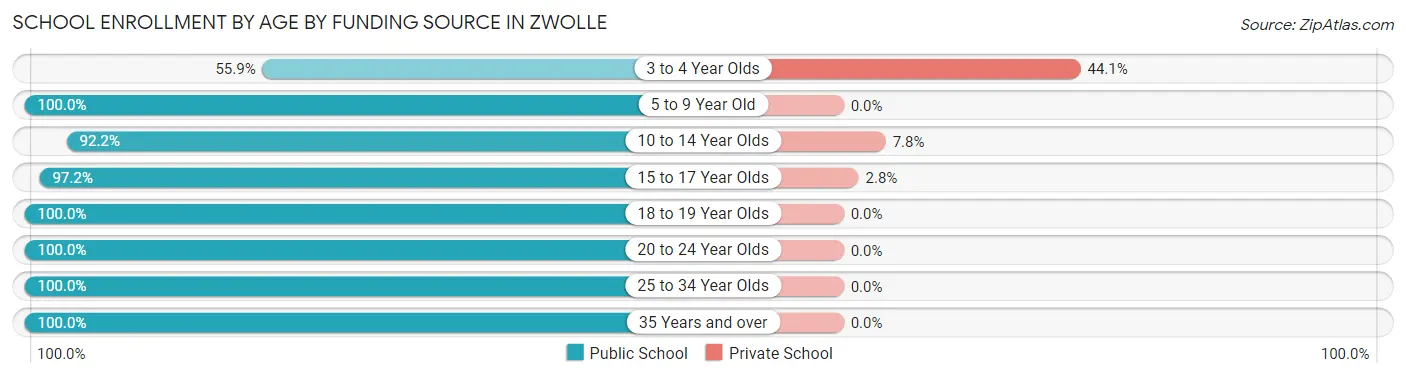
| Age Bracket | Public School | Private School |
| 3 to 4 Year Olds | 19 (55.9%) | 15 (44.1%) |
| 5 to 9 Year Old | 77 (100.0%) | 0 (0.0%) |
| 10 to 14 Year Olds | 106 (92.2%) | 9 (7.8%) |
| 15 to 17 Year Olds | 70 (97.2%) | 2 (2.8%) |
| 18 to 19 Year Olds | 77 (100.0%) | 0 (0.0%) |
| 20 to 24 Year Olds | 4 (100.0%) | 0 (0.0%) |
| 25 to 34 Year Olds | 26 (100.0%) | 0 (0.0%) |
| 35 Years and over | 7 (100.0%) | 0 (0.0%) |
| Total | 386 (93.7%) | 26 (6.3%) |
Educational Attainment by Field of Study in Zwolle
Education (35 | 29.2%), science & technology (18 | 15.0%), psychology (15 | 12.5%), business (11 | 9.2%), and social sciences (9 | 7.5%) are the most common fields of study among 120 individuals in Zwolle who have obtained a bachelor's degree or higher.
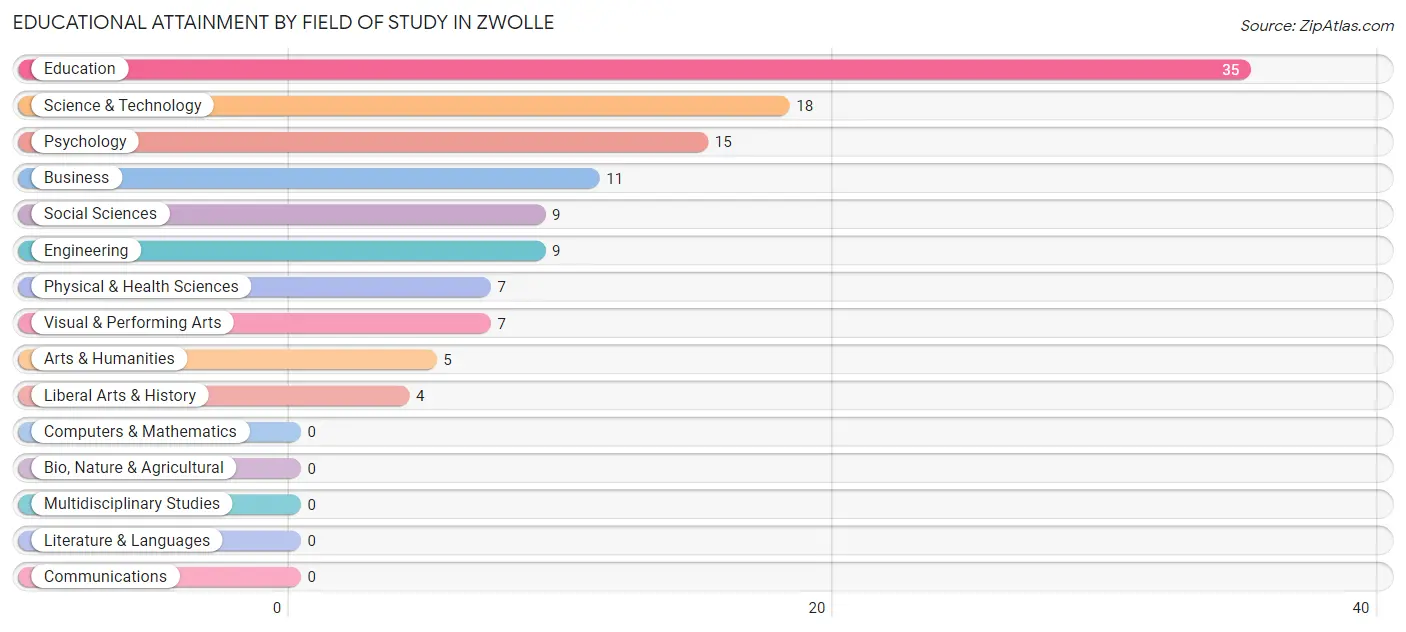
| Field of Study | # Graduates | % Graduates |
| Computers & Mathematics | 0 | 0.0% |
| Bio, Nature & Agricultural | 0 | 0.0% |
| Physical & Health Sciences | 7 | 5.8% |
| Psychology | 15 | 12.5% |
| Social Sciences | 9 | 7.5% |
| Engineering | 9 | 7.5% |
| Multidisciplinary Studies | 0 | 0.0% |
| Science & Technology | 18 | 15.0% |
| Business | 11 | 9.2% |
| Education | 35 | 29.2% |
| Literature & Languages | 0 | 0.0% |
| Liberal Arts & History | 4 | 3.3% |
| Visual & Performing Arts | 7 | 5.8% |
| Communications | 0 | 0.0% |
| Arts & Humanities | 5 | 4.2% |
| Total | 120 | 100.0% |
Transportation & Commute in Zwolle
Vehicle Availability by Sex in Zwolle
The most prevalent vehicle ownership categories in Zwolle are males with 2 vehicles (107, accounting for 31.1%) and females with 2 vehicles (70, making up 44.0%).
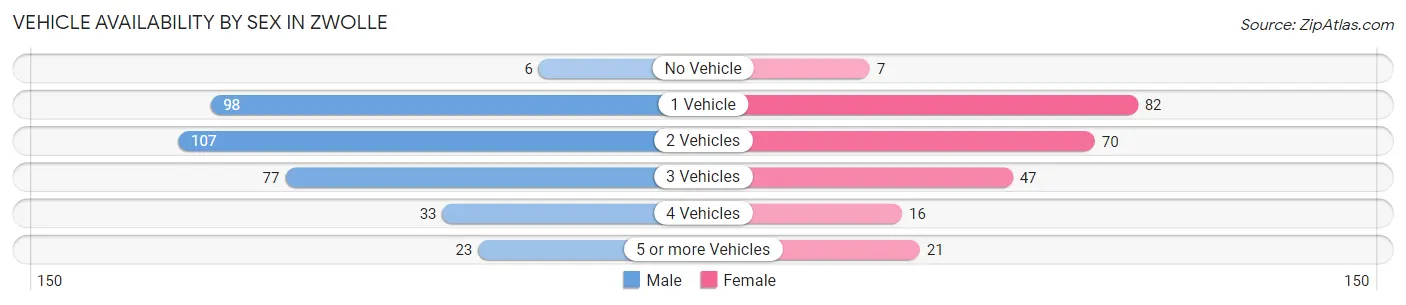
| Vehicles Available | Male | Female |
| No Vehicle | 6 (1.7%) | 7 (2.9%) |
| 1 Vehicle | 98 (28.5%) | 82 (33.7%) |
| 2 Vehicles | 107 (31.1%) | 70 (28.8%) |
| 3 Vehicles | 77 (22.4%) | 47 (19.3%) |
| 4 Vehicles | 33 (9.6%) | 16 (6.6%) |
| 5 or more Vehicles | 23 (6.7%) | 21 (8.6%) |
| Total | 344 (100.0%) | 243 (100.0%) |
Commute Time in Zwolle
The most frequently occuring commute durations in Zwolle are 5 to 9 minutes (92 commuters, 16.2%), 10 to 14 minutes (91 commuters, 16.1%), and 15 to 19 minutes (90 commuters, 15.9%).
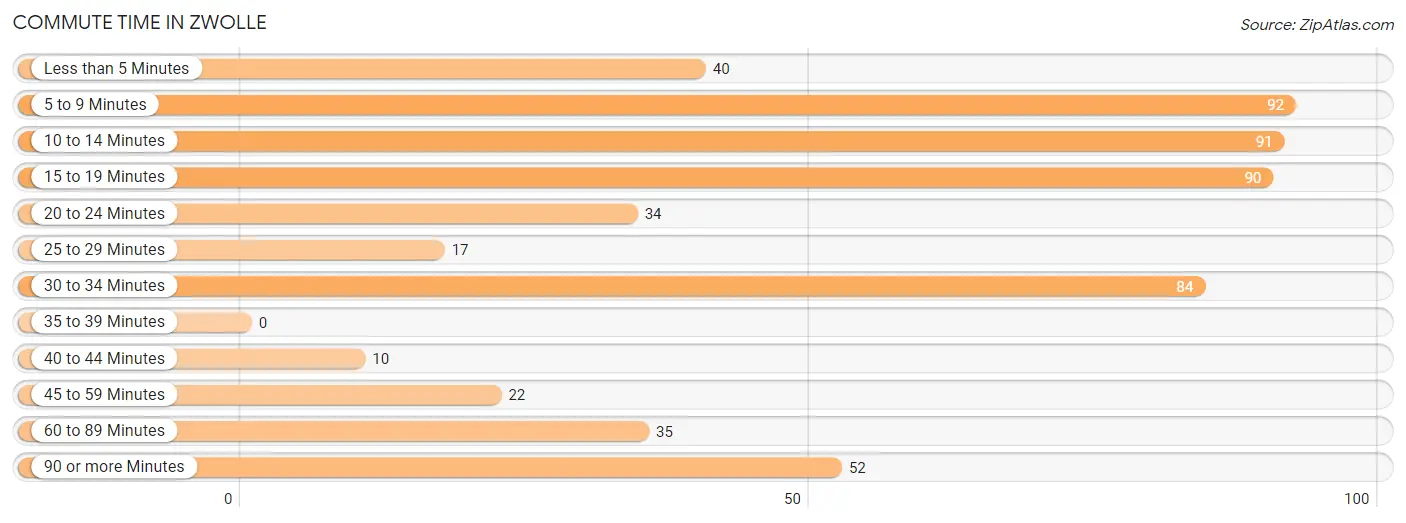
| Commute Time | # Commuters | % Commuters |
| Less than 5 Minutes | 40 | 7.0% |
| 5 to 9 Minutes | 92 | 16.2% |
| 10 to 14 Minutes | 91 | 16.1% |
| 15 to 19 Minutes | 90 | 15.9% |
| 20 to 24 Minutes | 34 | 6.0% |
| 25 to 29 Minutes | 17 | 3.0% |
| 30 to 34 Minutes | 84 | 14.8% |
| 35 to 39 Minutes | 0 | 0.0% |
| 40 to 44 Minutes | 10 | 1.8% |
| 45 to 59 Minutes | 22 | 3.9% |
| 60 to 89 Minutes | 35 | 6.2% |
| 90 or more Minutes | 52 | 9.2% |
Commute Time by Sex in Zwolle
The most common commute times in Zwolle are 30 to 34 minutes (65 commuters, 19.3%) for males and 5 to 9 minutes (53 commuters, 23.0%) for females.
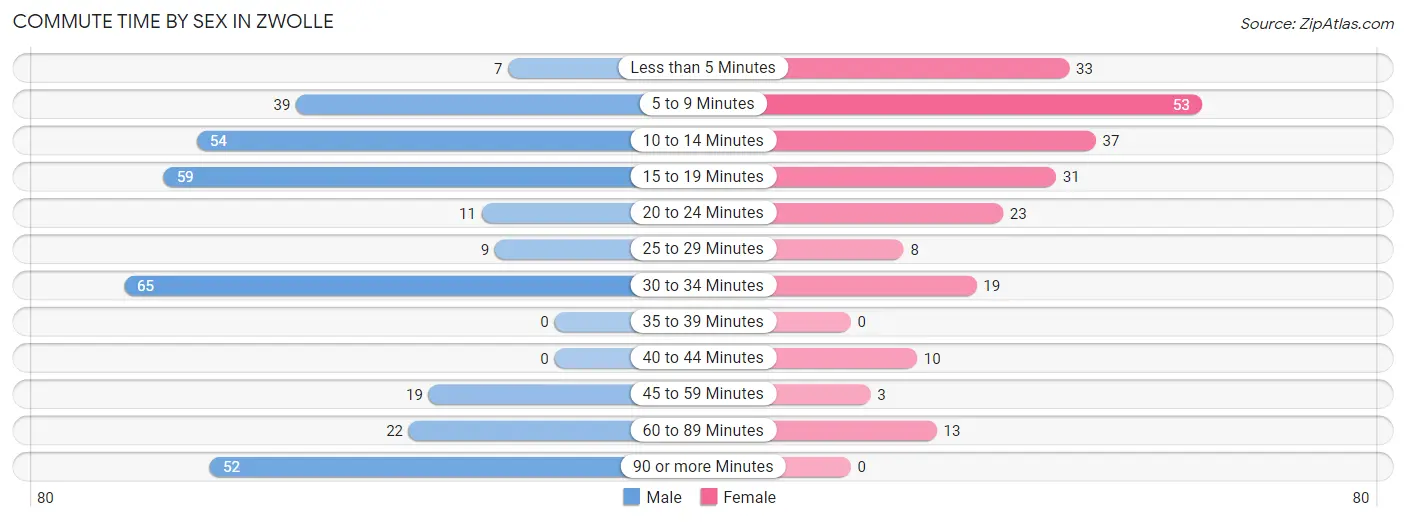
| Commute Time | Male | Female |
| Less than 5 Minutes | 7 (2.1%) | 33 (14.3%) |
| 5 to 9 Minutes | 39 (11.6%) | 53 (23.0%) |
| 10 to 14 Minutes | 54 (16.0%) | 37 (16.1%) |
| 15 to 19 Minutes | 59 (17.5%) | 31 (13.5%) |
| 20 to 24 Minutes | 11 (3.3%) | 23 (10.0%) |
| 25 to 29 Minutes | 9 (2.7%) | 8 (3.5%) |
| 30 to 34 Minutes | 65 (19.3%) | 19 (8.3%) |
| 35 to 39 Minutes | 0 (0.0%) | 0 (0.0%) |
| 40 to 44 Minutes | 0 (0.0%) | 10 (4.3%) |
| 45 to 59 Minutes | 19 (5.6%) | 3 (1.3%) |
| 60 to 89 Minutes | 22 (6.5%) | 13 (5.7%) |
| 90 or more Minutes | 52 (15.4%) | 0 (0.0%) |
Time of Departure to Work by Sex in Zwolle
The most frequent times of departure to work in Zwolle are 12:00 AM to 4:59 AM (113, 33.5%) for males and 7:00 AM to 7:29 AM (41, 17.8%) for females.
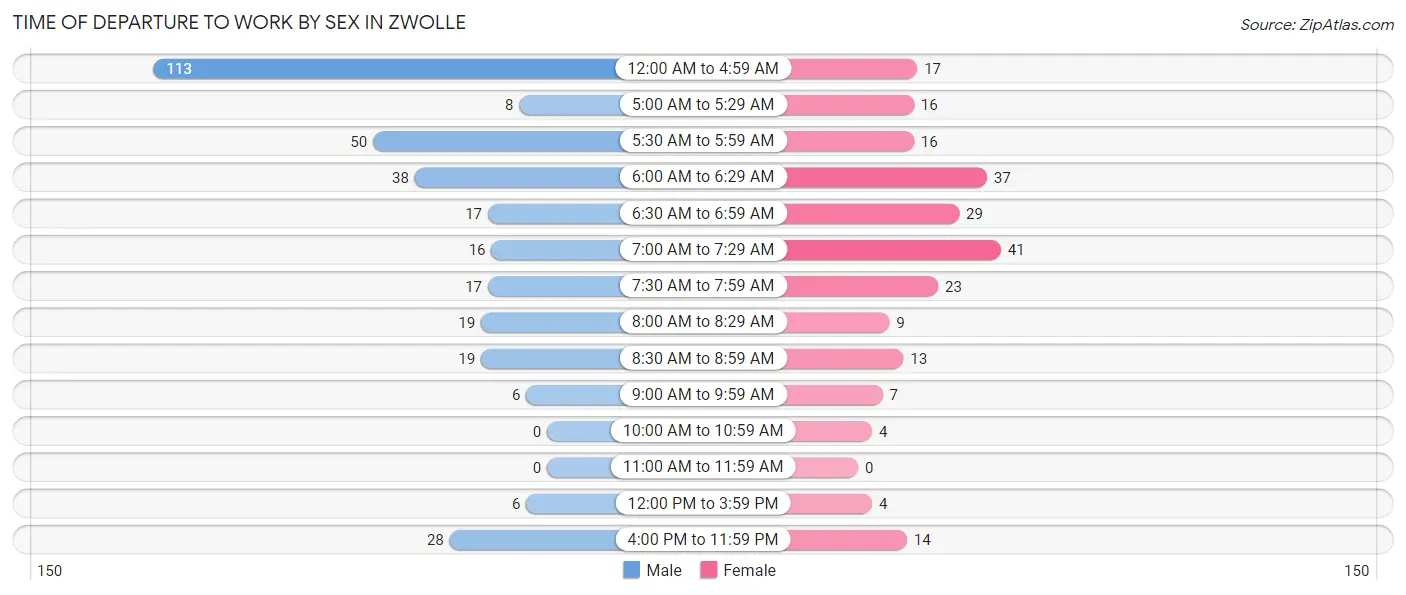
| Time of Departure | Male | Female |
| 12:00 AM to 4:59 AM | 113 (33.5%) | 17 (7.4%) |
| 5:00 AM to 5:29 AM | 8 (2.4%) | 16 (7.0%) |
| 5:30 AM to 5:59 AM | 50 (14.8%) | 16 (7.0%) |
| 6:00 AM to 6:29 AM | 38 (11.3%) | 37 (16.1%) |
| 6:30 AM to 6:59 AM | 17 (5.0%) | 29 (12.6%) |
| 7:00 AM to 7:29 AM | 16 (4.8%) | 41 (17.8%) |
| 7:30 AM to 7:59 AM | 17 (5.0%) | 23 (10.0%) |
| 8:00 AM to 8:29 AM | 19 (5.6%) | 9 (3.9%) |
| 8:30 AM to 8:59 AM | 19 (5.6%) | 13 (5.7%) |
| 9:00 AM to 9:59 AM | 6 (1.8%) | 7 (3.0%) |
| 10:00 AM to 10:59 AM | 0 (0.0%) | 4 (1.7%) |
| 11:00 AM to 11:59 AM | 0 (0.0%) | 0 (0.0%) |
| 12:00 PM to 3:59 PM | 6 (1.8%) | 4 (1.7%) |
| 4:00 PM to 11:59 PM | 28 (8.3%) | 14 (6.1%) |
| Total | 337 (100.0%) | 230 (100.0%) |
Housing Occupancy in Zwolle
Occupancy by Ownership in Zwolle
Of the total 607 dwellings in Zwolle, owner-occupied units account for 349 (57.5%), while renter-occupied units make up 258 (42.5%).
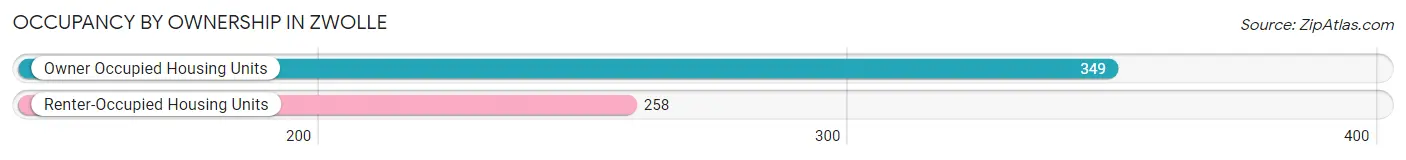
| Occupancy | # Housing Units | % Housing Units |
| Owner Occupied Housing Units | 349 | 57.5% |
| Renter-Occupied Housing Units | 258 | 42.5% |
| Total Occupied Housing Units | 607 | 100.0% |
Occupancy by Household Size in Zwolle
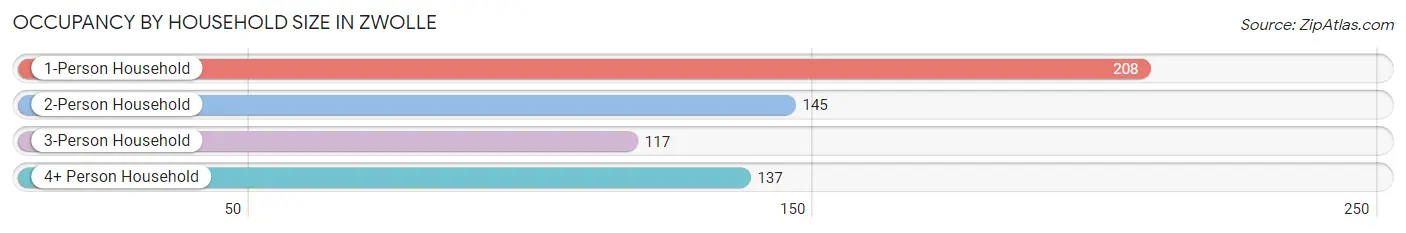
| Household Size | # Housing Units | % Housing Units |
| 1-Person Household | 208 | 34.3% |
| 2-Person Household | 145 | 23.9% |
| 3-Person Household | 117 | 19.3% |
| 4+ Person Household | 137 | 22.6% |
| Total Housing Units | 607 | 100.0% |
Occupancy by Ownership by Household Size in Zwolle
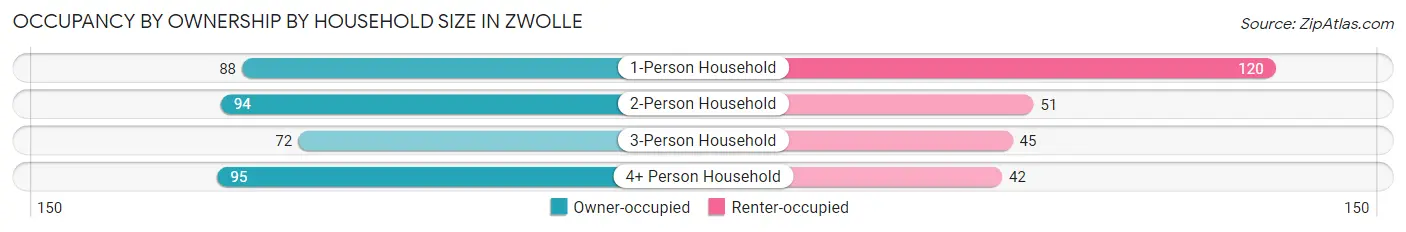
| Household Size | Owner-occupied | Renter-occupied |
| 1-Person Household | 88 (42.3%) | 120 (57.7%) |
| 2-Person Household | 94 (64.8%) | 51 (35.2%) |
| 3-Person Household | 72 (61.5%) | 45 (38.5%) |
| 4+ Person Household | 95 (69.3%) | 42 (30.7%) |
| Total Housing Units | 349 (57.5%) | 258 (42.5%) |
Occupancy by Educational Attainment in Zwolle
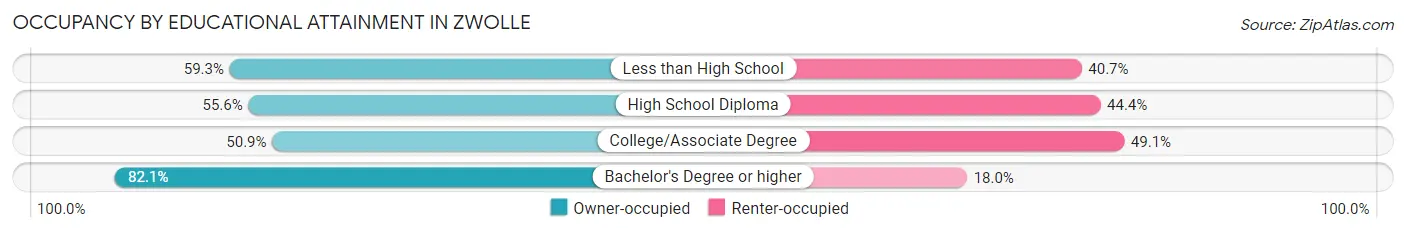
| Household Size | Owner-occupied | Renter-occupied |
| Less than High School | 105 (59.3%) | 72 (40.7%) |
| High School Diploma | 154 (55.6%) | 123 (44.4%) |
| College/Associate Degree | 58 (50.9%) | 56 (49.1%) |
| Bachelor's Degree or higher | 32 (82.1%) | 7 (17.9%) |
Occupancy by Age of Householder in Zwolle
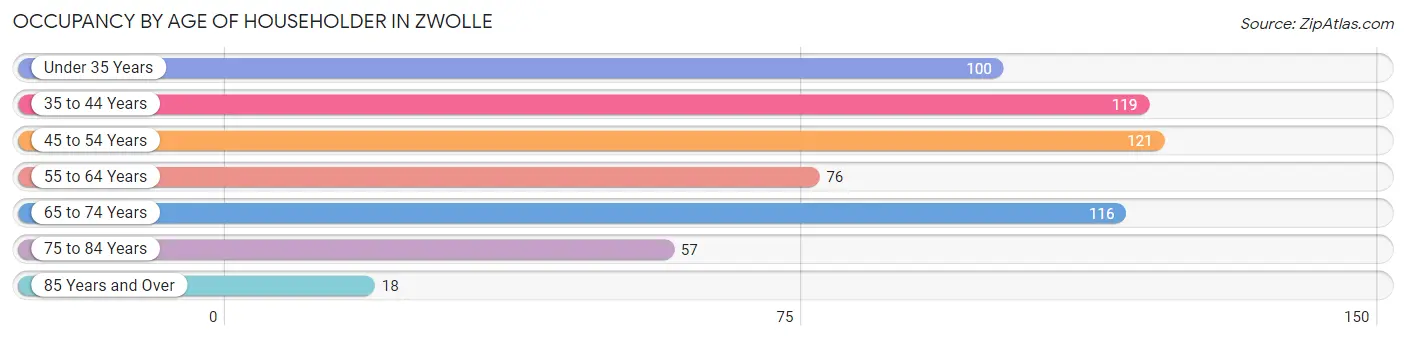
| Age Bracket | # Households | % Households |
| Under 35 Years | 100 | 16.5% |
| 35 to 44 Years | 119 | 19.6% |
| 45 to 54 Years | 121 | 19.9% |
| 55 to 64 Years | 76 | 12.5% |
| 65 to 74 Years | 116 | 19.1% |
| 75 to 84 Years | 57 | 9.4% |
| 85 Years and Over | 18 | 3.0% |
| Total | 607 | 100.0% |
Housing Finances in Zwolle
Median Income by Occupancy in Zwolle
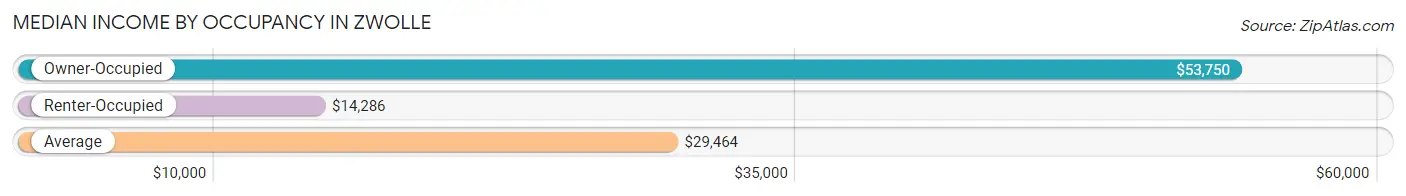
| Occupancy Type | # Households | Median Income |
| Owner-Occupied | 349 (57.5%) | $53,750 |
| Renter-Occupied | 258 (42.5%) | $14,286 |
| Average | 607 (100.0%) | $29,464 |
Occupancy by Householder Income Bracket in Zwolle
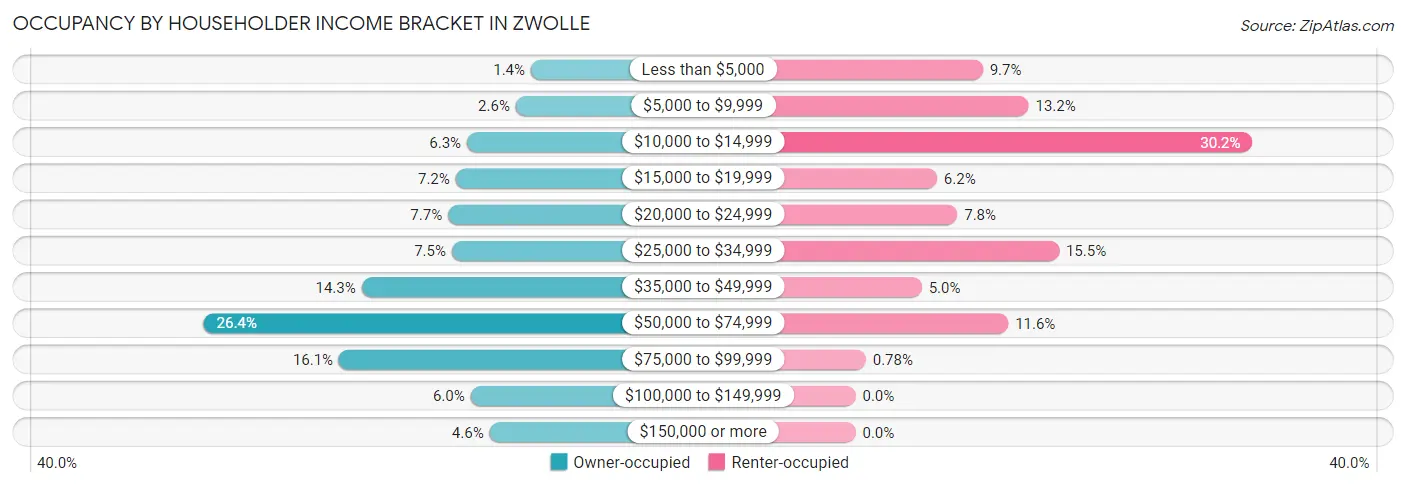
| Income Bracket | Owner-occupied | Renter-occupied |
| Less than $5,000 | 5 (1.4%) | 25 (9.7%) |
| $5,000 to $9,999 | 9 (2.6%) | 34 (13.2%) |
| $10,000 to $14,999 | 22 (6.3%) | 78 (30.2%) |
| $15,000 to $19,999 | 25 (7.2%) | 16 (6.2%) |
| $20,000 to $24,999 | 27 (7.7%) | 20 (7.7%) |
| $25,000 to $34,999 | 26 (7.4%) | 40 (15.5%) |
| $35,000 to $49,999 | 50 (14.3%) | 13 (5.0%) |
| $50,000 to $74,999 | 92 (26.4%) | 30 (11.6%) |
| $75,000 to $99,999 | 56 (16.1%) | 2 (0.8%) |
| $100,000 to $149,999 | 21 (6.0%) | 0 (0.0%) |
| $150,000 or more | 16 (4.6%) | 0 (0.0%) |
| Total | 349 (100.0%) | 258 (100.0%) |
Monthly Housing Cost Tiers in Zwolle
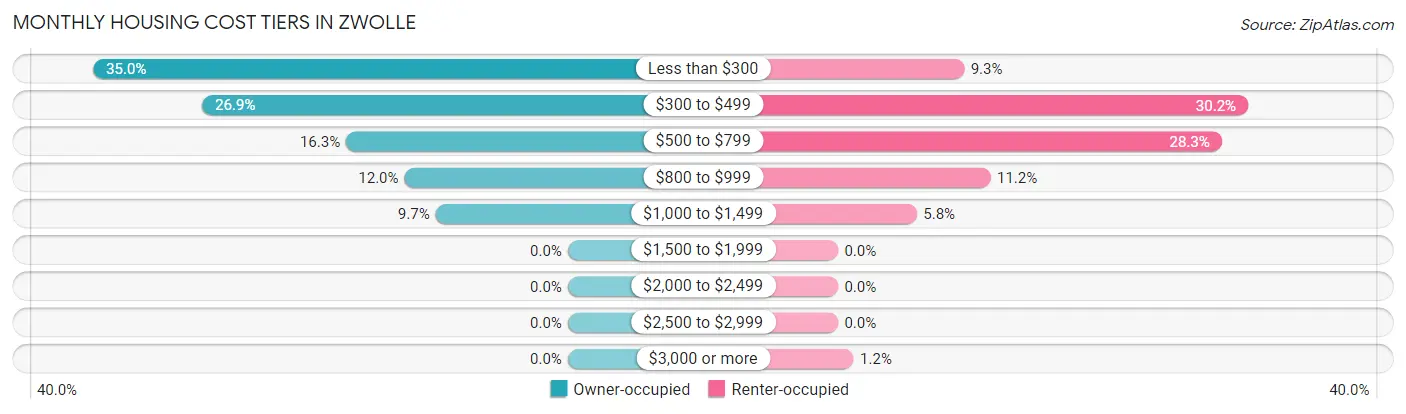
| Monthly Cost | Owner-occupied | Renter-occupied |
| Less than $300 | 122 (35.0%) | 24 (9.3%) |
| $300 to $499 | 94 (26.9%) | 78 (30.2%) |
| $500 to $799 | 57 (16.3%) | 73 (28.3%) |
| $800 to $999 | 42 (12.0%) | 29 (11.2%) |
| $1,000 to $1,499 | 34 (9.7%) | 15 (5.8%) |
| $1,500 to $1,999 | 0 (0.0%) | 0 (0.0%) |
| $2,000 to $2,499 | 0 (0.0%) | 0 (0.0%) |
| $2,500 to $2,999 | 0 (0.0%) | 0 (0.0%) |
| $3,000 or more | 0 (0.0%) | 3 (1.2%) |
| Total | 349 (100.0%) | 258 (100.0%) |
Physical Housing Characteristics in Zwolle
Housing Structures in Zwolle
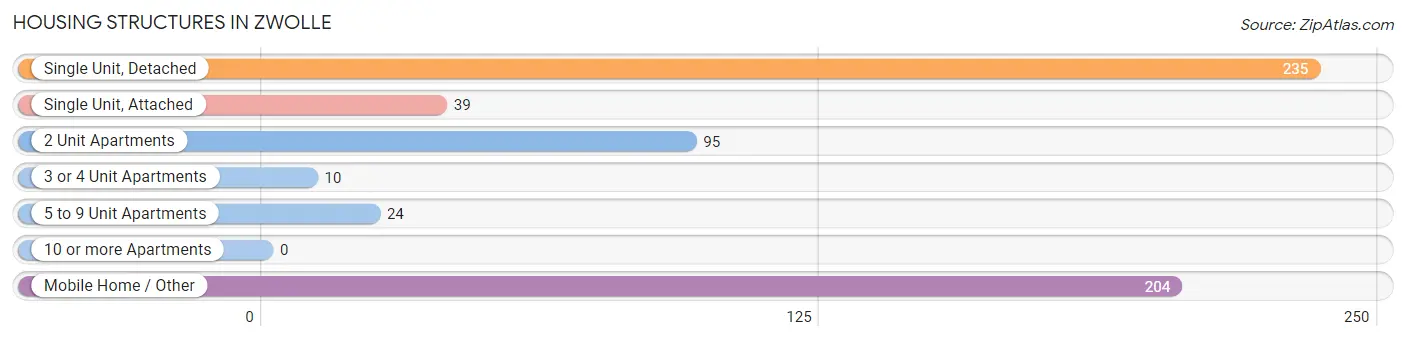
| Structure Type | # Housing Units | % Housing Units |
| Single Unit, Detached | 235 | 38.7% |
| Single Unit, Attached | 39 | 6.4% |
| 2 Unit Apartments | 95 | 15.7% |
| 3 or 4 Unit Apartments | 10 | 1.7% |
| 5 to 9 Unit Apartments | 24 | 4.0% |
| 10 or more Apartments | 0 | 0.0% |
| Mobile Home / Other | 204 | 33.6% |
| Total | 607 | 100.0% |
Housing Structures by Occupancy in Zwolle
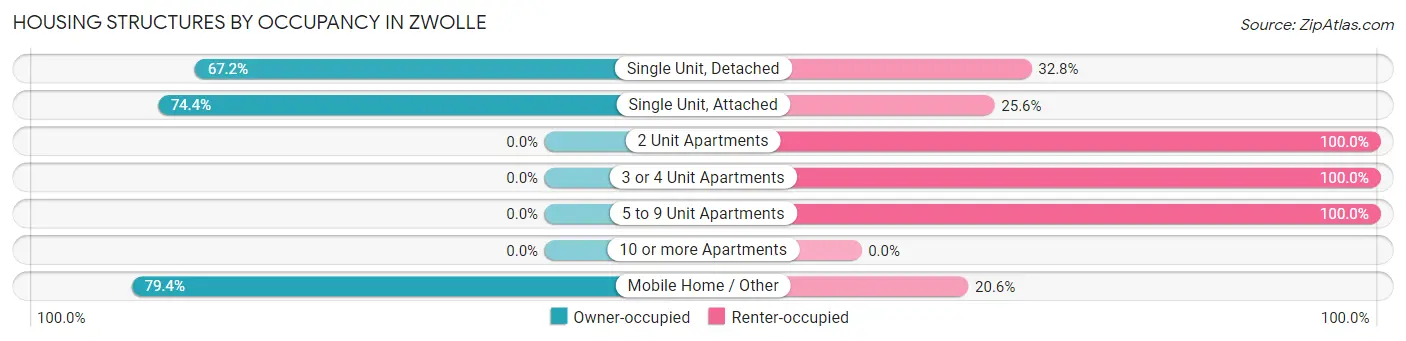
| Structure Type | Owner-occupied | Renter-occupied |
| Single Unit, Detached | 158 (67.2%) | 77 (32.8%) |
| Single Unit, Attached | 29 (74.4%) | 10 (25.6%) |
| 2 Unit Apartments | 0 (0.0%) | 95 (100.0%) |
| 3 or 4 Unit Apartments | 0 (0.0%) | 10 (100.0%) |
| 5 to 9 Unit Apartments | 0 (0.0%) | 24 (100.0%) |
| 10 or more Apartments | 0 (0.0%) | 0 (0.0%) |
| Mobile Home / Other | 162 (79.4%) | 42 (20.6%) |
| Total | 349 (57.5%) | 258 (42.5%) |
Housing Structures by Number of Rooms in Zwolle
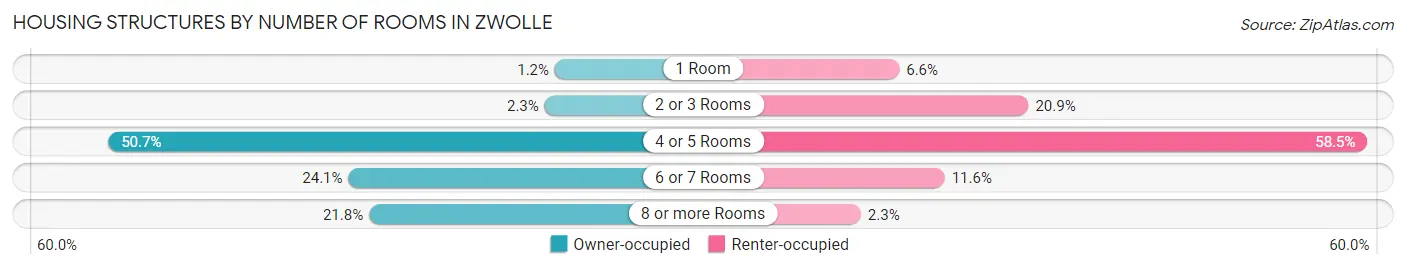
| Number of Rooms | Owner-occupied | Renter-occupied |
| 1 Room | 4 (1.1%) | 17 (6.6%) |
| 2 or 3 Rooms | 8 (2.3%) | 54 (20.9%) |
| 4 or 5 Rooms | 177 (50.7%) | 151 (58.5%) |
| 6 or 7 Rooms | 84 (24.1%) | 30 (11.6%) |
| 8 or more Rooms | 76 (21.8%) | 6 (2.3%) |
| Total | 349 (100.0%) | 258 (100.0%) |
Housing Structure by Heating Type in Zwolle
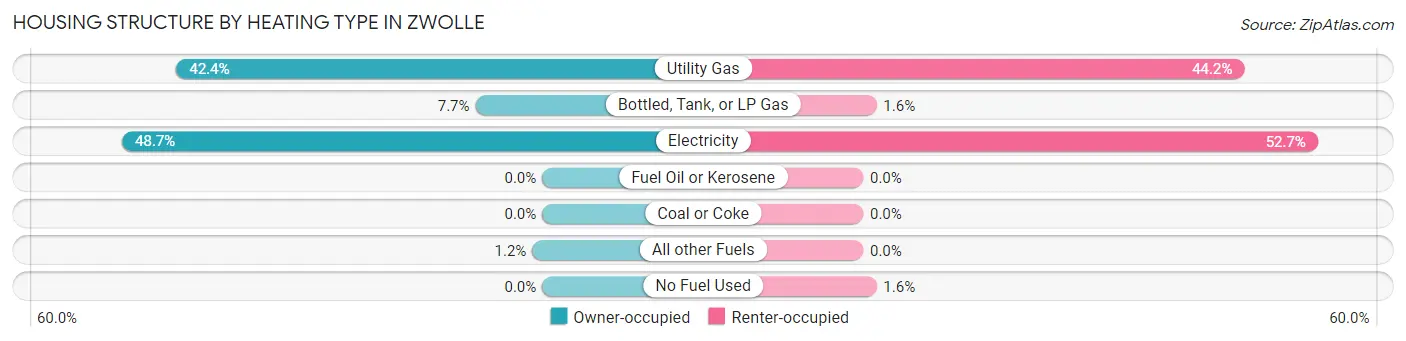
| Heating Type | Owner-occupied | Renter-occupied |
| Utility Gas | 148 (42.4%) | 114 (44.2%) |
| Bottled, Tank, or LP Gas | 27 (7.7%) | 4 (1.5%) |
| Electricity | 170 (48.7%) | 136 (52.7%) |
| Fuel Oil or Kerosene | 0 (0.0%) | 0 (0.0%) |
| Coal or Coke | 0 (0.0%) | 0 (0.0%) |
| All other Fuels | 4 (1.1%) | 0 (0.0%) |
| No Fuel Used | 0 (0.0%) | 4 (1.5%) |
| Total | 349 (100.0%) | 258 (100.0%) |
Household Vehicle Usage in Zwolle
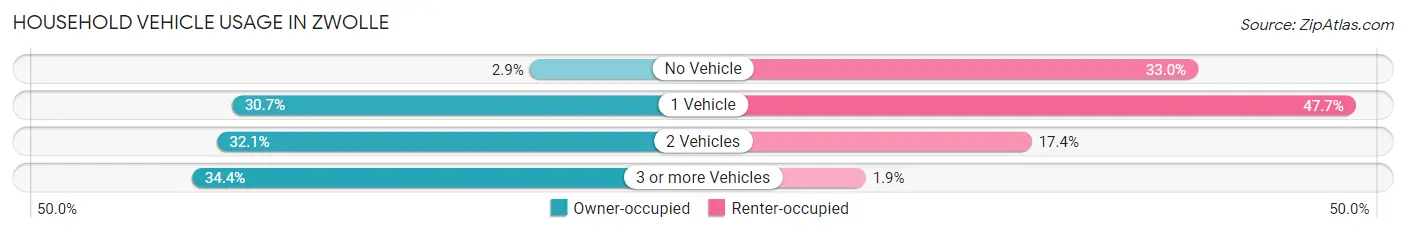
| Vehicles per Household | Owner-occupied | Renter-occupied |
| No Vehicle | 10 (2.9%) | 85 (33.0%) |
| 1 Vehicle | 107 (30.7%) | 123 (47.7%) |
| 2 Vehicles | 112 (32.1%) | 45 (17.4%) |
| 3 or more Vehicles | 120 (34.4%) | 5 (1.9%) |
| Total | 349 (100.0%) | 258 (100.0%) |
Real Estate & Mortgages in Zwolle
Real Estate and Mortgage Overview in Zwolle
| Characteristic | Without Mortgage | With Mortgage |
| Housing Units | 249 | 100 |
| Median Property Value | $55,300 | $80,700 |
| Median Household Income | $42,159 | $5 |
| Monthly Housing Costs | $304 | $0 |
| Real Estate Taxes | $199 | $14 |
Property Value by Mortgage Status in Zwolle
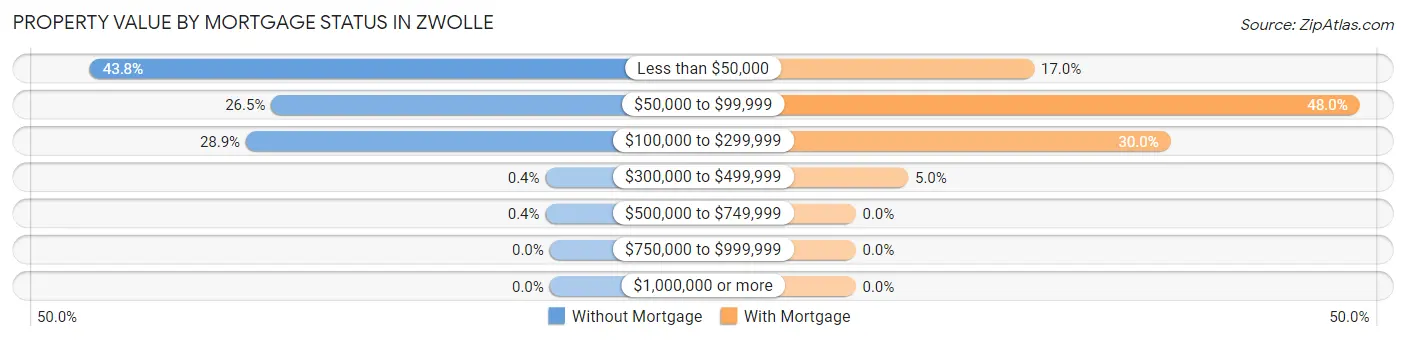
| Property Value | Without Mortgage | With Mortgage |
| Less than $50,000 | 109 (43.8%) | 17 (17.0%) |
| $50,000 to $99,999 | 66 (26.5%) | 48 (48.0%) |
| $100,000 to $299,999 | 72 (28.9%) | 30 (30.0%) |
| $300,000 to $499,999 | 1 (0.4%) | 5 (5.0%) |
| $500,000 to $749,999 | 1 (0.4%) | 0 (0.0%) |
| $750,000 to $999,999 | 0 (0.0%) | 0 (0.0%) |
| $1,000,000 or more | 0 (0.0%) | 0 (0.0%) |
| Total | 249 (100.0%) | 100 (100.0%) |
Household Income by Mortgage Status in Zwolle
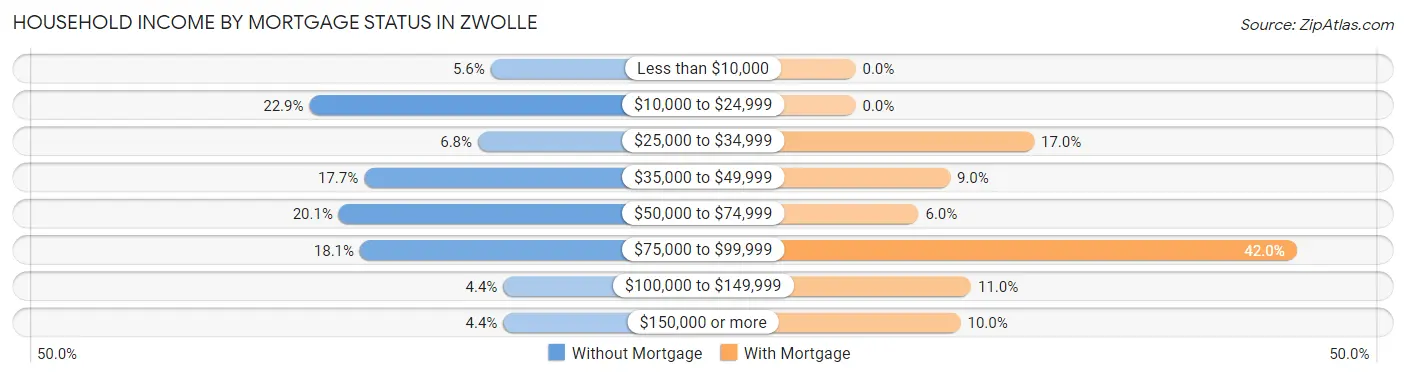
| Household Income | Without Mortgage | With Mortgage |
| Less than $10,000 | 14 (5.6%) | 0 (0.0%) |
| $10,000 to $24,999 | 57 (22.9%) | 0 (0.0%) |
| $25,000 to $34,999 | 17 (6.8%) | 17 (17.0%) |
| $35,000 to $49,999 | 44 (17.7%) | 9 (9.0%) |
| $50,000 to $74,999 | 50 (20.1%) | 6 (6.0%) |
| $75,000 to $99,999 | 45 (18.1%) | 42 (42.0%) |
| $100,000 to $149,999 | 11 (4.4%) | 11 (11.0%) |
| $150,000 or more | 11 (4.4%) | 10 (10.0%) |
| Total | 249 (100.0%) | 100 (100.0%) |
Property Value to Household Income Ratio in Zwolle
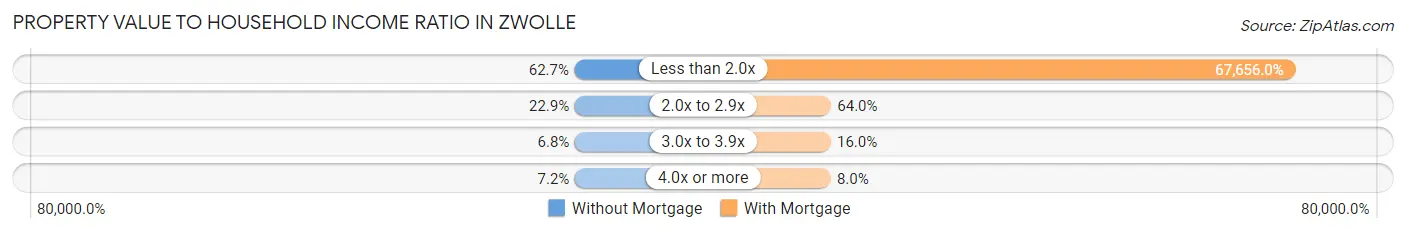
| Value-to-Income Ratio | Without Mortgage | With Mortgage |
| Less than 2.0x | 156 (62.6%) | 67,656 (67,656.0%) |
| 2.0x to 2.9x | 57 (22.9%) | 64 (64.0%) |
| 3.0x to 3.9x | 17 (6.8%) | 16 (16.0%) |
| 4.0x or more | 18 (7.2%) | 8 (8.0%) |
| Total | 249 (100.0%) | 100 (100.0%) |
Real Estate Taxes by Mortgage Status in Zwolle
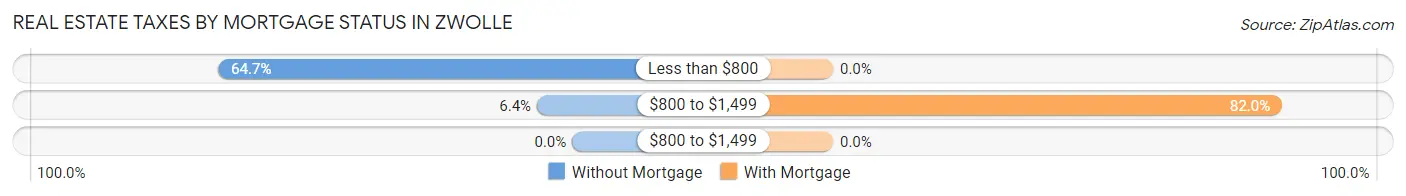
| Property Taxes | Without Mortgage | With Mortgage |
| Less than $800 | 161 (64.7%) | 0 (0.0%) |
| $800 to $1,499 | 16 (6.4%) | 82 (82.0%) |
| $800 to $1,499 | 0 (0.0%) | 0 (0.0%) |
| Total | 249 (100.0%) | 100 (100.0%) |
Health & Disability in Zwolle
Health Insurance Coverage by Age in Zwolle
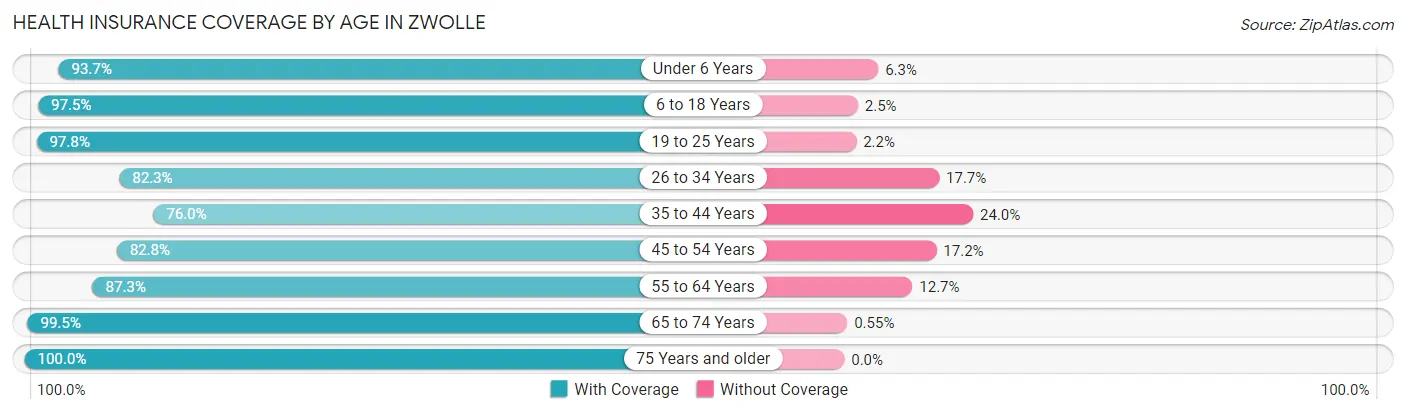
| Age Bracket | With Coverage | Without Coverage |
| Under 6 Years | 222 (93.7%) | 15 (6.3%) |
| 6 to 18 Years | 308 (97.5%) | 8 (2.5%) |
| 19 to 25 Years | 132 (97.8%) | 3 (2.2%) |
| 26 to 34 Years | 149 (82.3%) | 32 (17.7%) |
| 35 to 44 Years | 193 (76.0%) | 61 (24.0%) |
| 45 to 54 Years | 217 (82.8%) | 45 (17.2%) |
| 55 to 64 Years | 117 (87.3%) | 17 (12.7%) |
| 65 to 74 Years | 182 (99.5%) | 1 (0.5%) |
| 75 Years and older | 107 (100.0%) | 0 (0.0%) |
| Total | 1,627 (89.9%) | 182 (10.1%) |
Health Insurance Coverage by Citizenship Status in Zwolle
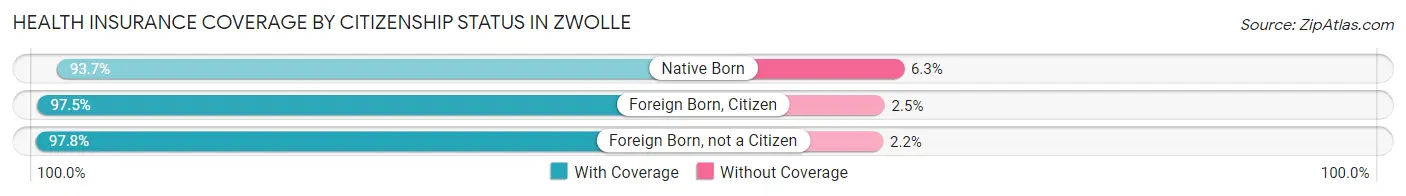
| Citizenship Status | With Coverage | Without Coverage |
| Native Born | 222 (93.7%) | 15 (6.3%) |
| Foreign Born, Citizen | 308 (97.5%) | 8 (2.5%) |
| Foreign Born, not a Citizen | 132 (97.8%) | 3 (2.2%) |
Health Insurance Coverage by Household Income in Zwolle
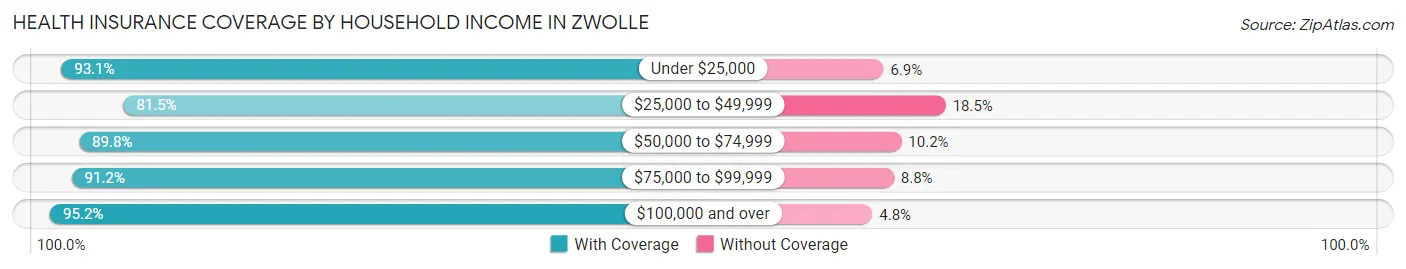
| Household Income | With Coverage | Without Coverage |
| Under $25,000 | 555 (93.1%) | 41 (6.9%) |
| $25,000 to $49,999 | 321 (81.5%) | 73 (18.5%) |
| $50,000 to $74,999 | 395 (89.8%) | 45 (10.2%) |
| $75,000 to $99,999 | 145 (91.2%) | 14 (8.8%) |
| $100,000 and over | 179 (95.2%) | 9 (4.8%) |
Public vs Private Health Insurance Coverage by Age in Zwolle
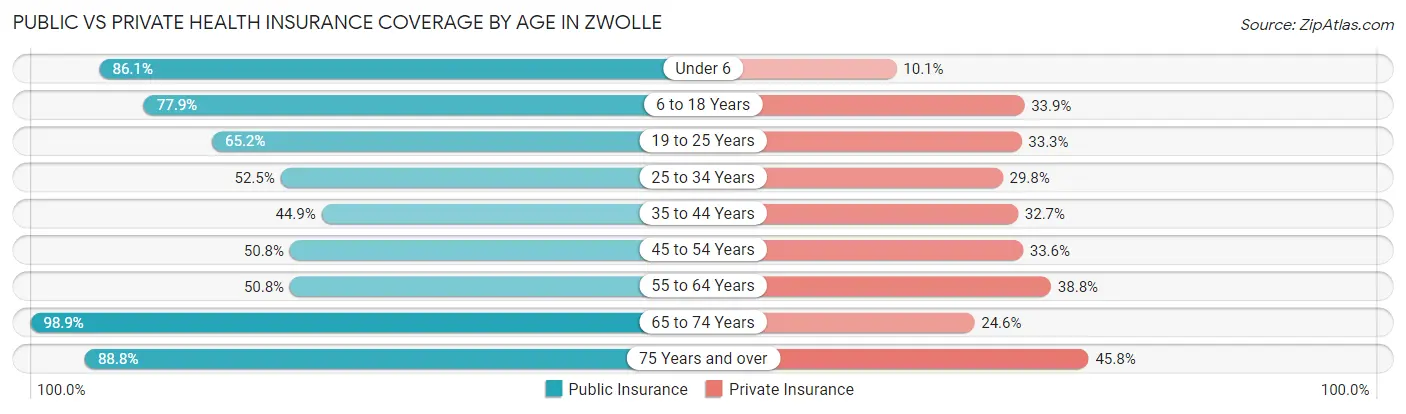
| Age Bracket | Public Insurance | Private Insurance |
| Under 6 | 204 (86.1%) | 24 (10.1%) |
| 6 to 18 Years | 246 (77.8%) | 107 (33.9%) |
| 19 to 25 Years | 88 (65.2%) | 45 (33.3%) |
| 25 to 34 Years | 95 (52.5%) | 54 (29.8%) |
| 35 to 44 Years | 114 (44.9%) | 83 (32.7%) |
| 45 to 54 Years | 133 (50.8%) | 88 (33.6%) |
| 55 to 64 Years | 68 (50.7%) | 52 (38.8%) |
| 65 to 74 Years | 181 (98.9%) | 45 (24.6%) |
| 75 Years and over | 95 (88.8%) | 49 (45.8%) |
| Total | 1,224 (67.7%) | 547 (30.2%) |
Disability Status by Sex by Age in Zwolle
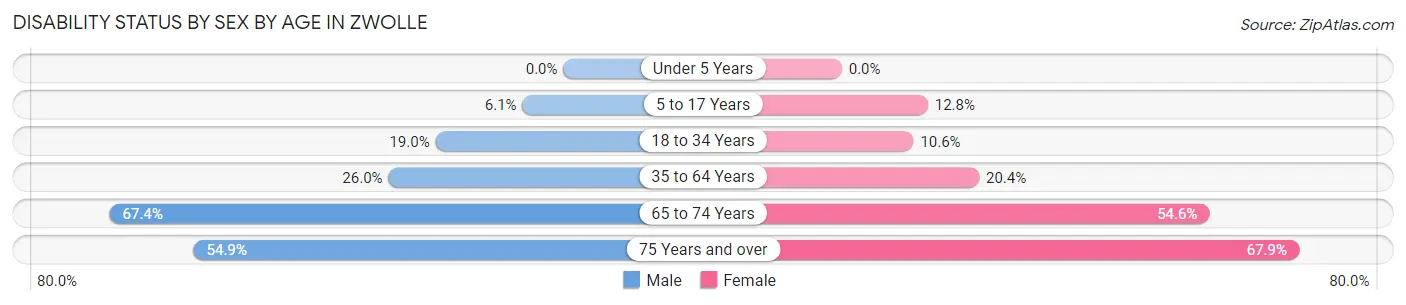
| Age Bracket | Male | Female |
| Under 5 Years | 0 (0.0%) | 0 (0.0%) |
| 5 to 17 Years | 11 (6.1%) | 12 (12.8%) |
| 18 to 34 Years | 45 (19.0%) | 15 (10.6%) |
| 35 to 64 Years | 86 (26.0%) | 65 (20.4%) |
| 65 to 74 Years | 64 (67.4%) | 48 (54.5%) |
| 75 Years and over | 28 (54.9%) | 38 (67.9%) |
Disability Class by Sex by Age in Zwolle
Disability Class: Hearing Difficulty
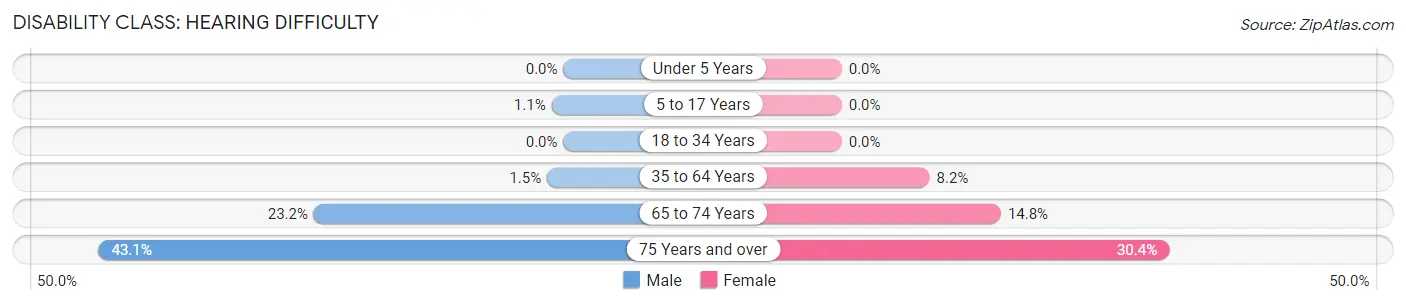
| Age Bracket | Male | Female |
| Under 5 Years | 0 (0.0%) | 0 (0.0%) |
| 5 to 17 Years | 2 (1.1%) | 0 (0.0%) |
| 18 to 34 Years | 0 (0.0%) | 0 (0.0%) |
| 35 to 64 Years | 5 (1.5%) | 26 (8.2%) |
| 65 to 74 Years | 22 (23.2%) | 13 (14.8%) |
| 75 Years and over | 22 (43.1%) | 17 (30.4%) |
Disability Class: Vision Difficulty
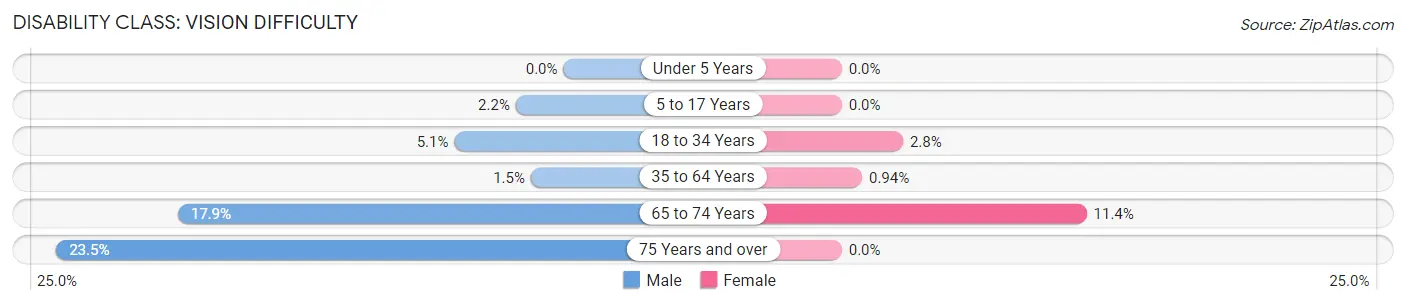
| Age Bracket | Male | Female |
| Under 5 Years | 0 (0.0%) | 0 (0.0%) |
| 5 to 17 Years | 4 (2.2%) | 0 (0.0%) |
| 18 to 34 Years | 12 (5.1%) | 4 (2.8%) |
| 35 to 64 Years | 5 (1.5%) | 3 (0.9%) |
| 65 to 74 Years | 17 (17.9%) | 10 (11.4%) |
| 75 Years and over | 12 (23.5%) | 0 (0.0%) |
Disability Class: Cognitive Difficulty
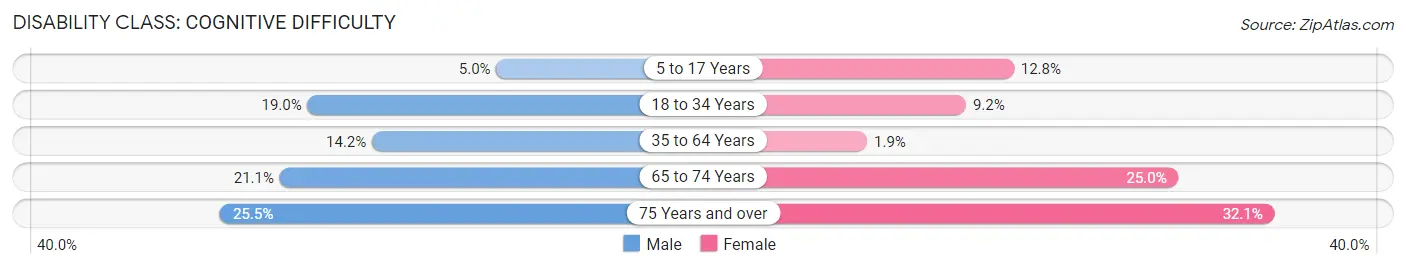
| Age Bracket | Male | Female |
| 5 to 17 Years | 9 (5.0%) | 12 (12.8%) |
| 18 to 34 Years | 45 (19.0%) | 13 (9.2%) |
| 35 to 64 Years | 47 (14.2%) | 6 (1.9%) |
| 65 to 74 Years | 20 (21.0%) | 22 (25.0%) |
| 75 Years and over | 13 (25.5%) | 18 (32.1%) |
Disability Class: Ambulatory Difficulty
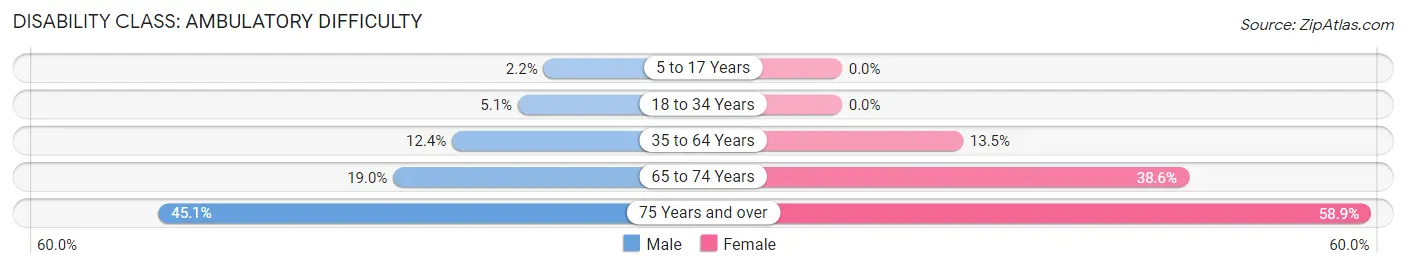
| Age Bracket | Male | Female |
| 5 to 17 Years | 4 (2.2%) | 0 (0.0%) |
| 18 to 34 Years | 12 (5.1%) | 0 (0.0%) |
| 35 to 64 Years | 41 (12.4%) | 43 (13.5%) |
| 65 to 74 Years | 18 (19.0%) | 34 (38.6%) |
| 75 Years and over | 23 (45.1%) | 33 (58.9%) |
Disability Class: Self-Care Difficulty
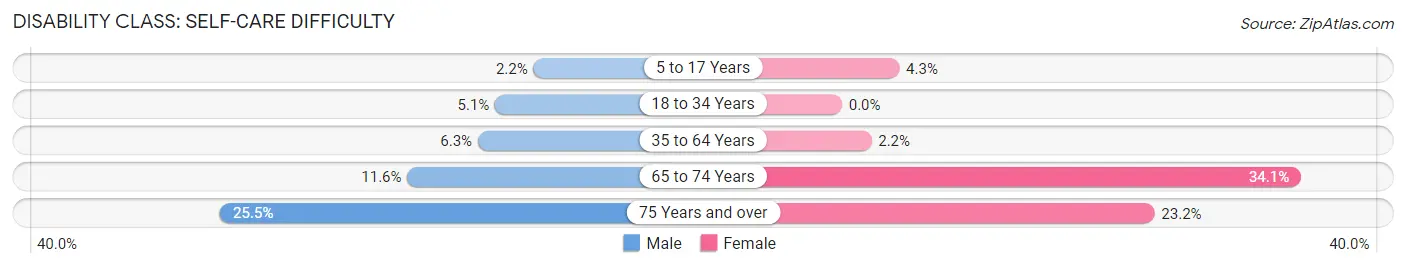
| Age Bracket | Male | Female |
| 5 to 17 Years | 4 (2.2%) | 4 (4.3%) |
| 18 to 34 Years | 12 (5.1%) | 0 (0.0%) |
| 35 to 64 Years | 21 (6.3%) | 7 (2.2%) |
| 65 to 74 Years | 11 (11.6%) | 30 (34.1%) |
| 75 Years and over | 13 (25.5%) | 13 (23.2%) |
Technology Access in Zwolle
Computing Device Access in Zwolle
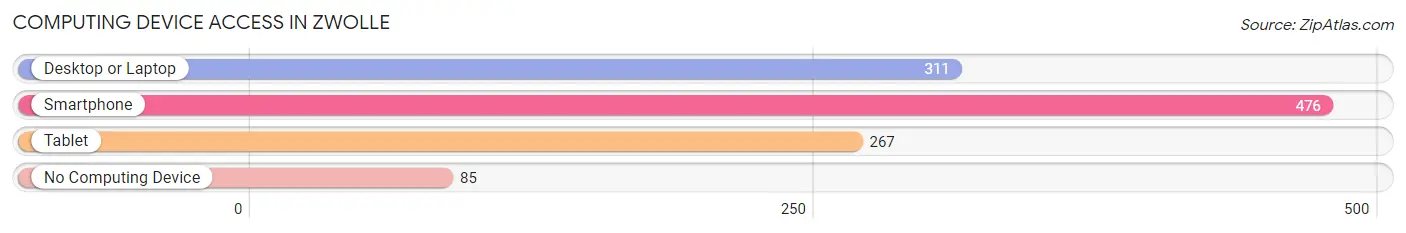
| Device Type | # Households | % Households |
| Desktop or Laptop | 311 | 51.2% |
| Smartphone | 476 | 78.4% |
| Tablet | 267 | 44.0% |
| No Computing Device | 85 | 14.0% |
| Total | 607 | 100.0% |
Internet Access in Zwolle
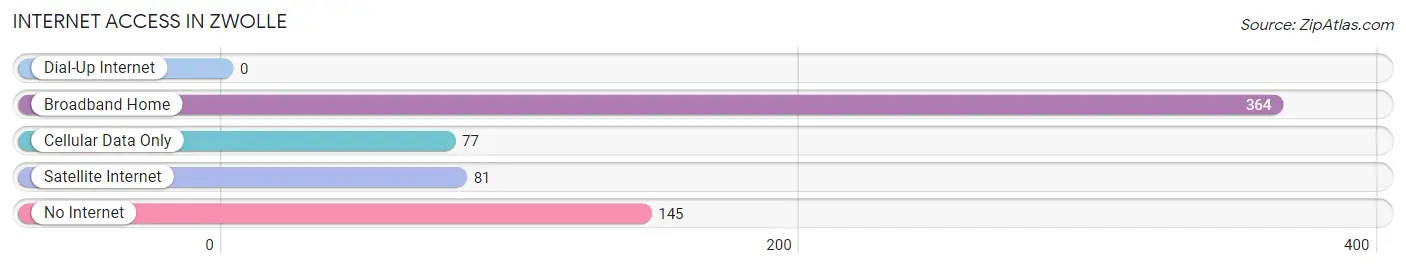
| Internet Type | # Households | % Households |
| Dial-Up Internet | 0 | 0.0% |
| Broadband Home | 364 | 60.0% |
| Cellular Data Only | 77 | 12.7% |
| Satellite Internet | 81 | 13.3% |
| No Internet | 145 | 23.9% |
| Total | 607 | 100.0% |
Zwolle Summary
Zwolle is a city located in the Dutch province of Overijssel. It is the capital of the municipality of Zwolle and the largest city in the province. The city has a population of approximately 125,000 people and is located in the eastern part of the Netherlands, close to the German border.
History
The city of Zwolle was first mentioned in the year 838, when it was mentioned in a document from the Abbey of Fulda. The city was founded by the Frisians, who were a Germanic tribe that lived in the area. The city was originally called Zwollea, which means “place of the wolves”. The city was an important trading center in the Middle Ages and was a member of the Hanseatic League. In the 16th century, the city was taken over by the Spanish and was part of the Spanish Netherlands. In the 17th century, the city was taken over by the Dutch Republic and became part of the Dutch Republic.
Geography
Zwolle is located in the eastern part of the Netherlands, close to the German border. The city is situated on the IJssel River, which is a major river in the Netherlands. The city is surrounded by the provinces of Gelderland, Overijssel, and Drenthe. The city is located in a flat area, with the highest point being only about 30 meters above sea level. The city is located in a temperate climate zone, with mild winters and warm summers.
Economy
The economy of Zwolle is mainly based on the service sector, with the city being home to many banks, insurance companies, and other financial services. The city is also home to many manufacturing companies, such as the Dutch company Philips, which produces electronics. The city is also home to many retail stores, such as the Dutch department store chain V&D. The city is also home to many cultural institutions, such as the Zwolle Museum, which is dedicated to the history of the city.
Demographics
The population of Zwolle is approximately 125,000 people. The majority of the population is Dutch, with the largest minority being Turkish. The city also has a large number of immigrants from other countries, such as Morocco, Suriname, and the Netherlands Antilles. The city also has a large number of students, as it is home to the University of Twente and the University of Applied Sciences.
Zwolle is a city with a long and rich history, and it is an important economic and cultural center in the Netherlands. The city has a diverse population and is home to many different industries and cultural institutions. The city is a great place to live and work, and it is a great place to visit for those who are interested in the history and culture of the Netherlands.
Common Questions
What is Per Capita Income in Zwolle?
Per Capita income in Zwolle is $16,798.
What is the Median Family Income in Zwolle?
Median Family Income in Zwolle is $35,341.
What is the Median Household income in Zwolle?
Median Household Income in Zwolle is $29,464.
What is Income or Wage Gap in Zwolle?
Income or Wage Gap in Zwolle is 34.9%.
Women in Zwolle earn 65.1 cents for every dollar earned by a man.
What is Inequality or Gini Index in Zwolle?
Inequality or Gini Index in Zwolle is 0.46.
What is the Total Population of Zwolle?
Total Population of Zwolle is 1,860.
What is the Total Male Population of Zwolle?
Total Male Population of Zwolle is 964.
What is the Total Female Population of Zwolle?
Total Female Population of Zwolle is 896.
What is the Ratio of Males per 100 Females in Zwolle?
There are 107.59 Males per 100 Females in Zwolle.
What is the Ratio of Females per 100 Males in Zwolle?
There are 92.95 Females per 100 Males in Zwolle.
What is the Median Population Age in Zwolle?
Median Population Age in Zwolle is 37.9 Years.
What is the Average Family Size in Zwolle
Average Family Size in Zwolle is 3.8 People.
What is the Average Household Size in Zwolle
Average Household Size in Zwolle is 2.9 People.
How Large is the Labor Force in Zwolle?
There are 667 People in the Labor Forcein in Zwolle.
What is the Percentage of People in the Labor Force in Zwolle?
46.9% of People are in the Labor Force in Zwolle.
What is the Unemployment Rate in Zwolle?
Unemployment Rate in Zwolle is 9.7%.