Zip Codes with the Highest Percentage of Population Employed in Arts, Entertainment & Recreation in Louisiana
RELATED REPORTS & OPTIONS
Arts, Entertainment & Recreation
Louisiana
Compare Zip Codes
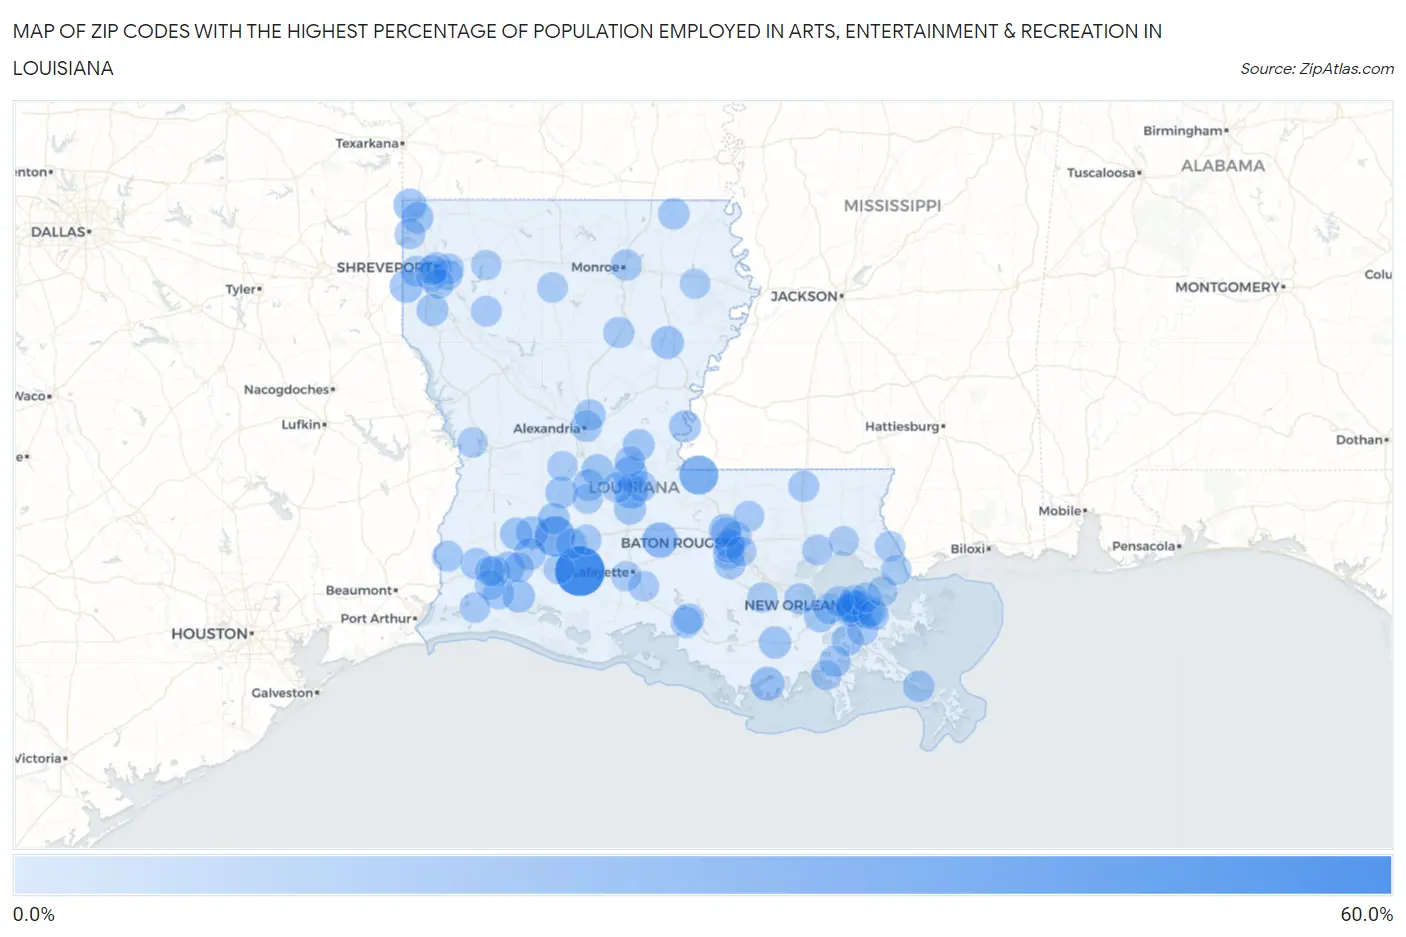
Map of Zip Codes with the Highest Percentage of Population Employed in Arts, Entertainment & Recreation in Louisiana
0.0%
60.0%
Zip Codes with the Highest Percentage of Population Employed in Arts, Entertainment & Recreation in Louisiana
| Zip Code | % Employed | vs State | vs National | |
| 1. | 70531 | 51.1% | 2.2%(+48.9)#1 | 2.1%(+49.0)#31 |
| 2. | 70532 | 27.3% | 2.2%(+25.1)#2 | 2.1%(+25.2)#99 |
| 3. | 70787 | 24.2% | 2.2%(+22.0)#3 | 2.1%(+22.2)#120 |
| 4. | 70750 | 15.4% | 2.2%(+13.2)#4 | 2.1%(+13.3)#321 |
| 5. | 71327 | 13.6% | 2.2%(+11.4)#5 | 2.1%(+11.5)#412 |
| 6. | 71356 | 13.2% | 2.2%(+11.0)#6 | 2.1%(+11.1)#440 |
| 7. | 70397 | 11.9% | 2.2%(+9.73)#7 | 2.1%(+9.84)#517 |
| 8. | 71007 | 10.1% | 2.2%(+7.86)#8 | 2.1%(+7.97)#697 |
| 9. | 71069 | 9.6% | 2.2%(+7.42)#9 | 2.1%(+7.53)#763 |
| 10. | 71378 | 9.3% | 2.2%(+7.05)#10 | 2.1%(+7.17)#814 |
| 11. | 70630 | 8.6% | 2.2%(+6.37)#11 | 2.1%(+6.48)#930 |
| 12. | 70648 | 8.3% | 2.2%(+6.14)#12 | 2.1%(+6.26)#975 |
| 13. | 70359 | 8.2% | 2.2%(+6.04)#13 | 2.1%(+6.16)#996 |
| 14. | 70658 | 8.1% | 2.2%(+5.91)#14 | 2.1%(+6.03)#1,031 |
| 15. | 70640 | 7.9% | 2.2%(+5.72)#15 | 2.1%(+5.84)#1,079 |
| 16. | 70807 | 7.7% | 2.2%(+5.53)#16 | 2.1%(+5.64)#1,125 |
| 17. | 70615 | 7.6% | 2.2%(+5.44)#17 | 2.1%(+5.55)#1,146 |
| 18. | 70039 | 7.3% | 2.2%(+5.10)#18 | 2.1%(+5.22)#1,231 |
| 19. | 71030 | 7.2% | 2.2%(+4.96)#19 | 2.1%(+5.07)#1,283 |
| 20. | 71463 | 7.1% | 2.2%(+4.90)#20 | 2.1%(+5.01)#1,303 |
| 21. | 71325 | 7.0% | 2.2%(+4.81)#21 | 2.1%(+4.93)#1,326 |
| 22. | 71373 | 7.0% | 2.2%(+4.80)#22 | 2.1%(+4.92)#1,330 |
| 23. | 70585 | 6.9% | 2.2%(+4.75)#23 | 2.1%(+4.86)#1,349 |
| 24. | 70655 | 6.8% | 2.2%(+4.58)#24 | 2.1%(+4.70)#1,396 |
| 25. | 71351 | 6.7% | 2.2%(+4.50)#25 | 2.1%(+4.61)#1,417 |
| 26. | 70589 | 6.7% | 2.2%(+4.47)#26 | 2.1%(+4.58)#1,428 |
| 27. | 71043 | 6.4% | 2.2%(+4.19)#27 | 2.1%(+4.30)#1,547 |
| 28. | 70663 | 6.3% | 2.2%(+4.13)#28 | 2.1%(+4.24)#1,570 |
| 29. | 70820 | 6.2% | 2.2%(+4.04)#29 | 2.1%(+4.16)#1,608 |
| 30. | 70116 | 6.2% | 2.2%(+4.02)#30 | 2.1%(+4.13)#1,621 |
| 31. | 71223 | 5.9% | 2.2%(+3.73)#31 | 2.1%(+3.85)#1,735 |
| 32. | 71359 | 5.9% | 2.2%(+3.73)#32 | 2.1%(+3.84)#1,737 |
| 33. | 70041 | 5.9% | 2.2%(+3.70)#33 | 2.1%(+3.81)#1,750 |
| 34. | 70117 | 5.8% | 2.2%(+3.63)#34 | 2.1%(+3.74)#1,791 |
| 35. | 70036 | 5.8% | 2.2%(+3.61)#35 | 2.1%(+3.73)#1,802 |
| 36. | 70053 | 5.6% | 2.2%(+3.45)#36 | 2.1%(+3.56)#1,887 |
| 37. | 71209 | 5.5% | 2.2%(+3.28)#37 | 2.1%(+3.39)#1,982 |
| 38. | 71405 | 5.4% | 2.2%(+3.22)#38 | 2.1%(+3.34)#2,011 |
| 39. | 71119 | 5.4% | 2.2%(+3.20)#39 | 2.1%(+3.32)#2,021 |
| 40. | 70607 | 5.4% | 2.2%(+3.18)#40 | 2.1%(+3.29)#2,041 |
| 41. | 70037 | 5.3% | 2.2%(+3.11)#41 | 2.1%(+3.23)#2,075 |
| 42. | 70601 | 5.3% | 2.2%(+3.11)#42 | 2.1%(+3.22)#2,079 |
| 43. | 70345 | 5.3% | 2.2%(+3.06)#43 | 2.1%(+3.17)#2,111 |
| 44. | 70049 | 5.3% | 2.2%(+3.05)#44 | 2.1%(+3.17)#2,117 |
| 45. | 70514 | 5.2% | 2.2%(+3.04)#45 | 2.1%(+3.16)#2,125 |
| 46. | 71415 | 5.2% | 2.2%(+2.97)#46 | 2.1%(+3.09)#2,174 |
| 47. | 70780 | 5.0% | 2.2%(+2.83)#47 | 2.1%(+2.95)#2,268 |
| 48. | 70661 | 4.9% | 2.2%(+2.75)#48 | 2.1%(+2.86)#2,327 |
| 49. | 71362 | 4.8% | 2.2%(+2.56)#49 | 2.1%(+2.67)#2,482 |
| 50. | 70465 | 4.7% | 2.2%(+2.50)#50 | 2.1%(+2.62)#2,537 |
| 51. | 70119 | 4.5% | 2.2%(+2.29)#51 | 2.1%(+2.41)#2,756 |
| 52. | 70515 | 4.5% | 2.2%(+2.28)#52 | 2.1%(+2.40)#2,763 |
| 53. | 71322 | 4.4% | 2.2%(+2.21)#53 | 2.1%(+2.33)#2,836 |
| 54. | 70770 | 4.4% | 2.2%(+2.17)#54 | 2.1%(+2.29)#2,883 |
| 55. | 70535 | 4.3% | 2.2%(+2.15)#55 | 2.1%(+2.27)#2,902 |
| 56. | 71034 | 4.3% | 2.2%(+2.15)#56 | 2.1%(+2.27)#2,904 |
| 57. | 70115 | 4.3% | 2.2%(+2.12)#57 | 2.1%(+2.24)#2,936 |
| 58. | 70031 | 4.3% | 2.2%(+2.11)#58 | 2.1%(+2.23)#2,952 |
| 59. | 71101 | 4.3% | 2.2%(+2.10)#59 | 2.1%(+2.22)#2,967 |
| 60. | 70523 | 4.2% | 2.2%(+2.02)#60 | 2.1%(+2.13)#3,061 |
| 61. | 70645 | 4.2% | 2.2%(+2.00)#61 | 2.1%(+2.12)#3,083 |
| 62. | 70803 | 4.2% | 2.2%(+2.00)#62 | 2.1%(+2.12)#3,084 |
| 63. | 70812 | 4.1% | 2.2%(+1.86)#63 | 2.1%(+1.97)#3,260 |
| 64. | 71112 | 4.0% | 2.2%(+1.84)#64 | 2.1%(+1.95)#3,280 |
| 65. | 71110 | 4.0% | 2.2%(+1.83)#65 | 2.1%(+1.95)#3,295 |
| 66. | 71061 | 4.0% | 2.2%(+1.82)#66 | 2.1%(+1.94)#3,310 |
| 67. | 71268 | 4.0% | 2.2%(+1.75)#67 | 2.1%(+1.87)#3,399 |
| 68. | 70454 | 3.9% | 2.2%(+1.71)#68 | 2.1%(+1.83)#3,463 |
| 69. | 71108 | 3.9% | 2.2%(+1.68)#69 | 2.1%(+1.79)#3,518 |
| 70. | 70802 | 3.9% | 2.2%(+1.66)#70 | 2.1%(+1.77)#3,542 |
| 71. | 70813 | 3.8% | 2.2%(+1.60)#71 | 2.1%(+1.72)#3,629 |
| 72. | 70546 | 3.8% | 2.2%(+1.59)#72 | 2.1%(+1.71)#3,649 |
| 73. | 70518 | 3.8% | 2.2%(+1.58)#73 | 2.1%(+1.69)#3,666 |
| 74. | 70354 | 3.6% | 2.2%(+1.43)#74 | 2.1%(+1.55)#3,892 |
| 75. | 70118 | 3.6% | 2.2%(+1.41)#75 | 2.1%(+1.52)#3,945 |
| 76. | 70075 | 3.6% | 2.2%(+1.40)#76 | 2.1%(+1.52)#3,949 |
| 77. | 71433 | 3.6% | 2.2%(+1.39)#77 | 2.1%(+1.51)#3,967 |
| 78. | 71350 | 3.6% | 2.2%(+1.39)#78 | 2.1%(+1.51)#3,968 |
| 79. | 71106 | 3.5% | 2.2%(+1.31)#79 | 2.1%(+1.43)#4,113 |
| 80. | 70131 | 3.5% | 2.2%(+1.26)#80 | 2.1%(+1.38)#4,226 |
| 81. | 70452 | 3.4% | 2.2%(+1.23)#81 | 2.1%(+1.35)#4,295 |
| 82. | 71403 | 3.4% | 2.2%(+1.18)#82 | 2.1%(+1.30)#4,395 |
| 83. | 71103 | 3.4% | 2.2%(+1.18)#83 | 2.1%(+1.30)#4,398 |
| 84. | 70125 | 3.4% | 2.2%(+1.16)#84 | 2.1%(+1.28)#4,447 |
| 85. | 70122 | 3.3% | 2.2%(+1.10)#85 | 2.1%(+1.22)#4,564 |
| 86. | 70461 | 3.3% | 2.2%(+1.10)#86 | 2.1%(+1.22)#4,567 |
| 87. | 70605 | 3.3% | 2.2%(+1.10)#87 | 2.1%(+1.21)#4,576 |
| 88. | 70086 | 3.2% | 2.2%(+0.983)#88 | 2.1%(+1.10)#4,849 |
| 89. | 71232 | 3.2% | 2.2%(+0.977)#89 | 2.1%(+1.09)#4,866 |
| 90. | 70092 | 3.2% | 2.2%(+0.974)#90 | 2.1%(+1.09)#4,876 |
| 91. | 71073 | 3.2% | 2.2%(+0.965)#91 | 2.1%(+1.08)#4,898 |
| 92. | 70127 | 3.1% | 2.2%(+0.942)#92 | 2.1%(+1.06)#4,959 |
| 93. | 70003 | 3.1% | 2.2%(+0.928)#93 | 2.1%(+1.04)#4,994 |
| 94. | 70809 | 3.1% | 2.2%(+0.910)#94 | 2.1%(+1.03)#5,042 |
| 95. | 70647 | 3.1% | 2.2%(+0.903)#95 | 2.1%(+1.02)#5,061 |
| 96. | 70669 | 3.1% | 2.2%(+0.882)#96 | 2.1%(+0.998)#5,127 |
| 97. | 70129 | 3.1% | 2.2%(+0.856)#97 | 2.1%(+0.971)#5,204 |
| 98. | 70506 | 3.0% | 2.2%(+0.834)#98 | 2.1%(+0.949)#5,255 |
| 99. | 70433 | 3.0% | 2.2%(+0.828)#99 | 2.1%(+0.943)#5,284 |
| 100. | 70576 | 3.0% | 2.2%(+0.802)#100 | 2.1%(+0.917)#5,355 |
Common Questions
What are the Top 10 Zip Codes with the Highest Percentage of Population Employed in Arts, Entertainment & Recreation in Louisiana?
Top 10 Zip Codes with the Highest Percentage of Population Employed in Arts, Entertainment & Recreation in Louisiana are:
What zip code has the Highest Percentage of Population Employed in Arts, Entertainment & Recreation in Louisiana?
70531 has the Highest Percentage of Population Employed in Arts, Entertainment & Recreation in Louisiana with 51.1%.
What is the Percentage of Population Employed in Arts, Entertainment & Recreation in the State of Louisiana?
Percentage of Population Employed in Arts, Entertainment & Recreation in Louisiana is 2.2%.
What is the Percentage of Population Employed in Arts, Entertainment & Recreation in the United States?
Percentage of Population Employed in Arts, Entertainment & Recreation in the United States is 2.1%.