Winnsboro, LA Map & Demographics
Winnsboro Map
Winnsboro Overview
$20,115
PER CAPITA INCOME
$36,411
AVG FAMILY INCOME
$31,821
AVG HOUSEHOLD INCOME
5.3%
WAGE / INCOME GAP [ % ]
94.7¢/ $1
WAGE / INCOME GAP [ $ ]
0.60
INEQUALITY / GINI INDEX
4,823
TOTAL POPULATION
2,089
MALE POPULATION
2,734
FEMALE POPULATION
76.41
MALES / 100 FEMALES
130.88
FEMALES / 100 MALES
33.0
MEDIAN AGE
3.8
AVG FAMILY SIZE
3.1
AVG HOUSEHOLD SIZE
1,726
LABOR FORCE [ PEOPLE ]
52.3%
PERCENT IN LABOR FORCE
11.9%
UNEMPLOYMENT RATE
Winnsboro Zip Codes
Winnsboro Area Codes
Income in Winnsboro
Income Overview in Winnsboro
Per Capita Income in Winnsboro is $20,115, while median incomes of families and households are $36,411 and $31,821 respectively.
| Characteristic | Number | Measure |
| Per Capita Income | 4,823 | $20,115 |
| Median Family Income | 1,105 | $36,411 |
| Mean Family Income | 1,105 | $72,740 |
| Median Household Income | 1,517 | $31,821 |
| Mean Household Income | 1,517 | $58,360 |
| Income Deficit | 1,105 | $0 |
| Wage / Income Gap (%) | 4,823 | 5.35% |
| Wage / Income Gap ($) | 4,823 | 94.65¢ per $1 |
| Gini / Inequality Index | 4,823 | 0.60 |
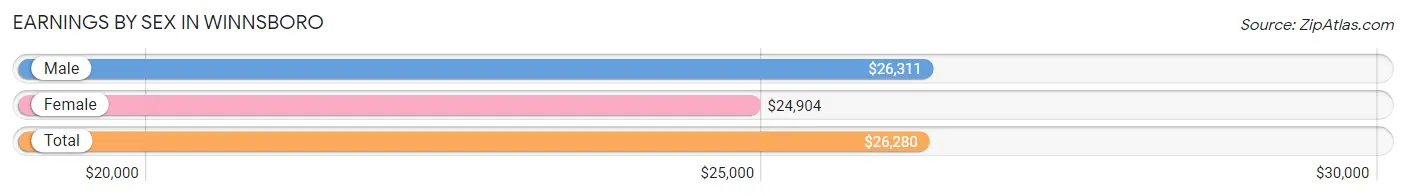
Earnings by Sex in Winnsboro
Average Earnings in Winnsboro are $26,280, $26,311 for men and $24,904 for women, a difference of 5.3%.
| Sex | Number | Average Earnings |
| Male | 820 (50.5%) | $26,311 |
| Female | 802 (49.4%) | $24,904 |
| Total | 1,622 (100.0%) | $26,280 |
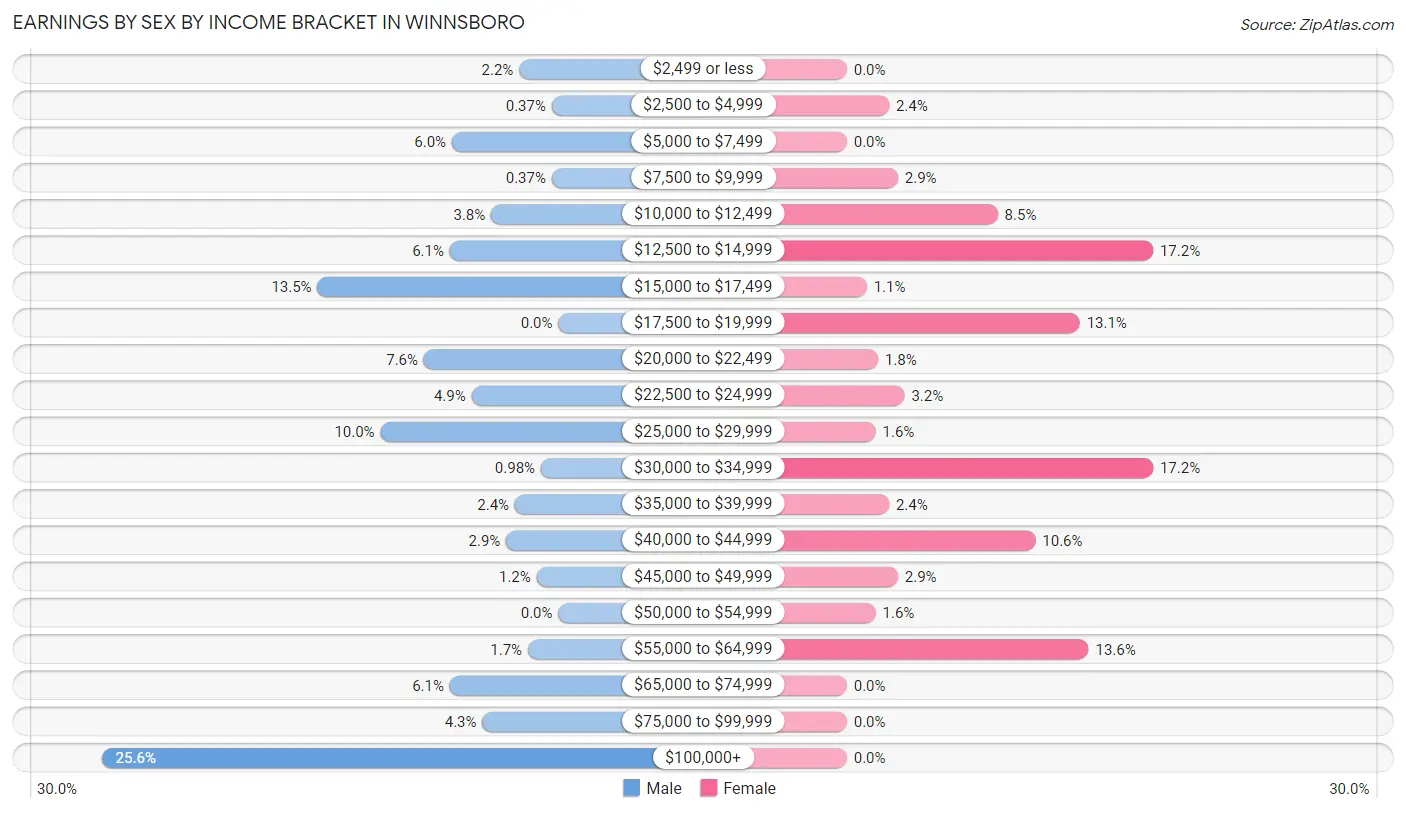
Earnings by Sex by Income Bracket in Winnsboro
The most common earnings brackets in Winnsboro are $100,000+ for men (210 | 25.6%) and $12,500 to $14,999 for women (138 | 17.2%).
| Income | Male | Female |
| $2,499 or less | 18 (2.2%) | 0 (0.0%) |
| $2,500 to $4,999 | 3 (0.4%) | 19 (2.4%) |
| $5,000 to $7,499 | 49 (6.0%) | 0 (0.0%) |
| $7,500 to $9,999 | 3 (0.4%) | 23 (2.9%) |
| $10,000 to $12,499 | 31 (3.8%) | 68 (8.5%) |
| $12,500 to $14,999 | 50 (6.1%) | 138 (17.2%) |
| $15,000 to $17,499 | 111 (13.5%) | 9 (1.1%) |
| $17,500 to $19,999 | 0 (0.0%) | 105 (13.1%) |
| $20,000 to $22,499 | 62 (7.6%) | 14 (1.8%) |
| $22,500 to $24,999 | 40 (4.9%) | 26 (3.2%) |
| $25,000 to $29,999 | 82 (10.0%) | 13 (1.6%) |
| $30,000 to $34,999 | 8 (1.0%) | 138 (17.2%) |
| $35,000 to $39,999 | 20 (2.4%) | 19 (2.4%) |
| $40,000 to $44,999 | 24 (2.9%) | 85 (10.6%) |
| $45,000 to $49,999 | 10 (1.2%) | 23 (2.9%) |
| $50,000 to $54,999 | 0 (0.0%) | 13 (1.6%) |
| $55,000 to $64,999 | 14 (1.7%) | 109 (13.6%) |
| $65,000 to $74,999 | 50 (6.1%) | 0 (0.0%) |
| $75,000 to $99,999 | 35 (4.3%) | 0 (0.0%) |
| $100,000+ | 210 (25.6%) | 0 (0.0%) |
| Total | 820 (100.0%) | 802 (100.0%) |
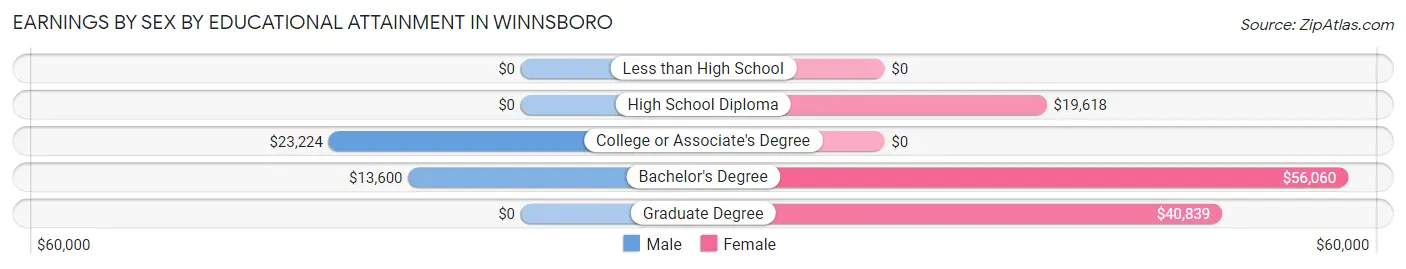
Earnings by Sex by Educational Attainment in Winnsboro
| Educational Attainment | Male Income | Female Income |
| Less than High School | - | - |
| High School Diploma | - | - |
| College or Associate's Degree | $23,224 | $0 |
| Bachelor's Degree | $13,600 | $56,060 |
| Graduate Degree | - | - |
| Total | - | - |
Family Income in Winnsboro
Family Income Brackets in Winnsboro
According to the Winnsboro family income data, there are 256 families falling into the $15,000 to $24,999 income range, which is the most common income bracket and makes up 23.2% of all families. Conversely, the $100,000 to $149,999 income bracket is the least frequent group with only 50 families (4.5%) belonging to this category.
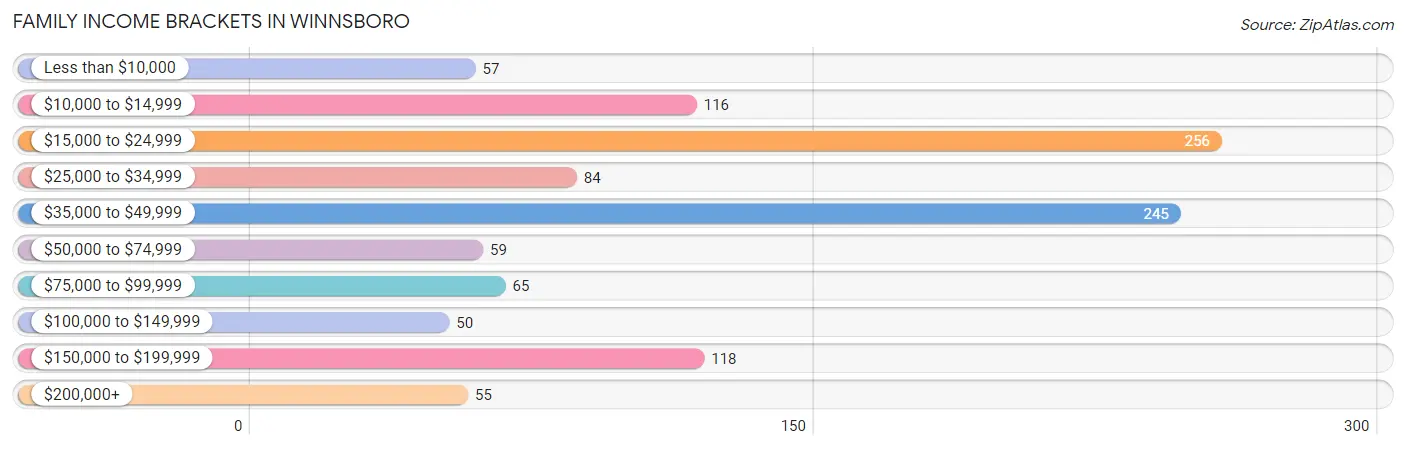
| Income Bracket | # Families | % Families |
| Less than $10,000 | 57 | 5.2% |
| $10,000 to $14,999 | 116 | 10.5% |
| $15,000 to $24,999 | 256 | 23.2% |
| $25,000 to $34,999 | 84 | 7.6% |
| $35,000 to $49,999 | 245 | 22.2% |
| $50,000 to $74,999 | 59 | 5.3% |
| $75,000 to $99,999 | 65 | 5.9% |
| $100,000 to $149,999 | 50 | 4.5% |
| $150,000 to $199,999 | 118 | 10.7% |
| $200,000+ | 55 | 5.0% |
Family Income by Famaliy Size in Winnsboro
2-person families (269 | 24.3%) account for the highest median family income in Winnsboro with $47,774 per family, while 2-person families (269 | 24.3%) have the highest median income of $23,887 per family member.
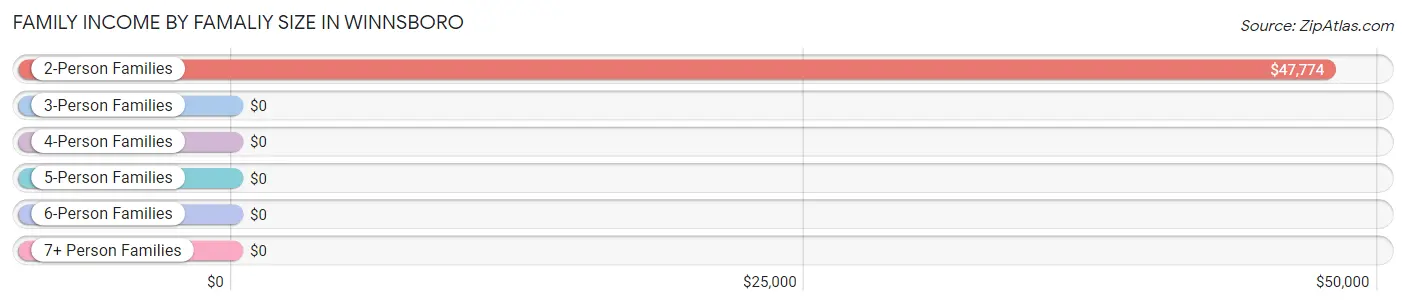
| Income Bracket | # Families | Median Income |
| 2-Person Families | 269 (24.3%) | $47,774 |
| 3-Person Families | 346 (31.3%) | $0 |
| 4-Person Families | 194 (17.6%) | $0 |
| 5-Person Families | 232 (21.0%) | $0 |
| 6-Person Families | 38 (3.4%) | $0 |
| 7+ Person Families | 26 (2.4%) | $0 |
| Total | 1,105 (100.0%) | $36,411 |
Family Income by Number of Earners in Winnsboro
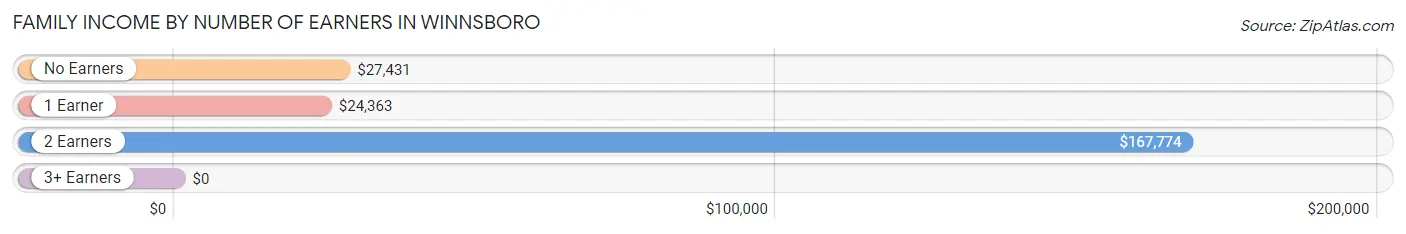
| Number of Earners | # Families | Median Income |
| No Earners | 105 (9.5%) | $27,431 |
| 1 Earner | 703 (63.6%) | $24,363 |
| 2 Earners | 297 (26.9%) | $167,774 |
| 3+ Earners | 0 (0.0%) | $0 |
| Total | 1,105 (100.0%) | $36,411 |
Household Income in Winnsboro
Household Income Brackets in Winnsboro
With 325 households falling in the category, the $15,000 to $24,999 income range is the most frequent in Winnsboro, accounting for 21.4% of all households. In contrast, only 55 households (3.6%) fall into the $200,000+ income bracket, making it the least populous group.
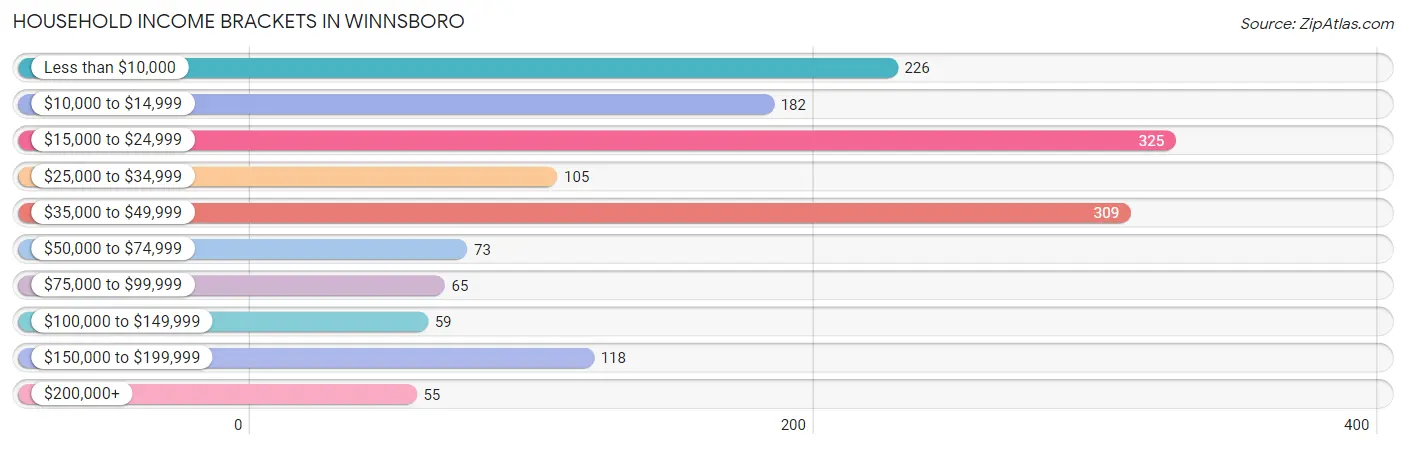
| Income Bracket | # Households | % Households |
| Less than $10,000 | 226 | 14.9% |
| $10,000 to $14,999 | 182 | 12.0% |
| $15,000 to $24,999 | 325 | 21.4% |
| $25,000 to $34,999 | 105 | 6.9% |
| $35,000 to $49,999 | 309 | 20.4% |
| $50,000 to $74,999 | 73 | 4.8% |
| $75,000 to $99,999 | 65 | 4.3% |
| $100,000 to $149,999 | 59 | 3.9% |
| $150,000 to $199,999 | 118 | 7.8% |
| $200,000+ | 55 | 3.6% |
Household Income by Householder Age in Winnsboro
The median household income in Winnsboro is $31,821, with the highest median household income of $36,462 found in the 45 to 64 years age bracket for the primary householder. A total of 468 households (30.8%) fall into this category.
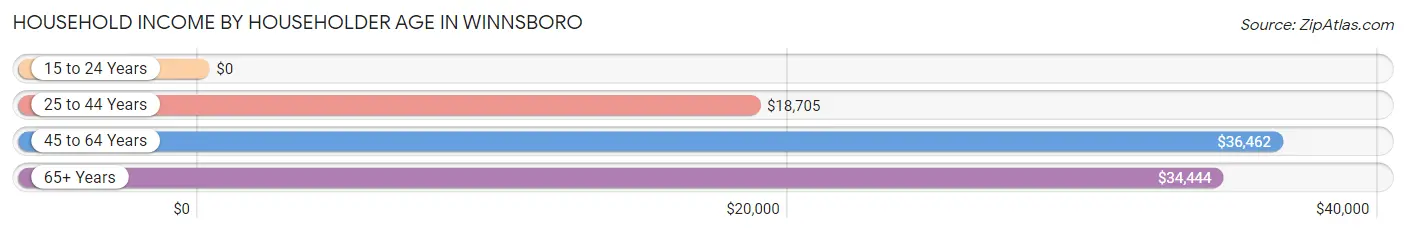
| Income Bracket | # Households | Median Income |
| 15 to 24 Years | 0 (0.0%) | $0 |
| 25 to 44 Years | 637 (42.0%) | $18,705 |
| 45 to 64 Years | 468 (30.8%) | $36,462 |
| 65+ Years | 412 (27.2%) | $34,444 |
| Total | 1,517 (100.0%) | $31,821 |
Poverty in Winnsboro
Income Below Poverty by Sex and Age in Winnsboro
With 38.7% poverty level for males and 37.8% for females among the residents of Winnsboro, 6 to 11 year old males and 15 year old females are the most vulnerable to poverty, with 219 males (77.7%) and 49 females (100.0%) in their respective age groups living below the poverty level.
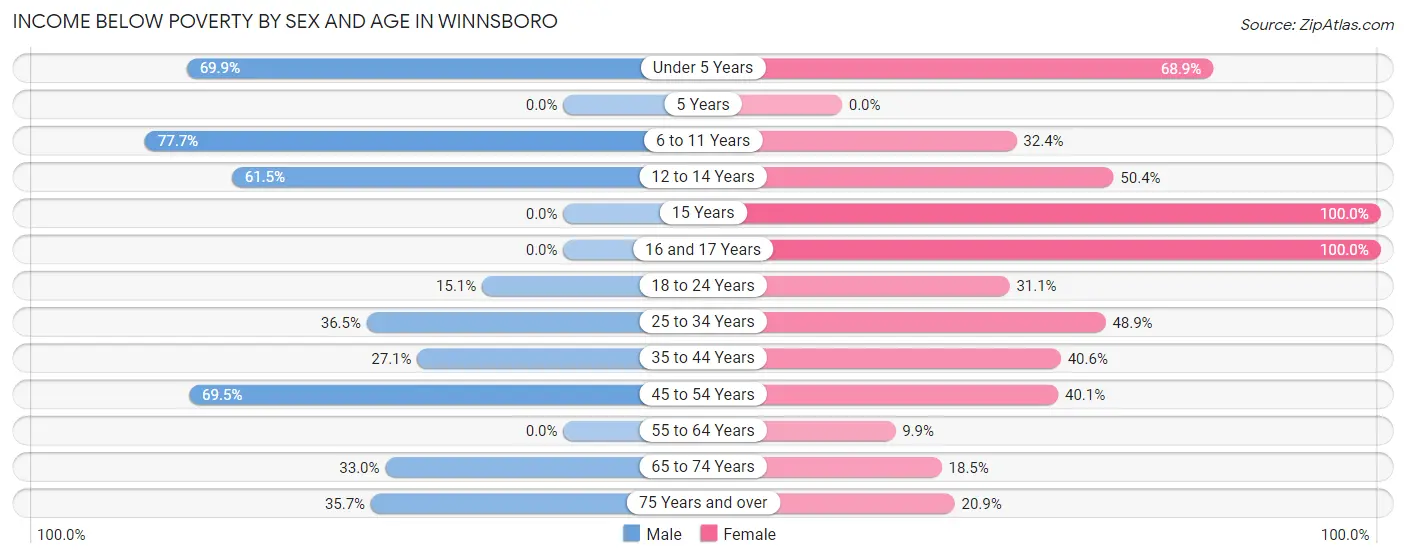
| Age Bracket | Male | Female |
| Under 5 Years | 144 (69.9%) | 133 (68.9%) |
| 5 Years | 0 (0.0%) | 0 (0.0%) |
| 6 to 11 Years | 219 (77.7%) | 105 (32.4%) |
| 12 to 14 Years | 32 (61.5%) | 124 (50.4%) |
| 15 Years | 0 (0.0%) | 49 (100.0%) |
| 16 and 17 Years | 0 (0.0%) | 43 (100.0%) |
| 18 to 24 Years | 27 (15.1%) | 89 (31.1%) |
| 25 to 34 Years | 77 (36.5%) | 207 (48.9%) |
| 35 to 44 Years | 116 (27.1%) | 115 (40.6%) |
| 45 to 54 Years | 91 (69.5%) | 59 (40.1%) |
| 55 to 64 Years | 0 (0.0%) | 25 (9.9%) |
| 65 to 74 Years | 74 (33.0%) | 53 (18.5%) |
| 75 Years and over | 15 (35.7%) | 18 (20.9%) |
| Total | 795 (38.7%) | 1,020 (37.8%) |
Income Above Poverty by Sex and Age in Winnsboro
According to the poverty statistics in Winnsboro, males aged 15 years and females aged 5 years are the age groups that are most secure financially, with 100.0% of males and 100.0% of females in these age groups living above the poverty line.
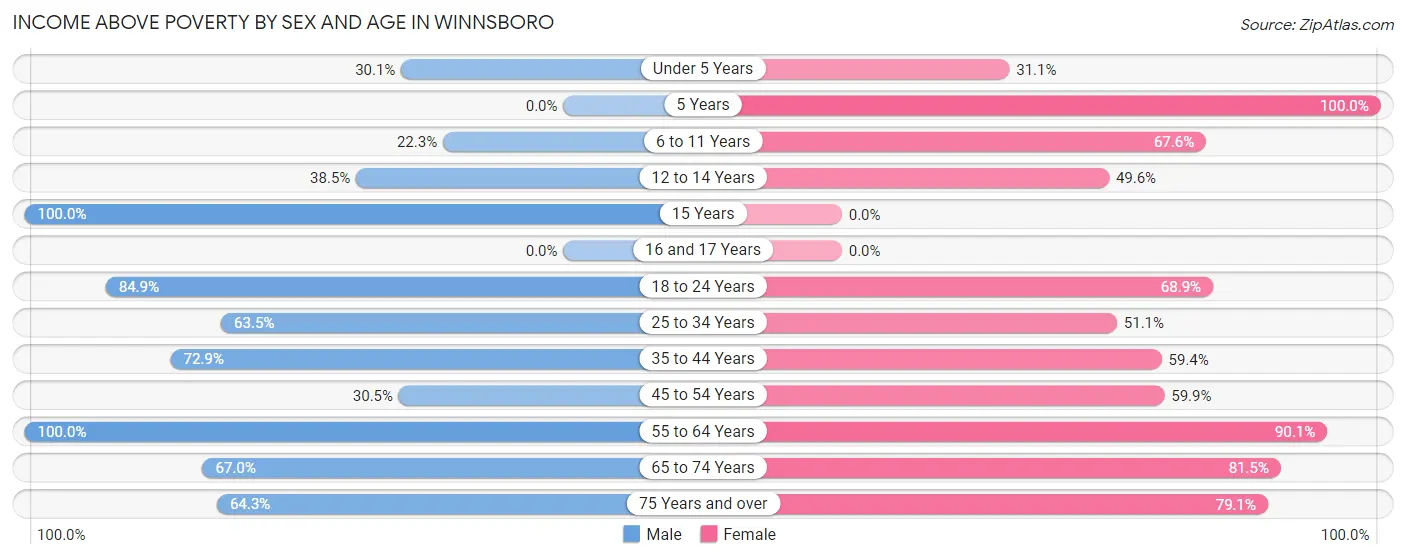
| Age Bracket | Male | Female |
| Under 5 Years | 62 (30.1%) | 60 (31.1%) |
| 5 Years | 0 (0.0%) | 79 (100.0%) |
| 6 to 11 Years | 63 (22.3%) | 219 (67.6%) |
| 12 to 14 Years | 20 (38.5%) | 122 (49.6%) |
| 15 Years | 91 (100.0%) | 0 (0.0%) |
| 16 and 17 Years | 0 (0.0%) | 0 (0.0%) |
| 18 to 24 Years | 152 (84.9%) | 197 (68.9%) |
| 25 to 34 Years | 134 (63.5%) | 216 (51.1%) |
| 35 to 44 Years | 312 (72.9%) | 168 (59.4%) |
| 45 to 54 Years | 40 (30.5%) | 88 (59.9%) |
| 55 to 64 Years | 209 (100.0%) | 227 (90.1%) |
| 65 to 74 Years | 150 (67.0%) | 233 (81.5%) |
| 75 Years and over | 27 (64.3%) | 68 (79.1%) |
| Total | 1,260 (61.3%) | 1,677 (62.2%) |
Income Below Poverty Among Married-Couple Families in Winnsboro
The poverty statistics for married-couple families in Winnsboro show that 8.1% or 42 of the total 518 families live below the poverty line. Families with 1 or 2 children have the highest poverty rate of 41.7%, comprising of 40 families. On the other hand, families with 3 or 4 children have the lowest poverty rate of 0.0%, which includes 0 families.
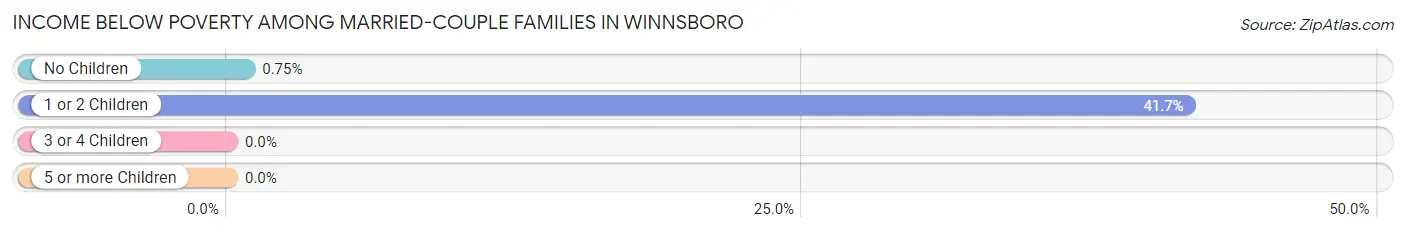
| Children | Above Poverty | Below Poverty |
| No Children | 264 (99.3%) | 2 (0.7%) |
| 1 or 2 Children | 56 (58.3%) | 40 (41.7%) |
| 3 or 4 Children | 156 (100.0%) | 0 (0.0%) |
| 5 or more Children | 0 (0.0%) | 0 (0.0%) |
| Total | 476 (91.9%) | 42 (8.1%) |
Income Below Poverty Among Single-Parent Households in Winnsboro
According to the poverty data in Winnsboro, 34.3% or 49 single-father households and 61.9% or 275 single-mother households are living below the poverty line. Among single-father households, those with 3 or 4 children have the highest poverty rate, with 49 households (100.0%) experiencing poverty. Likewise, among single-mother households, those with 3 or 4 children have the highest poverty rate, with 87 households (100.0%) falling below the poverty line.
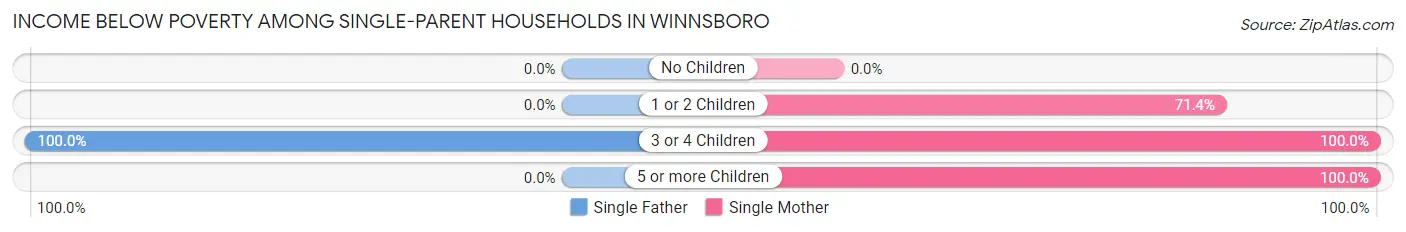
| Children | Single Father | Single Mother |
| No Children | 0 (0.0%) | 0 (0.0%) |
| 1 or 2 Children | 0 (0.0%) | 162 (71.4%) |
| 3 or 4 Children | 49 (100.0%) | 87 (100.0%) |
| 5 or more Children | 0 (0.0%) | 26 (100.0%) |
| Total | 49 (34.3%) | 275 (61.9%) |
Income Below Poverty Among Married-Couple vs Single-Parent Households in Winnsboro
The poverty data for Winnsboro shows that 42 of the married-couple family households (8.1%) and 324 of the single-parent households (55.2%) are living below the poverty level. Within the married-couple family households, those with 1 or 2 children have the highest poverty rate, with 40 households (41.7%) falling below the poverty line. Among the single-parent households, those with 3 or 4 children have the highest poverty rate, with 136 household (100.0%) living below poverty.
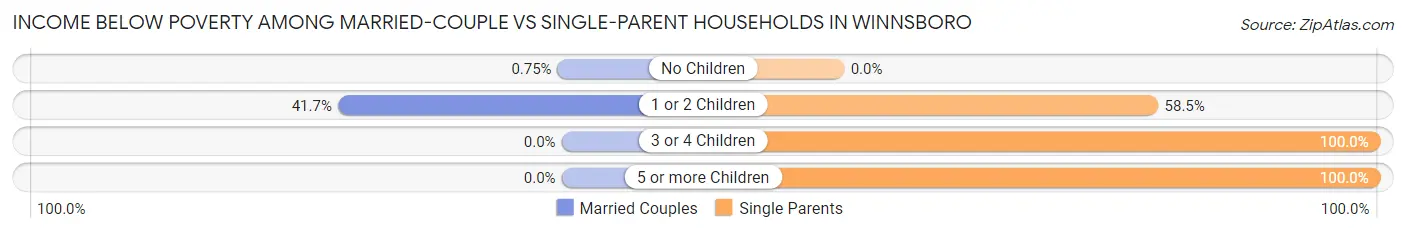
| Children | Married-Couple Families | Single-Parent Households |
| No Children | 2 (0.7%) | 0 (0.0%) |
| 1 or 2 Children | 40 (41.7%) | 162 (58.5%) |
| 3 or 4 Children | 0 (0.0%) | 136 (100.0%) |
| 5 or more Children | 0 (0.0%) | 26 (100.0%) |
| Total | 42 (8.1%) | 324 (55.2%) |
Race in Winnsboro
The most populous races in Winnsboro are Black / African American (2,781 | 57.7%), White / Caucasian (1,772 | 36.7%), and Two or more Races (264 | 5.5%).
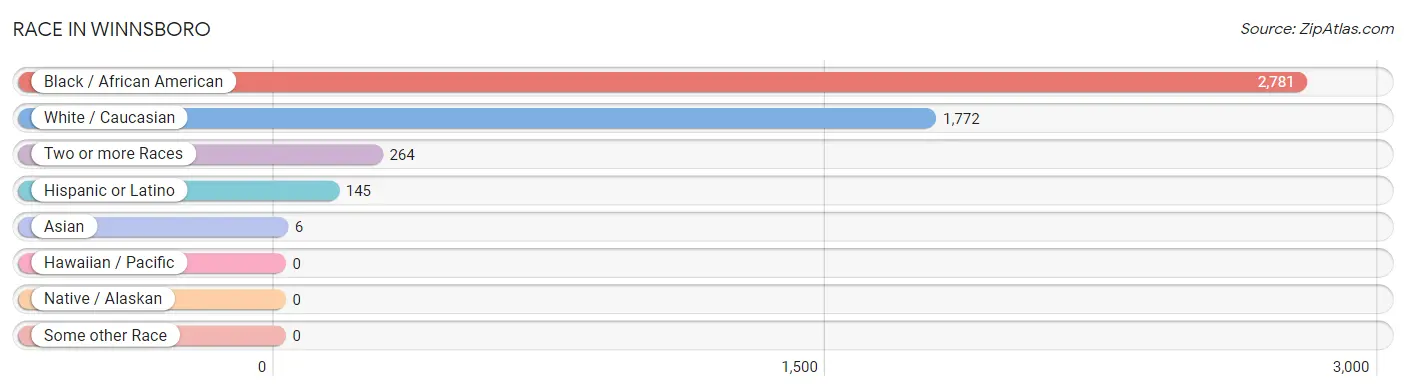
| Race | # Population | % Population |
| Asian | 6 | 0.1% |
| Black / African American | 2,781 | 57.7% |
| Hawaiian / Pacific | 0 | 0.0% |
| Hispanic or Latino | 145 | 3.0% |
| Native / Alaskan | 0 | 0.0% |
| White / Caucasian | 1,772 | 36.7% |
| Two or more Races | 264 | 5.5% |
| Some other Race | 0 | 0.0% |
| Total | 4,823 | 100.0% |
Ancestry in Winnsboro
The most populous ancestries reported in Winnsboro are Irish (567 | 11.8%), English (528 | 11.0%), American (295 | 6.1%), Choctaw (263 | 5.4%), and Mexican (145 | 3.0%), together accounting for 37.3% of all Winnsboro residents.
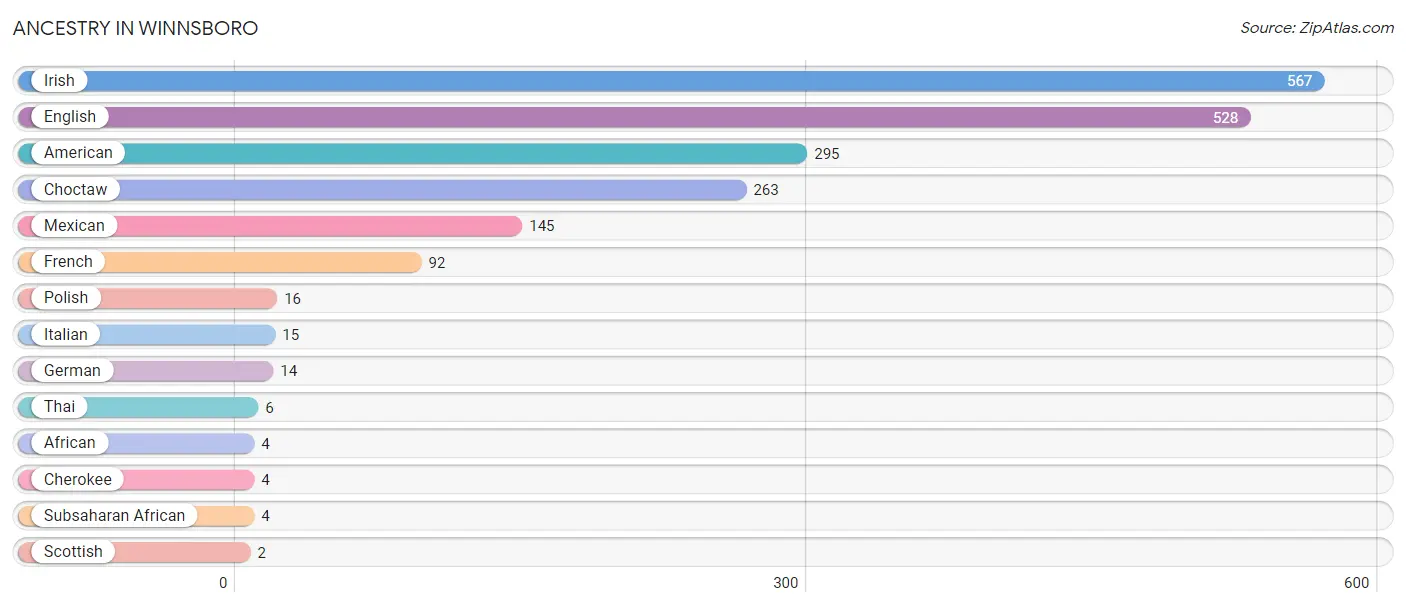
| Ancestry | # Population | % Population |
| African | 4 | 0.1% |
| American | 295 | 6.1% |
| Cherokee | 4 | 0.1% |
| Choctaw | 263 | 5.4% |
| English | 528 | 11.0% |
| French | 92 | 1.9% |
| German | 14 | 0.3% |
| Irish | 567 | 11.8% |
| Italian | 15 | 0.3% |
| Mexican | 145 | 3.0% |
| Polish | 16 | 0.3% |
| Scottish | 2 | 0.0% |
| Subsaharan African | 4 | 0.1% |
| Thai | 6 | 0.1% | View All 14 Rows |
Immigrants in Winnsboro
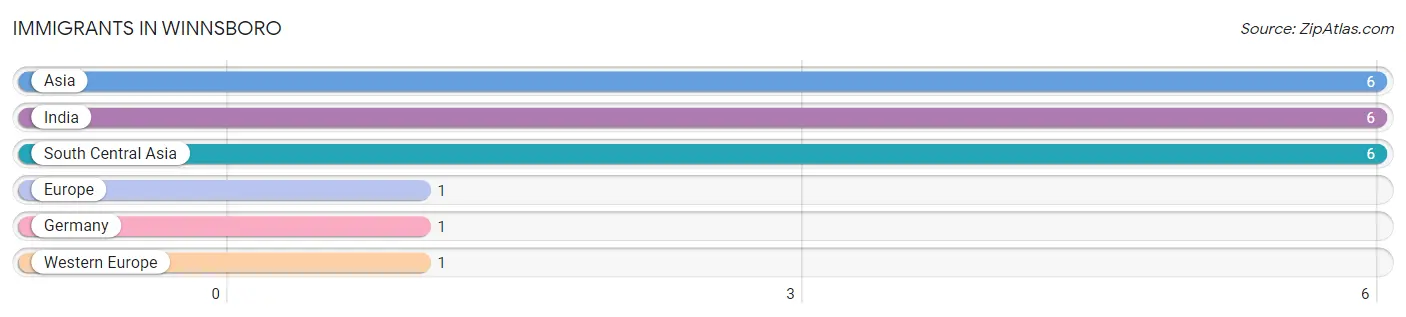
The most numerous immigrant groups reported in Winnsboro came from Asia (6 | 0.1%), India (6 | 0.1%), South Central Asia (6 | 0.1%), Europe (1 | 0.0%), and Germany (1 | 0.0%), together accounting for 0.4% of all Winnsboro residents.
| Immigration Origin | # Population | % Population |
| Asia | 6 | 0.1% |
| Europe | 1 | 0.0% |
| Germany | 1 | 0.0% |
| India | 6 | 0.1% |
| South Central Asia | 6 | 0.1% |
| Western Europe | 1 | 0.0% | View All 6 Rows |
Sex and Age in Winnsboro
Sex and Age in Winnsboro
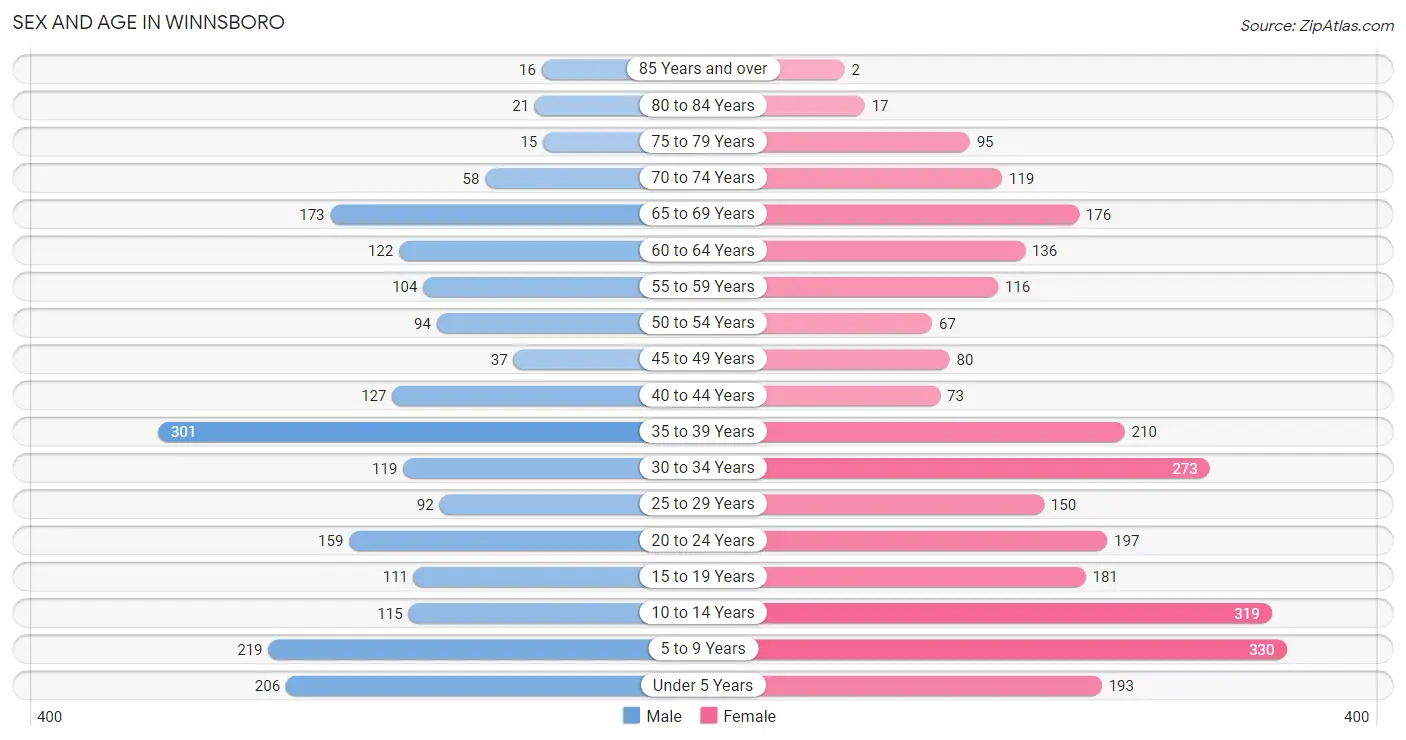
The most populous age groups in Winnsboro are 35 to 39 Years (301 | 14.4%) for men and 5 to 9 Years (330 | 12.1%) for women.
| Age Bracket | Male | Female |
| Under 5 Years | 206 (9.9%) | 193 (7.1%) |
| 5 to 9 Years | 219 (10.5%) | 330 (12.1%) |
| 10 to 14 Years | 115 (5.5%) | 319 (11.7%) |
| 15 to 19 Years | 111 (5.3%) | 181 (6.6%) |
| 20 to 24 Years | 159 (7.6%) | 197 (7.2%) |
| 25 to 29 Years | 92 (4.4%) | 150 (5.5%) |
| 30 to 34 Years | 119 (5.7%) | 273 (10.0%) |
| 35 to 39 Years | 301 (14.4%) | 210 (7.7%) |
| 40 to 44 Years | 127 (6.1%) | 73 (2.7%) |
| 45 to 49 Years | 37 (1.8%) | 80 (2.9%) |
| 50 to 54 Years | 94 (4.5%) | 67 (2.5%) |
| 55 to 59 Years | 104 (5.0%) | 116 (4.2%) |
| 60 to 64 Years | 122 (5.8%) | 136 (5.0%) |
| 65 to 69 Years | 173 (8.3%) | 176 (6.4%) |
| 70 to 74 Years | 58 (2.8%) | 119 (4.3%) |
| 75 to 79 Years | 15 (0.7%) | 95 (3.5%) |
| 80 to 84 Years | 21 (1.0%) | 17 (0.6%) |
| 85 Years and over | 16 (0.8%) | 2 (0.1%) |
| Total | 2,089 (100.0%) | 2,734 (100.0%) |
Families and Households in Winnsboro
Median Family Size in Winnsboro
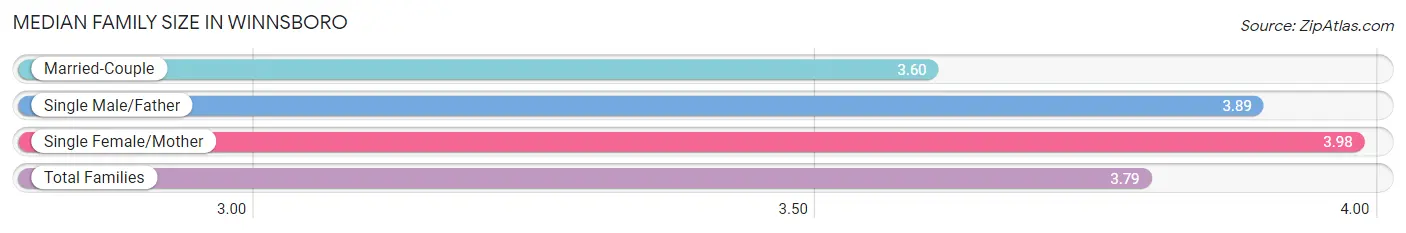
The median family size in Winnsboro is 3.79 persons per family, with single female/mother families (444 | 40.2%) accounting for the largest median family size of 3.98 persons per family. On the other hand, married-couple families (518 | 46.9%) represent the smallest median family size with 3.60 persons per family.
| Family Type | # Families | Family Size |
| Married-Couple | 518 (46.9%) | 3.60 |
| Single Male/Father | 143 (12.9%) | 3.89 |
| Single Female/Mother | 444 (40.2%) | 3.98 |
| Total Families | 1,105 (100.0%) | 3.79 |
Median Household Size in Winnsboro
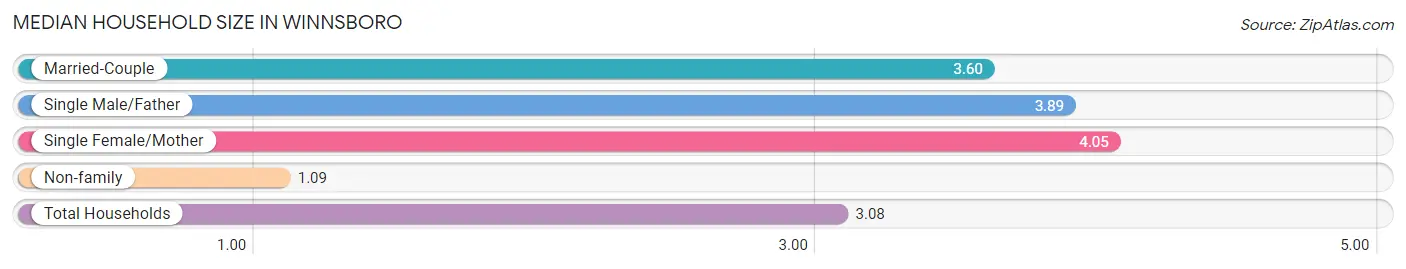
The median household size in Winnsboro is 3.08 persons per household, with single female/mother households (444 | 29.3%) accounting for the largest median household size of 4.05 persons per household. non-family households (412 | 27.2%) represent the smallest median household size with 1.09 persons per household.
| Household Type | # Households | Household Size |
| Married-Couple | 518 (34.2%) | 3.60 |
| Single Male/Father | 143 (9.4%) | 3.89 |
| Single Female/Mother | 444 (29.3%) | 4.05 |
| Non-family | 412 (27.2%) | 1.09 |
| Total Households | 1,517 (100.0%) | 3.08 |
Household Size by Marriage Status in Winnsboro
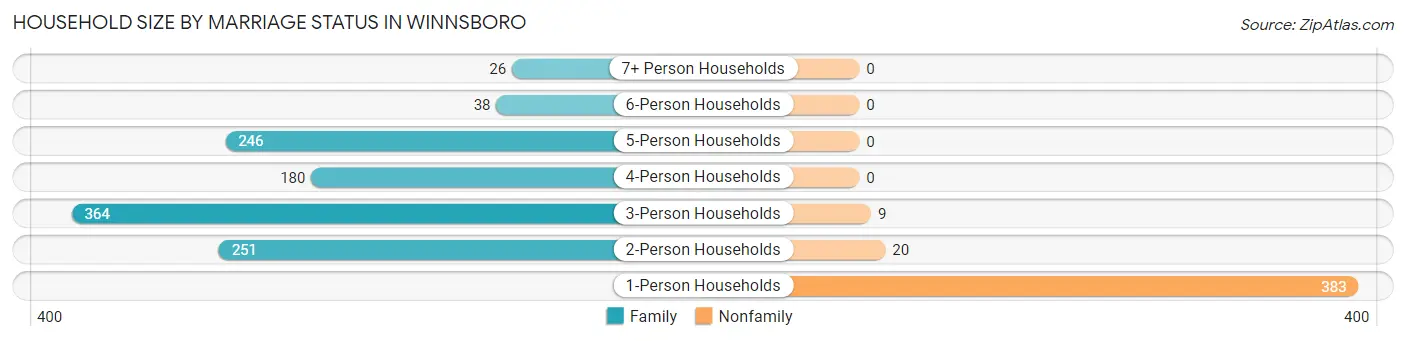
Out of a total of 1,517 households in Winnsboro, 1,105 (72.8%) are family households, while 412 (27.2%) are nonfamily households. The most numerous type of family households are 3-person households, comprising 364, and the most common type of nonfamily households are 1-person households, comprising 383.
| Household Size | Family Households | Nonfamily Households |
| 1-Person Households | - | 383 (25.3%) |
| 2-Person Households | 251 (16.6%) | 20 (1.3%) |
| 3-Person Households | 364 (24.0%) | 9 (0.6%) |
| 4-Person Households | 180 (11.9%) | 0 (0.0%) |
| 5-Person Households | 246 (16.2%) | 0 (0.0%) |
| 6-Person Households | 38 (2.5%) | 0 (0.0%) |
| 7+ Person Households | 26 (1.7%) | 0 (0.0%) |
| Total | 1,105 (72.8%) | 412 (27.2%) |
Female Fertility in Winnsboro
Fertility by Age in Winnsboro
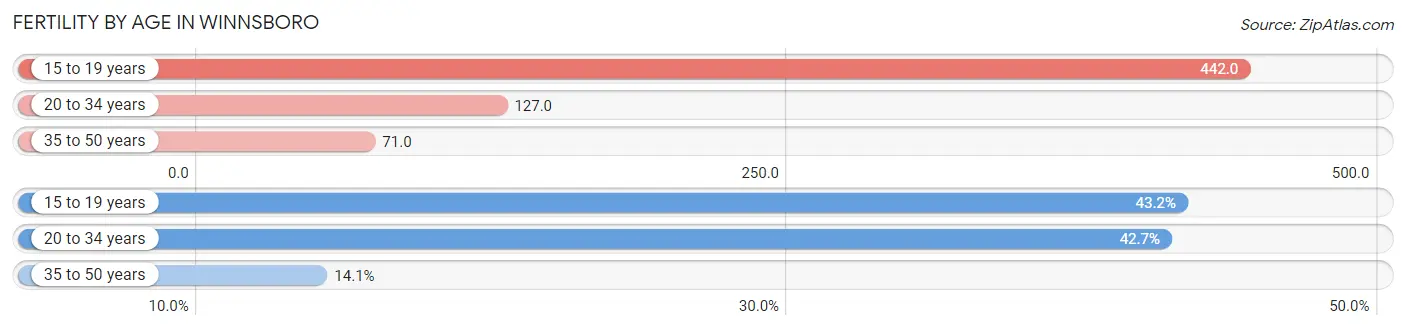
Average fertility rate in Winnsboro is 159.0 births per 1,000 women. Women in the age bracket of 15 to 19 years have the highest fertility rate with 442.0 births per 1,000 women. Women in the age bracket of 15 to 19 years acount for 43.2% of all women with births.
| Age Bracket | Women with Births | Births / 1,000 Women |
| 15 to 19 years | 80 (43.2%) | 442.0 |
| 20 to 34 years | 79 (42.7%) | 127.0 |
| 35 to 50 years | 26 (14.1%) | 71.0 |
| Total | 185 (100.0%) | 159.0 |
Fertility by Age by Marriage Status in Winnsboro
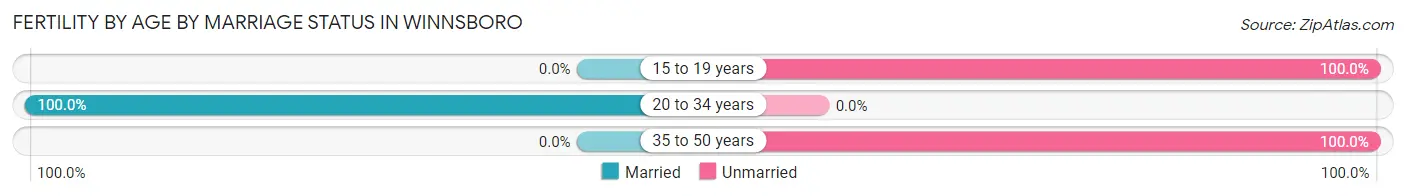
42.7% of women with births (185) in Winnsboro are married. The highest percentage of unmarried women with births falls into 15 to 19 years age bracket with 100.0% of them unmarried at the time of birth, while the lowest percentage of unmarried women with births belong to 20 to 34 years age bracket with 0.0% of them unmarried.
| Age Bracket | Married | Unmarried |
| 15 to 19 years | 0 (0.0%) | 80 (100.0%) |
| 20 to 34 years | 79 (100.0%) | 0 (0.0%) |
| 35 to 50 years | 0 (0.0%) | 26 (100.0%) |
| Total | 79 (42.7%) | 106 (57.3%) |
Fertility by Education in Winnsboro
| Educational Attainment | Women with Births | Births / 1,000 Women |
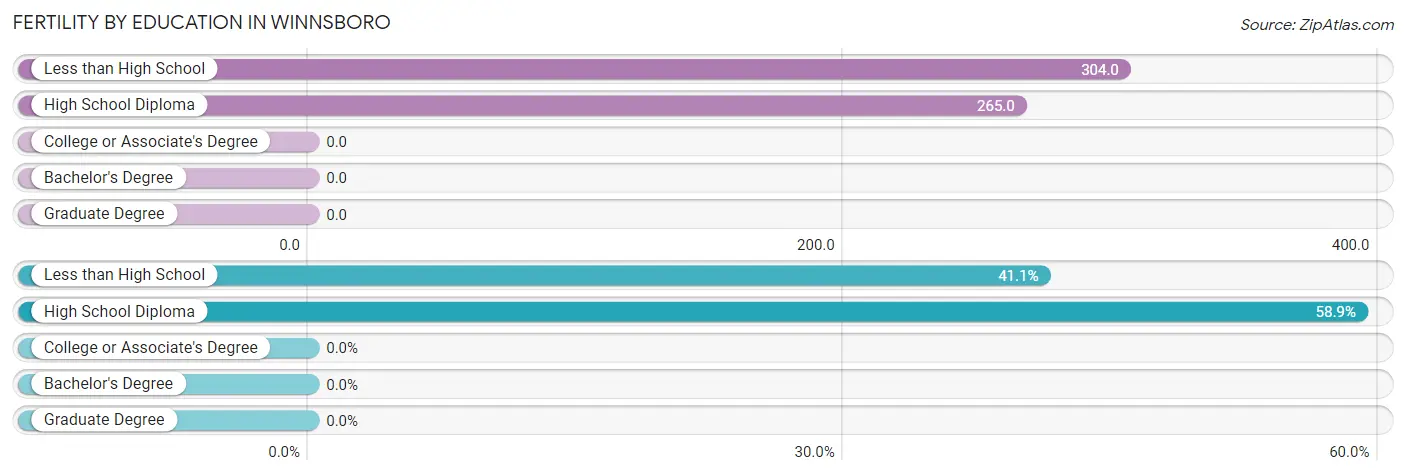
| Less than High School | 76 (41.1%) | 304.0 |
| High School Diploma | 109 (58.9%) | 265.0 |
| College or Associate's Degree | 0 (0.0%) | 0.0 |
| Bachelor's Degree | 0 (0.0%) | 0.0 |
| Graduate Degree | 0 (0.0%) | 0.0 |
| Total | 185 (100.0%) | 159.0 |
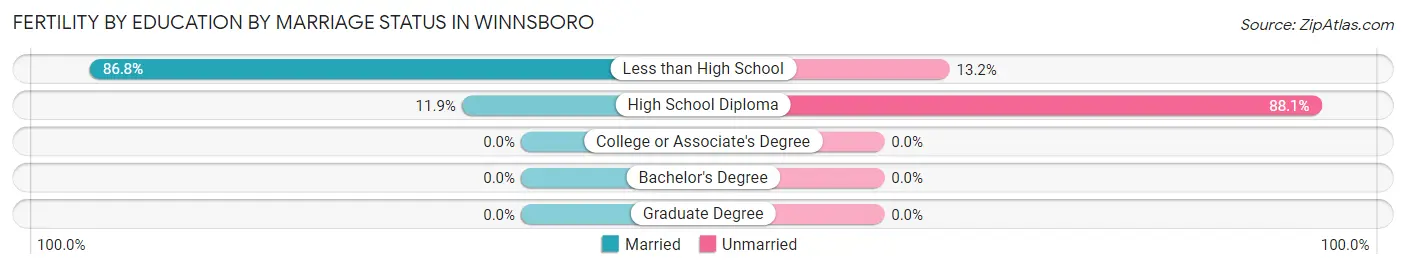
Fertility by Education by Marriage Status in Winnsboro
57.3% of women with births in Winnsboro are unmarried. Women with the educational attainment of less than high school are most likely to be married with 86.8% of them married at childbirth, while women with the educational attainment of high school diploma are least likely to be married with 88.1% of them unmarried at childbirth.
| Educational Attainment | Married | Unmarried |
| Less than High School | 66 (86.8%) | 10 (13.2%) |
| High School Diploma | 13 (11.9%) | 96 (88.1%) |
| College or Associate's Degree | 0 (0.0%) | 0 (0.0%) |
| Bachelor's Degree | 0 (0.0%) | 0 (0.0%) |
| Graduate Degree | 0 (0.0%) | 0 (0.0%) |
| Total | 79 (42.7%) | 106 (57.3%) |
Employment Characteristics in Winnsboro
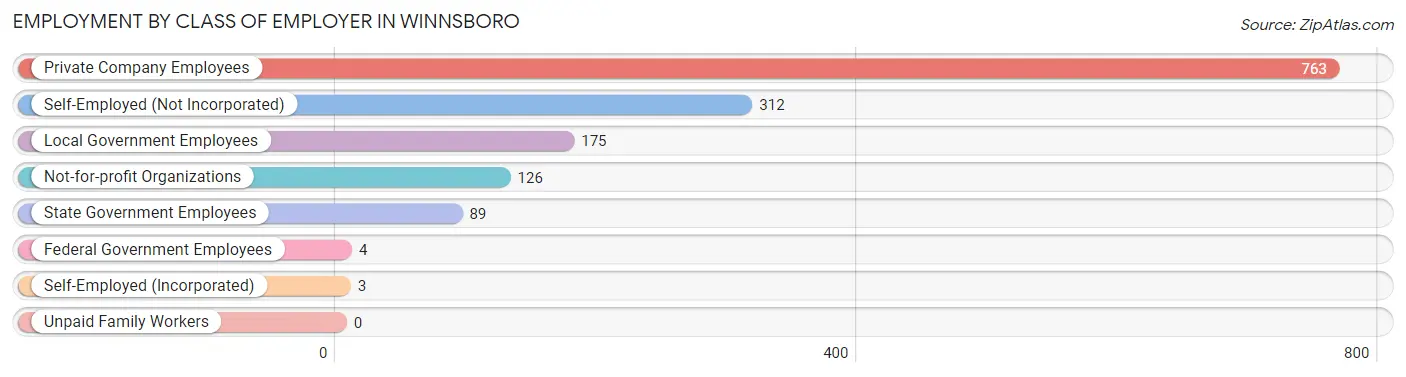
Employment by Class of Employer in Winnsboro
Among the 1,472 employed individuals in Winnsboro, private company employees (763 | 51.8%), self-employed (not incorporated) (312 | 21.2%), and local government employees (175 | 11.9%) make up the most common classes of employment.
| Employer Class | # Employees | % Employees |
| Private Company Employees | 763 | 51.8% |
| Self-Employed (Incorporated) | 3 | 0.2% |
| Self-Employed (Not Incorporated) | 312 | 21.2% |
| Not-for-profit Organizations | 126 | 8.6% |
| Local Government Employees | 175 | 11.9% |
| State Government Employees | 89 | 6.0% |
| Federal Government Employees | 4 | 0.3% |
| Unpaid Family Workers | 0 | 0.0% |
| Total | 1,472 | 100.0% |
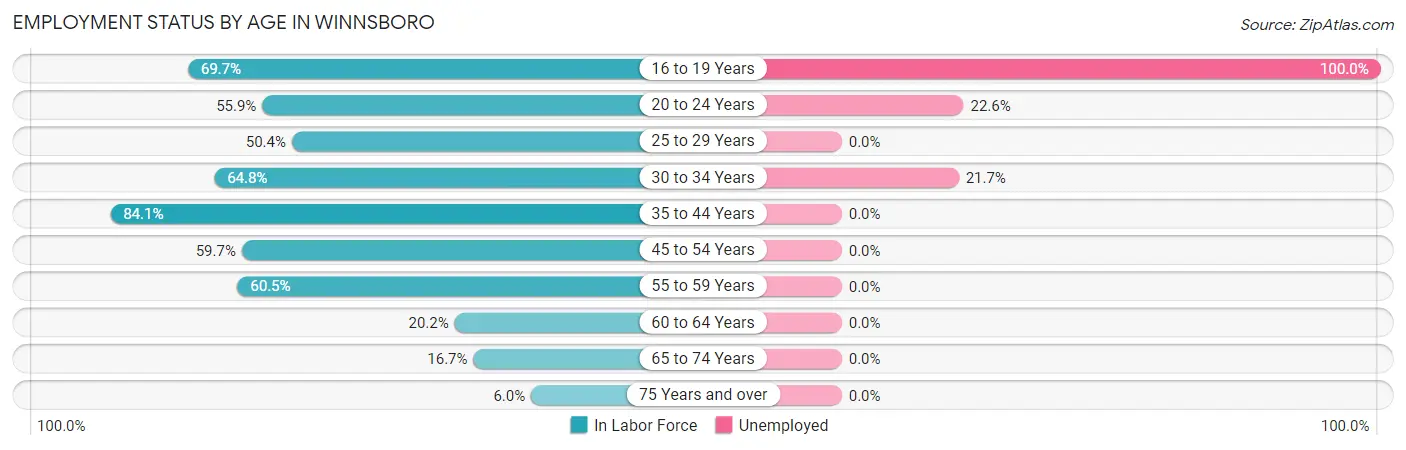
Employment Status by Age in Winnsboro
According to the labor force statistics for Winnsboro, out of the total population over 16 years of age (3,301), 52.3% or 1,726 individuals are in the labor force, with 11.9% or 205 of them unemployed. The age group with the highest labor force participation rate is 35 to 44 years, with 84.1% or 598 individuals in the labor force. Within the labor force, the 16 to 19 years age range has the highest percentage of unemployed individuals, with 100.0% or 106 of them being unemployed.
| Age Bracket | In Labor Force | Unemployed |
| 16 to 19 Years | 106 (69.7%) | 106 (100.0%) |
| 20 to 24 Years | 199 (55.9%) | 45 (22.6%) |
| 25 to 29 Years | 122 (50.4%) | 0 (0.0%) |
| 30 to 34 Years | 254 (64.8%) | 55 (21.7%) |
| 35 to 44 Years | 598 (84.1%) | 0 (0.0%) |
| 45 to 54 Years | 166 (59.7%) | 0 (0.0%) |
| 55 to 59 Years | 133 (60.5%) | 0 (0.0%) |
| 60 to 64 Years | 52 (20.2%) | 0 (0.0%) |
| 65 to 74 Years | 88 (16.7%) | 0 (0.0%) |
| 75 Years and over | 10 (6.0%) | 0 (0.0%) |
| Total | 1,726 (52.3%) | 205 (11.9%) |
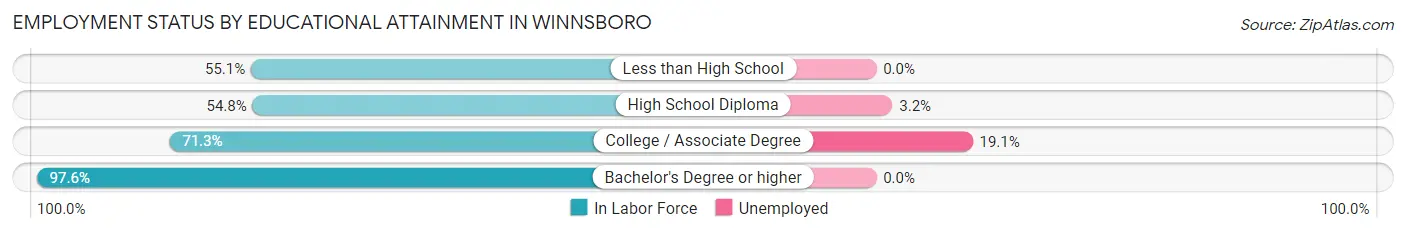
Employment Status by Educational Attainment in Winnsboro
According to labor force statistics for Winnsboro, 63.1% of individuals (1,326) out of the total population between 25 and 64 years of age (2,101) are in the labor force, with 4.2% or 56 of them being unemployed. The group with the highest labor force participation rate are those with the educational attainment of bachelor's degree or higher, with 97.6% or 282 individuals in the labor force. Within the labor force, individuals with college / associate degree education have the highest percentage of unemployment, with 19.1% or 40 of them being unemployed.
| Educational Attainment | In Labor Force | Unemployed |
| Less than High School | 363 (55.1%) | 0 (0.0%) |
| High School Diploma | 471 (54.8%) | 28 (3.2%) |
| College / Associate Degree | 209 (71.3%) | 56 (19.1%) |
| Bachelor's Degree or higher | 282 (97.6%) | 0 (0.0%) |
| Total | 1,326 (63.1%) | 88 (4.2%) |
Employment Occupations by Sex in Winnsboro
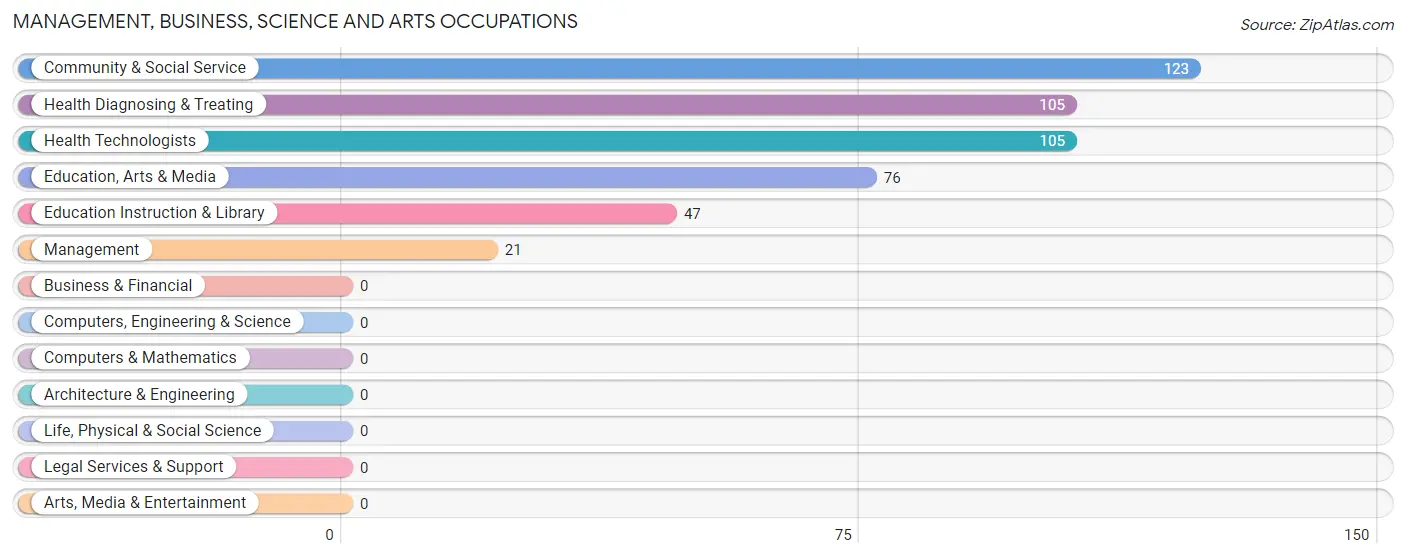
Management, Business, Science and Arts Occupations
The most common Management, Business, Science and Arts occupations in Winnsboro are Community & Social Service (123 | 8.1%), Health Diagnosing & Treating (105 | 6.9%), Health Technologists (105 | 6.9%), Education, Arts & Media (76 | 5.0%), and Education Instruction & Library (47 | 3.1%).
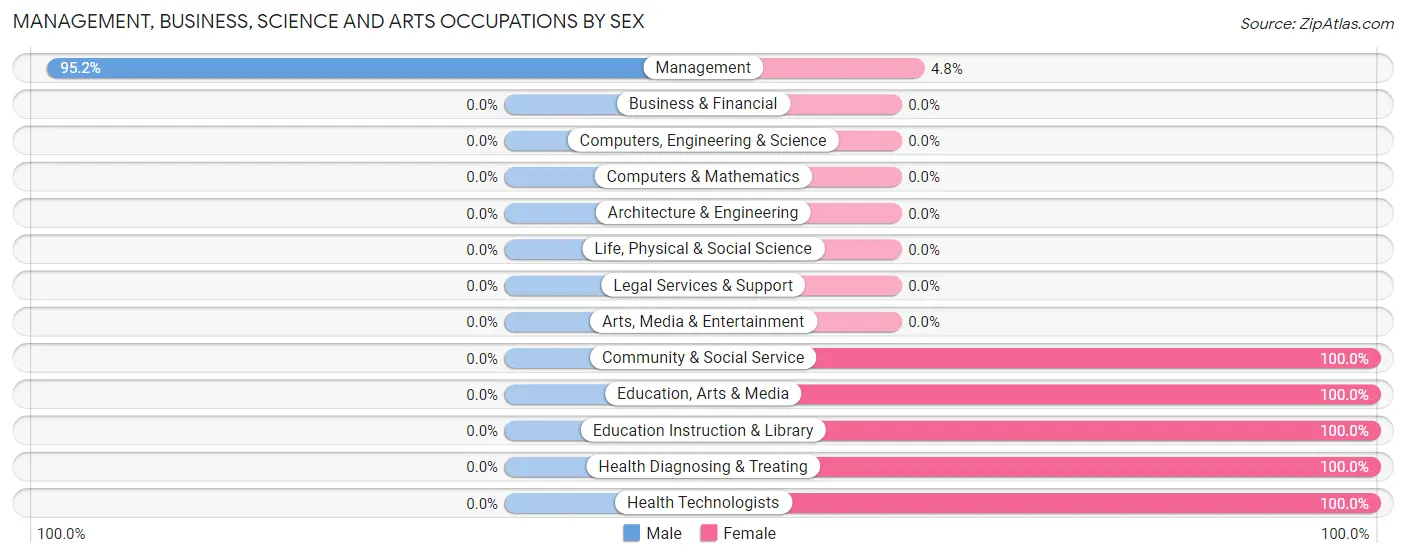
Management, Business, Science and Arts Occupations by Sex
| Occupation | Male | Female |
| Management | 20 (95.2%) | 1 (4.8%) |
| Business & Financial | 0 (0.0%) | 0 (0.0%) |
| Computers, Engineering & Science | 0 (0.0%) | 0 (0.0%) |
| Computers & Mathematics | 0 (0.0%) | 0 (0.0%) |
| Architecture & Engineering | 0 (0.0%) | 0 (0.0%) |
| Life, Physical & Social Science | 0 (0.0%) | 0 (0.0%) |
| Community & Social Service | 0 (0.0%) | 123 (100.0%) |
| Education, Arts & Media | 0 (0.0%) | 76 (100.0%) |
| Legal Services & Support | 0 (0.0%) | 0 (0.0%) |
| Education Instruction & Library | 0 (0.0%) | 47 (100.0%) |
| Arts, Media & Entertainment | 0 (0.0%) | 0 (0.0%) |
| Health Diagnosing & Treating | 0 (0.0%) | 105 (100.0%) |
| Health Technologists | 0 (0.0%) | 105 (100.0%) |
| Total (Category) | 20 (8.0%) | 229 (92.0%) |
| Total (Overall) | 800 (52.6%) | 722 (47.4%) |
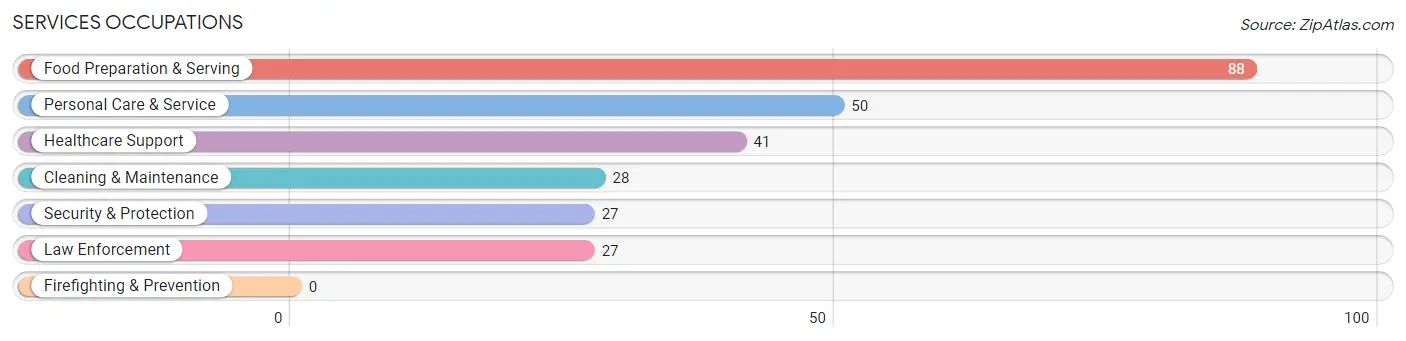
Services Occupations
The most common Services occupations in Winnsboro are Food Preparation & Serving (88 | 5.8%), Personal Care & Service (50 | 3.3%), Healthcare Support (41 | 2.7%), Cleaning & Maintenance (28 | 1.8%), and Security & Protection (27 | 1.8%).
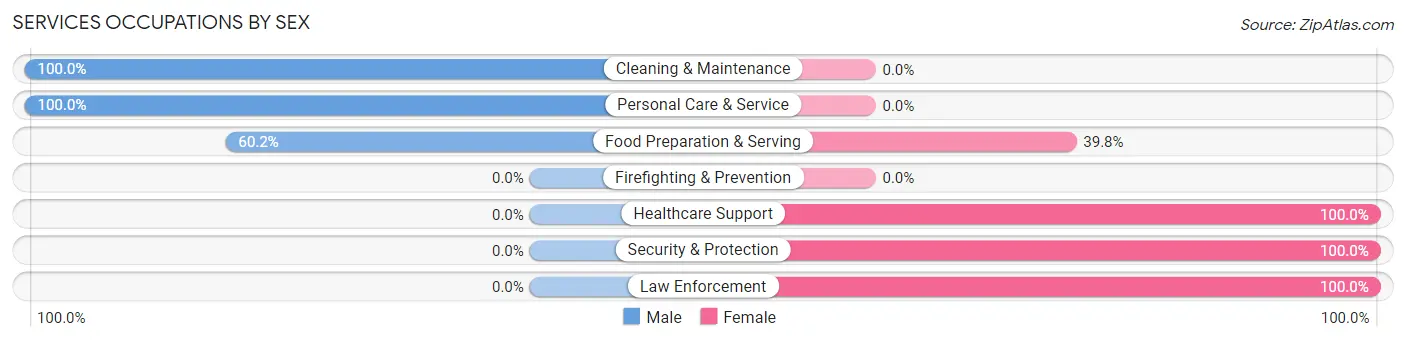
Services Occupations by Sex
Within the Services occupations in Winnsboro, the most male-oriented occupations are Cleaning & Maintenance (100.0%), Personal Care & Service (100.0%), and Food Preparation & Serving (60.2%), while the most female-oriented occupations are Healthcare Support (100.0%), Security & Protection (100.0%), and Law Enforcement (100.0%).
| Occupation | Male | Female |
| Healthcare Support | 0 (0.0%) | 41 (100.0%) |
| Security & Protection | 0 (0.0%) | 27 (100.0%) |
| Firefighting & Prevention | 0 (0.0%) | 0 (0.0%) |
| Law Enforcement | 0 (0.0%) | 27 (100.0%) |
| Food Preparation & Serving | 53 (60.2%) | 35 (39.8%) |
| Cleaning & Maintenance | 28 (100.0%) | 0 (0.0%) |
| Personal Care & Service | 50 (100.0%) | 0 (0.0%) |
| Total (Category) | 131 (56.0%) | 103 (44.0%) |
| Total (Overall) | 800 (52.6%) | 722 (47.4%) |
Sales and Office Occupations
The most common Sales and Office occupations in Winnsboro are Office & Administration (294 | 19.3%), and Sales & Related (47 | 3.1%).
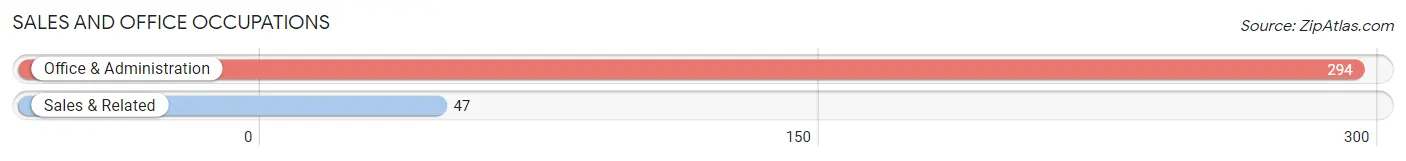
Sales and Office Occupations by Sex
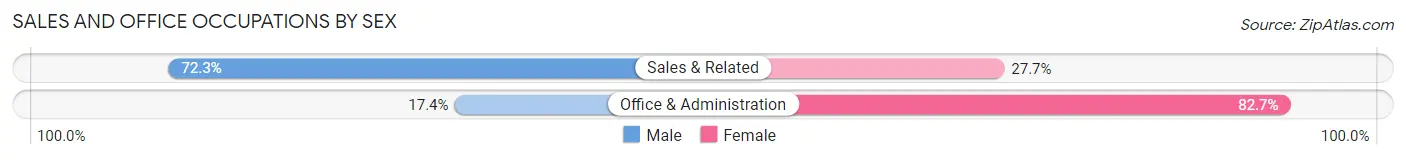
| Occupation | Male | Female |
| Sales & Related | 34 (72.3%) | 13 (27.7%) |
| Office & Administration | 51 (17.3%) | 243 (82.7%) |
| Total (Category) | 85 (24.9%) | 256 (75.1%) |
| Total (Overall) | 800 (52.6%) | 722 (47.4%) |
Natural Resources, Construction and Maintenance Occupations
The most common Natural Resources, Construction and Maintenance occupations in Winnsboro are Construction & Extraction (162 | 10.6%), Installation, Maintenance & Repair (143 | 9.4%), and Farming, Fishing & Forestry (92 | 6.0%).
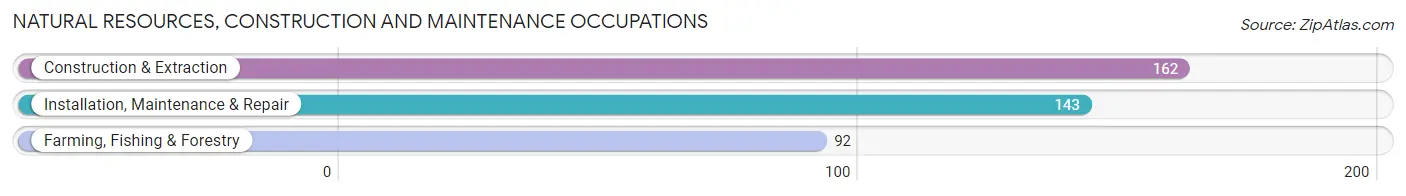
Natural Resources, Construction and Maintenance Occupations by Sex

| Occupation | Male | Female |
| Farming, Fishing & Forestry | 19 (20.6%) | 73 (79.3%) |
| Construction & Extraction | 162 (100.0%) | 0 (0.0%) |
| Installation, Maintenance & Repair | 143 (100.0%) | 0 (0.0%) |
| Total (Category) | 324 (81.6%) | 73 (18.4%) |
| Total (Overall) | 800 (52.6%) | 722 (47.4%) |
Production, Transportation and Moving Occupations
The most common Production, Transportation and Moving occupations in Winnsboro are Transportation (141 | 9.3%), Material Moving (125 | 8.2%), and Production (35 | 2.3%).
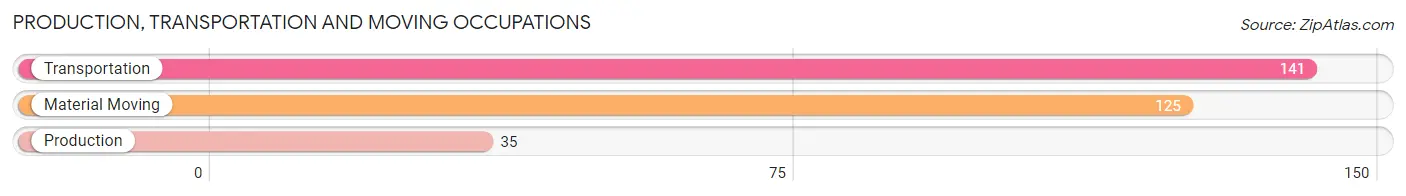
Production, Transportation and Moving Occupations by Sex
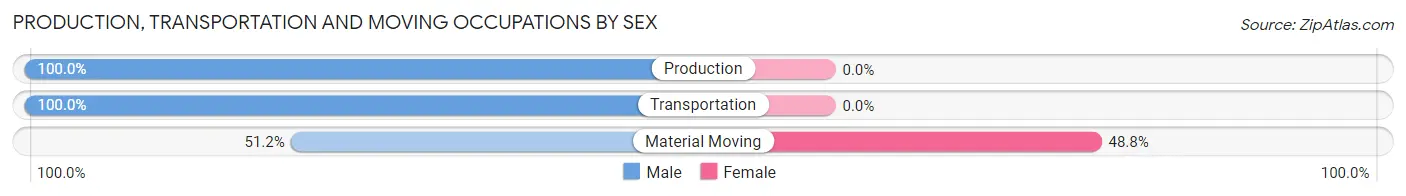
| Occupation | Male | Female |
| Production | 35 (100.0%) | 0 (0.0%) |
| Transportation | 141 (100.0%) | 0 (0.0%) |
| Material Moving | 64 (51.2%) | 61 (48.8%) |
| Total (Category) | 240 (79.7%) | 61 (20.3%) |
| Total (Overall) | 800 (52.6%) | 722 (47.4%) |
Employment Industries by Sex in Winnsboro
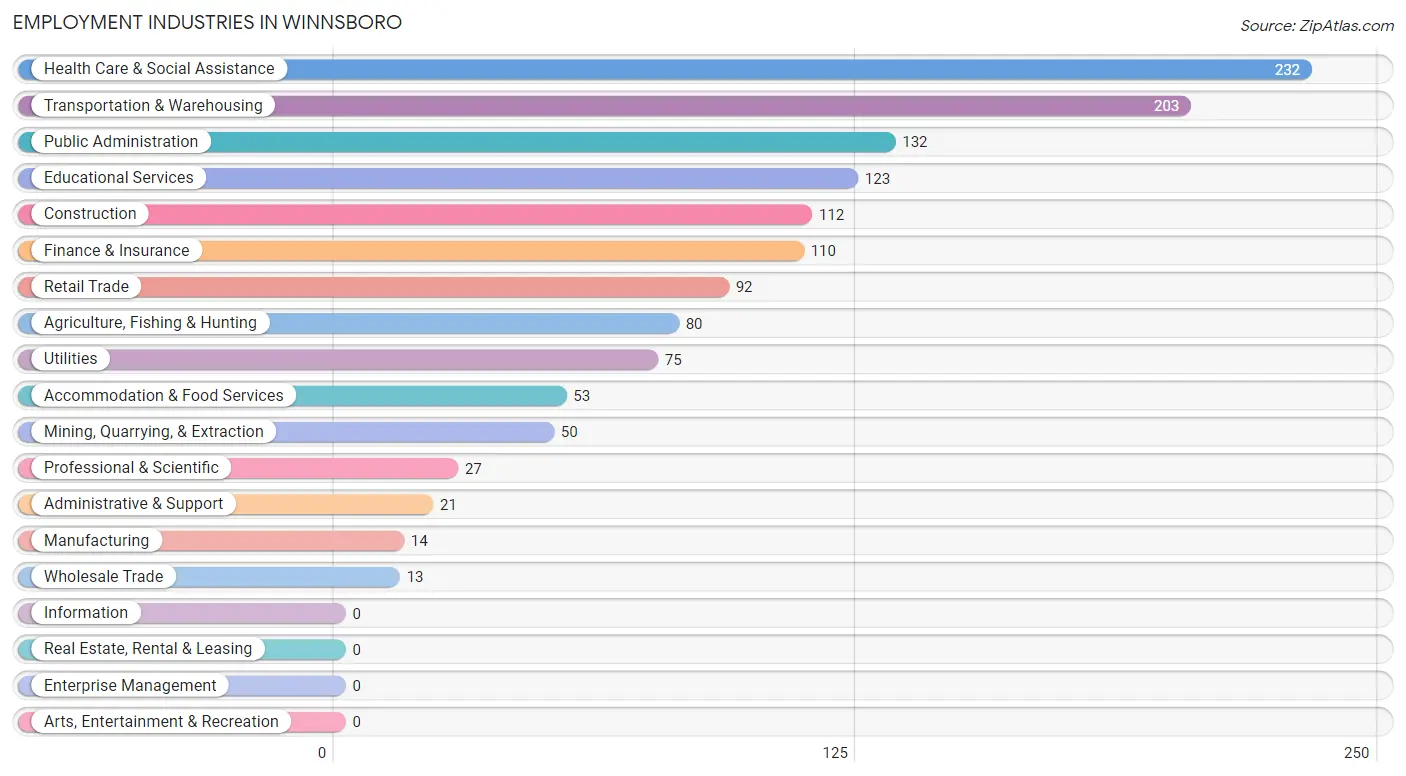
Employment Industries in Winnsboro
The major employment industries in Winnsboro include Health Care & Social Assistance (232 | 15.2%), Transportation & Warehousing (203 | 13.3%), Public Administration (132 | 8.7%), Educational Services (123 | 8.1%), and Construction (112 | 7.4%).
Employment Industries by Sex in Winnsboro
The Winnsboro industries that see more men than women are Mining, Quarrying, & Extraction (100.0%), Construction (100.0%), and Manufacturing (100.0%), whereas the industries that tend to have a higher number of women are Finance & Insurance (100.0%), Professional & Scientific (100.0%), and Educational Services (100.0%).
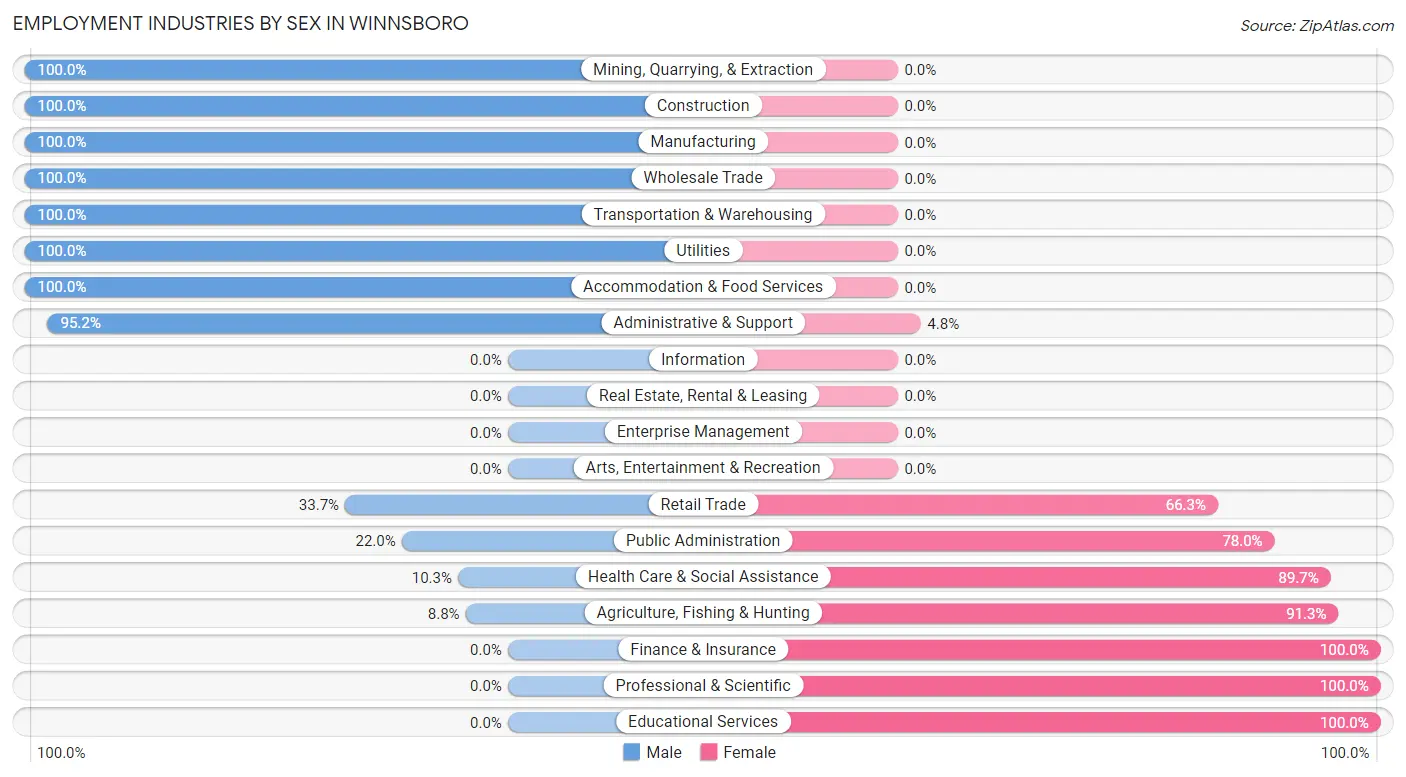
| Industry | Male | Female |
| Agriculture, Fishing & Hunting | 7 (8.7%) | 73 (91.2%) |
| Mining, Quarrying, & Extraction | 50 (100.0%) | 0 (0.0%) |
| Construction | 112 (100.0%) | 0 (0.0%) |
| Manufacturing | 14 (100.0%) | 0 (0.0%) |
| Wholesale Trade | 13 (100.0%) | 0 (0.0%) |
| Retail Trade | 31 (33.7%) | 61 (66.3%) |
| Transportation & Warehousing | 203 (100.0%) | 0 (0.0%) |
| Utilities | 75 (100.0%) | 0 (0.0%) |
| Information | 0 (0.0%) | 0 (0.0%) |
| Finance & Insurance | 0 (0.0%) | 110 (100.0%) |
| Real Estate, Rental & Leasing | 0 (0.0%) | 0 (0.0%) |
| Professional & Scientific | 0 (0.0%) | 27 (100.0%) |
| Enterprise Management | 0 (0.0%) | 0 (0.0%) |
| Administrative & Support | 20 (95.2%) | 1 (4.8%) |
| Educational Services | 0 (0.0%) | 123 (100.0%) |
| Health Care & Social Assistance | 24 (10.3%) | 208 (89.7%) |
| Arts, Entertainment & Recreation | 0 (0.0%) | 0 (0.0%) |
| Accommodation & Food Services | 53 (100.0%) | 0 (0.0%) |
| Public Administration | 29 (22.0%) | 103 (78.0%) |
| Total | 800 (52.6%) | 722 (47.4%) |
Education in Winnsboro
School Enrollment in Winnsboro
The most common levels of schooling among the 1,554 students in Winnsboro are elementary school (569 | 36.6%), college / undergraduate (337 | 21.7%), and middle school (316 | 20.3%).
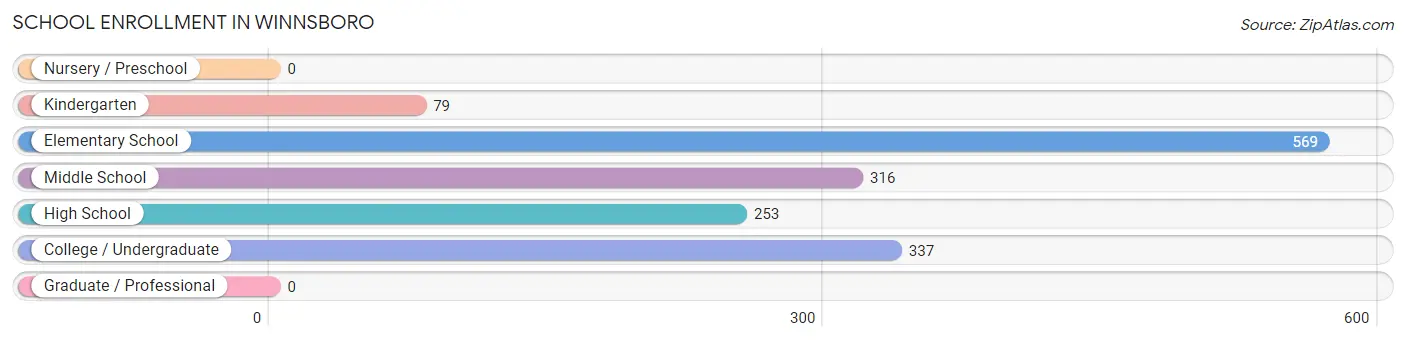
| School Level | # Students | % Students |
| Nursery / Preschool | 0 | 0.0% |
| Kindergarten | 79 | 5.1% |
| Elementary School | 569 | 36.6% |
| Middle School | 316 | 20.3% |
| High School | 253 | 16.3% |
| College / Undergraduate | 337 | 21.7% |
| Graduate / Professional | 0 | 0.0% |
| Total | 1,554 | 100.0% |
School Enrollment by Age by Funding Source in Winnsboro
Out of a total of 1,554 students who are enrolled in schools in Winnsboro, 54 (3.5%) attend a private institution, while the remaining 1,500 (96.5%) are enrolled in public schools. The age group of 25 to 34 year olds has the highest likelihood of being enrolled in private schools, with 43 (31.6% in the age bracket) enrolled. Conversely, the age group of 5 to 9 year old has the lowest likelihood of being enrolled in a private school, with 530 (100.0% in the age bracket) attending a public institution.
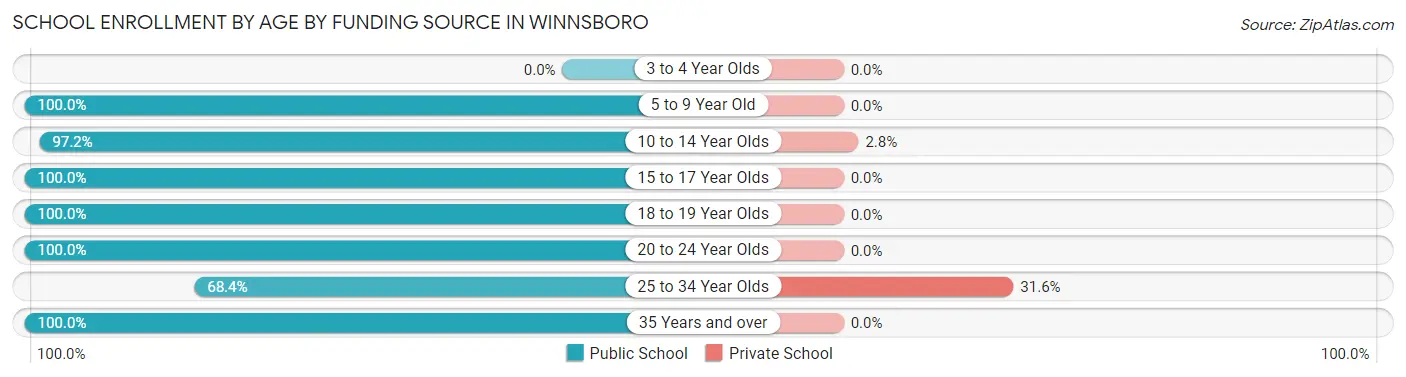
| Age Bracket | Public School | Private School |
| 3 to 4 Year Olds | 0 (0.0%) | 0 (0.0%) |
| 5 to 9 Year Old | 530 (100.0%) | 0 (0.0%) |
| 10 to 14 Year Olds | 422 (97.2%) | 12 (2.8%) |
| 15 to 17 Year Olds | 183 (100.0%) | 0 (0.0%) |
| 18 to 19 Year Olds | 70 (100.0%) | 0 (0.0%) |
| 20 to 24 Year Olds | 193 (100.0%) | 0 (0.0%) |
| 25 to 34 Year Olds | 93 (68.4%) | 43 (31.6%) |
| 35 Years and over | 8 (100.0%) | 0 (0.0%) |
| Total | 1,500 (96.5%) | 54 (3.5%) |
Educational Attainment by Field of Study in Winnsboro
Science & technology (144 | 39.7%), psychology (76 | 20.9%), social sciences (50 | 13.8%), arts & humanities (33 | 9.1%), and education (30 | 8.3%) are the most common fields of study among 363 individuals in Winnsboro who have obtained a bachelor's degree or higher.
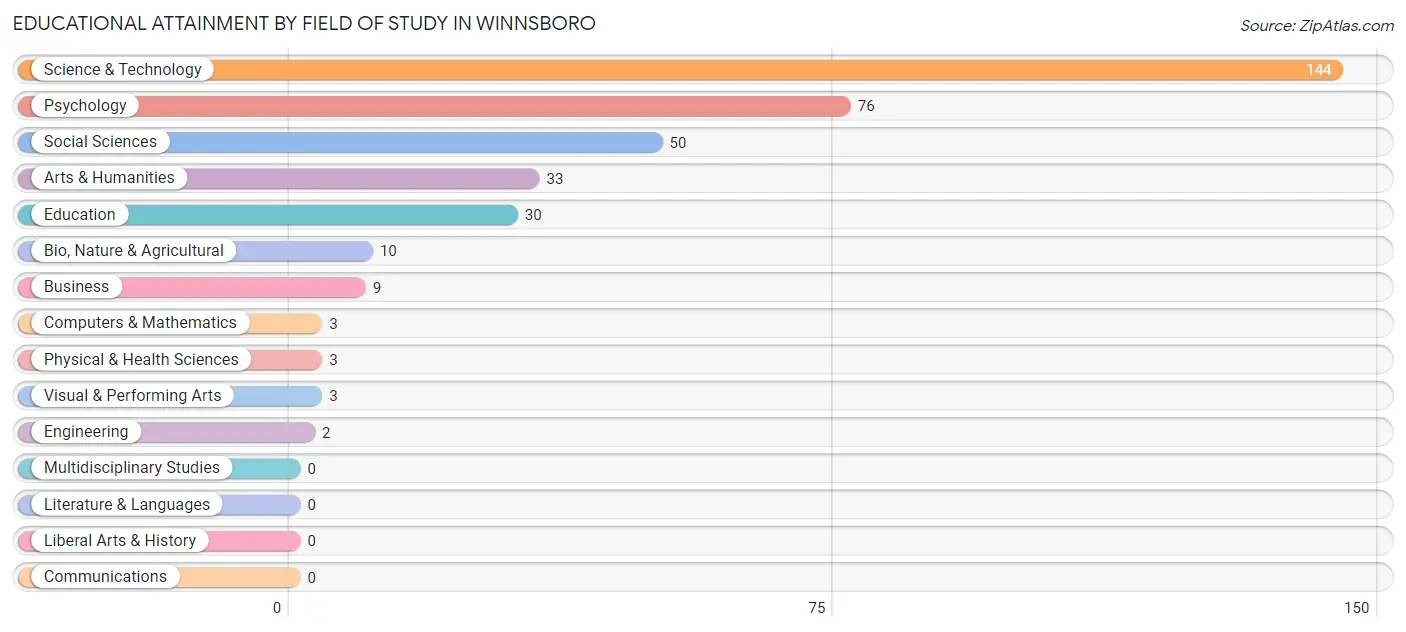
| Field of Study | # Graduates | % Graduates |
| Computers & Mathematics | 3 | 0.8% |
| Bio, Nature & Agricultural | 10 | 2.8% |
| Physical & Health Sciences | 3 | 0.8% |
| Psychology | 76 | 20.9% |
| Social Sciences | 50 | 13.8% |
| Engineering | 2 | 0.5% |
| Multidisciplinary Studies | 0 | 0.0% |
| Science & Technology | 144 | 39.7% |
| Business | 9 | 2.5% |
| Education | 30 | 8.3% |
| Literature & Languages | 0 | 0.0% |
| Liberal Arts & History | 0 | 0.0% |
| Visual & Performing Arts | 3 | 0.8% |
| Communications | 0 | 0.0% |
| Arts & Humanities | 33 | 9.1% |
| Total | 363 | 100.0% |
Transportation & Commute in Winnsboro
Vehicle Availability by Sex in Winnsboro
The most prevalent vehicle ownership categories in Winnsboro are males with 2 vehicles (289, accounting for 37.8%) and females with 2 vehicles (233, making up 41.5%).
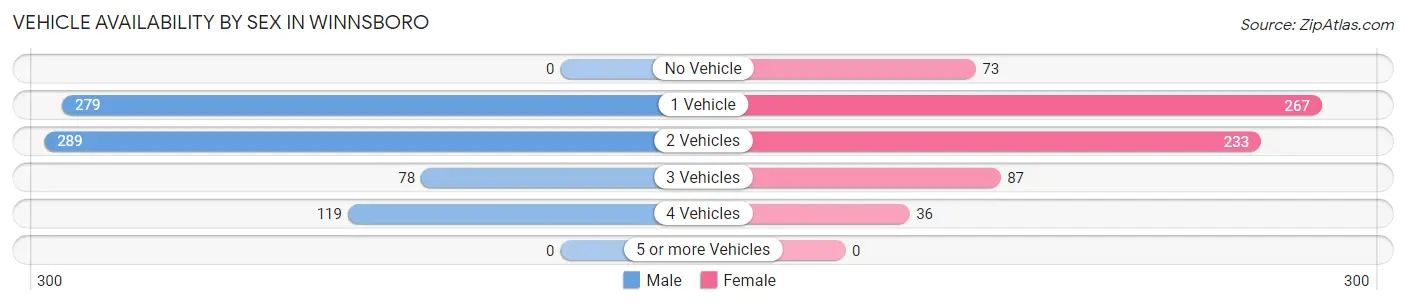
| Vehicles Available | Male | Female |
| No Vehicle | 0 (0.0%) | 73 (10.5%) |
| 1 Vehicle | 279 (36.5%) | 267 (38.4%) |
| 2 Vehicles | 289 (37.8%) | 233 (33.5%) |
| 3 Vehicles | 78 (10.2%) | 87 (12.5%) |
| 4 Vehicles | 119 (15.6%) | 36 (5.2%) |
| 5 or more Vehicles | 0 (0.0%) | 0 (0.0%) |
| Total | 765 (100.0%) | 696 (100.0%) |
Commute Time in Winnsboro
The most frequently occuring commute durations in Winnsboro are 15 to 19 minutes (421 commuters, 32.0%), 5 to 9 minutes (327 commuters, 24.9%), and 10 to 14 minutes (136 commuters, 10.3%).
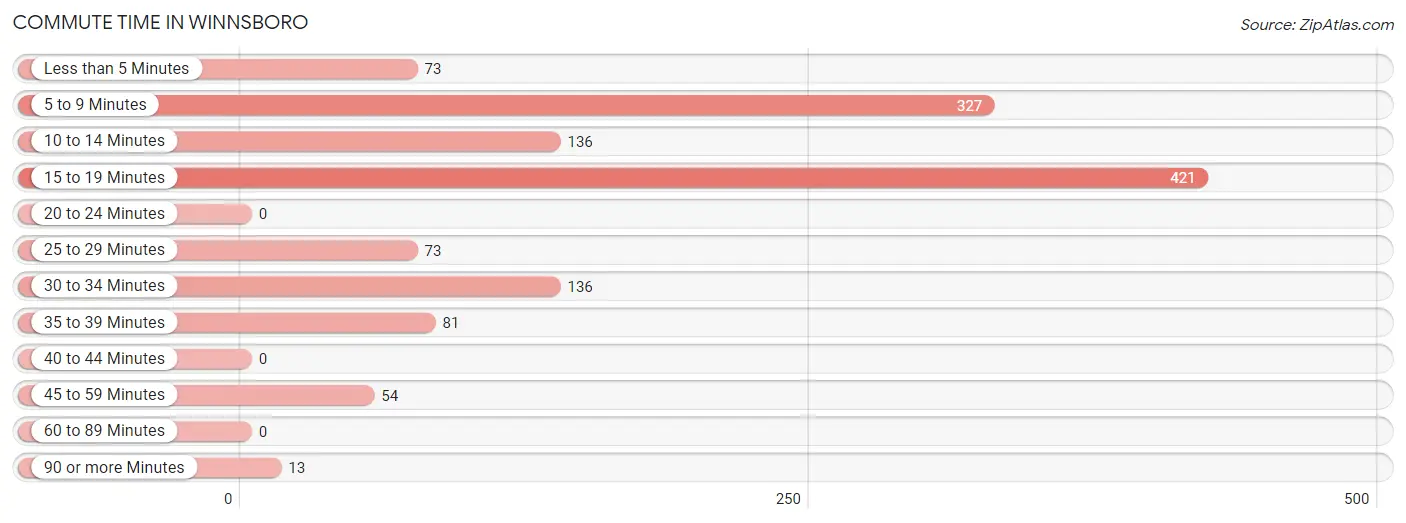
| Commute Time | # Commuters | % Commuters |
| Less than 5 Minutes | 73 | 5.6% |
| 5 to 9 Minutes | 327 | 24.9% |
| 10 to 14 Minutes | 136 | 10.3% |
| 15 to 19 Minutes | 421 | 32.0% |
| 20 to 24 Minutes | 0 | 0.0% |
| 25 to 29 Minutes | 73 | 5.6% |
| 30 to 34 Minutes | 136 | 10.3% |
| 35 to 39 Minutes | 81 | 6.2% |
| 40 to 44 Minutes | 0 | 0.0% |
| 45 to 59 Minutes | 54 | 4.1% |
| 60 to 89 Minutes | 0 | 0.0% |
| 90 or more Minutes | 13 | 1.0% |
Commute Time by Sex in Winnsboro
The most common commute times in Winnsboro are 15 to 19 minutes (259 commuters, 35.7%) for males and 15 to 19 minutes (162 commuters, 27.6%) for females.
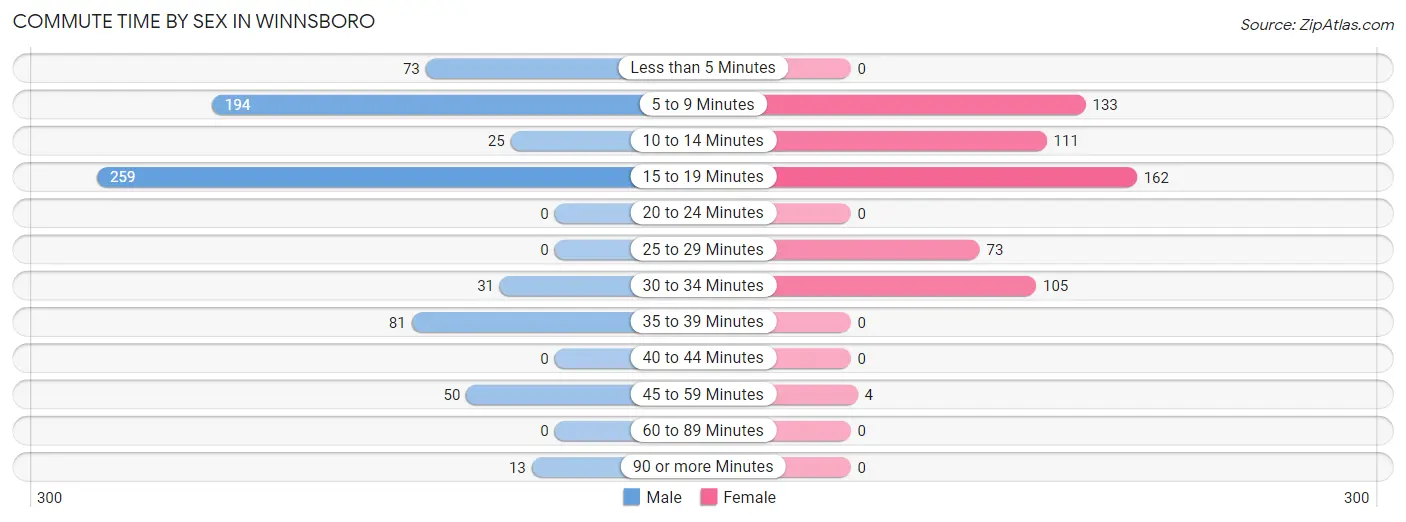
| Commute Time | Male | Female |
| Less than 5 Minutes | 73 (10.1%) | 0 (0.0%) |
| 5 to 9 Minutes | 194 (26.7%) | 133 (22.6%) |
| 10 to 14 Minutes | 25 (3.4%) | 111 (18.9%) |
| 15 to 19 Minutes | 259 (35.7%) | 162 (27.6%) |
| 20 to 24 Minutes | 0 (0.0%) | 0 (0.0%) |
| 25 to 29 Minutes | 0 (0.0%) | 73 (12.4%) |
| 30 to 34 Minutes | 31 (4.3%) | 105 (17.9%) |
| 35 to 39 Minutes | 81 (11.2%) | 0 (0.0%) |
| 40 to 44 Minutes | 0 (0.0%) | 0 (0.0%) |
| 45 to 59 Minutes | 50 (6.9%) | 4 (0.7%) |
| 60 to 89 Minutes | 0 (0.0%) | 0 (0.0%) |
| 90 or more Minutes | 13 (1.8%) | 0 (0.0%) |
Time of Departure to Work by Sex in Winnsboro
The most frequent times of departure to work in Winnsboro are 8:00 AM to 8:29 AM (246, 33.9%) for males and 7:00 AM to 7:29 AM (182, 30.9%) for females.
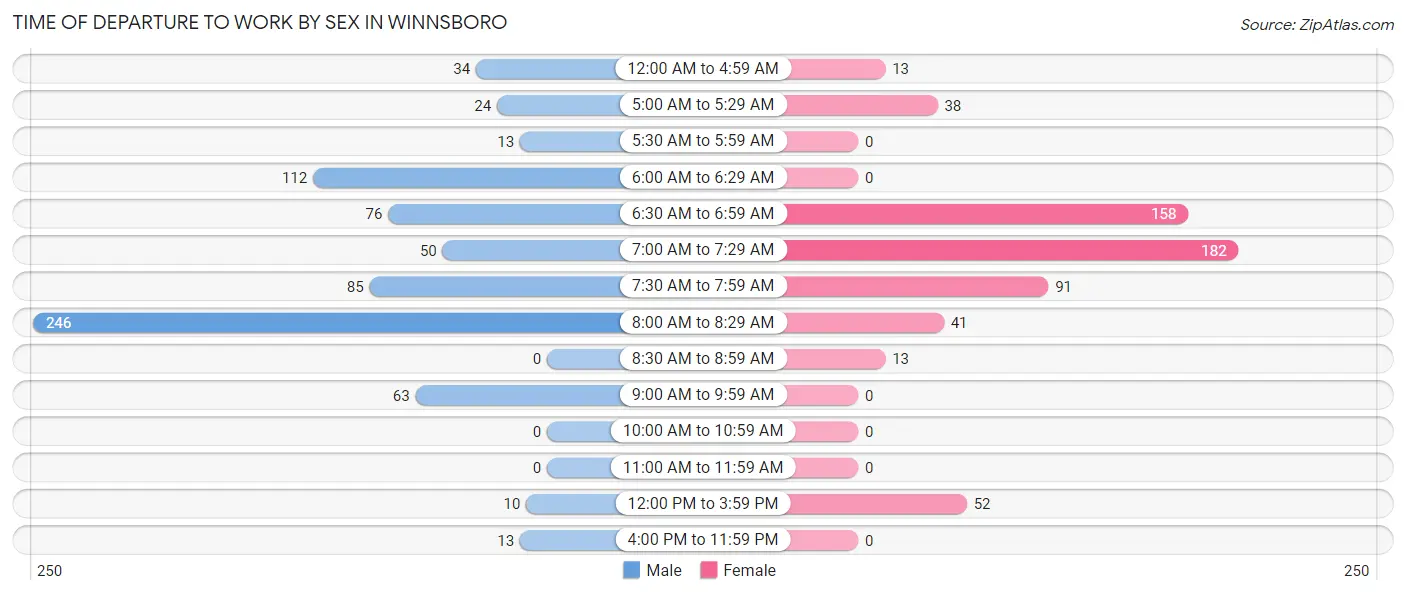
| Time of Departure | Male | Female |
| 12:00 AM to 4:59 AM | 34 (4.7%) | 13 (2.2%) |
| 5:00 AM to 5:29 AM | 24 (3.3%) | 38 (6.5%) |
| 5:30 AM to 5:59 AM | 13 (1.8%) | 0 (0.0%) |
| 6:00 AM to 6:29 AM | 112 (15.4%) | 0 (0.0%) |
| 6:30 AM to 6:59 AM | 76 (10.5%) | 158 (26.9%) |
| 7:00 AM to 7:29 AM | 50 (6.9%) | 182 (30.9%) |
| 7:30 AM to 7:59 AM | 85 (11.7%) | 91 (15.5%) |
| 8:00 AM to 8:29 AM | 246 (33.9%) | 41 (7.0%) |
| 8:30 AM to 8:59 AM | 0 (0.0%) | 13 (2.2%) |
| 9:00 AM to 9:59 AM | 63 (8.7%) | 0 (0.0%) |
| 10:00 AM to 10:59 AM | 0 (0.0%) | 0 (0.0%) |
| 11:00 AM to 11:59 AM | 0 (0.0%) | 0 (0.0%) |
| 12:00 PM to 3:59 PM | 10 (1.4%) | 52 (8.8%) |
| 4:00 PM to 11:59 PM | 13 (1.8%) | 0 (0.0%) |
| Total | 726 (100.0%) | 588 (100.0%) |
Housing Occupancy in Winnsboro
Occupancy by Ownership in Winnsboro
Of the total 1,517 dwellings in Winnsboro, owner-occupied units account for 800 (52.7%), while renter-occupied units make up 717 (47.3%).
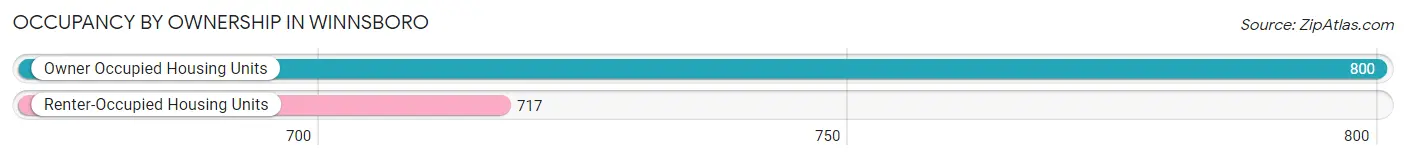
| Occupancy | # Housing Units | % Housing Units |
| Owner Occupied Housing Units | 800 | 52.7% |
| Renter-Occupied Housing Units | 717 | 47.3% |
| Total Occupied Housing Units | 1,517 | 100.0% |
Occupancy by Household Size in Winnsboro
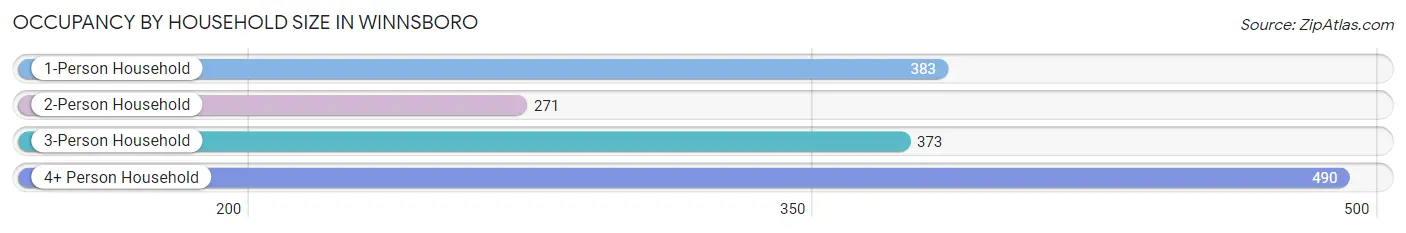
| Household Size | # Housing Units | % Housing Units |
| 1-Person Household | 383 | 25.3% |
| 2-Person Household | 271 | 17.9% |
| 3-Person Household | 373 | 24.6% |
| 4+ Person Household | 490 | 32.3% |
| Total Housing Units | 1,517 | 100.0% |
Occupancy by Ownership by Household Size in Winnsboro
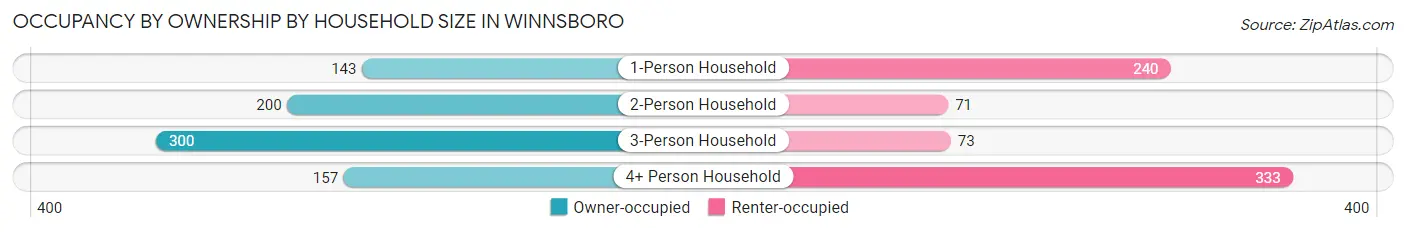
| Household Size | Owner-occupied | Renter-occupied |
| 1-Person Household | 143 (37.3%) | 240 (62.7%) |
| 2-Person Household | 200 (73.8%) | 71 (26.2%) |
| 3-Person Household | 300 (80.4%) | 73 (19.6%) |
| 4+ Person Household | 157 (32.0%) | 333 (68.0%) |
| Total Housing Units | 800 (52.7%) | 717 (47.3%) |
Occupancy by Educational Attainment in Winnsboro
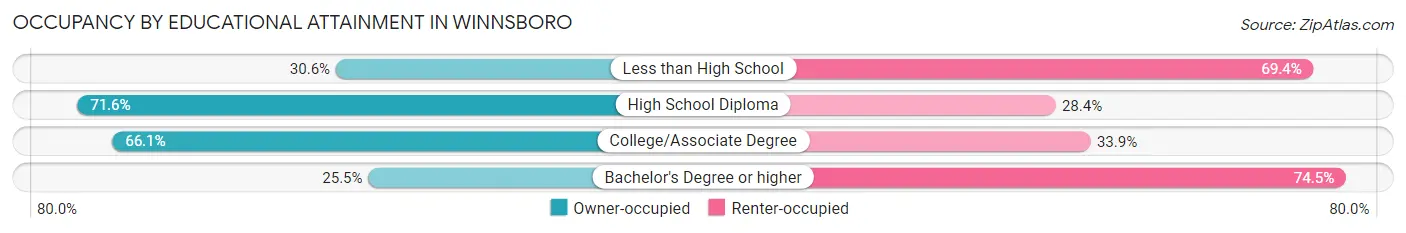
| Household Size | Owner-occupied | Renter-occupied |
| Less than High School | 128 (30.6%) | 290 (69.4%) |
| High School Diploma | 389 (71.6%) | 154 (28.4%) |
| College/Associate Degree | 230 (66.1%) | 118 (33.9%) |
| Bachelor's Degree or higher | 53 (25.5%) | 155 (74.5%) |
Occupancy by Age of Householder in Winnsboro
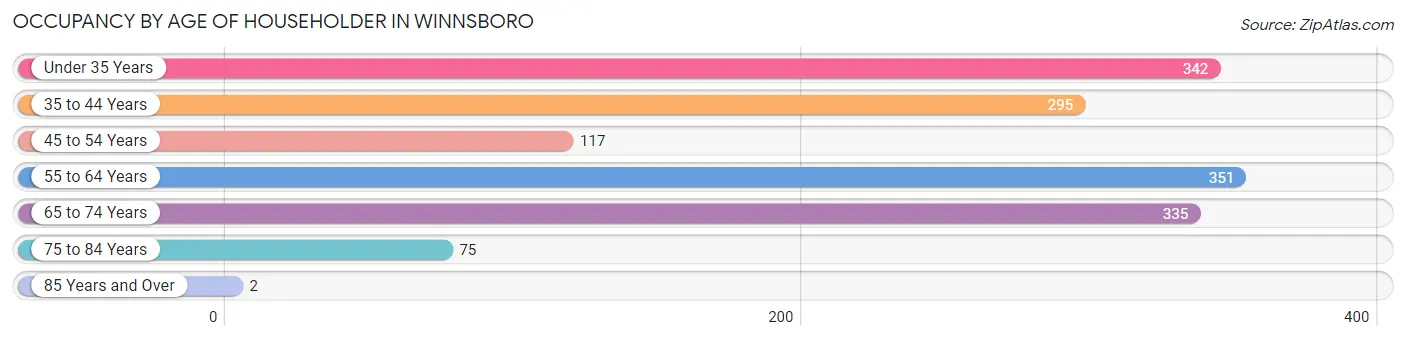
| Age Bracket | # Households | % Households |
| Under 35 Years | 342 | 22.5% |
| 35 to 44 Years | 295 | 19.5% |
| 45 to 54 Years | 117 | 7.7% |
| 55 to 64 Years | 351 | 23.1% |
| 65 to 74 Years | 335 | 22.1% |
| 75 to 84 Years | 75 | 4.9% |
| 85 Years and Over | 2 | 0.1% |
| Total | 1,517 | 100.0% |
Housing Finances in Winnsboro
Median Income by Occupancy in Winnsboro
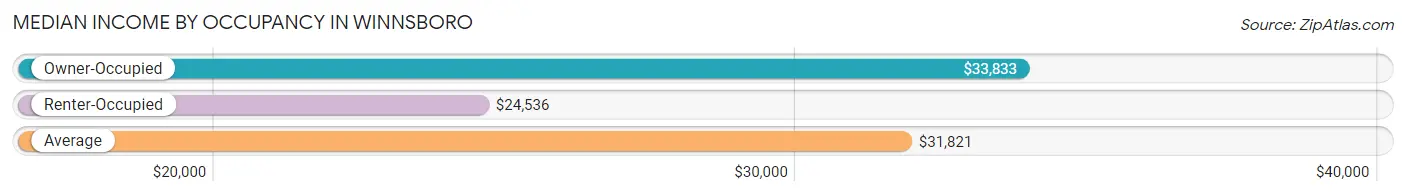
| Occupancy Type | # Households | Median Income |
| Owner-Occupied | 800 (52.7%) | $33,833 |
| Renter-Occupied | 717 (47.3%) | $24,536 |
| Average | 1,517 (100.0%) | $31,821 |
Occupancy by Householder Income Bracket in Winnsboro
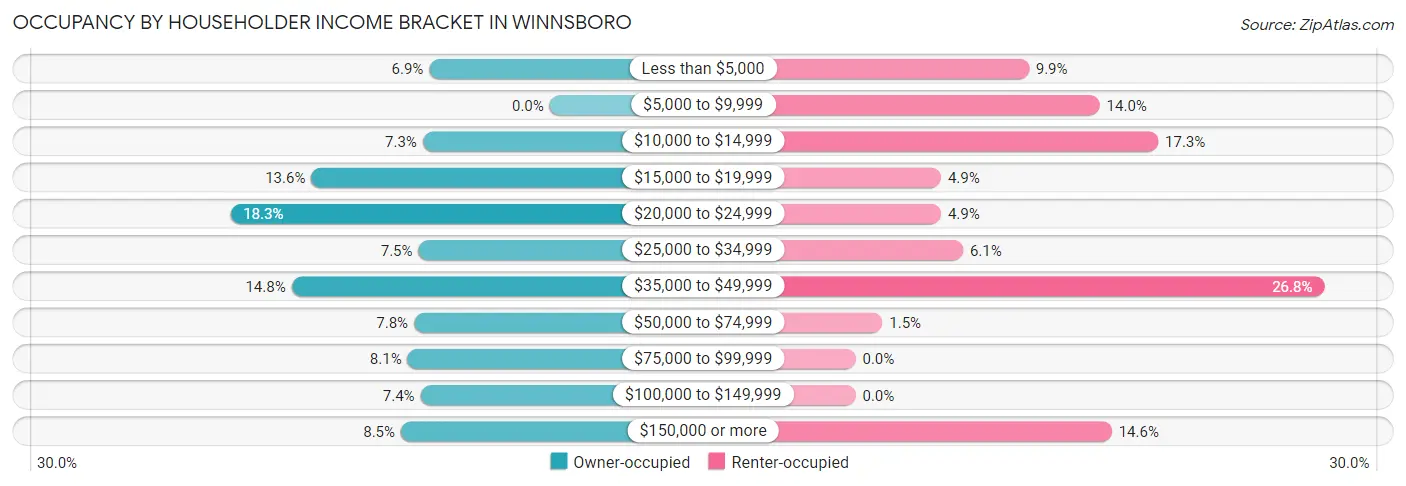
| Income Bracket | Owner-occupied | Renter-occupied |
| Less than $5,000 | 55 (6.9%) | 71 (9.9%) |
| $5,000 to $9,999 | 0 (0.0%) | 100 (14.0%) |
| $10,000 to $14,999 | 58 (7.2%) | 124 (17.3%) |
| $15,000 to $19,999 | 109 (13.6%) | 35 (4.9%) |
| $20,000 to $24,999 | 146 (18.2%) | 35 (4.9%) |
| $25,000 to $34,999 | 60 (7.5%) | 44 (6.1%) |
| $35,000 to $49,999 | 118 (14.7%) | 192 (26.8%) |
| $50,000 to $74,999 | 62 (7.7%) | 11 (1.5%) |
| $75,000 to $99,999 | 65 (8.1%) | 0 (0.0%) |
| $100,000 to $149,999 | 59 (7.4%) | 0 (0.0%) |
| $150,000 or more | 68 (8.5%) | 105 (14.6%) |
| Total | 800 (100.0%) | 717 (100.0%) |
Monthly Housing Cost Tiers in Winnsboro
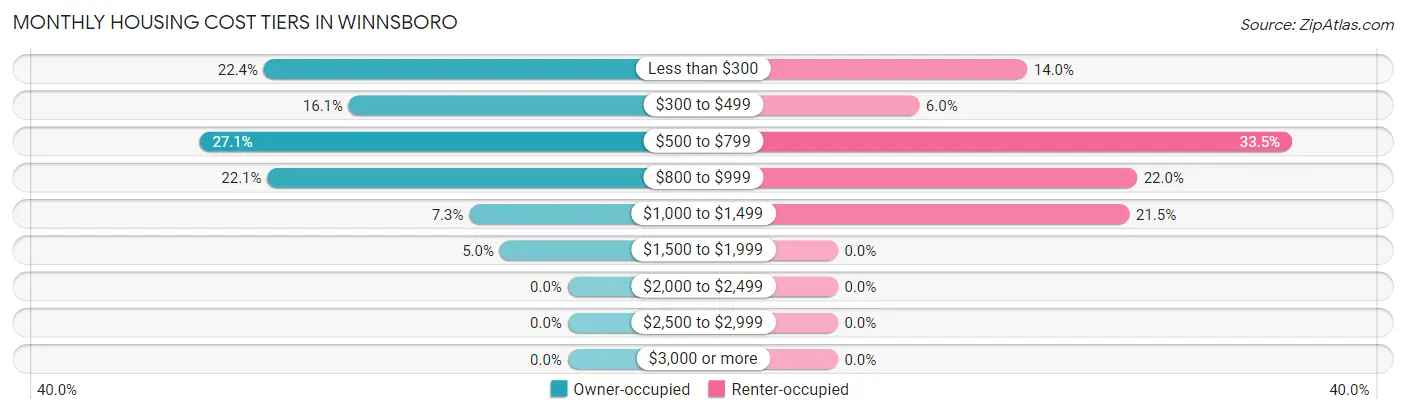
| Monthly Cost | Owner-occupied | Renter-occupied |
| Less than $300 | 179 (22.4%) | 100 (14.0%) |
| $300 to $499 | 129 (16.1%) | 43 (6.0%) |
| $500 to $799 | 217 (27.1%) | 240 (33.5%) |
| $800 to $999 | 177 (22.1%) | 158 (22.0%) |
| $1,000 to $1,499 | 58 (7.2%) | 154 (21.5%) |
| $1,500 to $1,999 | 40 (5.0%) | 0 (0.0%) |
| $2,000 to $2,499 | 0 (0.0%) | 0 (0.0%) |
| $2,500 to $2,999 | 0 (0.0%) | 0 (0.0%) |
| $3,000 or more | 0 (0.0%) | 0 (0.0%) |
| Total | 800 (100.0%) | 717 (100.0%) |
Physical Housing Characteristics in Winnsboro
Housing Structures in Winnsboro
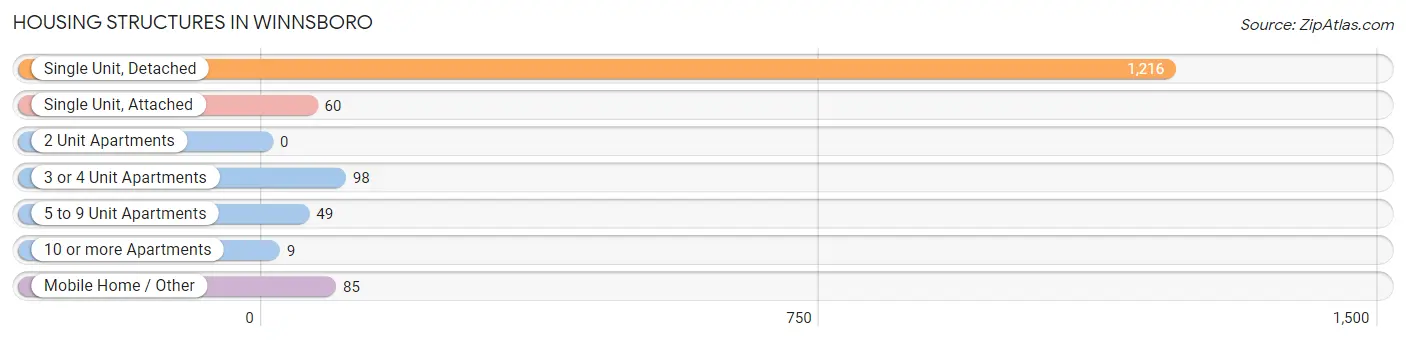
| Structure Type | # Housing Units | % Housing Units |
| Single Unit, Detached | 1,216 | 80.2% |
| Single Unit, Attached | 60 | 4.0% |
| 2 Unit Apartments | 0 | 0.0% |
| 3 or 4 Unit Apartments | 98 | 6.5% |
| 5 to 9 Unit Apartments | 49 | 3.2% |
| 10 or more Apartments | 9 | 0.6% |
| Mobile Home / Other | 85 | 5.6% |
| Total | 1,517 | 100.0% |
Housing Structures by Occupancy in Winnsboro
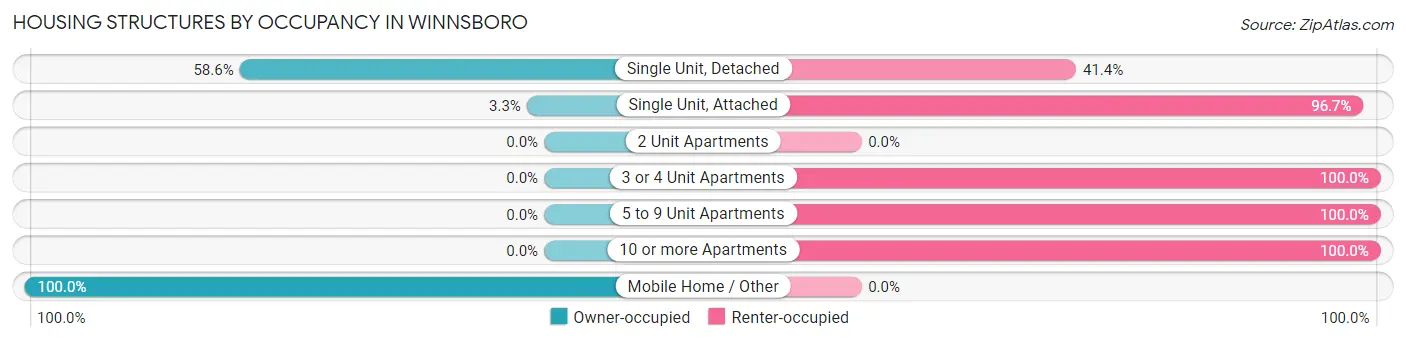
| Structure Type | Owner-occupied | Renter-occupied |
| Single Unit, Detached | 713 (58.6%) | 503 (41.4%) |
| Single Unit, Attached | 2 (3.3%) | 58 (96.7%) |
| 2 Unit Apartments | 0 (0.0%) | 0 (0.0%) |
| 3 or 4 Unit Apartments | 0 (0.0%) | 98 (100.0%) |
| 5 to 9 Unit Apartments | 0 (0.0%) | 49 (100.0%) |
| 10 or more Apartments | 0 (0.0%) | 9 (100.0%) |
| Mobile Home / Other | 85 (100.0%) | 0 (0.0%) |
| Total | 800 (52.7%) | 717 (47.3%) |
Housing Structures by Number of Rooms in Winnsboro
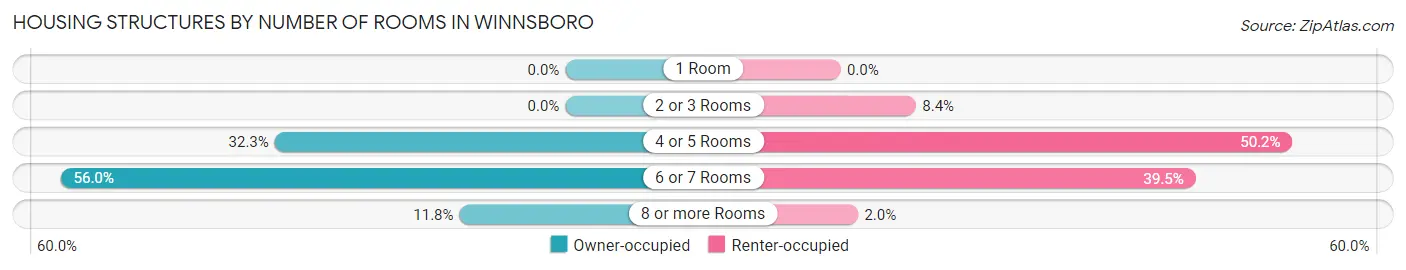
| Number of Rooms | Owner-occupied | Renter-occupied |
| 1 Room | 0 (0.0%) | 0 (0.0%) |
| 2 or 3 Rooms | 0 (0.0%) | 60 (8.4%) |
| 4 or 5 Rooms | 258 (32.3%) | 360 (50.2%) |
| 6 or 7 Rooms | 448 (56.0%) | 283 (39.5%) |
| 8 or more Rooms | 94 (11.7%) | 14 (1.9%) |
| Total | 800 (100.0%) | 717 (100.0%) |
Housing Structure by Heating Type in Winnsboro
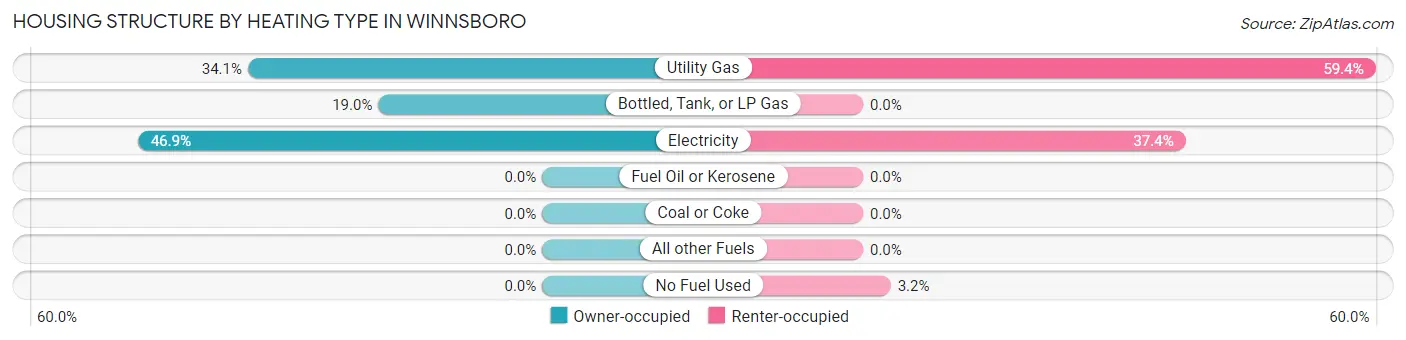
| Heating Type | Owner-occupied | Renter-occupied |
| Utility Gas | 273 (34.1%) | 426 (59.4%) |
| Bottled, Tank, or LP Gas | 152 (19.0%) | 0 (0.0%) |
| Electricity | 375 (46.9%) | 268 (37.4%) |
| Fuel Oil or Kerosene | 0 (0.0%) | 0 (0.0%) |
| Coal or Coke | 0 (0.0%) | 0 (0.0%) |
| All other Fuels | 0 (0.0%) | 0 (0.0%) |
| No Fuel Used | 0 (0.0%) | 23 (3.2%) |
| Total | 800 (100.0%) | 717 (100.0%) |
Household Vehicle Usage in Winnsboro
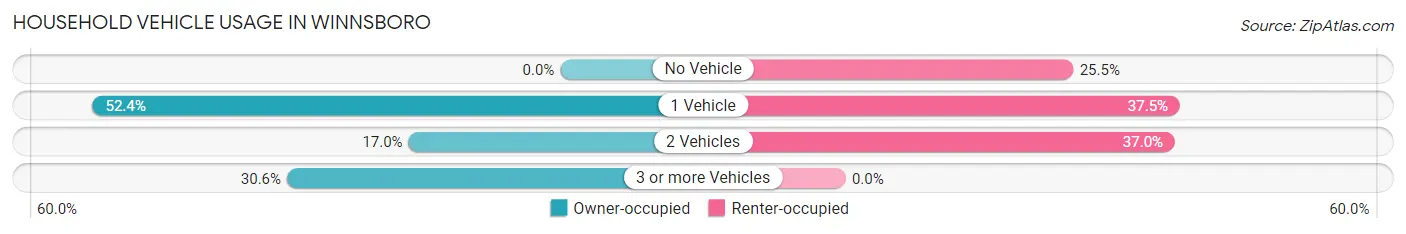
| Vehicles per Household | Owner-occupied | Renter-occupied |
| No Vehicle | 0 (0.0%) | 183 (25.5%) |
| 1 Vehicle | 419 (52.4%) | 269 (37.5%) |
| 2 Vehicles | 136 (17.0%) | 265 (37.0%) |
| 3 or more Vehicles | 245 (30.6%) | 0 (0.0%) |
| Total | 800 (100.0%) | 717 (100.0%) |
Real Estate & Mortgages in Winnsboro
Real Estate and Mortgage Overview in Winnsboro
| Characteristic | Without Mortgage | With Mortgage |
| Housing Units | 399 | 401 |
| Median Property Value | $91,400 | $84,600 |
| Median Household Income | $40,234 | $13 |
| Monthly Housing Costs | $316 | $0 |
| Real Estate Taxes | $199 | $129 |
Property Value by Mortgage Status in Winnsboro
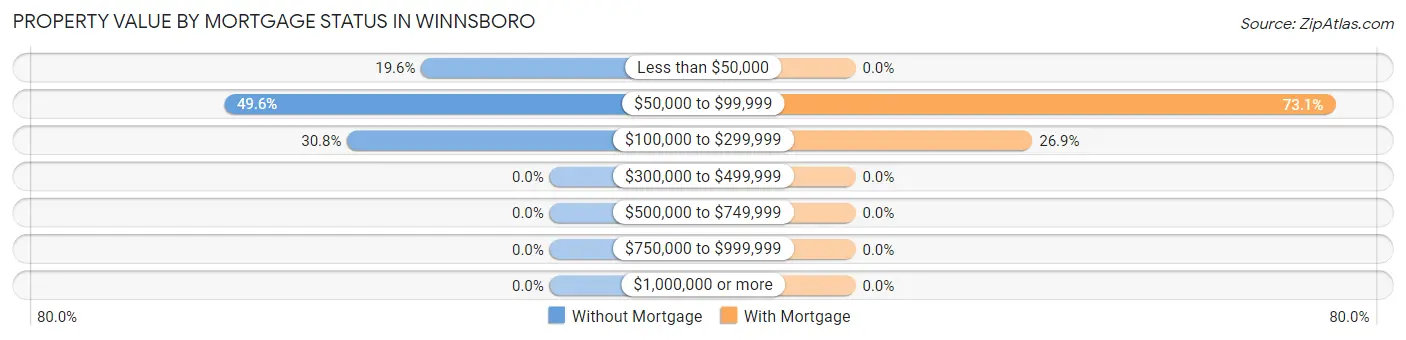
| Property Value | Without Mortgage | With Mortgage |
| Less than $50,000 | 78 (19.6%) | 0 (0.0%) |
| $50,000 to $99,999 | 198 (49.6%) | 293 (73.1%) |
| $100,000 to $299,999 | 123 (30.8%) | 108 (26.9%) |
| $300,000 to $499,999 | 0 (0.0%) | 0 (0.0%) |
| $500,000 to $749,999 | 0 (0.0%) | 0 (0.0%) |
| $750,000 to $999,999 | 0 (0.0%) | 0 (0.0%) |
| $1,000,000 or more | 0 (0.0%) | 0 (0.0%) |
| Total | 399 (100.0%) | 401 (100.0%) |
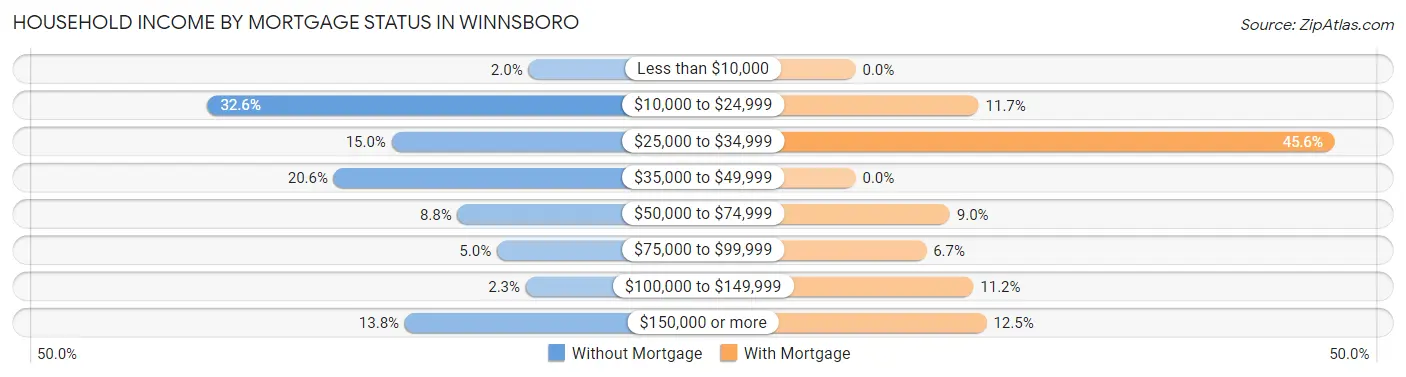
Household Income by Mortgage Status in Winnsboro
| Household Income | Without Mortgage | With Mortgage |
| Less than $10,000 | 8 (2.0%) | 0 (0.0%) |
| $10,000 to $24,999 | 130 (32.6%) | 47 (11.7%) |
| $25,000 to $34,999 | 60 (15.0%) | 183 (45.6%) |
| $35,000 to $49,999 | 82 (20.5%) | 0 (0.0%) |
| $50,000 to $74,999 | 35 (8.8%) | 36 (9.0%) |
| $75,000 to $99,999 | 20 (5.0%) | 27 (6.7%) |
| $100,000 to $149,999 | 9 (2.3%) | 45 (11.2%) |
| $150,000 or more | 55 (13.8%) | 50 (12.5%) |
| Total | 399 (100.0%) | 401 (100.0%) |
Property Value to Household Income Ratio in Winnsboro
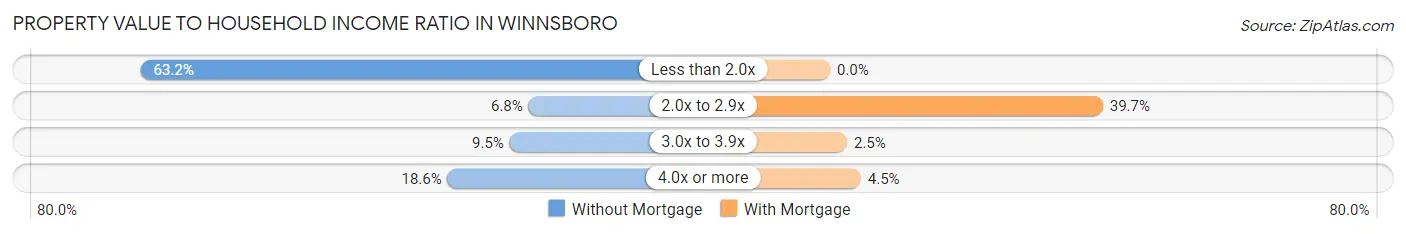
| Value-to-Income Ratio | Without Mortgage | With Mortgage |
| Less than 2.0x | 252 (63.2%) | 0 (0.0%) |
| 2.0x to 2.9x | 27 (6.8%) | 159 (39.7%) |
| 3.0x to 3.9x | 38 (9.5%) | 10 (2.5%) |
| 4.0x or more | 74 (18.5%) | 18 (4.5%) |
| Total | 399 (100.0%) | 401 (100.0%) |
Real Estate Taxes by Mortgage Status in Winnsboro
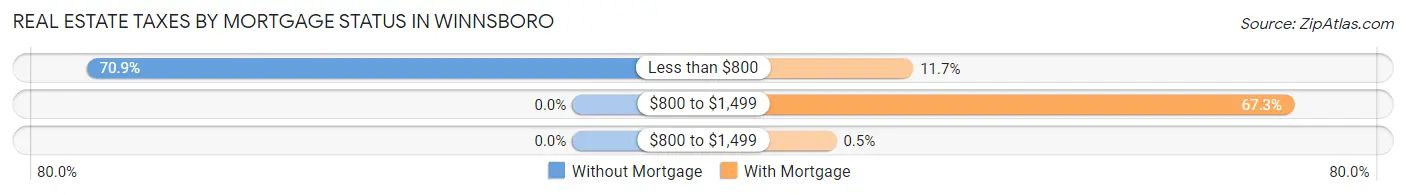
| Property Taxes | Without Mortgage | With Mortgage |
| Less than $800 | 283 (70.9%) | 47 (11.7%) |
| $800 to $1,499 | 0 (0.0%) | 270 (67.3%) |
| $800 to $1,499 | 0 (0.0%) | 2 (0.5%) |
| Total | 399 (100.0%) | 401 (100.0%) |
Health & Disability in Winnsboro
Health Insurance Coverage by Age in Winnsboro
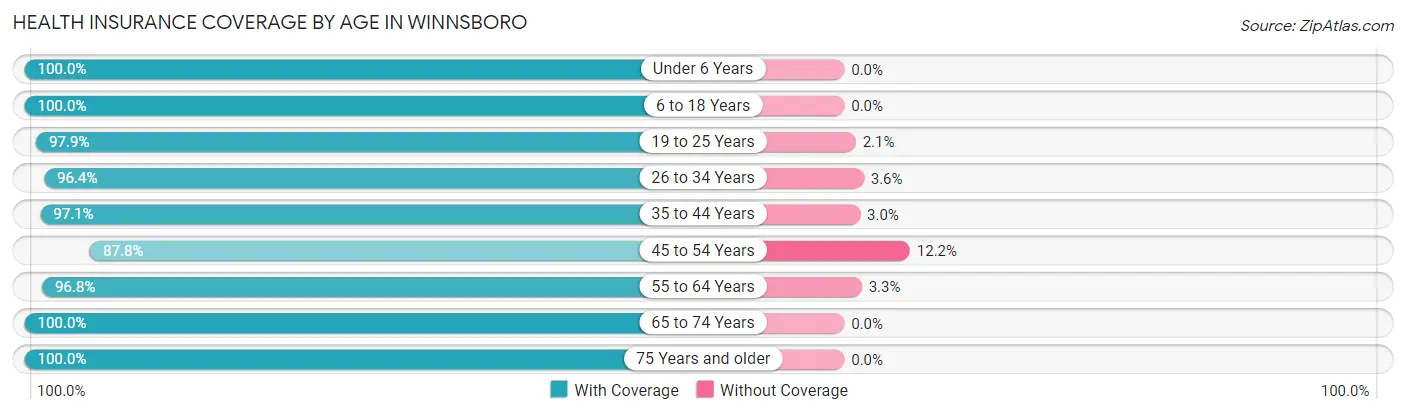
| Age Bracket | With Coverage | Without Coverage |
| Under 6 Years | 478 (100.0%) | 0 (0.0%) |
| 6 to 18 Years | 1,176 (100.0%) | 0 (0.0%) |
| 19 to 25 Years | 368 (97.9%) | 8 (2.1%) |
| 26 to 34 Years | 611 (96.4%) | 23 (3.6%) |
| 35 to 44 Years | 690 (97.1%) | 21 (2.9%) |
| 45 to 54 Years | 244 (87.8%) | 34 (12.2%) |
| 55 to 64 Years | 446 (96.8%) | 15 (3.3%) |
| 65 to 74 Years | 510 (100.0%) | 0 (0.0%) |
| 75 Years and older | 128 (100.0%) | 0 (0.0%) |
| Total | 4,651 (97.9%) | 101 (2.1%) |
Health Insurance Coverage by Citizenship Status in Winnsboro
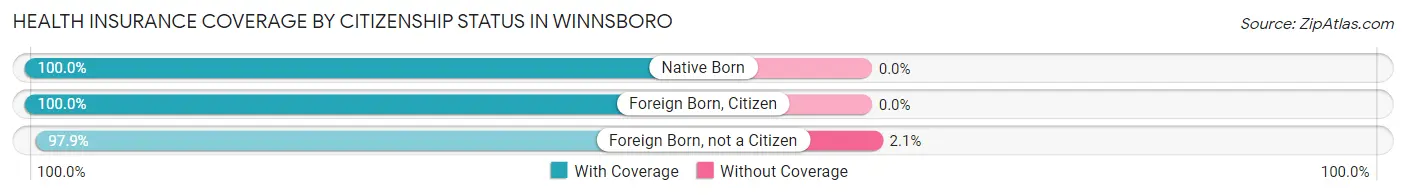
| Citizenship Status | With Coverage | Without Coverage |
| Native Born | 478 (100.0%) | 0 (0.0%) |
| Foreign Born, Citizen | 1,176 (100.0%) | 0 (0.0%) |
| Foreign Born, not a Citizen | 368 (97.9%) | 8 (2.1%) |
Health Insurance Coverage by Household Income in Winnsboro
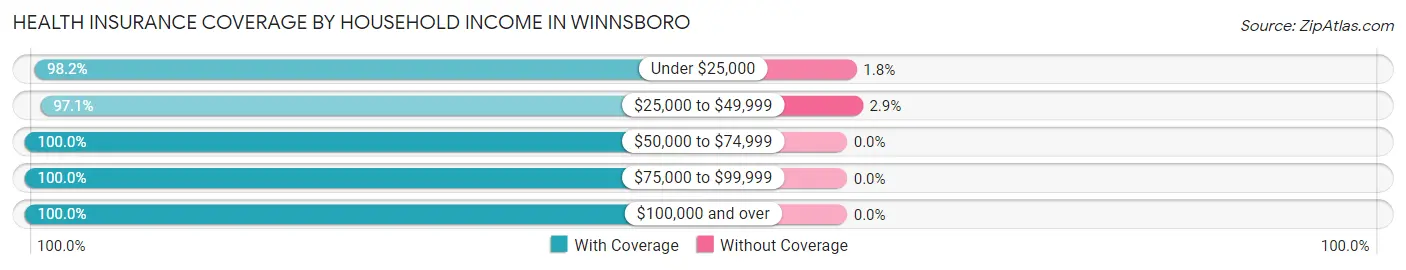
| Household Income | With Coverage | Without Coverage |
| Under $25,000 | 1,856 (98.2%) | 34 (1.8%) |
| $25,000 to $49,999 | 1,293 (97.1%) | 39 (2.9%) |
| $50,000 to $74,999 | 210 (100.0%) | 0 (0.0%) |
| $75,000 to $99,999 | 323 (100.0%) | 0 (0.0%) |
| $100,000 and over | 915 (100.0%) | 0 (0.0%) |
Public vs Private Health Insurance Coverage by Age in Winnsboro
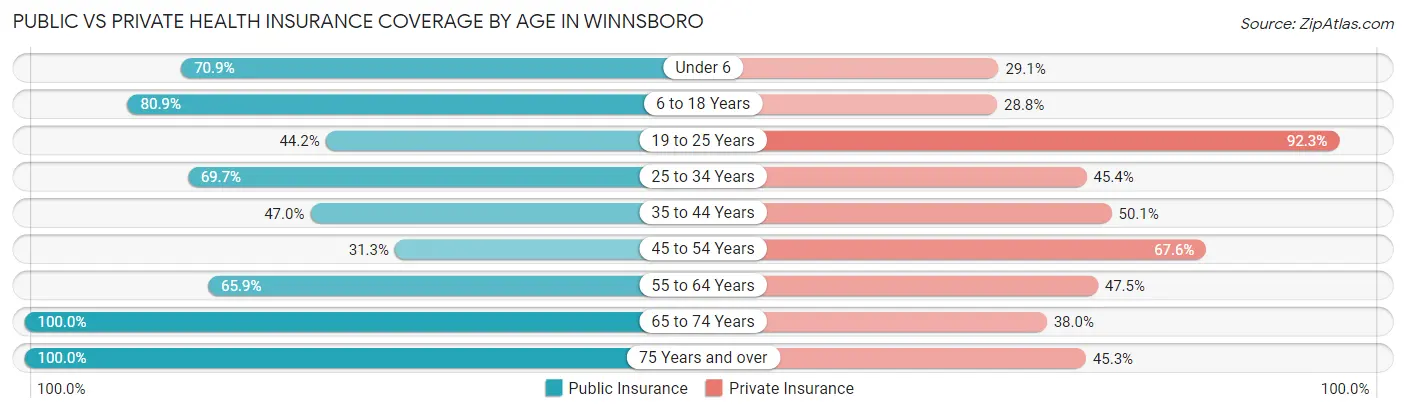
| Age Bracket | Public Insurance | Private Insurance |
| Under 6 | 339 (70.9%) | 139 (29.1%) |
| 6 to 18 Years | 951 (80.9%) | 339 (28.8%) |
| 19 to 25 Years | 166 (44.2%) | 347 (92.3%) |
| 25 to 34 Years | 442 (69.7%) | 288 (45.4%) |
| 35 to 44 Years | 334 (47.0%) | 356 (50.1%) |
| 45 to 54 Years | 87 (31.3%) | 188 (67.6%) |
| 55 to 64 Years | 304 (65.9%) | 219 (47.5%) |
| 65 to 74 Years | 510 (100.0%) | 194 (38.0%) |
| 75 Years and over | 128 (100.0%) | 58 (45.3%) |
| Total | 3,261 (68.6%) | 2,128 (44.8%) |
Disability Status by Sex by Age in Winnsboro
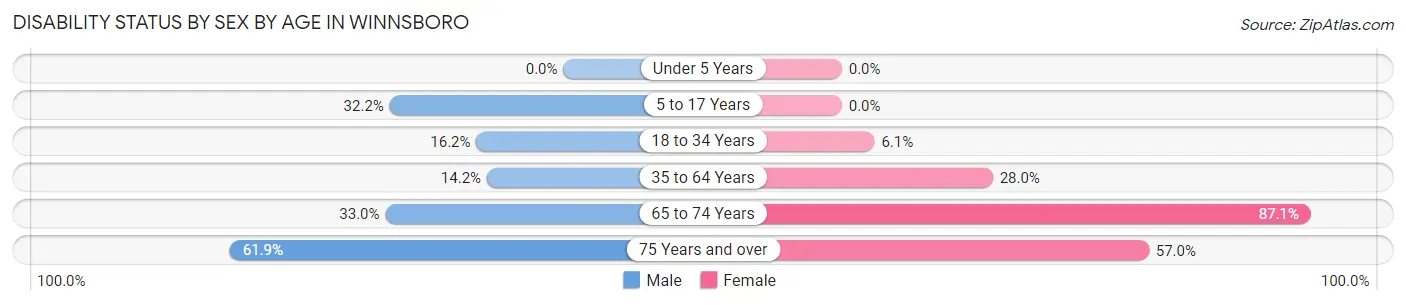
| Age Bracket | Male | Female |
| Under 5 Years | 0 (0.0%) | 0 (0.0%) |
| 5 to 17 Years | 137 (32.2%) | 0 (0.0%) |
| 18 to 34 Years | 63 (16.2%) | 43 (6.1%) |
| 35 to 64 Years | 109 (14.2%) | 191 (28.0%) |
| 65 to 74 Years | 74 (33.0%) | 249 (87.1%) |
| 75 Years and over | 26 (61.9%) | 49 (57.0%) |
Disability Class by Sex by Age in Winnsboro
Disability Class: Hearing Difficulty
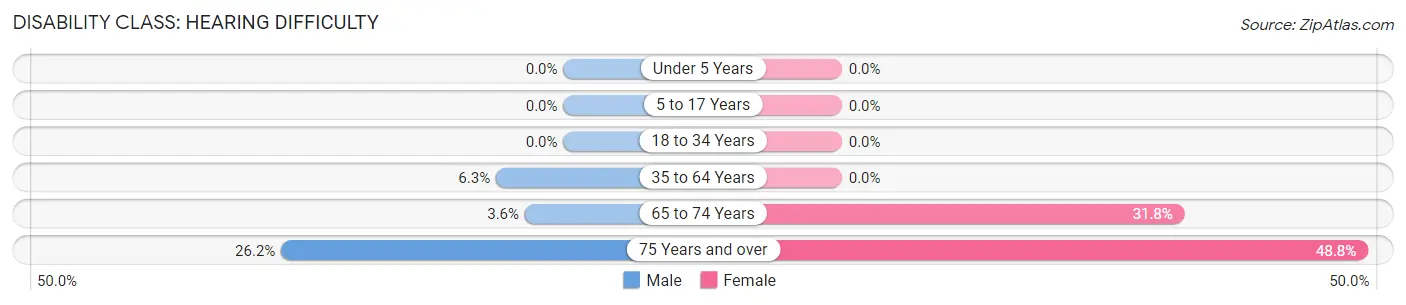
| Age Bracket | Male | Female |
| Under 5 Years | 0 (0.0%) | 0 (0.0%) |
| 5 to 17 Years | 0 (0.0%) | 0 (0.0%) |
| 18 to 34 Years | 0 (0.0%) | 0 (0.0%) |
| 35 to 64 Years | 48 (6.2%) | 0 (0.0%) |
| 65 to 74 Years | 8 (3.6%) | 91 (31.8%) |
| 75 Years and over | 11 (26.2%) | 42 (48.8%) |
Disability Class: Vision Difficulty
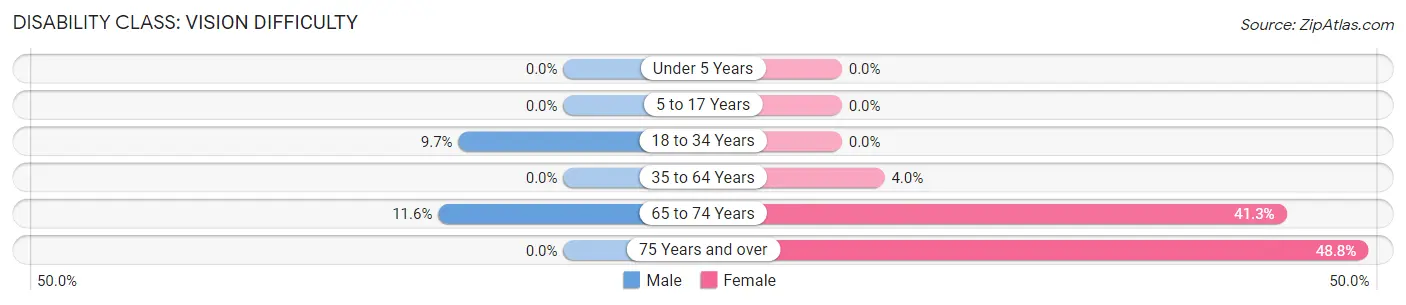
| Age Bracket | Male | Female |
| Under 5 Years | 0 (0.0%) | 0 (0.0%) |
| 5 to 17 Years | 0 (0.0%) | 0 (0.0%) |
| 18 to 34 Years | 38 (9.7%) | 0 (0.0%) |
| 35 to 64 Years | 0 (0.0%) | 27 (4.0%) |
| 65 to 74 Years | 26 (11.6%) | 118 (41.3%) |
| 75 Years and over | 0 (0.0%) | 42 (48.8%) |
Disability Class: Cognitive Difficulty
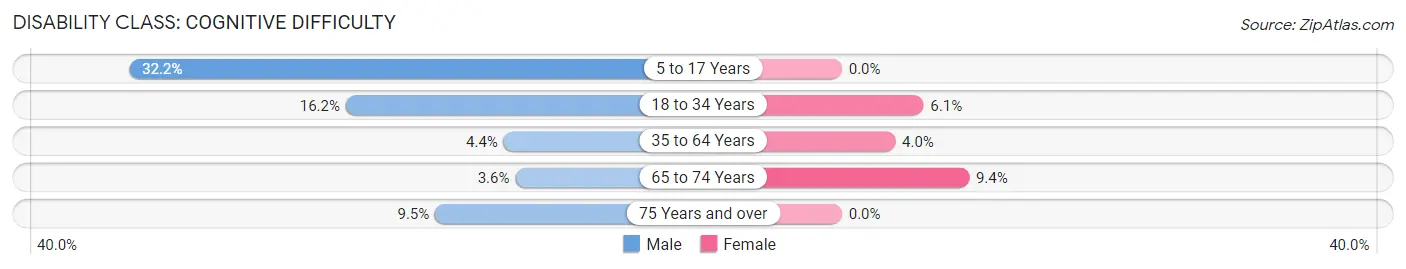
| Age Bracket | Male | Female |
| 5 to 17 Years | 137 (32.2%) | 0 (0.0%) |
| 18 to 34 Years | 63 (16.2%) | 43 (6.1%) |
| 35 to 64 Years | 34 (4.4%) | 27 (4.0%) |
| 65 to 74 Years | 8 (3.6%) | 27 (9.4%) |
| 75 Years and over | 4 (9.5%) | 0 (0.0%) |
Disability Class: Ambulatory Difficulty
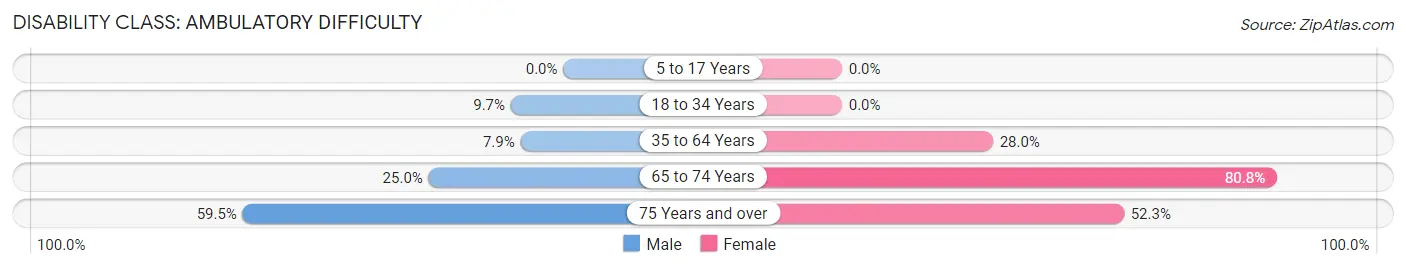
| Age Bracket | Male | Female |
| 5 to 17 Years | 0 (0.0%) | 0 (0.0%) |
| 18 to 34 Years | 38 (9.7%) | 0 (0.0%) |
| 35 to 64 Years | 61 (7.9%) | 191 (28.0%) |
| 65 to 74 Years | 56 (25.0%) | 231 (80.8%) |
| 75 Years and over | 25 (59.5%) | 45 (52.3%) |
Disability Class: Self-Care Difficulty
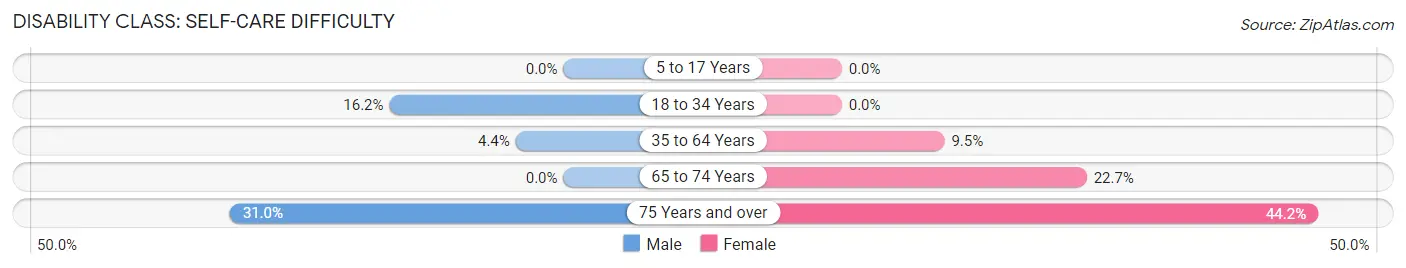
| Age Bracket | Male | Female |
| 5 to 17 Years | 0 (0.0%) | 0 (0.0%) |
| 18 to 34 Years | 63 (16.2%) | 0 (0.0%) |
| 35 to 64 Years | 34 (4.4%) | 65 (9.5%) |
| 65 to 74 Years | 0 (0.0%) | 65 (22.7%) |
| 75 Years and over | 13 (30.9%) | 38 (44.2%) |
Technology Access in Winnsboro
Computing Device Access in Winnsboro
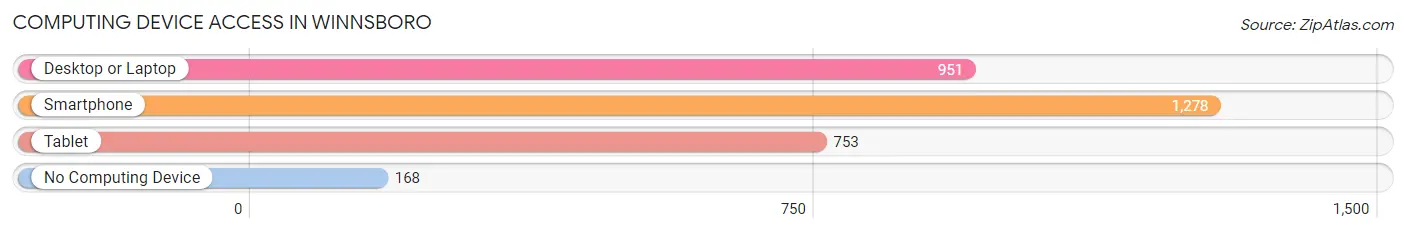
| Device Type | # Households | % Households |
| Desktop or Laptop | 951 | 62.7% |
| Smartphone | 1,278 | 84.3% |
| Tablet | 753 | 49.6% |
| No Computing Device | 168 | 11.1% |
| Total | 1,517 | 100.0% |
Internet Access in Winnsboro
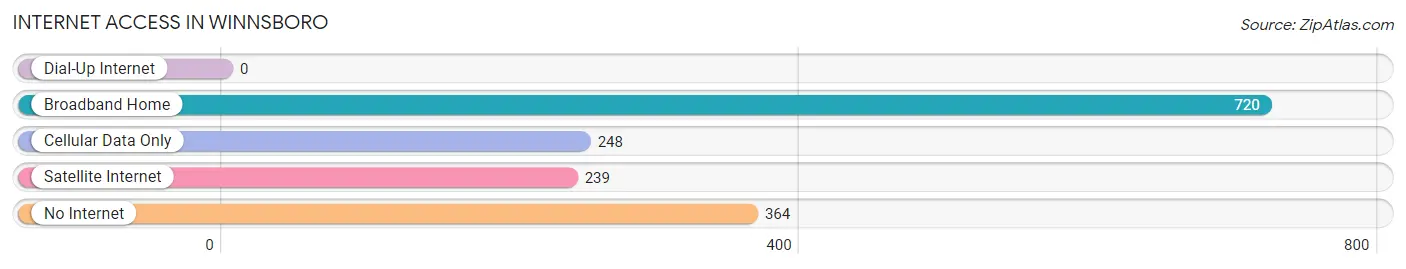
| Internet Type | # Households | % Households |
| Dial-Up Internet | 0 | 0.0% |
| Broadband Home | 720 | 47.5% |
| Cellular Data Only | 248 | 16.4% |
| Satellite Internet | 239 | 15.8% |
| No Internet | 364 | 24.0% |
| Total | 1,517 | 100.0% |
Winnsboro Summary
Winnsboro, Louisiana is a small town located in Franklin Parish, in the northeastern part of the state. It is situated on the banks of the Ouachita River, and is the parish seat of Franklin Parish. The town has a population of approximately 4,000 people, and is part of the Monroe Metropolitan Statistical Area.
History
Winnsboro was founded in 1820 by William Winn, a planter from Virginia. He named the town after his hometown of Winnsboro, South Carolina. The town was incorporated in 1845, and was the first town in Franklin Parish.
In the early days, Winnsboro was a bustling river port, and was a major center for the cotton trade. The town was also a major stop on the stagecoach line between Monroe and Alexandria.
During the Civil War, Winnsboro was the site of a major battle between Union and Confederate forces. The Battle of Winnsboro was fought on April 7, 1864, and resulted in a Confederate victory.
Geography
Winnsboro is located in northeastern Louisiana, in Franklin Parish. It is situated on the banks of the Ouachita River, and is about 25 miles south of Monroe. The town is located at the intersection of U.S. Highway 425 and Louisiana Highway 15.
The town has a total area of 2.2 square miles, all of which is land. The terrain is mostly flat, with some rolling hills. The climate is humid subtropical, with hot, humid summers and mild winters.
Economy
The economy of Winnsboro is largely based on agriculture and manufacturing. The town is home to several large manufacturing plants, including a paper mill, a lumber mill, and a chemical plant.
Agriculture is also an important part of the local economy. The town is home to several large farms, which produce cotton, soybeans, corn, and other crops.
Demographics
As of the 2010 census, the population of Winnsboro was 4,000. The racial makeup of the town was 75.3% White, 21.2% African American, 0.3% Native American, 0.7% Asian, 0.1% Pacific Islander, and 2.4% from other races. Hispanic or Latino of any race were 2.7% of the population.
The median household income in Winnsboro was $30,938, and the median family income was $37,813. The per capita income was $17,845. About 17.2% of families and 20.3% of the population were below the poverty line, including 28.3% of those under age 18 and 16.2% of those age 65 or over.
Conclusion
Winnsboro, Louisiana is a small town located in Franklin Parish, in the northeastern part of the state. It is situated on the banks of the Ouachita River, and is the parish seat of Franklin Parish. The town has a population of approximately 4,000 people, and is part of the Monroe Metropolitan Statistical Area. The economy of Winnsboro is largely based on agriculture and manufacturing, and the town is home to several large farms and manufacturing plants. The racial makeup of the town is 75.3% White, 21.2% African American, 0.3% Native American, 0.7% Asian, 0.1% Pacific Islander, and 2.4% from other races. The median household income in Winnsboro was $30,938, and the median family income was $37,813. About 17.2% of families and 20.3% of the population were below the poverty line.
Common Questions
What is Per Capita Income in Winnsboro?
Per Capita income in Winnsboro is $20,115.
What is the Median Family Income in Winnsboro?
Median Family Income in Winnsboro is $36,411.
What is the Median Household income in Winnsboro?
Median Household Income in Winnsboro is $31,821.
What is Income or Wage Gap in Winnsboro?
Income or Wage Gap in Winnsboro is 5.3%.
Women in Winnsboro earn 94.7 cents for every dollar earned by a man.
What is Inequality or Gini Index in Winnsboro?
Inequality or Gini Index in Winnsboro is 0.60.
What is the Total Population of Winnsboro?
Total Population of Winnsboro is 4,823.
What is the Total Male Population of Winnsboro?
Total Male Population of Winnsboro is 2,089.
What is the Total Female Population of Winnsboro?
Total Female Population of Winnsboro is 2,734.
What is the Ratio of Males per 100 Females in Winnsboro?
There are 76.41 Males per 100 Females in Winnsboro.
What is the Ratio of Females per 100 Males in Winnsboro?
There are 130.88 Females per 100 Males in Winnsboro.
What is the Median Population Age in Winnsboro?
Median Population Age in Winnsboro is 33.0 Years.
What is the Average Family Size in Winnsboro
Average Family Size in Winnsboro is 3.8 People.
What is the Average Household Size in Winnsboro
Average Household Size in Winnsboro is 3.1 People.
How Large is the Labor Force in Winnsboro?
There are 1,726 People in the Labor Forcein in Winnsboro.
What is the Percentage of People in the Labor Force in Winnsboro?
52.3% of People are in the Labor Force in Winnsboro.
What is the Unemployment Rate in Winnsboro?
Unemployment Rate in Winnsboro is 11.9%.