Winnfield, LA Map & Demographics
Winnfield Map
Winnfield Overview
$24,262
PER CAPITA INCOME
$55,137
AVG FAMILY INCOME
$37,477
AVG HOUSEHOLD INCOME
37.1%
WAGE / INCOME GAP [ % ]
62.9¢/ $1
WAGE / INCOME GAP [ $ ]
$15,007
FAMILY INCOME DEFICIT
0.51
INEQUALITY / GINI INDEX
4,124
TOTAL POPULATION
1,880
MALE POPULATION
2,244
FEMALE POPULATION
83.78
MALES / 100 FEMALES
119.36
FEMALES / 100 MALES
33.3
MEDIAN AGE
3.8
AVG FAMILY SIZE
2.6
AVG HOUSEHOLD SIZE
1,700
LABOR FORCE [ PEOPLE ]
56.4%
PERCENT IN LABOR FORCE
8.1%
UNEMPLOYMENT RATE
Winnfield Zip Codes
Winnfield Area Codes
Income in Winnfield
Income Overview in Winnfield
Per Capita Income in Winnfield is $24,262, while median incomes of families and households are $55,137 and $37,477 respectively.
| Characteristic | Number | Measure |
| Per Capita Income | 4,124 | $24,262 |
| Median Family Income | 815 | $55,137 |
| Mean Family Income | 815 | $60,337 |
| Median Household Income | 1,497 | $37,477 |
| Mean Household Income | 1,497 | $58,999 |
| Income Deficit | 815 | $15,007 |
| Wage / Income Gap (%) | 4,124 | 37.09% |
| Wage / Income Gap ($) | 4,124 | 62.91¢ per $1 |
| Gini / Inequality Index | 4,124 | 0.51 |
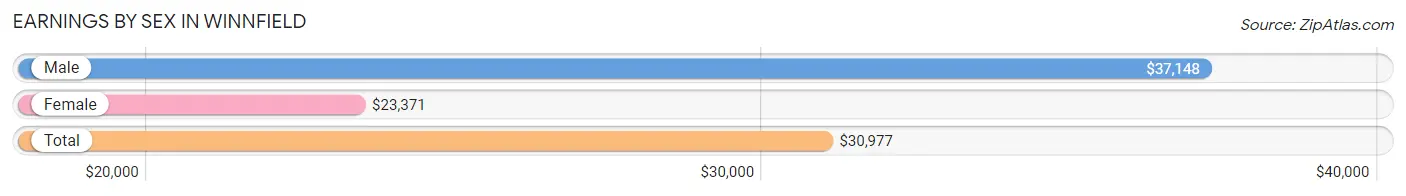
Earnings by Sex in Winnfield
Average Earnings in Winnfield are $30,977, $37,148 for men and $23,371 for women, a difference of 37.1%.
| Sex | Number | Average Earnings |
| Male | 812 (48.6%) | $37,148 |
| Female | 857 (51.3%) | $23,371 |
| Total | 1,669 (100.0%) | $30,977 |
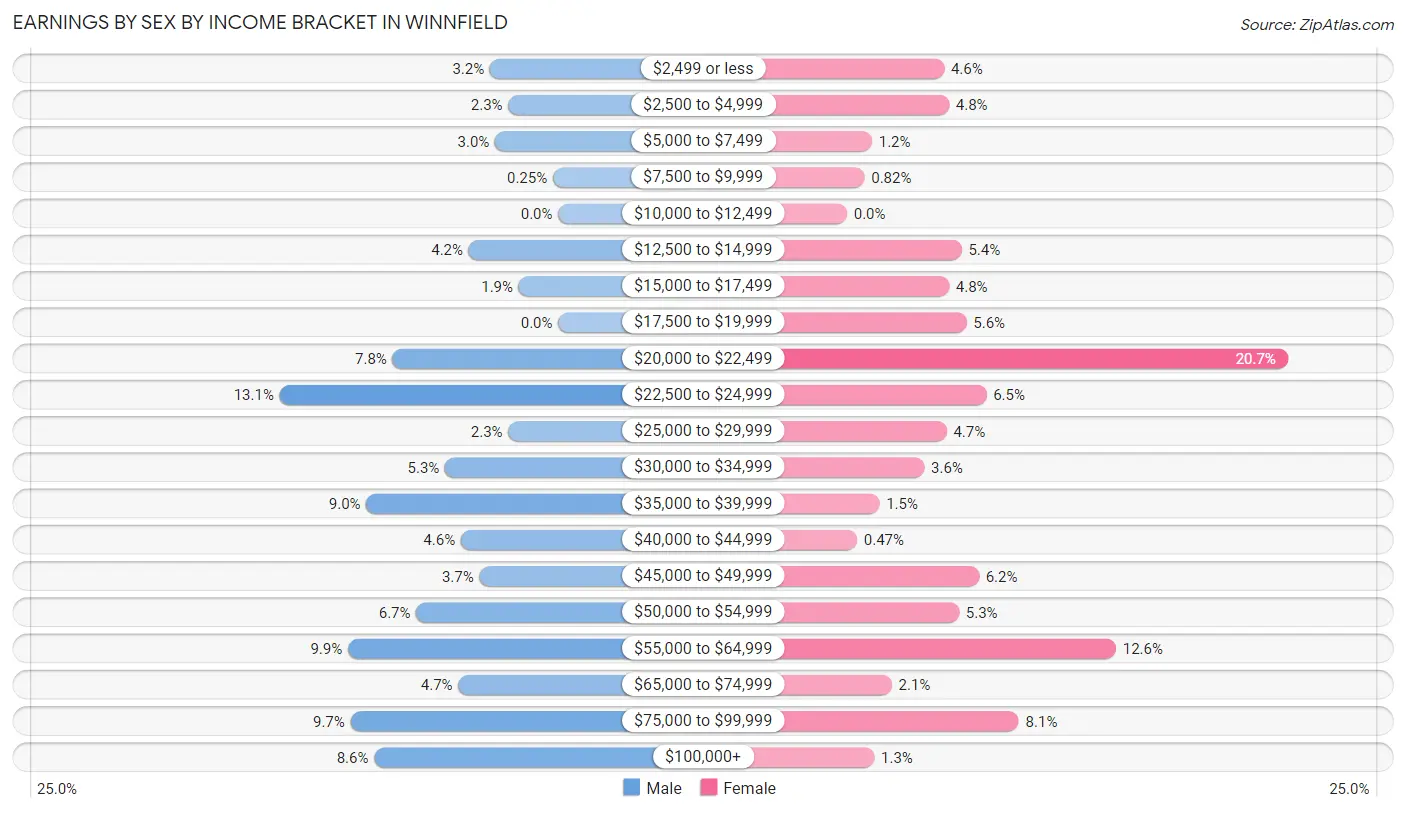
Earnings by Sex by Income Bracket in Winnfield
The most common earnings brackets in Winnfield are $22,500 to $24,999 for men (106 | 13.1%) and $20,000 to $22,499 for women (177 | 20.6%).
| Income | Male | Female |
| $2,499 or less | 26 (3.2%) | 39 (4.5%) |
| $2,500 to $4,999 | 19 (2.3%) | 41 (4.8%) |
| $5,000 to $7,499 | 24 (3.0%) | 10 (1.2%) |
| $7,500 to $9,999 | 2 (0.3%) | 7 (0.8%) |
| $10,000 to $12,499 | 0 (0.0%) | 0 (0.0%) |
| $12,500 to $14,999 | 34 (4.2%) | 46 (5.4%) |
| $15,000 to $17,499 | 15 (1.8%) | 41 (4.8%) |
| $17,500 to $19,999 | 0 (0.0%) | 48 (5.6%) |
| $20,000 to $22,499 | 63 (7.8%) | 177 (20.6%) |
| $22,500 to $24,999 | 106 (13.1%) | 56 (6.5%) |
| $25,000 to $29,999 | 19 (2.3%) | 40 (4.7%) |
| $30,000 to $34,999 | 43 (5.3%) | 31 (3.6%) |
| $35,000 to $39,999 | 73 (9.0%) | 13 (1.5%) |
| $40,000 to $44,999 | 37 (4.6%) | 4 (0.5%) |
| $45,000 to $49,999 | 30 (3.7%) | 53 (6.2%) |
| $50,000 to $54,999 | 54 (6.7%) | 45 (5.2%) |
| $55,000 to $64,999 | 80 (9.9%) | 108 (12.6%) |
| $65,000 to $74,999 | 38 (4.7%) | 18 (2.1%) |
| $75,000 to $99,999 | 79 (9.7%) | 69 (8.1%) |
| $100,000+ | 70 (8.6%) | 11 (1.3%) |
| Total | 812 (100.0%) | 857 (100.0%) |
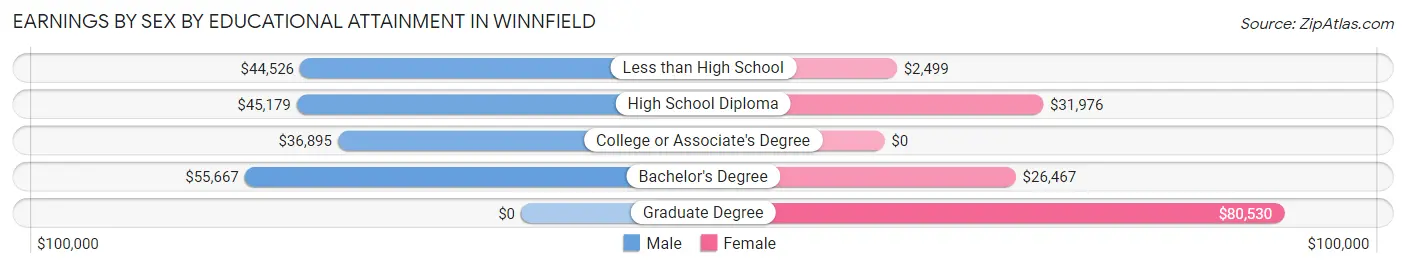
Earnings by Sex by Educational Attainment in Winnfield
Average earnings in Winnfield are $47,554 for men and $35,769 for women, a difference of 24.8%. Men with an educational attainment of bachelor's degree enjoy the highest average annual earnings of $55,667, while those with college or associate's degree education earn the least with $36,895. Women with an educational attainment of graduate degree earn the most with the average annual earnings of $80,530, while those with less than high school education have the smallest earnings of $2,499.
| Educational Attainment | Male Income | Female Income |
| Less than High School | $44,526 | $2,499 |
| High School Diploma | $45,179 | $31,976 |
| College or Associate's Degree | $36,895 | $0 |
| Bachelor's Degree | $55,667 | $26,467 |
| Graduate Degree | - | - |
| Total | $47,554 | $35,769 |
Family Income in Winnfield
Family Income Brackets in Winnfield
According to the Winnfield family income data, there are 171 families falling into the $50,000 to $74,999 income range, which is the most common income bracket and makes up 21.0% of all families. Conversely, the $150,000 to $199,999 income bracket is the least frequent group with only 11 families (1.3%) belonging to this category.
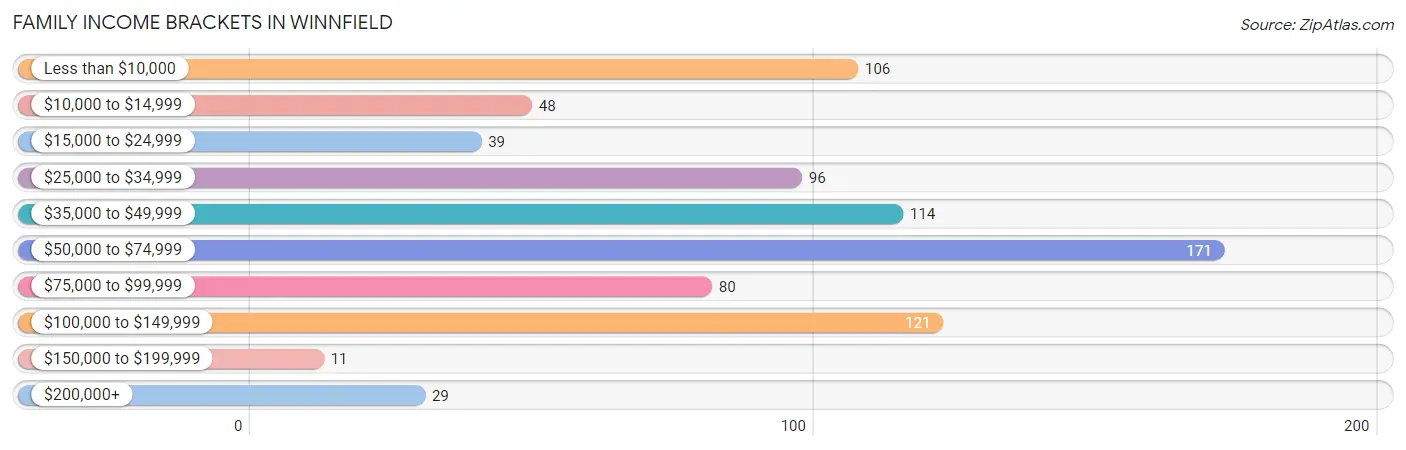
| Income Bracket | # Families | % Families |
| Less than $10,000 | 106 | 13.0% |
| $10,000 to $14,999 | 48 | 5.9% |
| $15,000 to $24,999 | 39 | 4.8% |
| $25,000 to $34,999 | 96 | 11.8% |
| $35,000 to $49,999 | 114 | 14.0% |
| $50,000 to $74,999 | 171 | 21.0% |
| $75,000 to $99,999 | 80 | 9.8% |
| $100,000 to $149,999 | 121 | 14.8% |
| $150,000 to $199,999 | 11 | 1.3% |
| $200,000+ | 29 | 3.6% |
Family Income by Famaliy Size in Winnfield
4-person families (155 | 19.0%) account for the highest median family income in Winnfield with $73,854 per family, while 2-person families (420 | 51.5%) have the highest median income of $21,905 per family member.
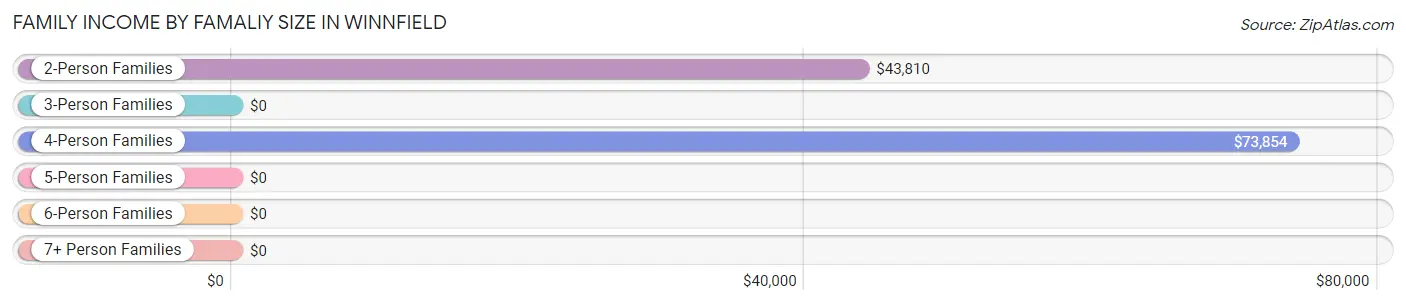
| Income Bracket | # Families | Median Income |
| 2-Person Families | 420 (51.5%) | $43,810 |
| 3-Person Families | 122 (15.0%) | $0 |
| 4-Person Families | 155 (19.0%) | $73,854 |
| 5-Person Families | 90 (11.0%) | $0 |
| 6-Person Families | 28 (3.4%) | $0 |
| 7+ Person Families | 0 (0.0%) | $0 |
| Total | 815 (100.0%) | $55,137 |
Family Income by Number of Earners in Winnfield
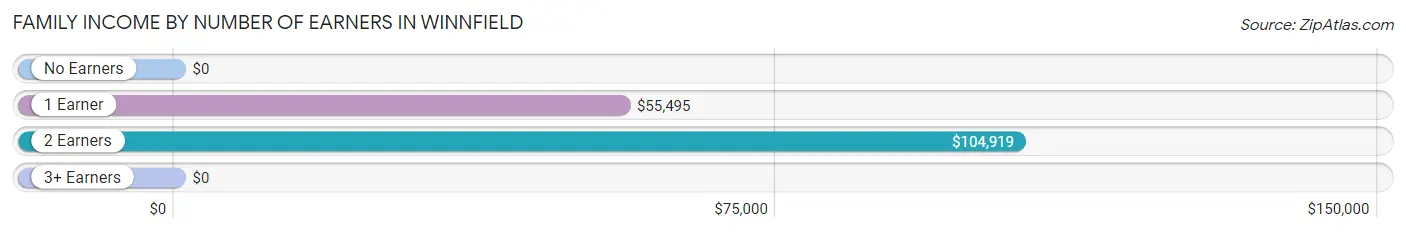
| Number of Earners | # Families | Median Income |
| No Earners | 141 (17.3%) | $0 |
| 1 Earner | 457 (56.1%) | $55,495 |
| 2 Earners | 198 (24.3%) | $104,919 |
| 3+ Earners | 19 (2.3%) | $0 |
| Total | 815 (100.0%) | $55,137 |
Household Income in Winnfield
Household Income Brackets in Winnfield
With 289 households falling in the category, the $15,000 to $24,999 income range is the most frequent in Winnfield, accounting for 19.3% of all households. In contrast, only 10 households (0.7%) fall into the $150,000 to $199,999 income bracket, making it the least populous group.
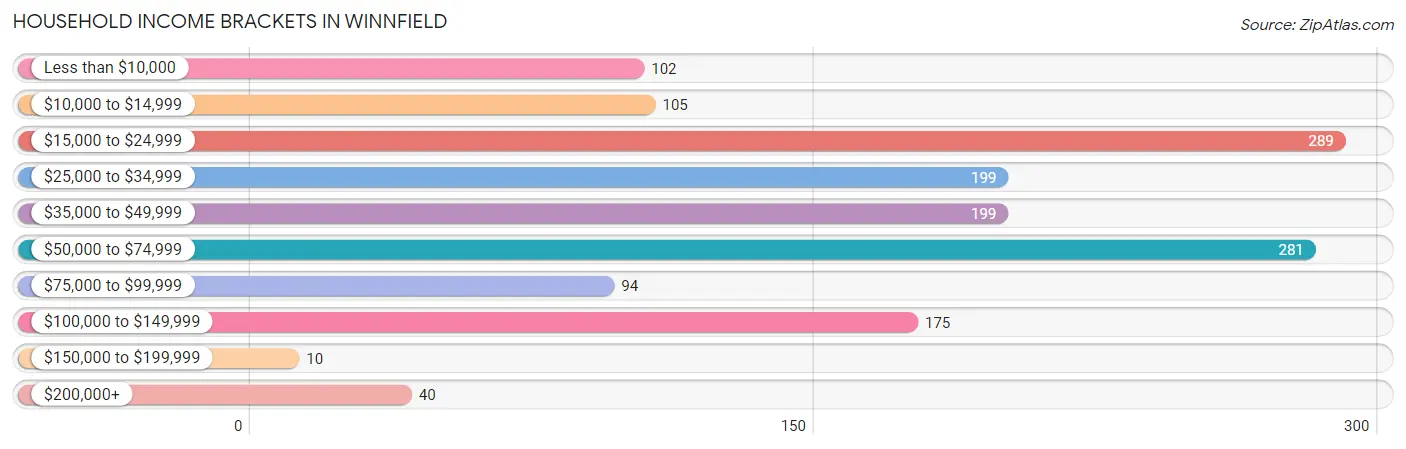
| Income Bracket | # Households | % Households |
| Less than $10,000 | 102 | 6.8% |
| $10,000 to $14,999 | 105 | 7.0% |
| $15,000 to $24,999 | 289 | 19.3% |
| $25,000 to $34,999 | 199 | 13.3% |
| $35,000 to $49,999 | 199 | 13.3% |
| $50,000 to $74,999 | 281 | 18.8% |
| $75,000 to $99,999 | 94 | 6.3% |
| $100,000 to $149,999 | 175 | 11.7% |
| $150,000 to $199,999 | 10 | 0.7% |
| $200,000+ | 40 | 2.7% |
Household Income by Householder Age in Winnfield
The median household income in Winnfield is $37,477, with the highest median household income of $44,777 found in the 45 to 64 years age bracket for the primary householder. A total of 619 households (41.3%) fall into this category. Meanwhile, the 15 to 24 years age bracket for the primary householder has the lowest median household income of $0, with 31 households (2.1%) in this group.
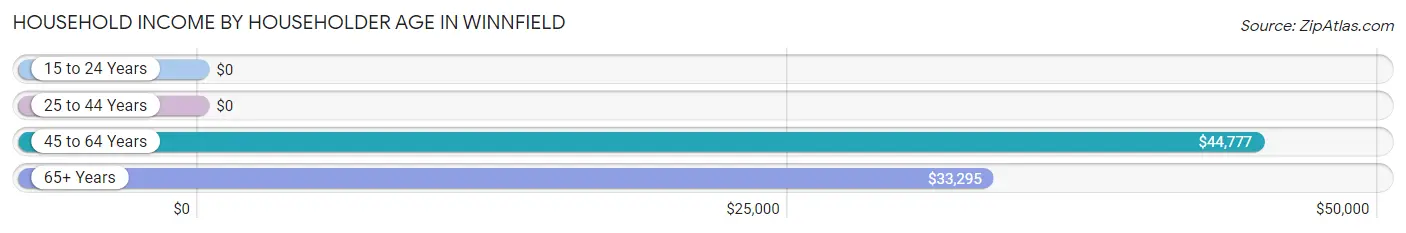
| Income Bracket | # Households | Median Income |
| 15 to 24 Years | 31 (2.1%) | $0 |
| 25 to 44 Years | 515 (34.4%) | $0 |
| 45 to 64 Years | 619 (41.3%) | $44,777 |
| 65+ Years | 332 (22.2%) | $33,295 |
| Total | 1,497 (100.0%) | $37,477 |
Poverty in Winnfield
Income Below Poverty by Sex and Age in Winnfield
With 21.9% poverty level for males and 30.1% for females among the residents of Winnfield, 12 to 14 year old males and 6 to 11 year old females are the most vulnerable to poverty, with 86 males (63.2%) and 62 females (70.5%) in their respective age groups living below the poverty level.
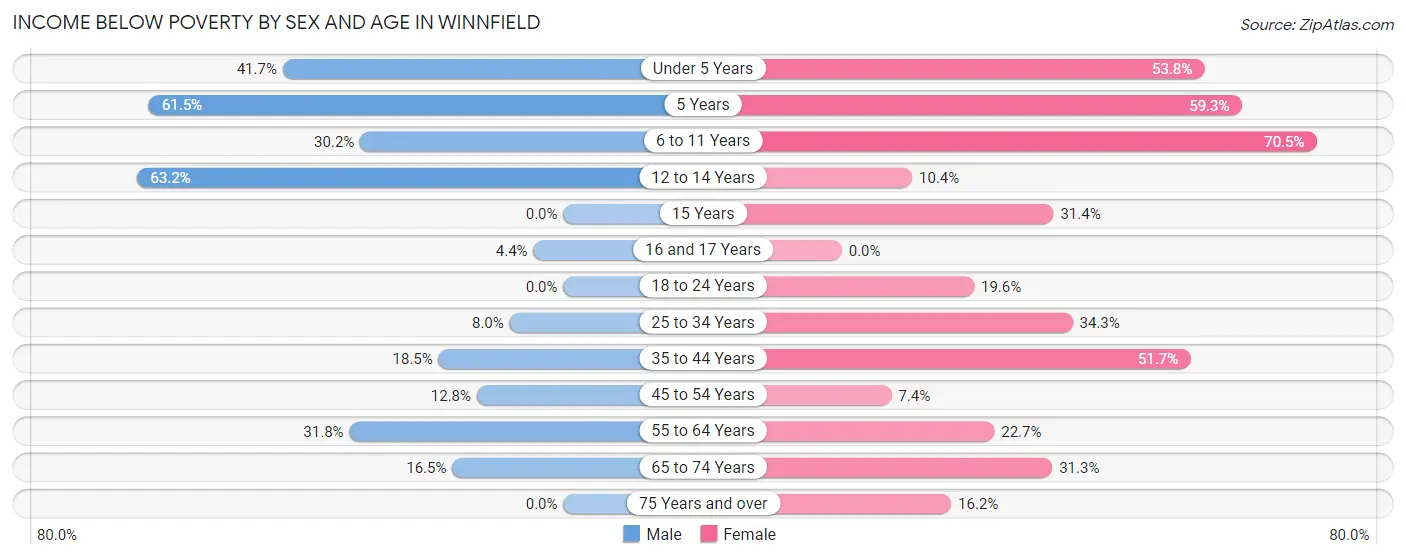
| Age Bracket | Male | Female |
| Under 5 Years | 40 (41.7%) | 128 (53.8%) |
| 5 Years | 24 (61.5%) | 35 (59.3%) |
| 6 to 11 Years | 70 (30.2%) | 62 (70.5%) |
| 12 to 14 Years | 86 (63.2%) | 19 (10.4%) |
| 15 Years | 0 (0.0%) | 11 (31.4%) |
| 16 and 17 Years | 2 (4.4%) | 0 (0.0%) |
| 18 to 24 Years | 0 (0.0%) | 55 (19.6%) |
| 25 to 34 Years | 32 (8.0%) | 73 (34.3%) |
| 35 to 44 Years | 35 (18.5%) | 121 (51.7%) |
| 45 to 54 Years | 19 (12.8%) | 21 (7.4%) |
| 55 to 64 Years | 61 (31.8%) | 53 (22.7%) |
| 65 to 74 Years | 16 (16.5%) | 50 (31.2%) |
| 75 Years and over | 0 (0.0%) | 19 (16.2%) |
| Total | 385 (21.9%) | 647 (30.1%) |
Income Above Poverty by Sex and Age in Winnfield
According to the poverty statistics in Winnfield, males aged 15 years and females aged 16 and 17 years are the age groups that are most secure financially, with 100.0% of males and 100.0% of females in these age groups living above the poverty line.
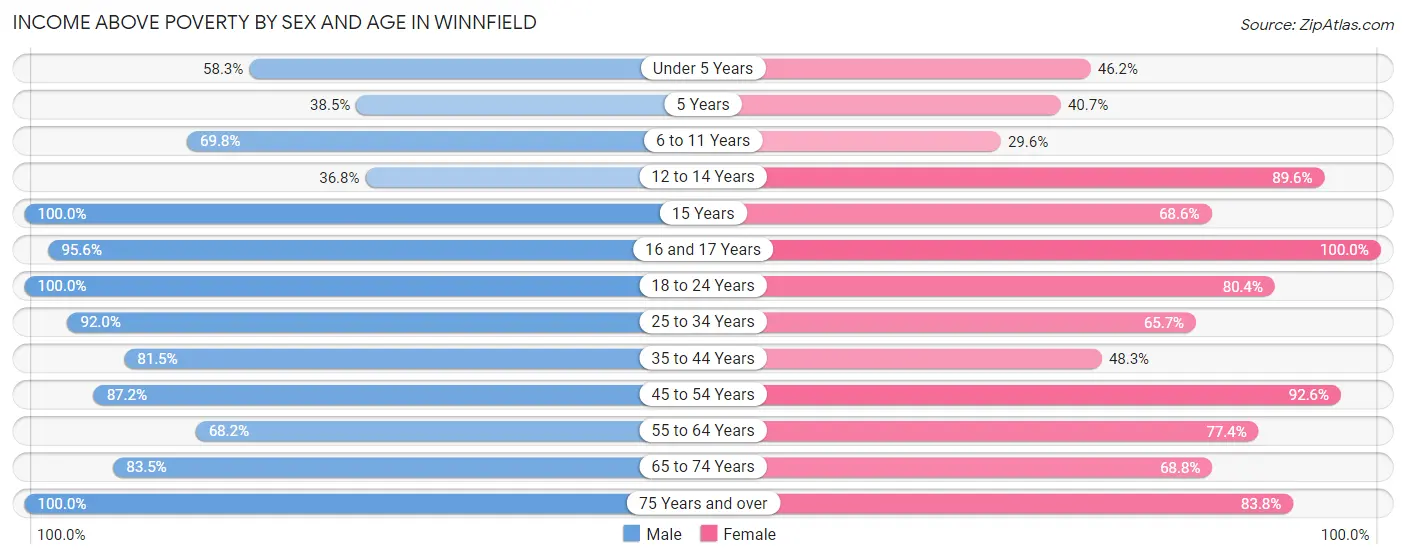
| Age Bracket | Male | Female |
| Under 5 Years | 56 (58.3%) | 110 (46.2%) |
| 5 Years | 15 (38.5%) | 24 (40.7%) |
| 6 to 11 Years | 162 (69.8%) | 26 (29.5%) |
| 12 to 14 Years | 50 (36.8%) | 163 (89.6%) |
| 15 Years | 5 (100.0%) | 24 (68.6%) |
| 16 and 17 Years | 43 (95.6%) | 27 (100.0%) |
| 18 to 24 Years | 125 (100.0%) | 225 (80.4%) |
| 25 to 34 Years | 369 (92.0%) | 140 (65.7%) |
| 35 to 44 Years | 154 (81.5%) | 113 (48.3%) |
| 45 to 54 Years | 129 (87.2%) | 264 (92.6%) |
| 55 to 64 Years | 131 (68.2%) | 181 (77.3%) |
| 65 to 74 Years | 81 (83.5%) | 110 (68.8%) |
| 75 Years and over | 55 (100.0%) | 98 (83.8%) |
| Total | 1,375 (78.1%) | 1,505 (69.9%) |
Income Below Poverty Among Married-Couple Families in Winnfield
The poverty statistics for married-couple families in Winnfield show that 22.0% or 72 of the total 328 families live below the poverty line. Families with 3 or 4 children have the highest poverty rate of 100.0%, comprising of 24 families. On the other hand, families with 1 or 2 children have the lowest poverty rate of 13.2%, which includes 21 families.
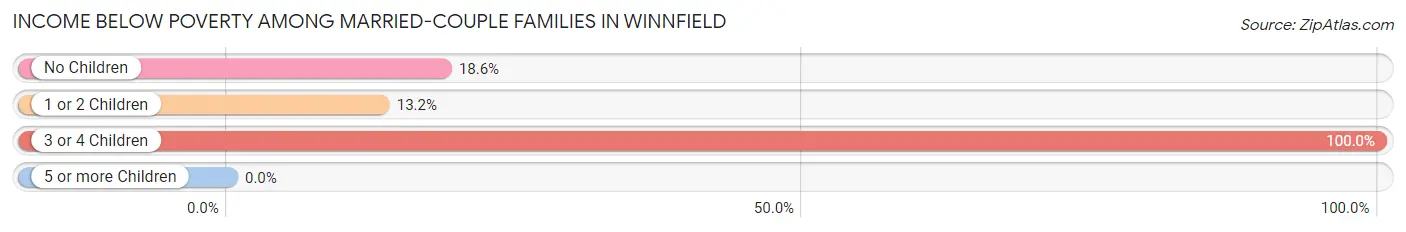
| Children | Above Poverty | Below Poverty |
| No Children | 118 (81.4%) | 27 (18.6%) |
| 1 or 2 Children | 138 (86.8%) | 21 (13.2%) |
| 3 or 4 Children | 0 (0.0%) | 24 (100.0%) |
| 5 or more Children | 0 (0.0%) | 0 (0.0%) |
| Total | 256 (78.0%) | 72 (22.0%) |
Income Below Poverty Among Single-Parent Households in Winnfield
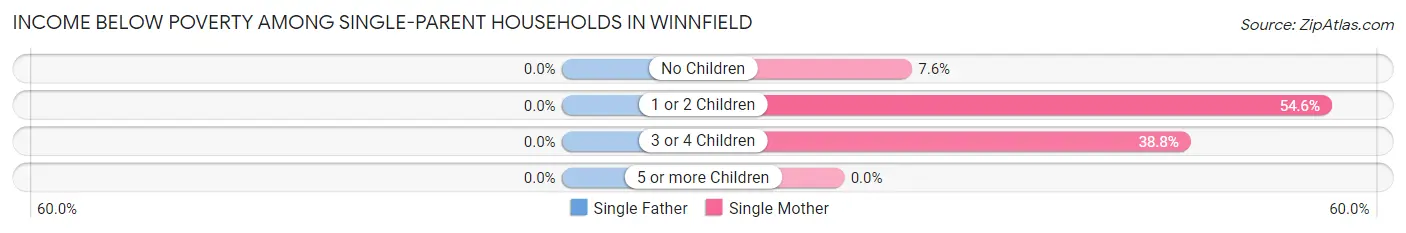
| Children | Single Father | Single Mother |
| No Children | 0 (0.0%) | 13 (7.6%) |
| 1 or 2 Children | 0 (0.0%) | 90 (54.5%) |
| 3 or 4 Children | 0 (0.0%) | 38 (38.8%) |
| 5 or more Children | 0 (0.0%) | 0 (0.0%) |
| Total | 0 (0.0%) | 141 (32.4%) |
Income Below Poverty Among Married-Couple vs Single-Parent Households in Winnfield
The poverty data for Winnfield shows that 72 of the married-couple family households (22.0%) and 141 of the single-parent households (28.9%) are living below the poverty level. Within the married-couple family households, those with 3 or 4 children have the highest poverty rate, with 24 households (100.0%) falling below the poverty line. Among the single-parent households, those with 1 or 2 children have the highest poverty rate, with 90 household (52.0%) living below poverty.
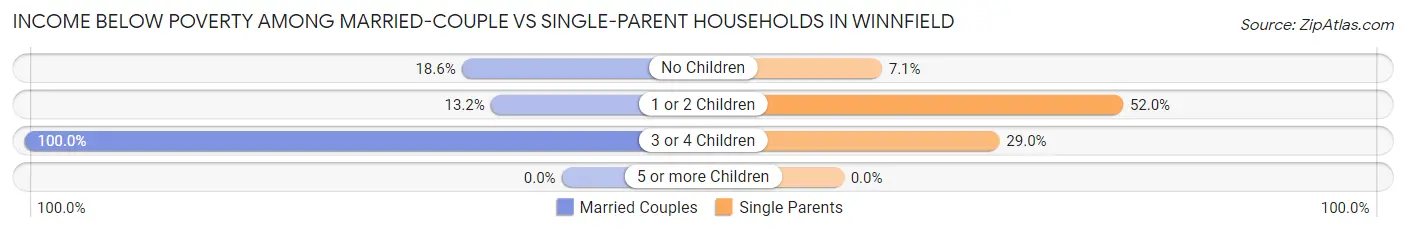
| Children | Married-Couple Families | Single-Parent Households |
| No Children | 27 (18.6%) | 13 (7.1%) |
| 1 or 2 Children | 21 (13.2%) | 90 (52.0%) |
| 3 or 4 Children | 24 (100.0%) | 38 (29.0%) |
| 5 or more Children | 0 (0.0%) | 0 (0.0%) |
| Total | 72 (22.0%) | 141 (28.9%) |
Race in Winnfield
The most populous races in Winnfield are Black / African American (2,373 | 57.5%), White / Caucasian (1,576 | 38.2%), and Hispanic or Latino (235 | 5.7%).
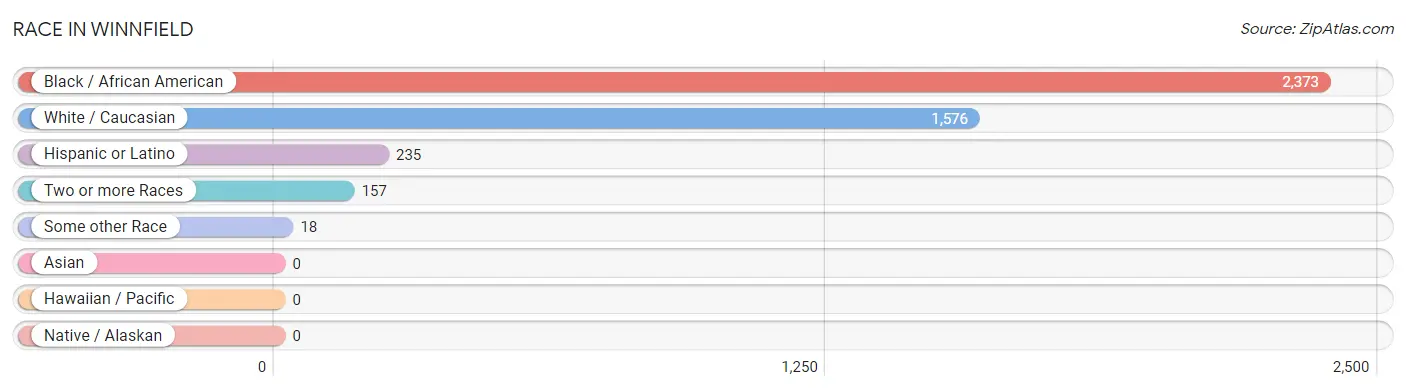
| Race | # Population | % Population |
| Asian | 0 | 0.0% |
| Black / African American | 2,373 | 57.5% |
| Hawaiian / Pacific | 0 | 0.0% |
| Hispanic or Latino | 235 | 5.7% |
| Native / Alaskan | 0 | 0.0% |
| White / Caucasian | 1,576 | 38.2% |
| Two or more Races | 157 | 3.8% |
| Some other Race | 18 | 0.4% |
| Total | 4,124 | 100.0% |
Ancestry in Winnfield
The most populous ancestries reported in Winnfield are English (233 | 5.7%), Irish (214 | 5.2%), Scottish (128 | 3.1%), American (89 | 2.2%), and German (70 | 1.7%), together accounting for 17.8% of all Winnfield residents.
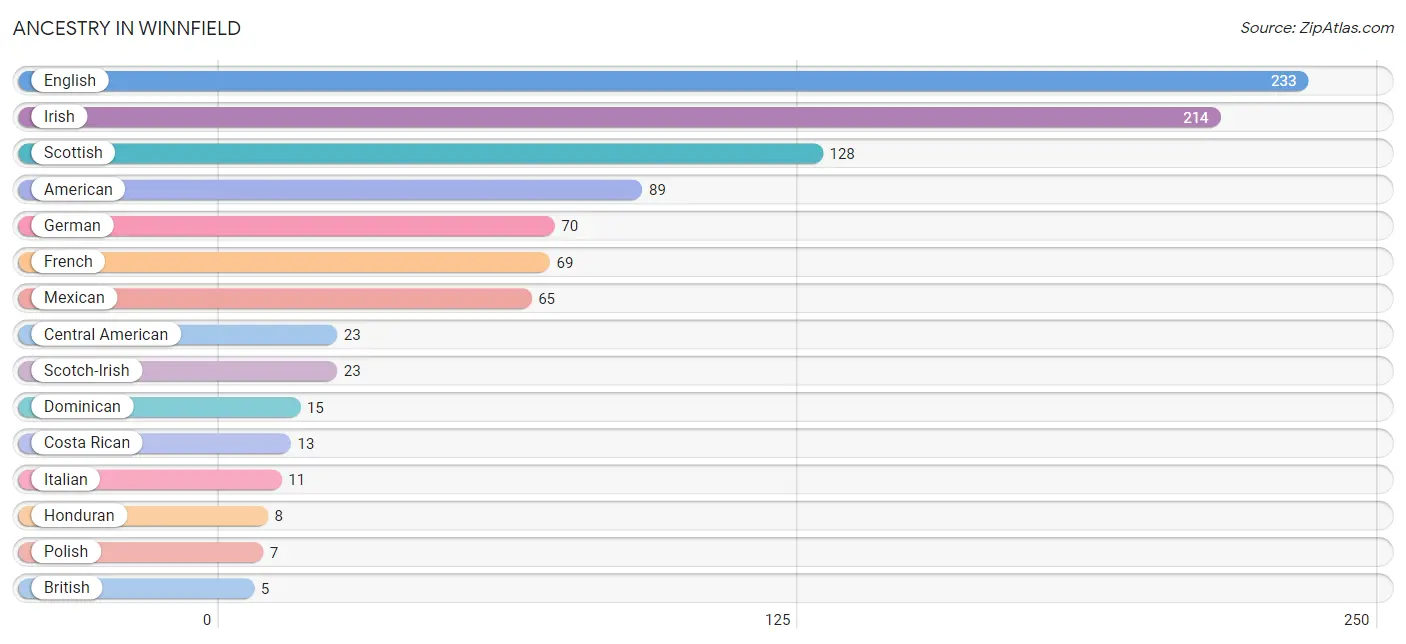
| Ancestry | # Population | % Population |
| American | 89 | 2.2% |
| British | 5 | 0.1% |
| Central American | 23 | 0.6% |
| Costa Rican | 13 | 0.3% |
| Dominican | 15 | 0.4% |
| Dutch | 3 | 0.1% |
| English | 233 | 5.7% |
| French | 69 | 1.7% |
| German | 70 | 1.7% |
| Honduran | 8 | 0.2% |
| Irish | 214 | 5.2% |
| Italian | 11 | 0.3% |
| Mexican | 65 | 1.6% |
| Nicaraguan | 2 | 0.1% |
| Polish | 7 | 0.2% |
| Scotch-Irish | 23 | 0.6% |
| Scottish | 128 | 3.1% |
| Sioux | 1 | 0.0% |
| Swedish | 3 | 0.1% | View All 19 Rows |
Immigrants in Winnfield
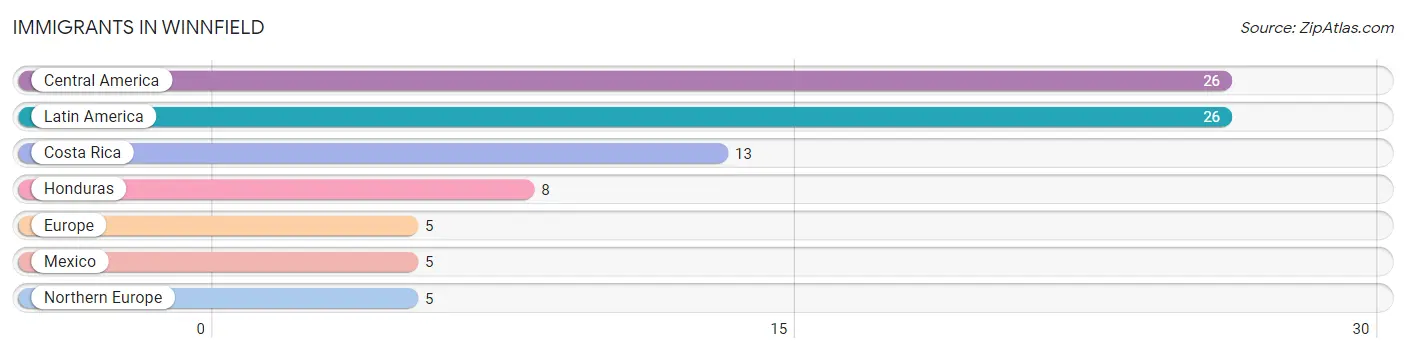
The most numerous immigrant groups reported in Winnfield came from Central America (26 | 0.6%), Latin America (26 | 0.6%), Costa Rica (13 | 0.3%), Honduras (8 | 0.2%), and Europe (5 | 0.1%), together accounting for 1.9% of all Winnfield residents.
| Immigration Origin | # Population | % Population |
| Central America | 26 | 0.6% |
| Costa Rica | 13 | 0.3% |
| Europe | 5 | 0.1% |
| Honduras | 8 | 0.2% |
| Latin America | 26 | 0.6% |
| Mexico | 5 | 0.1% |
| Northern Europe | 5 | 0.1% | View All 7 Rows |
Sex and Age in Winnfield
Sex and Age in Winnfield
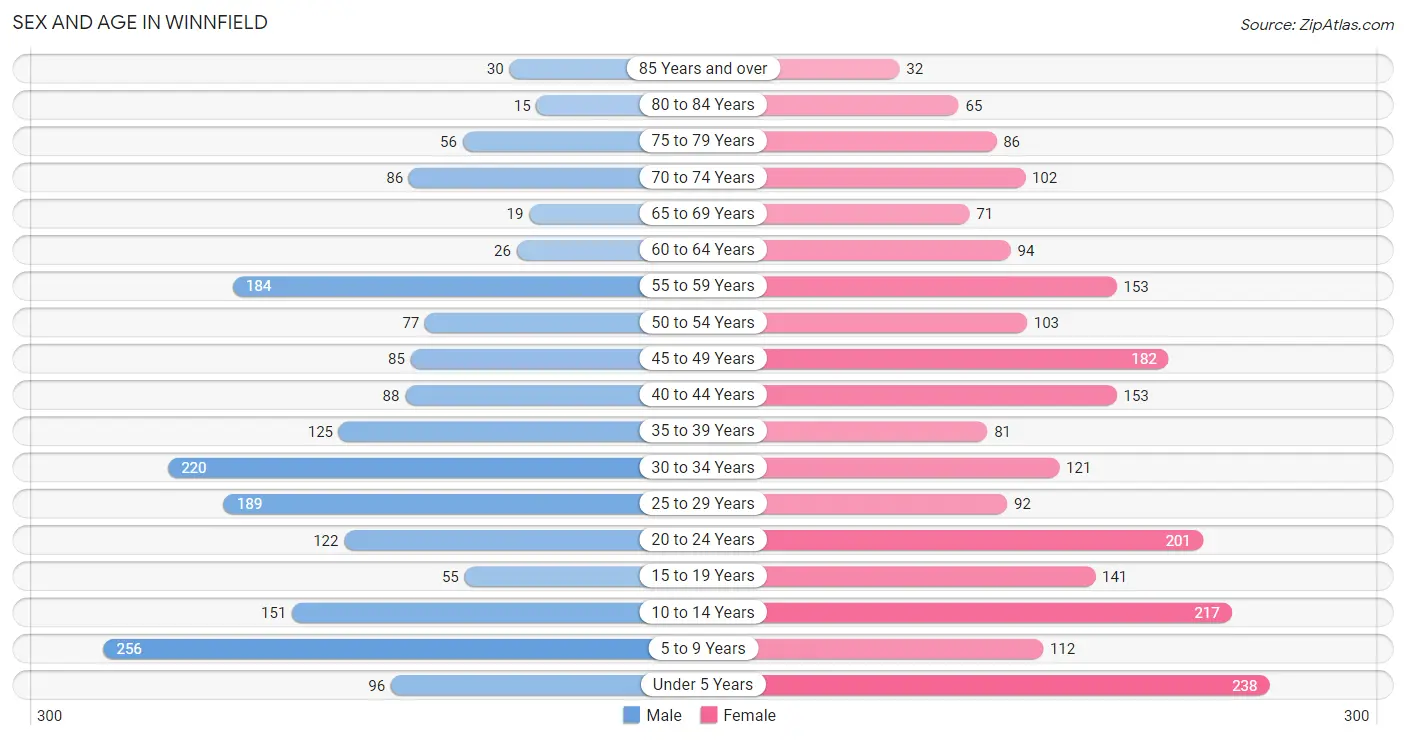
The most populous age groups in Winnfield are 5 to 9 Years (256 | 13.6%) for men and Under 5 Years (238 | 10.6%) for women.
| Age Bracket | Male | Female |
| Under 5 Years | 96 (5.1%) | 238 (10.6%) |
| 5 to 9 Years | 256 (13.6%) | 112 (5.0%) |
| 10 to 14 Years | 151 (8.0%) | 217 (9.7%) |
| 15 to 19 Years | 55 (2.9%) | 141 (6.3%) |
| 20 to 24 Years | 122 (6.5%) | 201 (9.0%) |
| 25 to 29 Years | 189 (10.1%) | 92 (4.1%) |
| 30 to 34 Years | 220 (11.7%) | 121 (5.4%) |
| 35 to 39 Years | 125 (6.7%) | 81 (3.6%) |
| 40 to 44 Years | 88 (4.7%) | 153 (6.8%) |
| 45 to 49 Years | 85 (4.5%) | 182 (8.1%) |
| 50 to 54 Years | 77 (4.1%) | 103 (4.6%) |
| 55 to 59 Years | 184 (9.8%) | 153 (6.8%) |
| 60 to 64 Years | 26 (1.4%) | 94 (4.2%) |
| 65 to 69 Years | 19 (1.0%) | 71 (3.2%) |
| 70 to 74 Years | 86 (4.6%) | 102 (4.5%) |
| 75 to 79 Years | 56 (3.0%) | 86 (3.8%) |
| 80 to 84 Years | 15 (0.8%) | 65 (2.9%) |
| 85 Years and over | 30 (1.6%) | 32 (1.4%) |
| Total | 1,880 (100.0%) | 2,244 (100.0%) |
Families and Households in Winnfield
Median Family Size in Winnfield
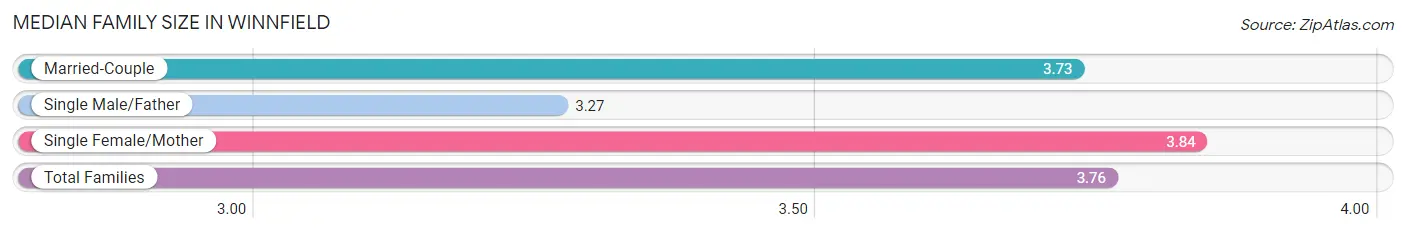
The median family size in Winnfield is 3.76 persons per family, with single female/mother families (435 | 53.4%) accounting for the largest median family size of 3.84 persons per family. On the other hand, single male/father families (52 | 6.4%) represent the smallest median family size with 3.27 persons per family.
| Family Type | # Families | Family Size |
| Married-Couple | 328 (40.3%) | 3.73 |
| Single Male/Father | 52 (6.4%) | 3.27 |
| Single Female/Mother | 435 (53.4%) | 3.84 |
| Total Families | 815 (100.0%) | 3.76 |
Median Household Size in Winnfield
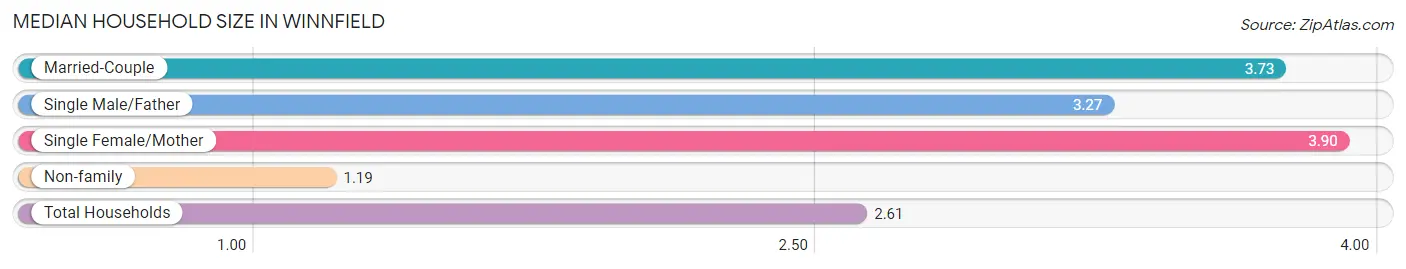
The median household size in Winnfield is 2.61 persons per household, with single female/mother households (435 | 29.1%) accounting for the largest median household size of 3.9 persons per household. non-family households (682 | 45.6%) represent the smallest median household size with 1.19 persons per household.
| Household Type | # Households | Household Size |
| Married-Couple | 328 (21.9%) | 3.73 |
| Single Male/Father | 52 (3.5%) | 3.27 |
| Single Female/Mother | 435 (29.1%) | 3.90 |
| Non-family | 682 (45.6%) | 1.19 |
| Total Households | 1,497 (100.0%) | 2.61 |
Household Size by Marriage Status in Winnfield
Out of a total of 1,497 households in Winnfield, 815 (54.4%) are family households, while 682 (45.6%) are nonfamily households. The most numerous type of family households are 2-person households, comprising 390, and the most common type of nonfamily households are 1-person households, comprising 586.
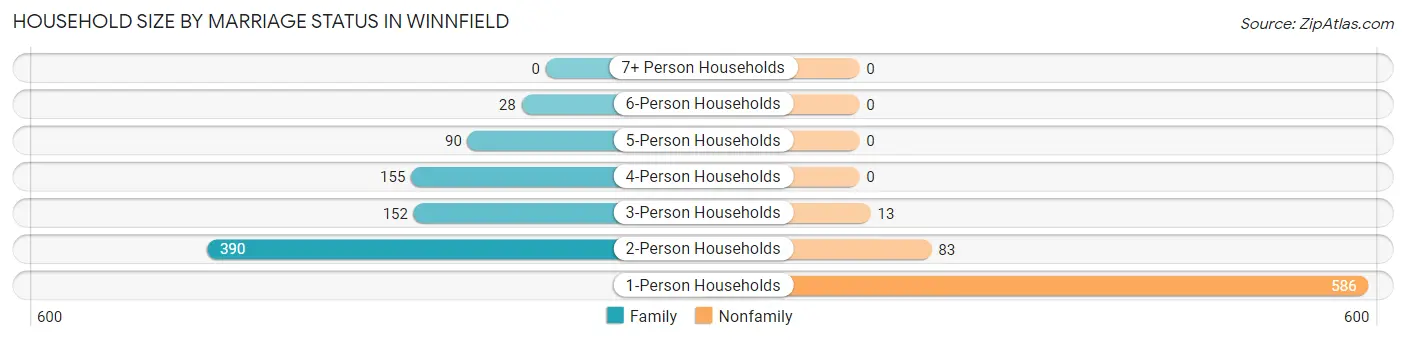
| Household Size | Family Households | Nonfamily Households |
| 1-Person Households | - | 586 (39.1%) |
| 2-Person Households | 390 (26.1%) | 83 (5.5%) |
| 3-Person Households | 152 (10.2%) | 13 (0.9%) |
| 4-Person Households | 155 (10.3%) | 0 (0.0%) |
| 5-Person Households | 90 (6.0%) | 0 (0.0%) |
| 6-Person Households | 28 (1.9%) | 0 (0.0%) |
| 7+ Person Households | 0 (0.0%) | 0 (0.0%) |
| Total | 815 (54.4%) | 682 (45.6%) |
Female Fertility in Winnfield
Fertility by Age in Winnfield
Average fertility rate in Winnfield is 27.0 births per 1,000 women. Women in the age bracket of 20 to 34 years have the highest fertility rate with 68.0 births per 1,000 women. Women in the age bracket of 20 to 34 years acount for 100.0% of all women with births.
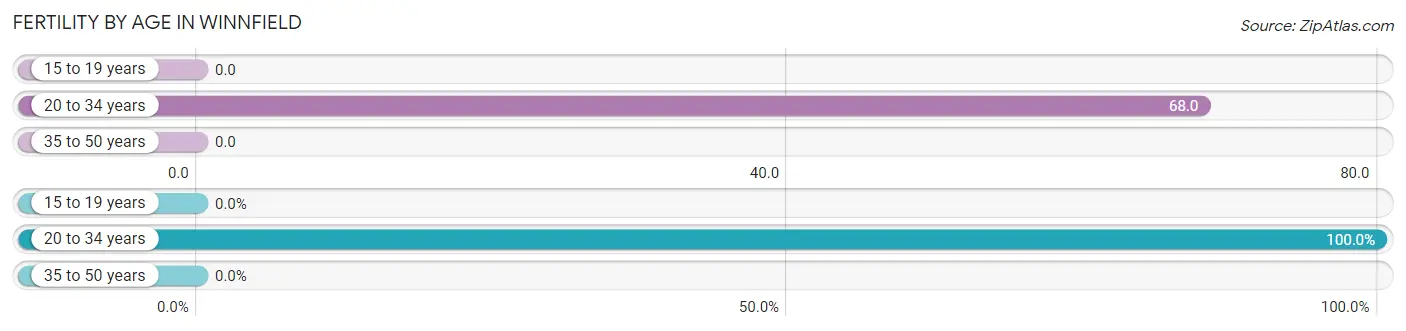
| Age Bracket | Women with Births | Births / 1,000 Women |
| 15 to 19 years | 0 (0.0%) | 0.0 |
| 20 to 34 years | 28 (100.0%) | 68.0 |
| 35 to 50 years | 0 (0.0%) | 0.0 |
| Total | 28 (100.0%) | 27.0 |
Fertility by Age by Marriage Status in Winnfield
25.0% of women with births (28) in Winnfield are married. The highest percentage of unmarried women with births falls into 20 to 34 years age bracket with 75.0% of them unmarried at the time of birth, while the lowest percentage of unmarried women with births belong to 20 to 34 years age bracket with 75.0% of them unmarried.
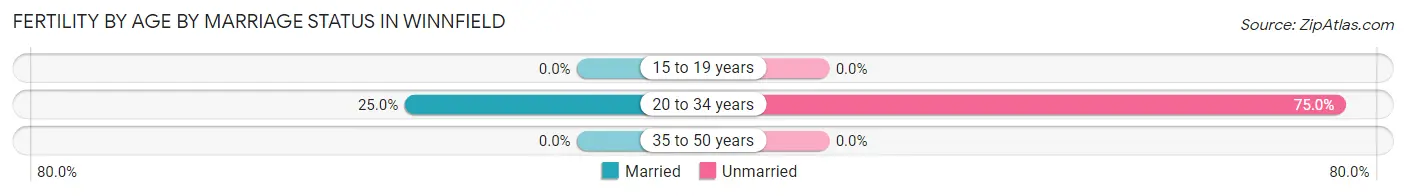
| Age Bracket | Married | Unmarried |
| 15 to 19 years | 0 (0.0%) | 0 (0.0%) |
| 20 to 34 years | 7 (25.0%) | 21 (75.0%) |
| 35 to 50 years | 0 (0.0%) | 0 (0.0%) |
| Total | 7 (25.0%) | 21 (75.0%) |
Fertility by Education in Winnfield
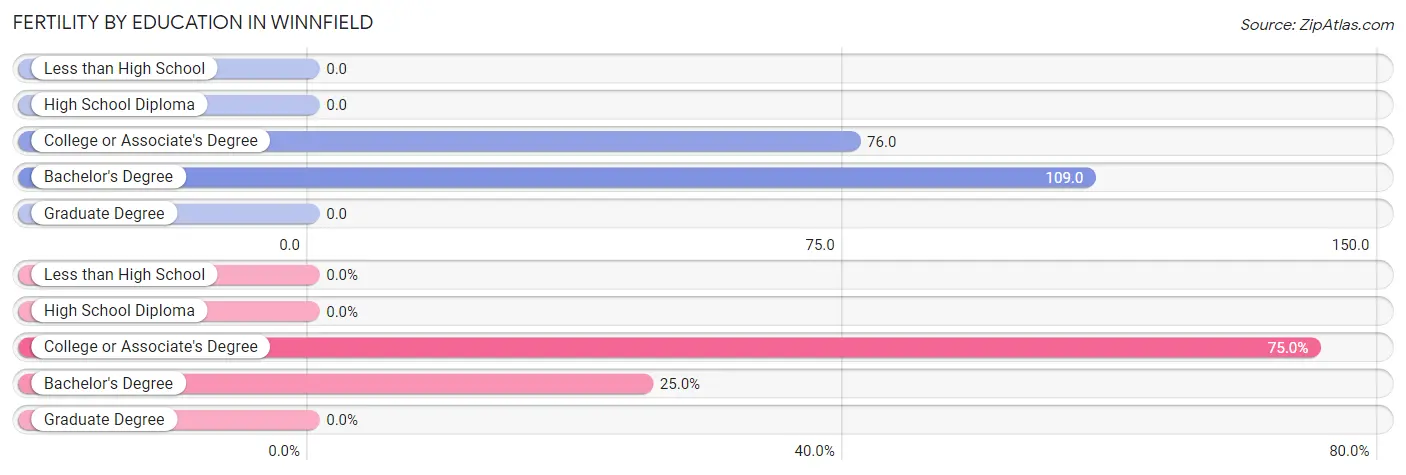
| Educational Attainment | Women with Births | Births / 1,000 Women |
| Less than High School | 0 (0.0%) | 0.0 |
| High School Diploma | 0 (0.0%) | 0.0 |
| College or Associate's Degree | 21 (75.0%) | 76.0 |
| Bachelor's Degree | 7 (25.0%) | 109.0 |
| Graduate Degree | 0 (0.0%) | 0.0 |
| Total | 28 (100.0%) | 27.0 |
Fertility by Education by Marriage Status in Winnfield
75.0% of women with births in Winnfield are unmarried. Women with the educational attainment of bachelor's degree are most likely to be married with 100.0% of them married at childbirth, while women with the educational attainment of college or associate's degree are least likely to be married with 100.0% of them unmarried at childbirth.
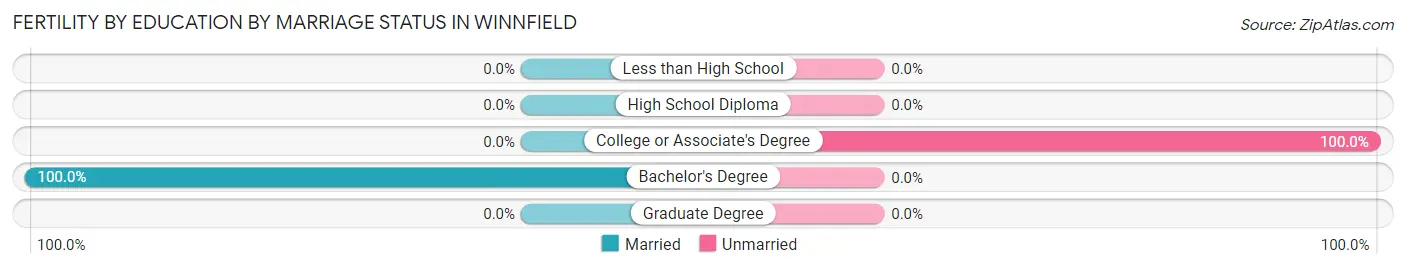
| Educational Attainment | Married | Unmarried |
| Less than High School | 0 (0.0%) | 0 (0.0%) |
| High School Diploma | 0 (0.0%) | 0 (0.0%) |
| College or Associate's Degree | 0 (0.0%) | 21 (100.0%) |
| Bachelor's Degree | 7 (100.0%) | 0 (0.0%) |
| Graduate Degree | 0 (0.0%) | 0 (0.0%) |
| Total | 7 (25.0%) | 21 (75.0%) |
Employment Characteristics in Winnfield
Employment by Class of Employer in Winnfield
Among the 1,520 employed individuals in Winnfield, private company employees (1,072 | 70.5%), state government employees (269 | 17.7%), and local government employees (125 | 8.2%) make up the most common classes of employment.
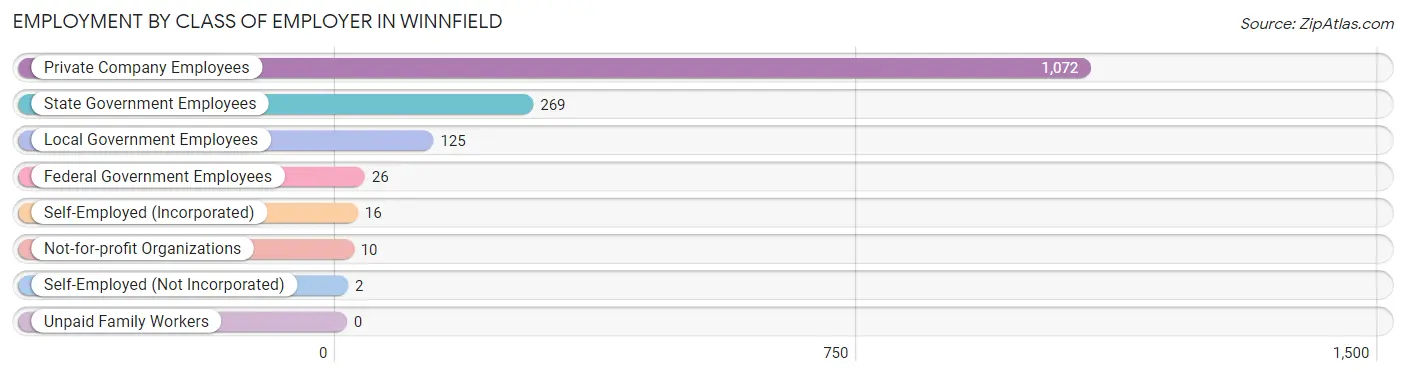
| Employer Class | # Employees | % Employees |
| Private Company Employees | 1,072 | 70.5% |
| Self-Employed (Incorporated) | 16 | 1.1% |
| Self-Employed (Not Incorporated) | 2 | 0.1% |
| Not-for-profit Organizations | 10 | 0.7% |
| Local Government Employees | 125 | 8.2% |
| State Government Employees | 269 | 17.7% |
| Federal Government Employees | 26 | 1.7% |
| Unpaid Family Workers | 0 | 0.0% |
| Total | 1,520 | 100.0% |
Employment Status by Age in Winnfield
According to the labor force statistics for Winnfield, out of the total population over 16 years of age (3,014), 56.4% or 1,700 individuals are in the labor force, with 8.1% or 138 of them unemployed. The age group with the highest labor force participation rate is 45 to 54 years, with 77.9% or 348 individuals in the labor force. Within the labor force, the 35 to 44 years age range has the highest percentage of unemployed individuals, with 24.7% or 71 of them being unemployed.
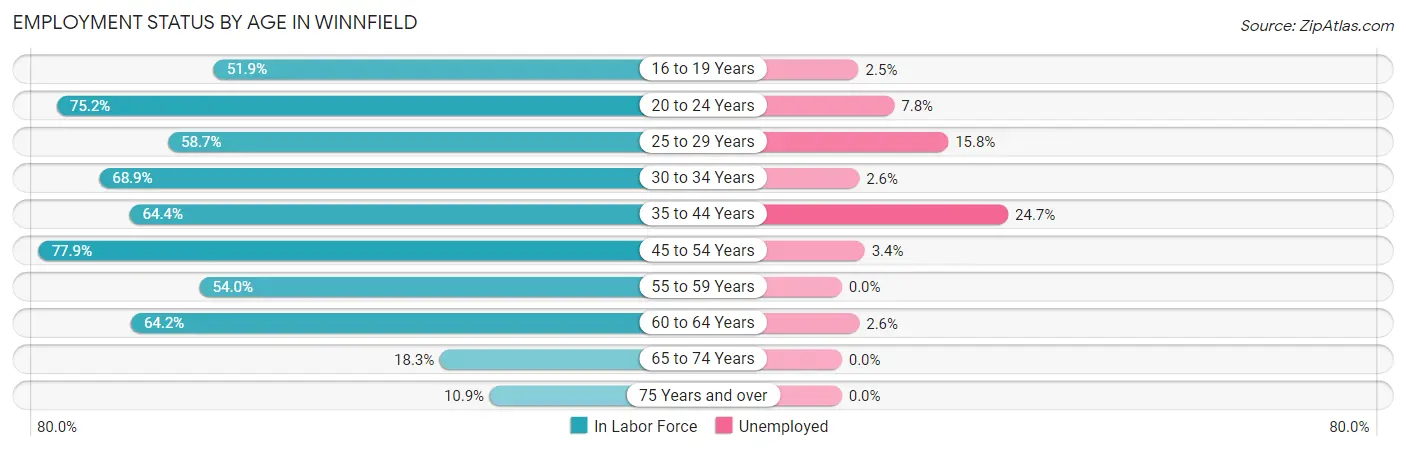
| Age Bracket | In Labor Force | Unemployed |
| 16 to 19 Years | 81 (51.9%) | 2 (2.5%) |
| 20 to 24 Years | 243 (75.2%) | 19 (7.8%) |
| 25 to 29 Years | 165 (58.7%) | 26 (15.8%) |
| 30 to 34 Years | 235 (68.9%) | 6 (2.6%) |
| 35 to 44 Years | 288 (64.4%) | 71 (24.7%) |
| 45 to 54 Years | 348 (77.9%) | 12 (3.4%) |
| 55 to 59 Years | 182 (54.0%) | 0 (0.0%) |
| 60 to 64 Years | 77 (64.2%) | 2 (2.6%) |
| 65 to 74 Years | 51 (18.3%) | 0 (0.0%) |
| 75 Years and over | 31 (10.9%) | 0 (0.0%) |
| Total | 1,700 (56.4%) | 138 (8.1%) |
Employment Status by Educational Attainment in Winnfield
According to labor force statistics for Winnfield, 65.6% of individuals (1,294) out of the total population between 25 and 64 years of age (1,973) are in the labor force, with 9.0% or 116 of them being unemployed. The group with the highest labor force participation rate are those with the educational attainment of bachelor's degree or higher, with 95.0% or 190 individuals in the labor force. Within the labor force, individuals with college / associate degree education have the highest percentage of unemployment, with 15.9% or 49 of them being unemployed.
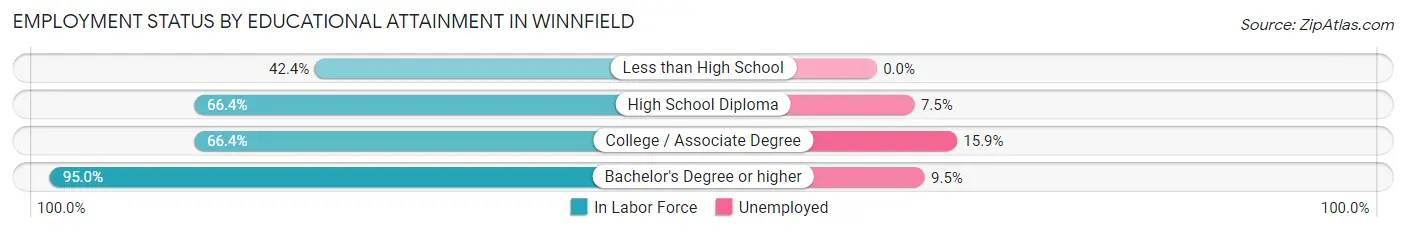
| Educational Attainment | In Labor Force | Unemployed |
| Less than High School | 128 (42.4%) | 0 (0.0%) |
| High School Diploma | 669 (66.4%) | 76 (7.5%) |
| College / Associate Degree | 308 (66.4%) | 74 (15.9%) |
| Bachelor's Degree or higher | 190 (95.0%) | 19 (9.5%) |
| Total | 1,294 (65.6%) | 178 (9.0%) |
Employment Occupations by Sex in Winnfield
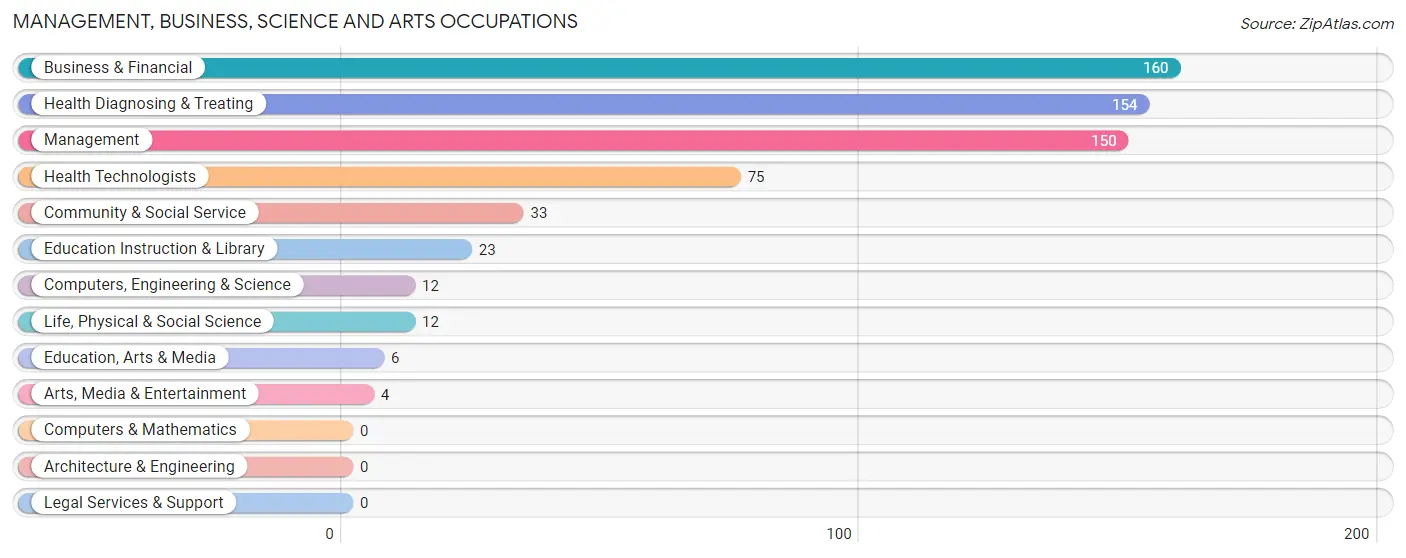
Management, Business, Science and Arts Occupations
The most common Management, Business, Science and Arts occupations in Winnfield are Business & Financial (160 | 10.2%), Health Diagnosing & Treating (154 | 9.9%), Management (150 | 9.6%), Health Technologists (75 | 4.8%), and Community & Social Service (33 | 2.1%).
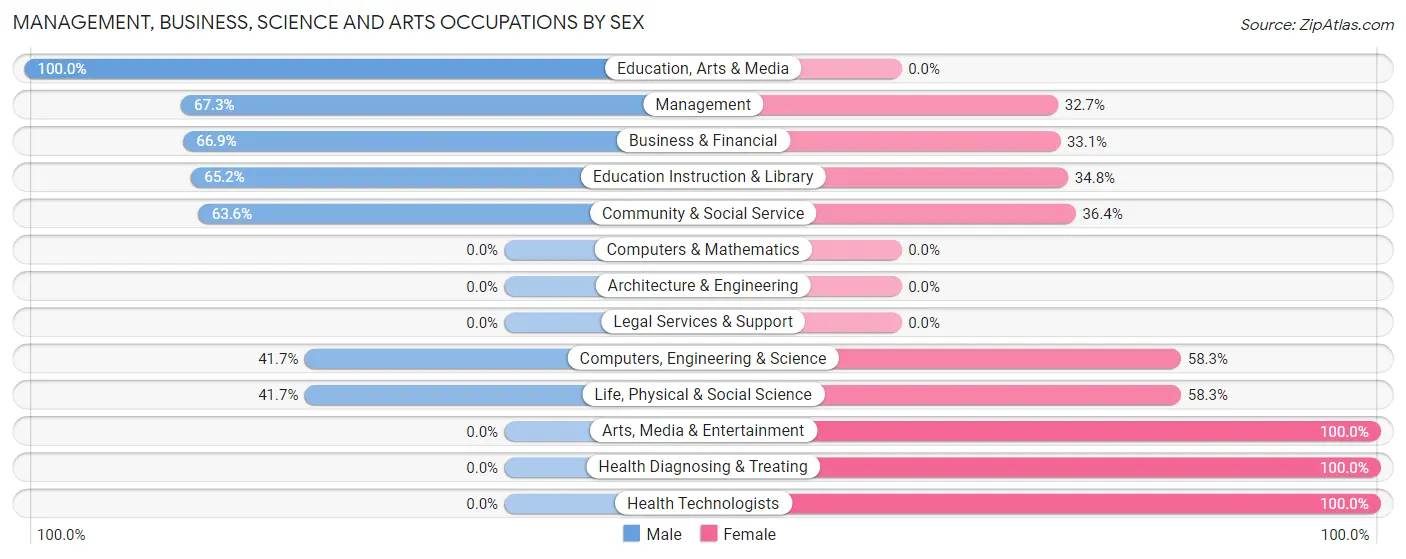
Management, Business, Science and Arts Occupations by Sex
Within the Management, Business, Science and Arts occupations in Winnfield, the most male-oriented occupations are Education, Arts & Media (100.0%), Management (67.3%), and Business & Financial (66.9%), while the most female-oriented occupations are Arts, Media & Entertainment (100.0%), Health Diagnosing & Treating (100.0%), and Health Technologists (100.0%).
| Occupation | Male | Female |
| Management | 101 (67.3%) | 49 (32.7%) |
| Business & Financial | 107 (66.9%) | 53 (33.1%) |
| Computers, Engineering & Science | 5 (41.7%) | 7 (58.3%) |
| Computers & Mathematics | 0 (0.0%) | 0 (0.0%) |
| Architecture & Engineering | 0 (0.0%) | 0 (0.0%) |
| Life, Physical & Social Science | 5 (41.7%) | 7 (58.3%) |
| Community & Social Service | 21 (63.6%) | 12 (36.4%) |
| Education, Arts & Media | 6 (100.0%) | 0 (0.0%) |
| Legal Services & Support | 0 (0.0%) | 0 (0.0%) |
| Education Instruction & Library | 15 (65.2%) | 8 (34.8%) |
| Arts, Media & Entertainment | 0 (0.0%) | 4 (100.0%) |
| Health Diagnosing & Treating | 0 (0.0%) | 154 (100.0%) |
| Health Technologists | 0 (0.0%) | 75 (100.0%) |
| Total (Category) | 234 (46.0%) | 275 (54.0%) |
| Total (Overall) | 731 (46.8%) | 832 (53.2%) |
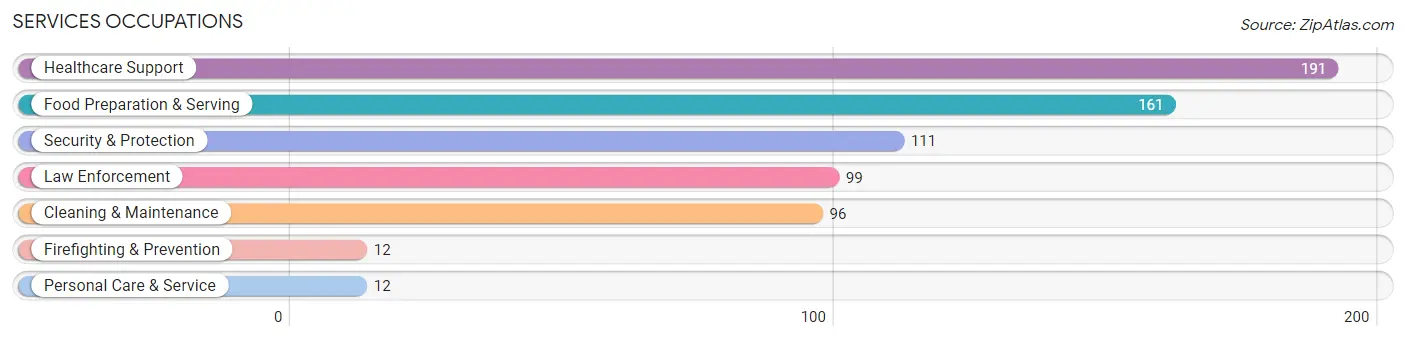
Services Occupations
The most common Services occupations in Winnfield are Healthcare Support (191 | 12.2%), Food Preparation & Serving (161 | 10.3%), Security & Protection (111 | 7.1%), Law Enforcement (99 | 6.3%), and Cleaning & Maintenance (96 | 6.1%).
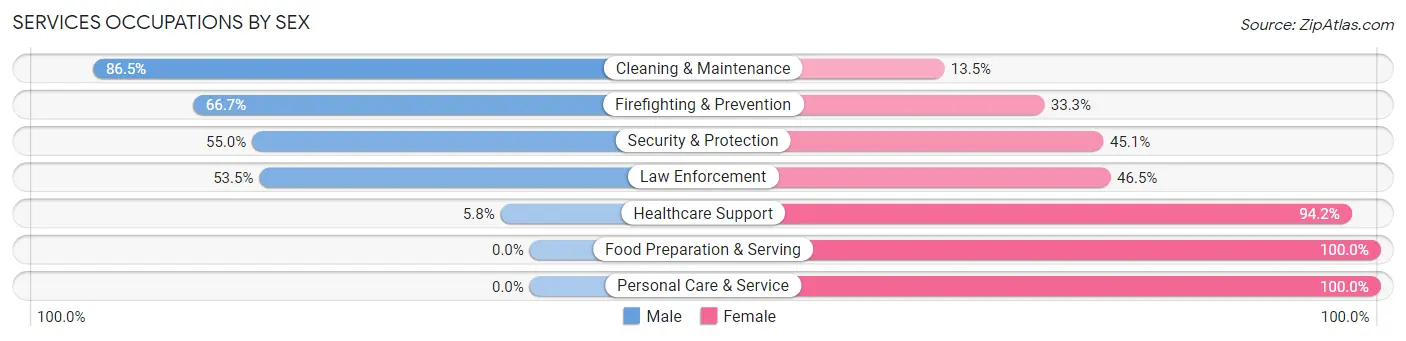
Services Occupations by Sex
Within the Services occupations in Winnfield, the most male-oriented occupations are Cleaning & Maintenance (86.5%), Firefighting & Prevention (66.7%), and Security & Protection (54.9%), while the most female-oriented occupations are Food Preparation & Serving (100.0%), Personal Care & Service (100.0%), and Healthcare Support (94.2%).
| Occupation | Male | Female |
| Healthcare Support | 11 (5.8%) | 180 (94.2%) |
| Security & Protection | 61 (54.9%) | 50 (45.1%) |
| Firefighting & Prevention | 8 (66.7%) | 4 (33.3%) |
| Law Enforcement | 53 (53.5%) | 46 (46.5%) |
| Food Preparation & Serving | 0 (0.0%) | 161 (100.0%) |
| Cleaning & Maintenance | 83 (86.5%) | 13 (13.5%) |
| Personal Care & Service | 0 (0.0%) | 12 (100.0%) |
| Total (Category) | 155 (27.2%) | 416 (72.9%) |
| Total (Overall) | 731 (46.8%) | 832 (53.2%) |
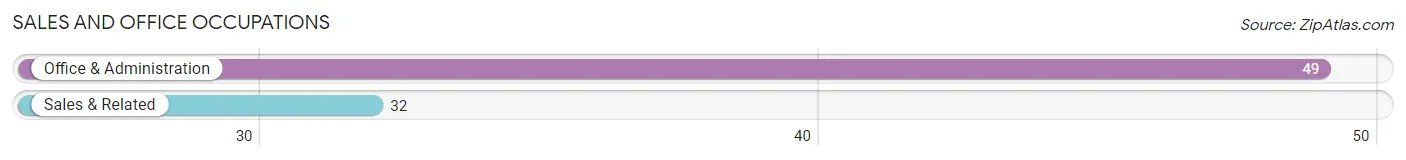
Sales and Office Occupations
The most common Sales and Office occupations in Winnfield are Office & Administration (49 | 3.1%), and Sales & Related (32 | 2.1%).
Sales and Office Occupations by Sex
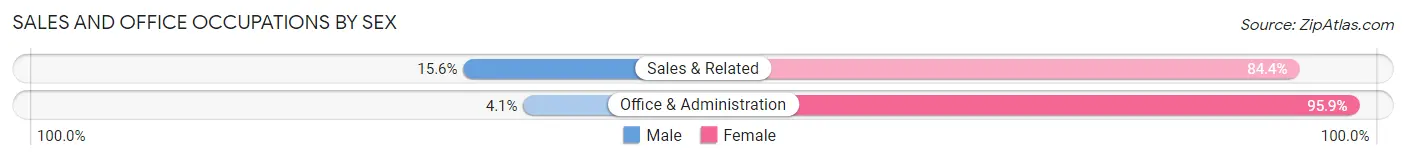
| Occupation | Male | Female |
| Sales & Related | 5 (15.6%) | 27 (84.4%) |
| Office & Administration | 2 (4.1%) | 47 (95.9%) |
| Total (Category) | 7 (8.6%) | 74 (91.4%) |
| Total (Overall) | 731 (46.8%) | 832 (53.2%) |
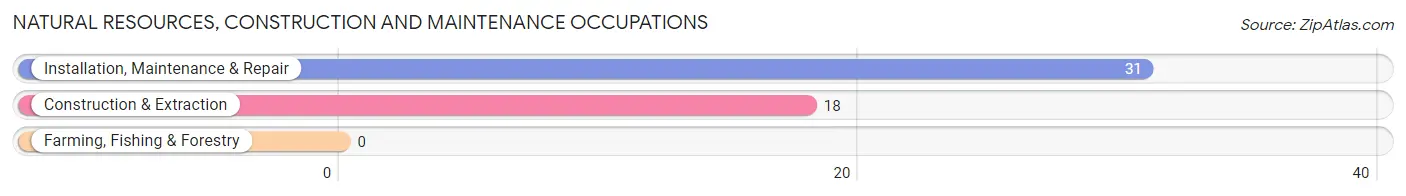
Natural Resources, Construction and Maintenance Occupations
The most common Natural Resources, Construction and Maintenance occupations in Winnfield are Installation, Maintenance & Repair (31 | 2.0%), and Construction & Extraction (18 | 1.1%).
Natural Resources, Construction and Maintenance Occupations by Sex
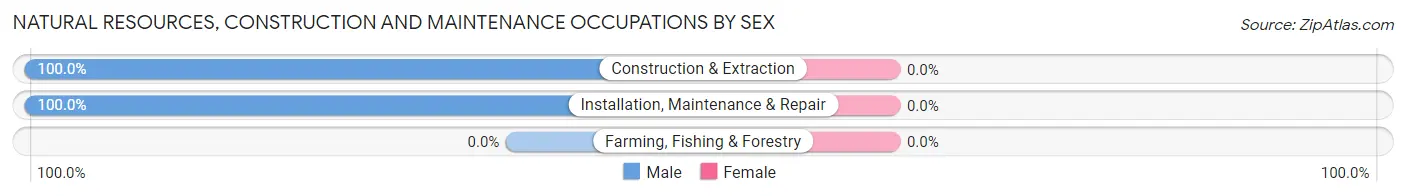
| Occupation | Male | Female |
| Farming, Fishing & Forestry | 0 (0.0%) | 0 (0.0%) |
| Construction & Extraction | 18 (100.0%) | 0 (0.0%) |
| Installation, Maintenance & Repair | 31 (100.0%) | 0 (0.0%) |
| Total (Category) | 49 (100.0%) | 0 (0.0%) |
| Total (Overall) | 731 (46.8%) | 832 (53.2%) |
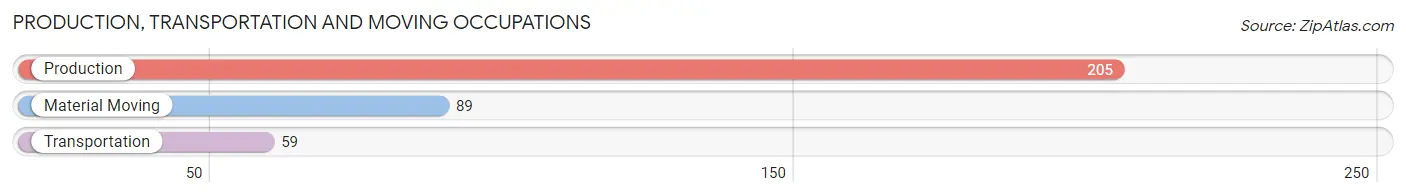
Production, Transportation and Moving Occupations
The most common Production, Transportation and Moving occupations in Winnfield are Production (205 | 13.1%), Material Moving (89 | 5.7%), and Transportation (59 | 3.8%).
Production, Transportation and Moving Occupations by Sex
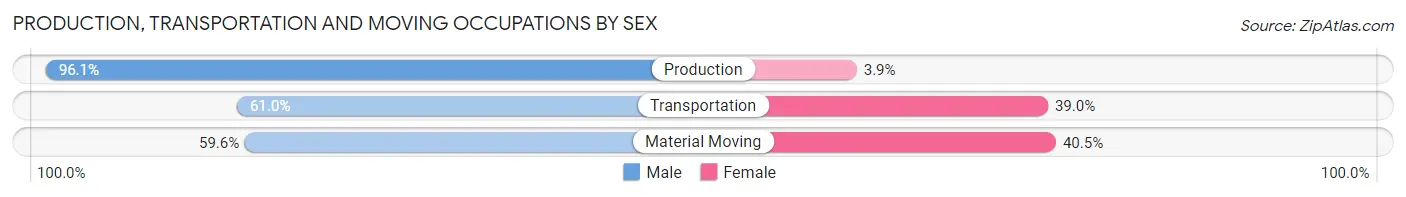
| Occupation | Male | Female |
| Production | 197 (96.1%) | 8 (3.9%) |
| Transportation | 36 (61.0%) | 23 (39.0%) |
| Material Moving | 53 (59.6%) | 36 (40.5%) |
| Total (Category) | 286 (81.0%) | 67 (19.0%) |
| Total (Overall) | 731 (46.8%) | 832 (53.2%) |
Employment Industries by Sex in Winnfield
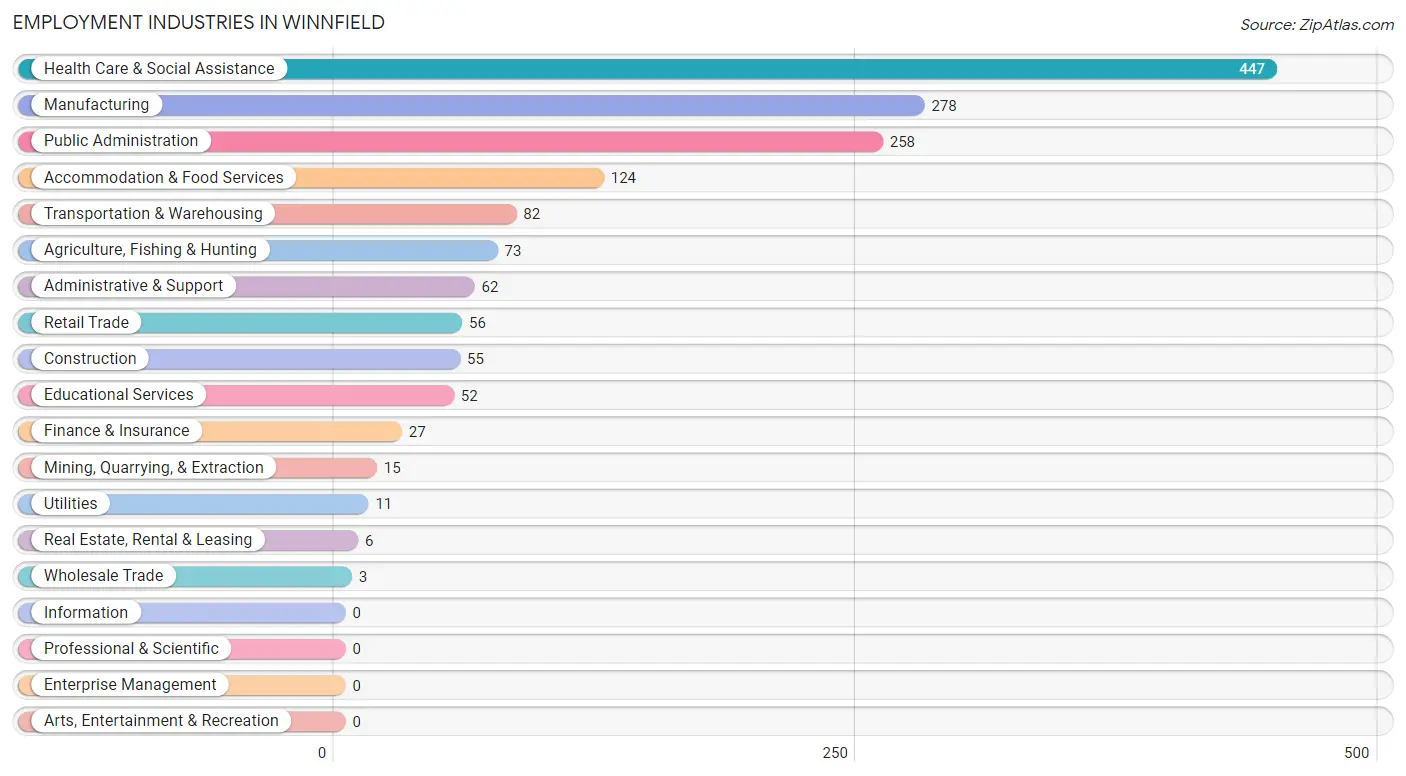
Employment Industries in Winnfield
The major employment industries in Winnfield include Health Care & Social Assistance (447 | 28.6%), Manufacturing (278 | 17.8%), Public Administration (258 | 16.5%), Accommodation & Food Services (124 | 7.9%), and Transportation & Warehousing (82 | 5.2%).
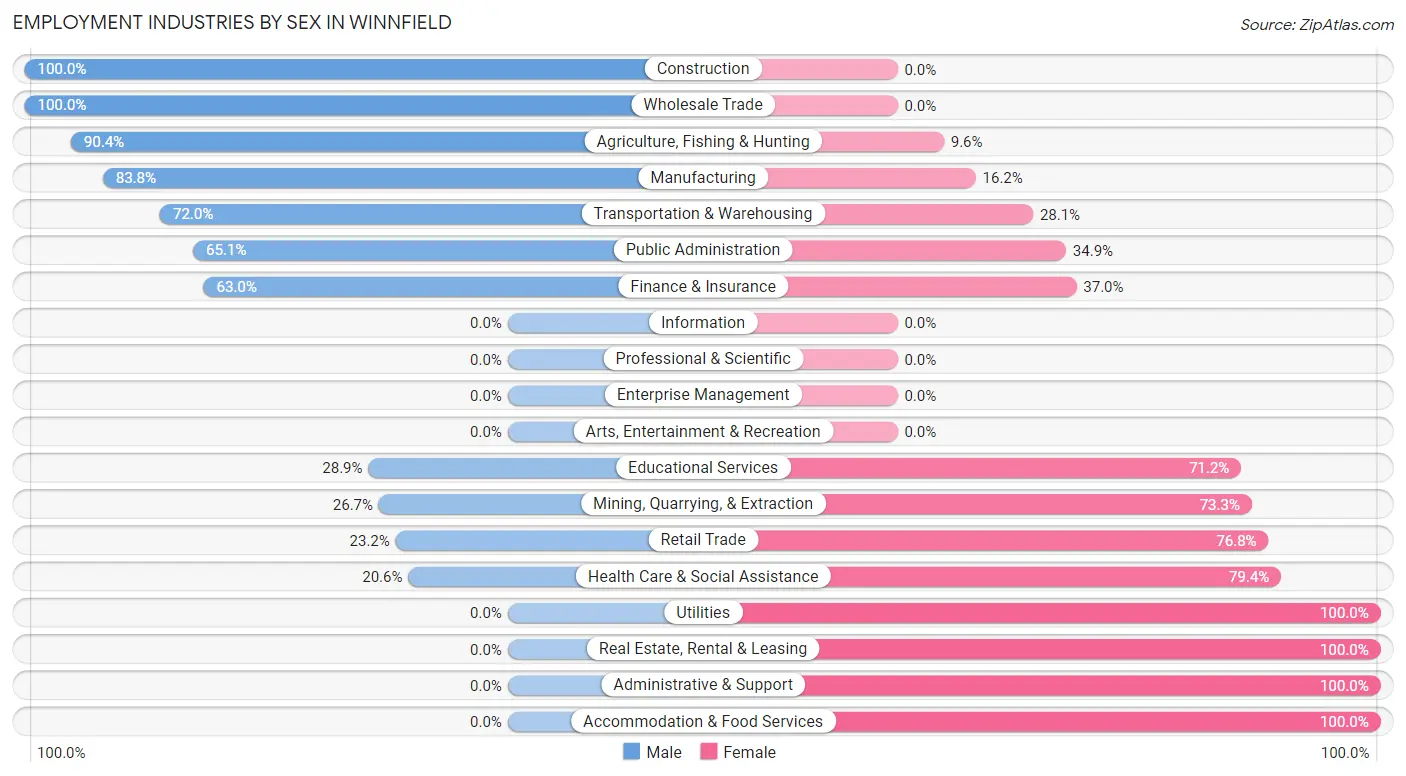
Employment Industries by Sex in Winnfield
The Winnfield industries that see more men than women are Construction (100.0%), Wholesale Trade (100.0%), and Agriculture, Fishing & Hunting (90.4%), whereas the industries that tend to have a higher number of women are Utilities (100.0%), Real Estate, Rental & Leasing (100.0%), and Administrative & Support (100.0%).
| Industry | Male | Female |
| Agriculture, Fishing & Hunting | 66 (90.4%) | 7 (9.6%) |
| Mining, Quarrying, & Extraction | 4 (26.7%) | 11 (73.3%) |
| Construction | 55 (100.0%) | 0 (0.0%) |
| Manufacturing | 233 (83.8%) | 45 (16.2%) |
| Wholesale Trade | 3 (100.0%) | 0 (0.0%) |
| Retail Trade | 13 (23.2%) | 43 (76.8%) |
| Transportation & Warehousing | 59 (72.0%) | 23 (28.1%) |
| Utilities | 0 (0.0%) | 11 (100.0%) |
| Information | 0 (0.0%) | 0 (0.0%) |
| Finance & Insurance | 17 (63.0%) | 10 (37.0%) |
| Real Estate, Rental & Leasing | 0 (0.0%) | 6 (100.0%) |
| Professional & Scientific | 0 (0.0%) | 0 (0.0%) |
| Enterprise Management | 0 (0.0%) | 0 (0.0%) |
| Administrative & Support | 0 (0.0%) | 62 (100.0%) |
| Educational Services | 15 (28.8%) | 37 (71.2%) |
| Health Care & Social Assistance | 92 (20.6%) | 355 (79.4%) |
| Arts, Entertainment & Recreation | 0 (0.0%) | 0 (0.0%) |
| Accommodation & Food Services | 0 (0.0%) | 124 (100.0%) |
| Public Administration | 168 (65.1%) | 90 (34.9%) |
| Total | 731 (46.8%) | 832 (53.2%) |
Education in Winnfield
School Enrollment in Winnfield
The most common levels of schooling among the 1,115 students in Winnfield are elementary school (263 | 23.6%), middle school (262 | 23.5%), and high school (201 | 18.0%).
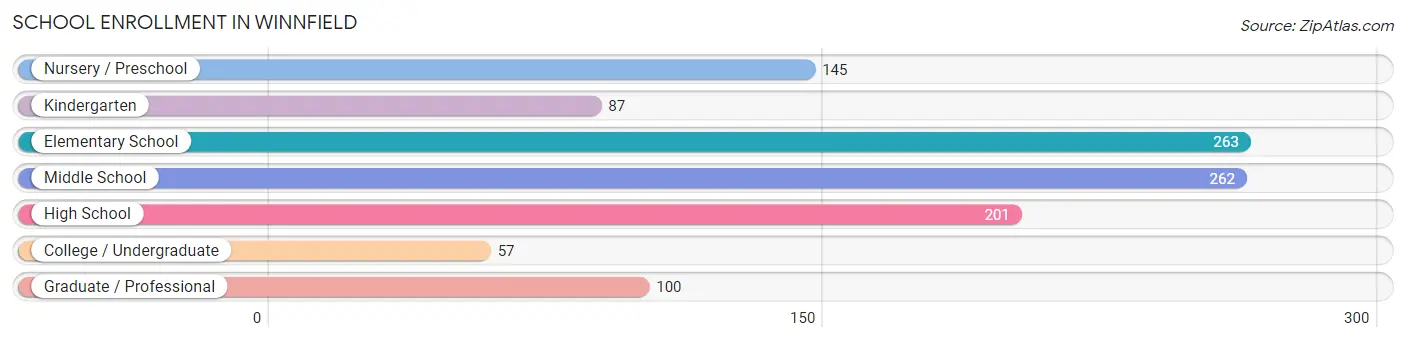
| School Level | # Students | % Students |
| Nursery / Preschool | 145 | 13.0% |
| Kindergarten | 87 | 7.8% |
| Elementary School | 263 | 23.6% |
| Middle School | 262 | 23.5% |
| High School | 201 | 18.0% |
| College / Undergraduate | 57 | 5.1% |
| Graduate / Professional | 100 | 9.0% |
| Total | 1,115 | 100.0% |
School Enrollment by Age by Funding Source in Winnfield
Out of a total of 1,115 students who are enrolled in schools in Winnfield, 36 (3.2%) attend a private institution, while the remaining 1,079 (96.8%) are enrolled in public schools. The age group of 35 years and over has the highest likelihood of being enrolled in private schools, with 8 (32.0% in the age bracket) enrolled. Conversely, the age group of 3 to 4 year olds has the lowest likelihood of being enrolled in a private school, with 129 (100.0% in the age bracket) attending a public institution.
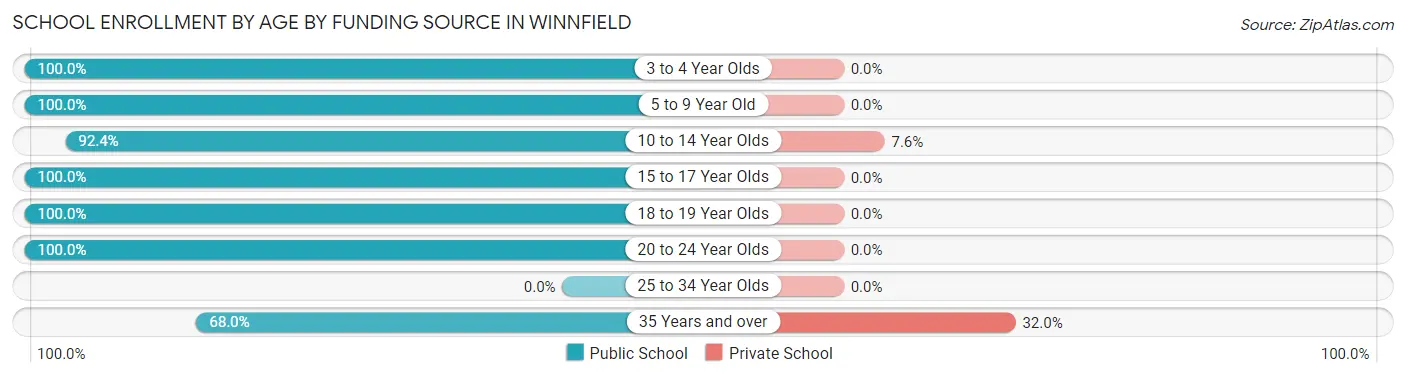
| Age Bracket | Public School | Private School |
| 3 to 4 Year Olds | 129 (100.0%) | 0 (0.0%) |
| 5 to 9 Year Old | 344 (100.0%) | 0 (0.0%) |
| 10 to 14 Year Olds | 340 (92.4%) | 28 (7.6%) |
| 15 to 17 Year Olds | 112 (100.0%) | 0 (0.0%) |
| 18 to 19 Year Olds | 5 (100.0%) | 0 (0.0%) |
| 20 to 24 Year Olds | 132 (100.0%) | 0 (0.0%) |
| 25 to 34 Year Olds | 0 (0.0%) | 0 (0.0%) |
| 35 Years and over | 17 (68.0%) | 8 (32.0%) |
| Total | 1,079 (96.8%) | 36 (3.2%) |
Educational Attainment by Field of Study in Winnfield
Business (106 | 30.8%), education (92 | 26.7%), liberal arts & history (40 | 11.6%), communications (24 | 7.0%), and literature & languages (20 | 5.8%) are the most common fields of study among 344 individuals in Winnfield who have obtained a bachelor's degree or higher.
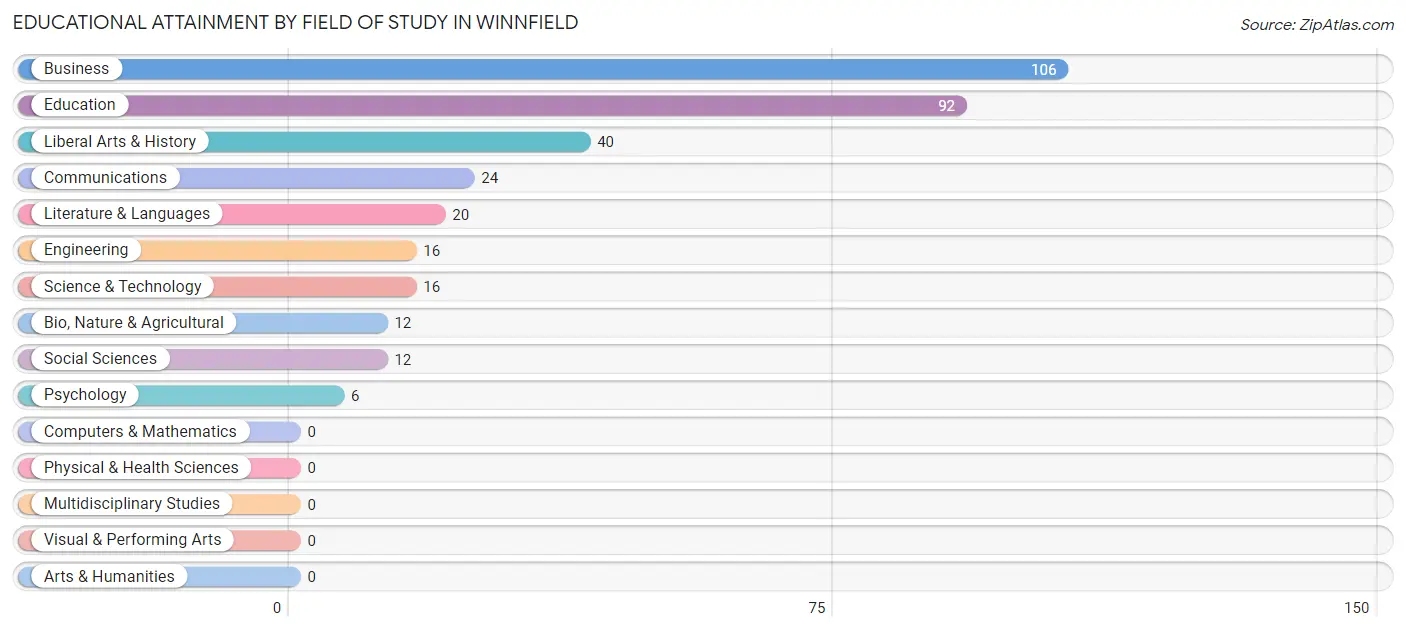
| Field of Study | # Graduates | % Graduates |
| Computers & Mathematics | 0 | 0.0% |
| Bio, Nature & Agricultural | 12 | 3.5% |
| Physical & Health Sciences | 0 | 0.0% |
| Psychology | 6 | 1.7% |
| Social Sciences | 12 | 3.5% |
| Engineering | 16 | 4.6% |
| Multidisciplinary Studies | 0 | 0.0% |
| Science & Technology | 16 | 4.6% |
| Business | 106 | 30.8% |
| Education | 92 | 26.7% |
| Literature & Languages | 20 | 5.8% |
| Liberal Arts & History | 40 | 11.6% |
| Visual & Performing Arts | 0 | 0.0% |
| Communications | 24 | 7.0% |
| Arts & Humanities | 0 | 0.0% |
| Total | 344 | 100.0% |
Transportation & Commute in Winnfield
Vehicle Availability by Sex in Winnfield
The most prevalent vehicle ownership categories in Winnfield are males with 2 vehicles (442, accounting for 60.5%) and females with 2 vehicles (271, making up 56.2%).
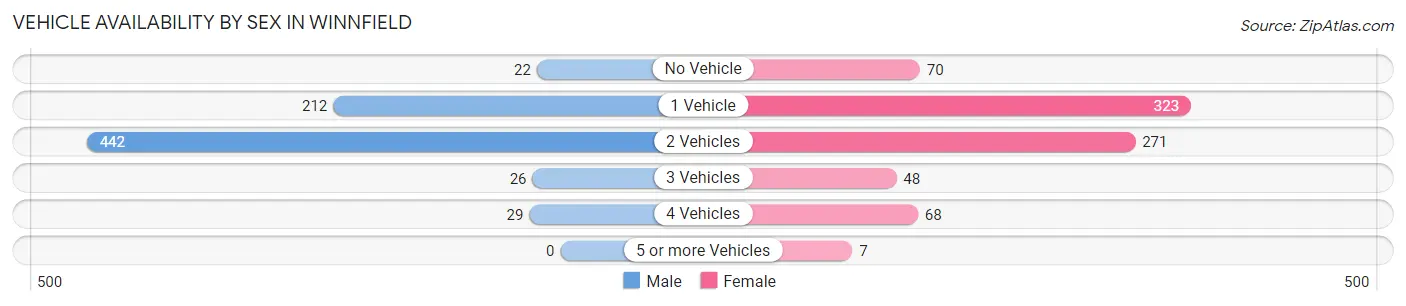
| Vehicles Available | Male | Female |
| No Vehicle | 22 (3.0%) | 70 (8.9%) |
| 1 Vehicle | 212 (29.0%) | 323 (41.0%) |
| 2 Vehicles | 442 (60.5%) | 271 (34.4%) |
| 3 Vehicles | 26 (3.6%) | 48 (6.1%) |
| 4 Vehicles | 29 (4.0%) | 68 (8.6%) |
| 5 or more Vehicles | 0 (0.0%) | 7 (0.9%) |
| Total | 731 (100.0%) | 787 (100.0%) |
Commute Time in Winnfield
The most frequently occuring commute durations in Winnfield are 5 to 9 minutes (382 commuters, 27.8%), 10 to 14 minutes (291 commuters, 21.2%), and 45 to 59 minutes (179 commuters, 13.0%).
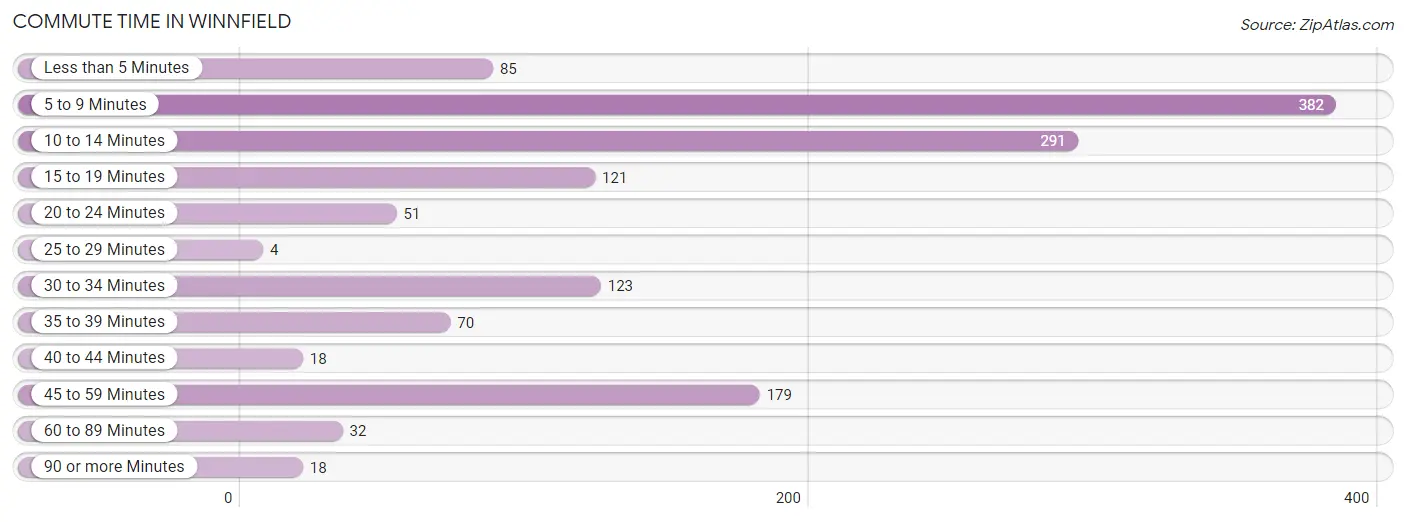
| Commute Time | # Commuters | % Commuters |
| Less than 5 Minutes | 85 | 6.2% |
| 5 to 9 Minutes | 382 | 27.8% |
| 10 to 14 Minutes | 291 | 21.2% |
| 15 to 19 Minutes | 121 | 8.8% |
| 20 to 24 Minutes | 51 | 3.7% |
| 25 to 29 Minutes | 4 | 0.3% |
| 30 to 34 Minutes | 123 | 8.9% |
| 35 to 39 Minutes | 70 | 5.1% |
| 40 to 44 Minutes | 18 | 1.3% |
| 45 to 59 Minutes | 179 | 13.0% |
| 60 to 89 Minutes | 32 | 2.3% |
| 90 or more Minutes | 18 | 1.3% |
Commute Time by Sex in Winnfield
The most common commute times in Winnfield are 10 to 14 minutes (187 commuters, 30.3%) for males and 5 to 9 minutes (252 commuters, 33.3%) for females.
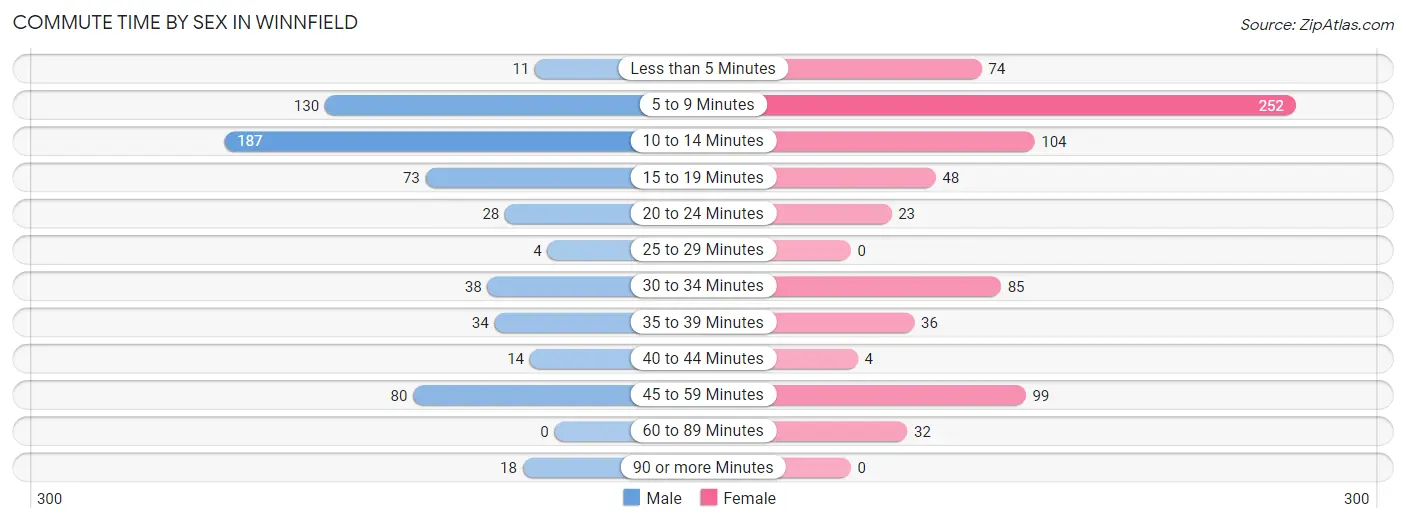
| Commute Time | Male | Female |
| Less than 5 Minutes | 11 (1.8%) | 74 (9.8%) |
| 5 to 9 Minutes | 130 (21.1%) | 252 (33.3%) |
| 10 to 14 Minutes | 187 (30.3%) | 104 (13.7%) |
| 15 to 19 Minutes | 73 (11.8%) | 48 (6.3%) |
| 20 to 24 Minutes | 28 (4.5%) | 23 (3.0%) |
| 25 to 29 Minutes | 4 (0.6%) | 0 (0.0%) |
| 30 to 34 Minutes | 38 (6.2%) | 85 (11.2%) |
| 35 to 39 Minutes | 34 (5.5%) | 36 (4.8%) |
| 40 to 44 Minutes | 14 (2.3%) | 4 (0.5%) |
| 45 to 59 Minutes | 80 (13.0%) | 99 (13.1%) |
| 60 to 89 Minutes | 0 (0.0%) | 32 (4.2%) |
| 90 or more Minutes | 18 (2.9%) | 0 (0.0%) |
Time of Departure to Work by Sex in Winnfield
The most frequent times of departure to work in Winnfield are 5:00 AM to 5:29 AM (104, 16.9%) for males and 6:30 AM to 6:59 AM (147, 19.4%) for females.
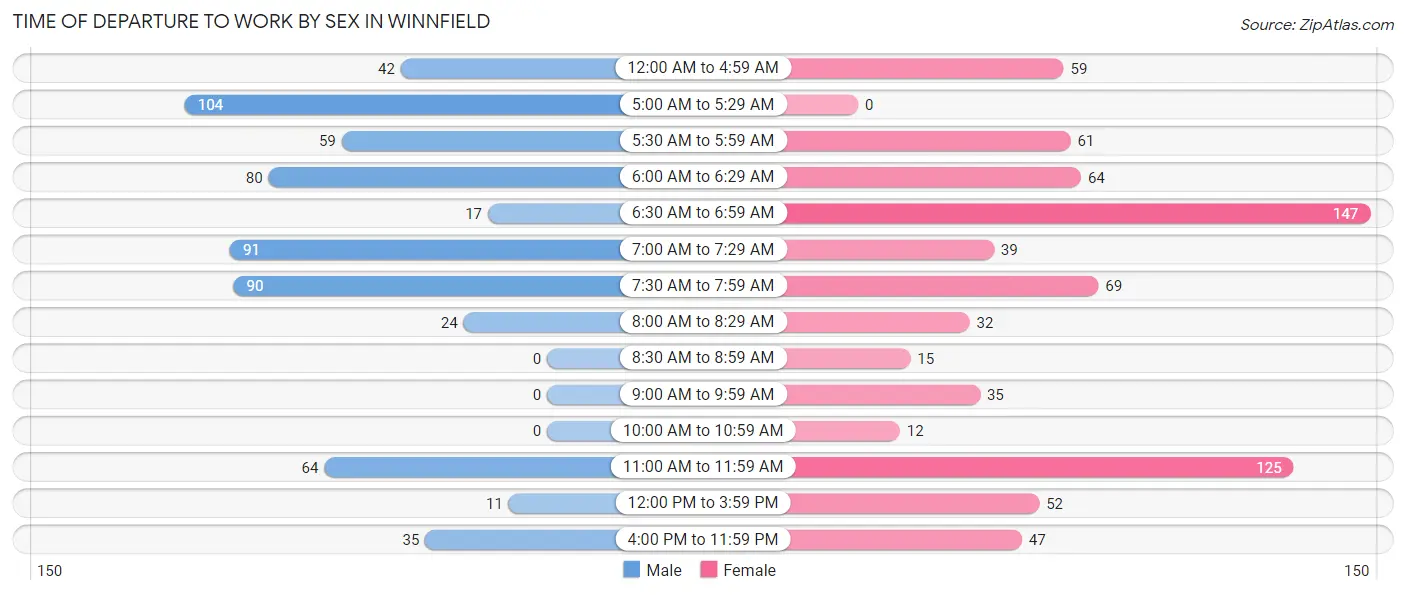
| Time of Departure | Male | Female |
| 12:00 AM to 4:59 AM | 42 (6.8%) | 59 (7.8%) |
| 5:00 AM to 5:29 AM | 104 (16.9%) | 0 (0.0%) |
| 5:30 AM to 5:59 AM | 59 (9.6%) | 61 (8.1%) |
| 6:00 AM to 6:29 AM | 80 (13.0%) | 64 (8.5%) |
| 6:30 AM to 6:59 AM | 17 (2.8%) | 147 (19.4%) |
| 7:00 AM to 7:29 AM | 91 (14.7%) | 39 (5.1%) |
| 7:30 AM to 7:59 AM | 90 (14.6%) | 69 (9.1%) |
| 8:00 AM to 8:29 AM | 24 (3.9%) | 32 (4.2%) |
| 8:30 AM to 8:59 AM | 0 (0.0%) | 15 (2.0%) |
| 9:00 AM to 9:59 AM | 0 (0.0%) | 35 (4.6%) |
| 10:00 AM to 10:59 AM | 0 (0.0%) | 12 (1.6%) |
| 11:00 AM to 11:59 AM | 64 (10.4%) | 125 (16.5%) |
| 12:00 PM to 3:59 PM | 11 (1.8%) | 52 (6.9%) |
| 4:00 PM to 11:59 PM | 35 (5.7%) | 47 (6.2%) |
| Total | 617 (100.0%) | 757 (100.0%) |
Housing Occupancy in Winnfield
Occupancy by Ownership in Winnfield
Of the total 1,497 dwellings in Winnfield, owner-occupied units account for 666 (44.5%), while renter-occupied units make up 831 (55.5%).
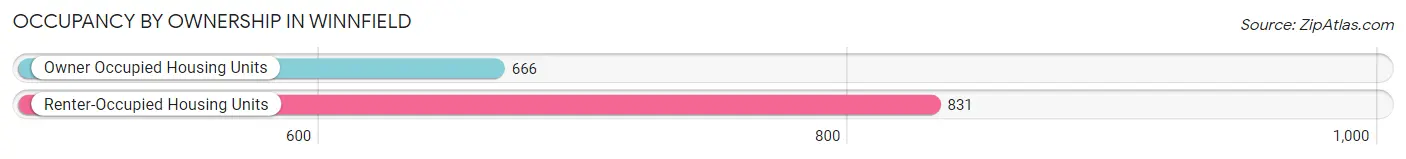
| Occupancy | # Housing Units | % Housing Units |
| Owner Occupied Housing Units | 666 | 44.5% |
| Renter-Occupied Housing Units | 831 | 55.5% |
| Total Occupied Housing Units | 1,497 | 100.0% |
Occupancy by Household Size in Winnfield
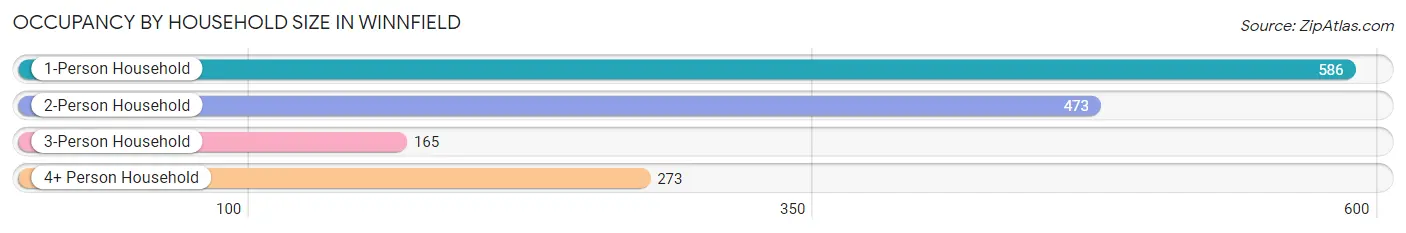
| Household Size | # Housing Units | % Housing Units |
| 1-Person Household | 586 | 39.1% |
| 2-Person Household | 473 | 31.6% |
| 3-Person Household | 165 | 11.0% |
| 4+ Person Household | 273 | 18.2% |
| Total Housing Units | 1,497 | 100.0% |
Occupancy by Ownership by Household Size in Winnfield
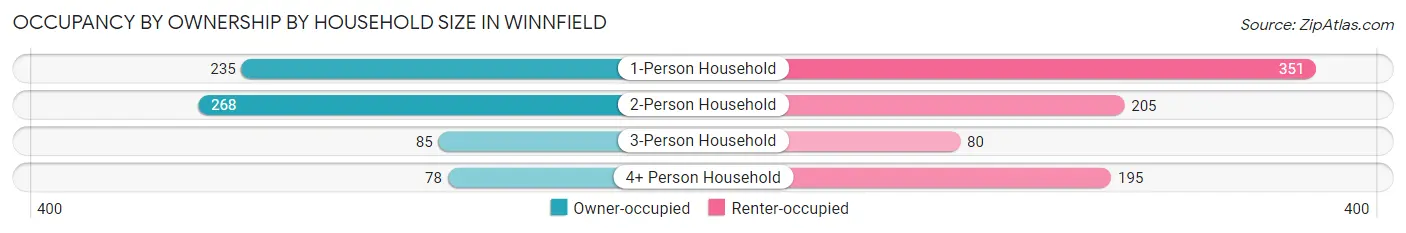
| Household Size | Owner-occupied | Renter-occupied |
| 1-Person Household | 235 (40.1%) | 351 (59.9%) |
| 2-Person Household | 268 (56.7%) | 205 (43.3%) |
| 3-Person Household | 85 (51.5%) | 80 (48.5%) |
| 4+ Person Household | 78 (28.6%) | 195 (71.4%) |
| Total Housing Units | 666 (44.5%) | 831 (55.5%) |
Occupancy by Educational Attainment in Winnfield
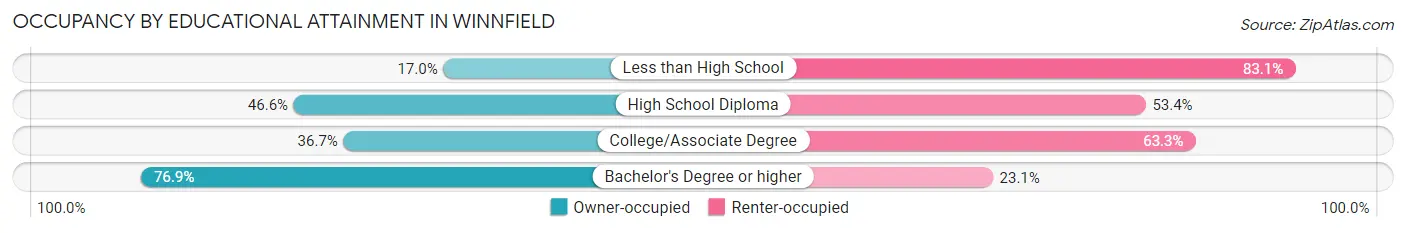
| Household Size | Owner-occupied | Renter-occupied |
| Less than High School | 40 (17.0%) | 196 (83.1%) |
| High School Diploma | 275 (46.6%) | 315 (53.4%) |
| College/Associate Degree | 151 (36.7%) | 260 (63.3%) |
| Bachelor's Degree or higher | 200 (76.9%) | 60 (23.1%) |
Occupancy by Age of Householder in Winnfield
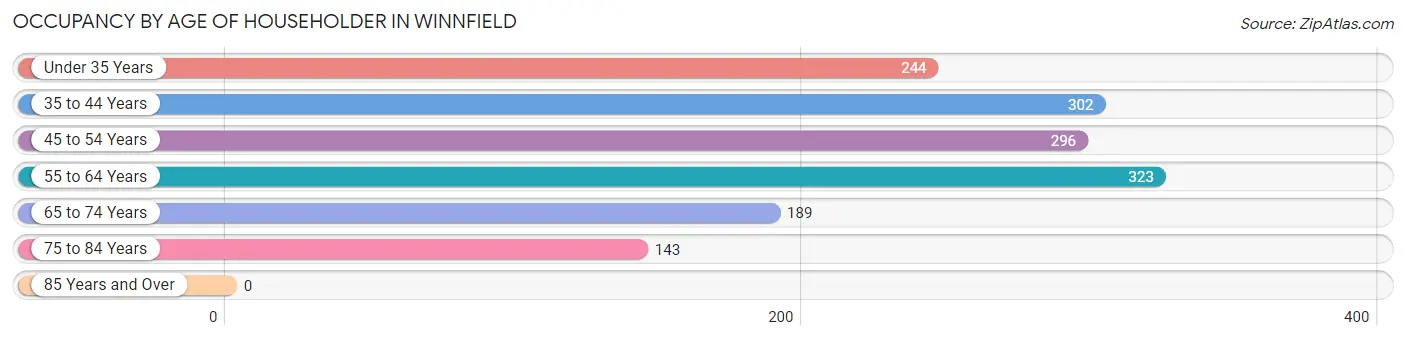
| Age Bracket | # Households | % Households |
| Under 35 Years | 244 | 16.3% |
| 35 to 44 Years | 302 | 20.2% |
| 45 to 54 Years | 296 | 19.8% |
| 55 to 64 Years | 323 | 21.6% |
| 65 to 74 Years | 189 | 12.6% |
| 75 to 84 Years | 143 | 9.6% |
| 85 Years and Over | 0 | 0.0% |
| Total | 1,497 | 100.0% |
Housing Finances in Winnfield
Median Income by Occupancy in Winnfield
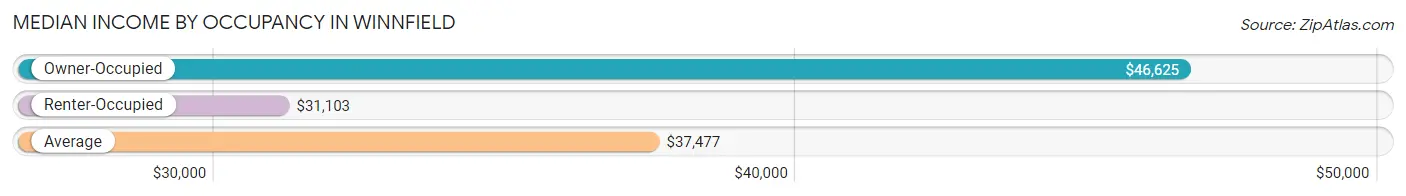
| Occupancy Type | # Households | Median Income |
| Owner-Occupied | 666 (44.5%) | $46,625 |
| Renter-Occupied | 831 (55.5%) | $31,103 |
| Average | 1,497 (100.0%) | $37,477 |
Occupancy by Householder Income Bracket in Winnfield
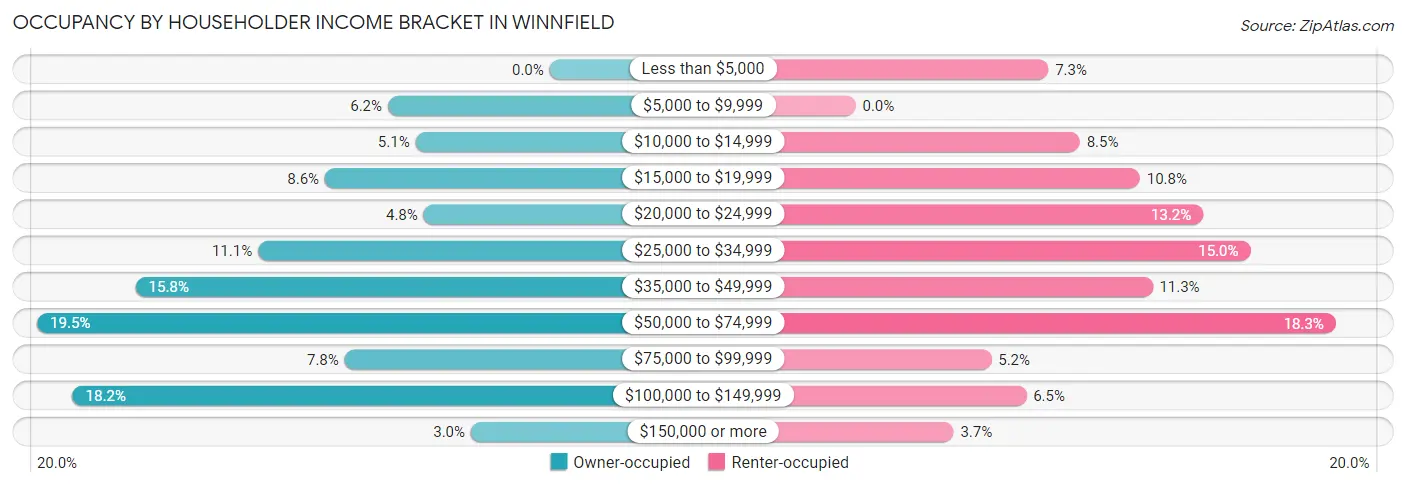
| Income Bracket | Owner-occupied | Renter-occupied |
| Less than $5,000 | 0 (0.0%) | 61 (7.3%) |
| $5,000 to $9,999 | 41 (6.2%) | 0 (0.0%) |
| $10,000 to $14,999 | 34 (5.1%) | 71 (8.5%) |
| $15,000 to $19,999 | 57 (8.6%) | 90 (10.8%) |
| $20,000 to $24,999 | 32 (4.8%) | 110 (13.2%) |
| $25,000 to $34,999 | 74 (11.1%) | 125 (15.0%) |
| $35,000 to $49,999 | 105 (15.8%) | 94 (11.3%) |
| $50,000 to $74,999 | 130 (19.5%) | 152 (18.3%) |
| $75,000 to $99,999 | 52 (7.8%) | 43 (5.2%) |
| $100,000 to $149,999 | 121 (18.2%) | 54 (6.5%) |
| $150,000 or more | 20 (3.0%) | 31 (3.7%) |
| Total | 666 (100.0%) | 831 (100.0%) |
Monthly Housing Cost Tiers in Winnfield
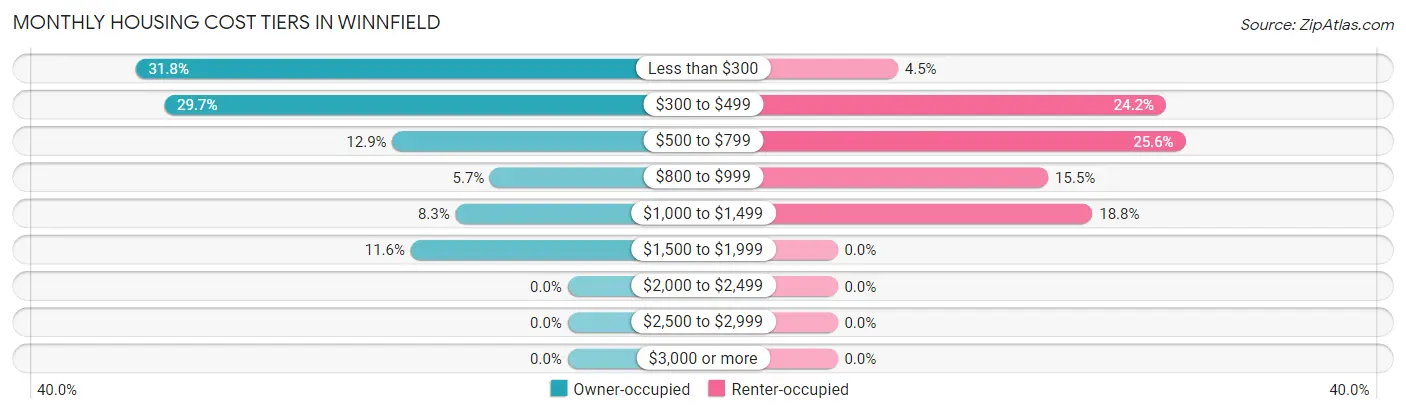
| Monthly Cost | Owner-occupied | Renter-occupied |
| Less than $300 | 212 (31.8%) | 37 (4.4%) |
| $300 to $499 | 198 (29.7%) | 201 (24.2%) |
| $500 to $799 | 86 (12.9%) | 213 (25.6%) |
| $800 to $999 | 38 (5.7%) | 129 (15.5%) |
| $1,000 to $1,499 | 55 (8.3%) | 156 (18.8%) |
| $1,500 to $1,999 | 77 (11.6%) | 0 (0.0%) |
| $2,000 to $2,499 | 0 (0.0%) | 0 (0.0%) |
| $2,500 to $2,999 | 0 (0.0%) | 0 (0.0%) |
| $3,000 or more | 0 (0.0%) | 0 (0.0%) |
| Total | 666 (100.0%) | 831 (100.0%) |
Physical Housing Characteristics in Winnfield
Housing Structures in Winnfield
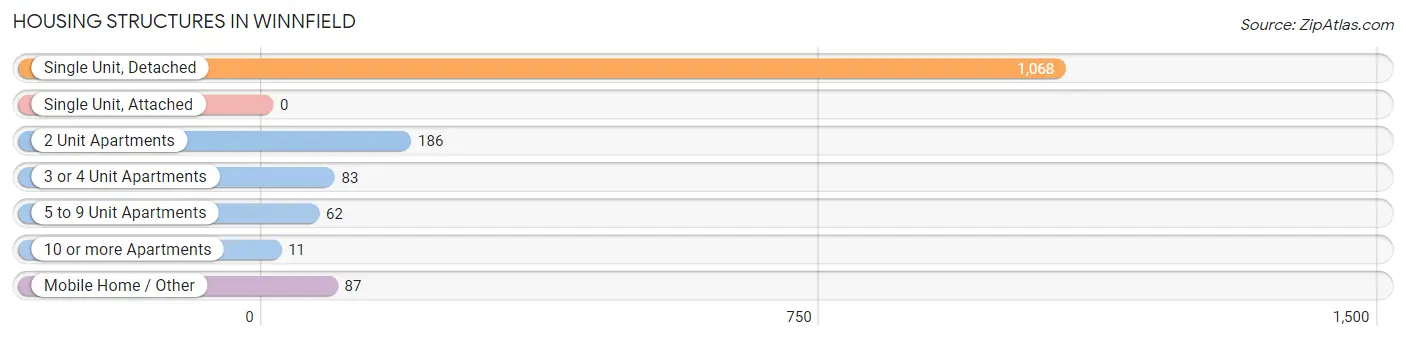
| Structure Type | # Housing Units | % Housing Units |
| Single Unit, Detached | 1,068 | 71.3% |
| Single Unit, Attached | 0 | 0.0% |
| 2 Unit Apartments | 186 | 12.4% |
| 3 or 4 Unit Apartments | 83 | 5.5% |
| 5 to 9 Unit Apartments | 62 | 4.1% |
| 10 or more Apartments | 11 | 0.7% |
| Mobile Home / Other | 87 | 5.8% |
| Total | 1,497 | 100.0% |
Housing Structures by Occupancy in Winnfield
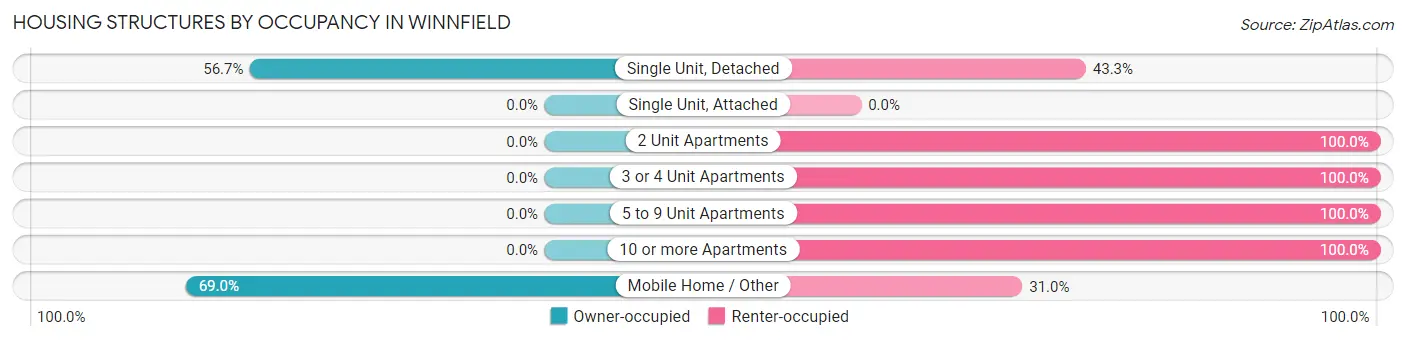
| Structure Type | Owner-occupied | Renter-occupied |
| Single Unit, Detached | 606 (56.7%) | 462 (43.3%) |
| Single Unit, Attached | 0 (0.0%) | 0 (0.0%) |
| 2 Unit Apartments | 0 (0.0%) | 186 (100.0%) |
| 3 or 4 Unit Apartments | 0 (0.0%) | 83 (100.0%) |
| 5 to 9 Unit Apartments | 0 (0.0%) | 62 (100.0%) |
| 10 or more Apartments | 0 (0.0%) | 11 (100.0%) |
| Mobile Home / Other | 60 (69.0%) | 27 (31.0%) |
| Total | 666 (44.5%) | 831 (55.5%) |
Housing Structures by Number of Rooms in Winnfield
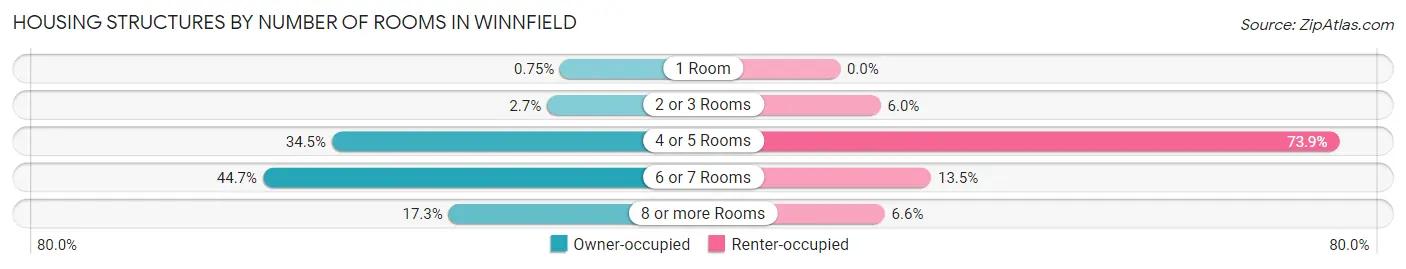
| Number of Rooms | Owner-occupied | Renter-occupied |
| 1 Room | 5 (0.7%) | 0 (0.0%) |
| 2 or 3 Rooms | 18 (2.7%) | 50 (6.0%) |
| 4 or 5 Rooms | 230 (34.5%) | 614 (73.9%) |
| 6 or 7 Rooms | 298 (44.7%) | 112 (13.5%) |
| 8 or more Rooms | 115 (17.3%) | 55 (6.6%) |
| Total | 666 (100.0%) | 831 (100.0%) |
Housing Structure by Heating Type in Winnfield
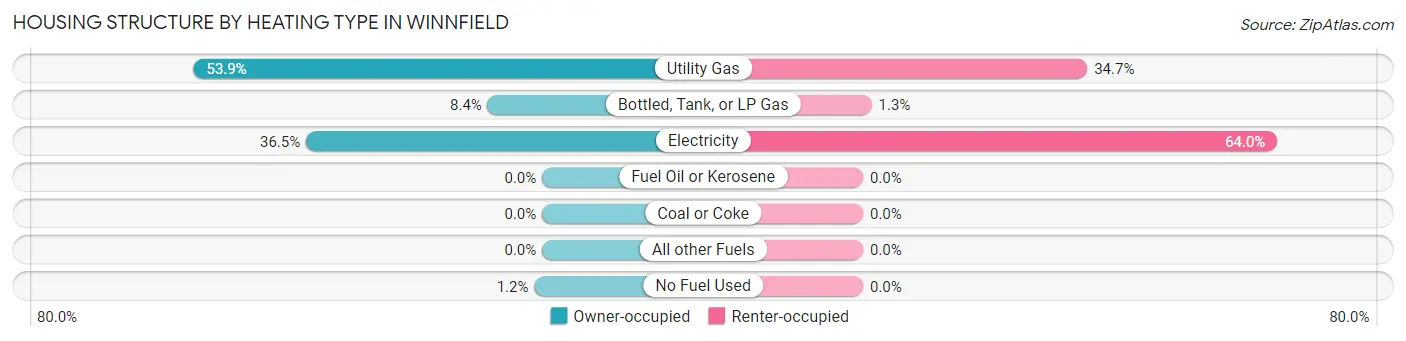
| Heating Type | Owner-occupied | Renter-occupied |
| Utility Gas | 359 (53.9%) | 288 (34.7%) |
| Bottled, Tank, or LP Gas | 56 (8.4%) | 11 (1.3%) |
| Electricity | 243 (36.5%) | 532 (64.0%) |
| Fuel Oil or Kerosene | 0 (0.0%) | 0 (0.0%) |
| Coal or Coke | 0 (0.0%) | 0 (0.0%) |
| All other Fuels | 0 (0.0%) | 0 (0.0%) |
| No Fuel Used | 8 (1.2%) | 0 (0.0%) |
| Total | 666 (100.0%) | 831 (100.0%) |
Household Vehicle Usage in Winnfield
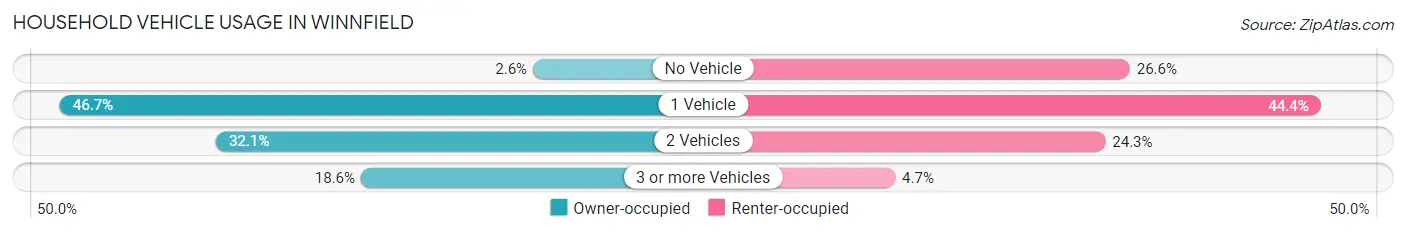
| Vehicles per Household | Owner-occupied | Renter-occupied |
| No Vehicle | 17 (2.5%) | 221 (26.6%) |
| 1 Vehicle | 311 (46.7%) | 369 (44.4%) |
| 2 Vehicles | 214 (32.1%) | 202 (24.3%) |
| 3 or more Vehicles | 124 (18.6%) | 39 (4.7%) |
| Total | 666 (100.0%) | 831 (100.0%) |
Real Estate & Mortgages in Winnfield
Real Estate and Mortgage Overview in Winnfield
| Characteristic | Without Mortgage | With Mortgage |
| Housing Units | 410 | 256 |
| Median Property Value | $71,500 | $171,400 |
| Median Household Income | $56,742 | $16 |
| Monthly Housing Costs | $295 | $0 |
| Real Estate Taxes | $199 | $69 |
Property Value by Mortgage Status in Winnfield
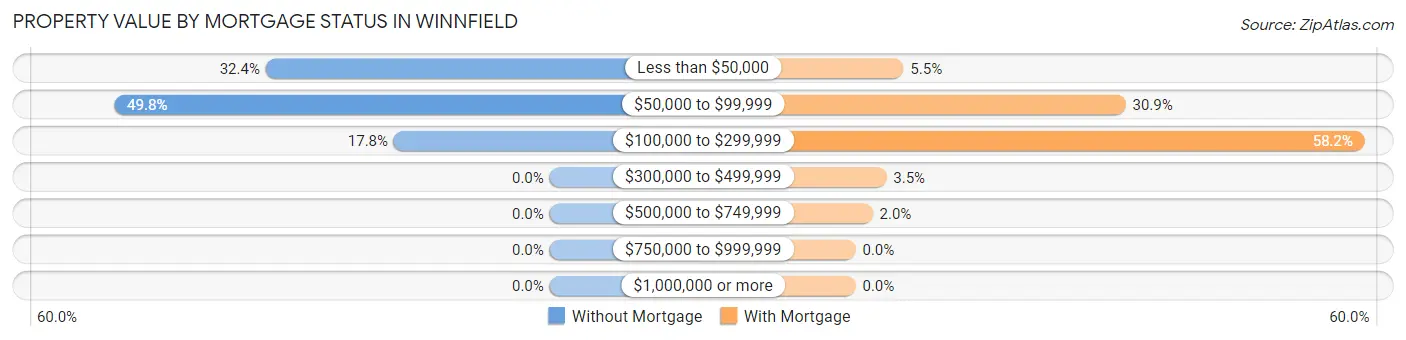
| Property Value | Without Mortgage | With Mortgage |
| Less than $50,000 | 133 (32.4%) | 14 (5.5%) |
| $50,000 to $99,999 | 204 (49.8%) | 79 (30.9%) |
| $100,000 to $299,999 | 73 (17.8%) | 149 (58.2%) |
| $300,000 to $499,999 | 0 (0.0%) | 9 (3.5%) |
| $500,000 to $749,999 | 0 (0.0%) | 5 (1.9%) |
| $750,000 to $999,999 | 0 (0.0%) | 0 (0.0%) |
| $1,000,000 or more | 0 (0.0%) | 0 (0.0%) |
| Total | 410 (100.0%) | 256 (100.0%) |
Household Income by Mortgage Status in Winnfield
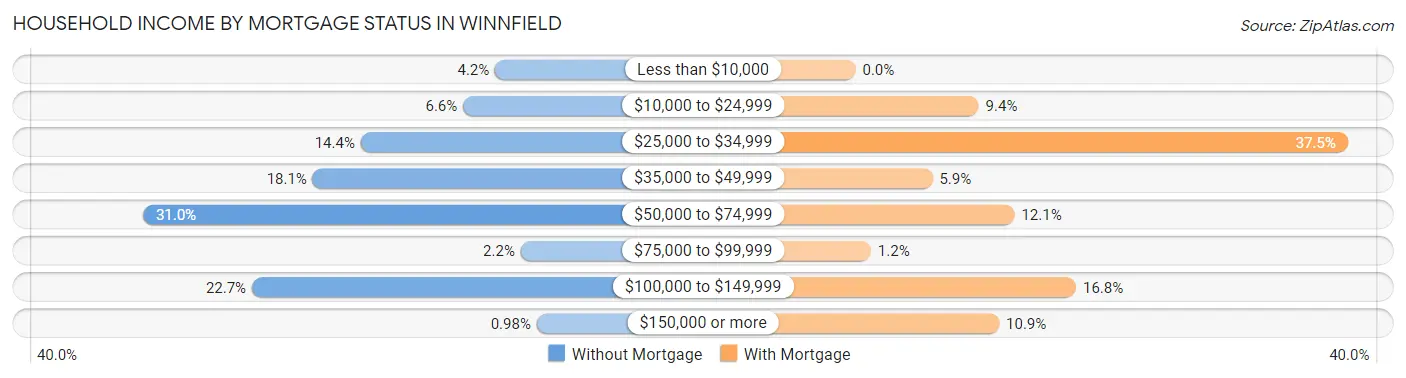
| Household Income | Without Mortgage | With Mortgage |
| Less than $10,000 | 17 (4.2%) | 0 (0.0%) |
| $10,000 to $24,999 | 27 (6.6%) | 24 (9.4%) |
| $25,000 to $34,999 | 59 (14.4%) | 96 (37.5%) |
| $35,000 to $49,999 | 74 (18.0%) | 15 (5.9%) |
| $50,000 to $74,999 | 127 (31.0%) | 31 (12.1%) |
| $75,000 to $99,999 | 9 (2.2%) | 3 (1.2%) |
| $100,000 to $149,999 | 93 (22.7%) | 43 (16.8%) |
| $150,000 or more | 4 (1.0%) | 28 (10.9%) |
| Total | 410 (100.0%) | 256 (100.0%) |
Property Value to Household Income Ratio in Winnfield
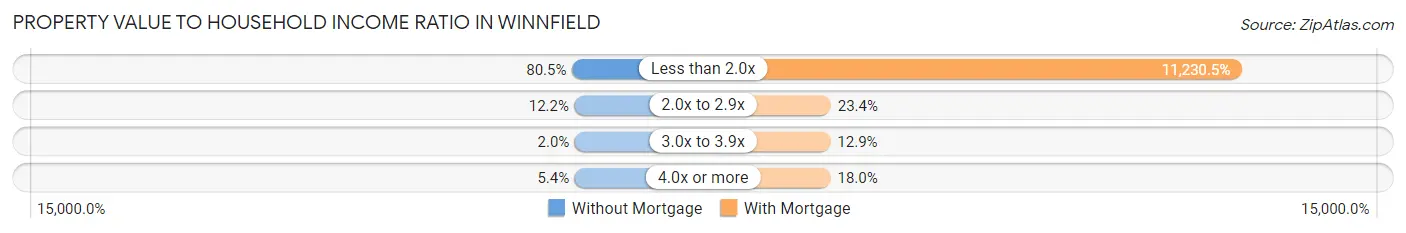
| Value-to-Income Ratio | Without Mortgage | With Mortgage |
| Less than 2.0x | 330 (80.5%) | 28,750 (11,230.5%) |
| 2.0x to 2.9x | 50 (12.2%) | 60 (23.4%) |
| 3.0x to 3.9x | 8 (1.9%) | 33 (12.9%) |
| 4.0x or more | 22 (5.4%) | 46 (18.0%) |
| Total | 410 (100.0%) | 256 (100.0%) |
Real Estate Taxes by Mortgage Status in Winnfield

| Property Taxes | Without Mortgage | With Mortgage |
| Less than $800 | 318 (77.6%) | 0 (0.0%) |
| $800 to $1,499 | 0 (0.0%) | 100 (39.1%) |
| $800 to $1,499 | 0 (0.0%) | 59 (23.1%) |
| Total | 410 (100.0%) | 256 (100.0%) |
Health & Disability in Winnfield
Health Insurance Coverage by Age in Winnfield
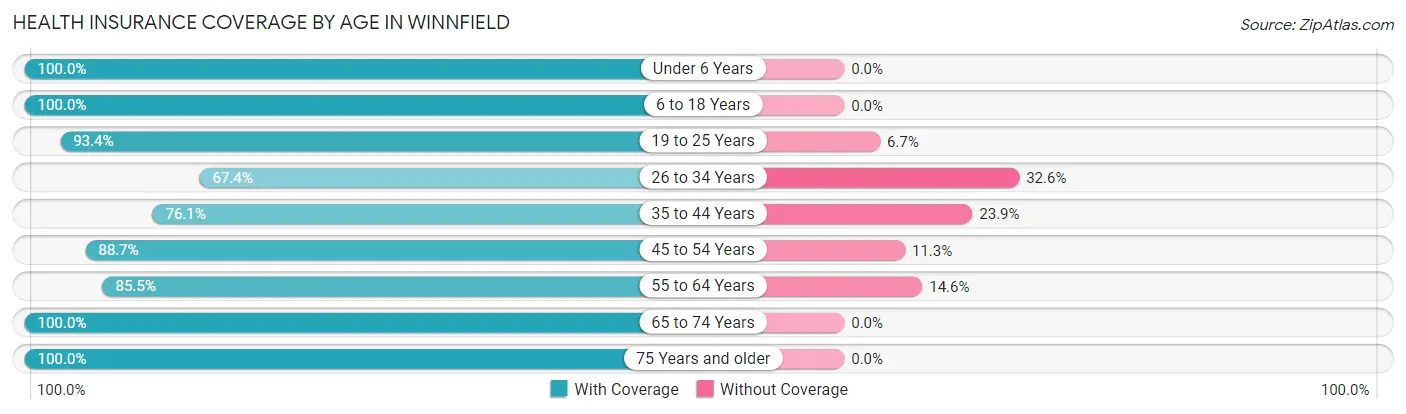
| Age Bracket | With Coverage | Without Coverage |
| Under 6 Years | 432 (100.0%) | 0 (0.0%) |
| 6 to 18 Years | 834 (100.0%) | 0 (0.0%) |
| 19 to 25 Years | 309 (93.3%) | 22 (6.7%) |
| 26 to 34 Years | 407 (67.4%) | 197 (32.6%) |
| 35 to 44 Years | 322 (76.1%) | 101 (23.9%) |
| 45 to 54 Years | 384 (88.7%) | 49 (11.3%) |
| 55 to 64 Years | 364 (85.5%) | 62 (14.5%) |
| 65 to 74 Years | 257 (100.0%) | 0 (0.0%) |
| 75 Years and older | 172 (100.0%) | 0 (0.0%) |
| Total | 3,481 (89.0%) | 431 (11.0%) |
Health Insurance Coverage by Citizenship Status in Winnfield
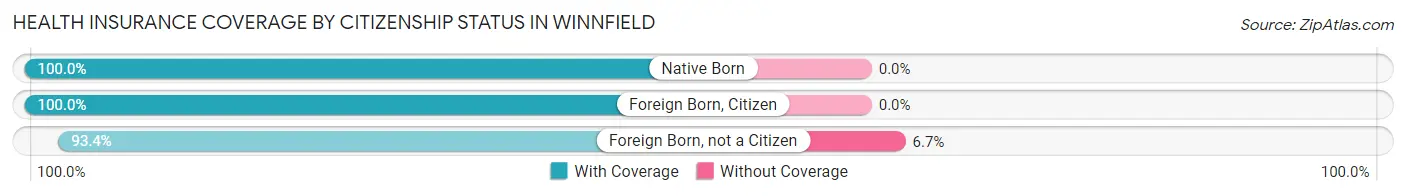
| Citizenship Status | With Coverage | Without Coverage |
| Native Born | 432 (100.0%) | 0 (0.0%) |
| Foreign Born, Citizen | 834 (100.0%) | 0 (0.0%) |
| Foreign Born, not a Citizen | 309 (93.3%) | 22 (6.7%) |
Health Insurance Coverage by Household Income in Winnfield
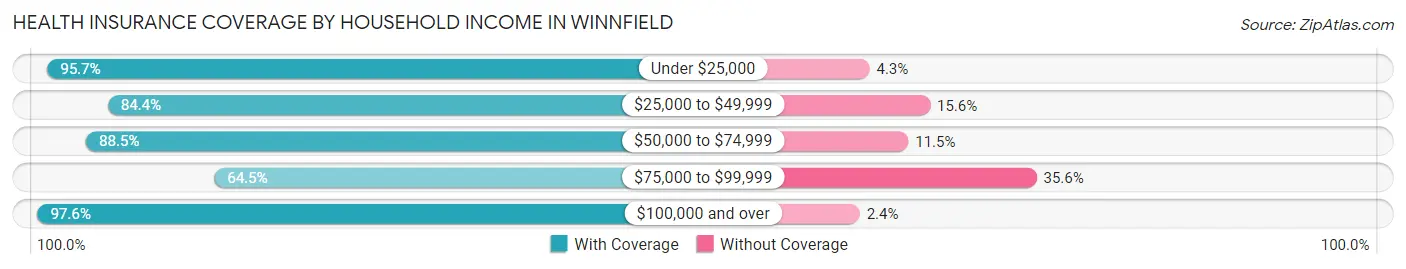
| Household Income | With Coverage | Without Coverage |
| Under $25,000 | 988 (95.7%) | 44 (4.3%) |
| $25,000 to $49,999 | 996 (84.4%) | 184 (15.6%) |
| $50,000 to $74,999 | 606 (88.5%) | 79 (11.5%) |
| $75,000 to $99,999 | 194 (64.4%) | 107 (35.5%) |
| $100,000 and over | 686 (97.6%) | 17 (2.4%) |
Public vs Private Health Insurance Coverage by Age in Winnfield
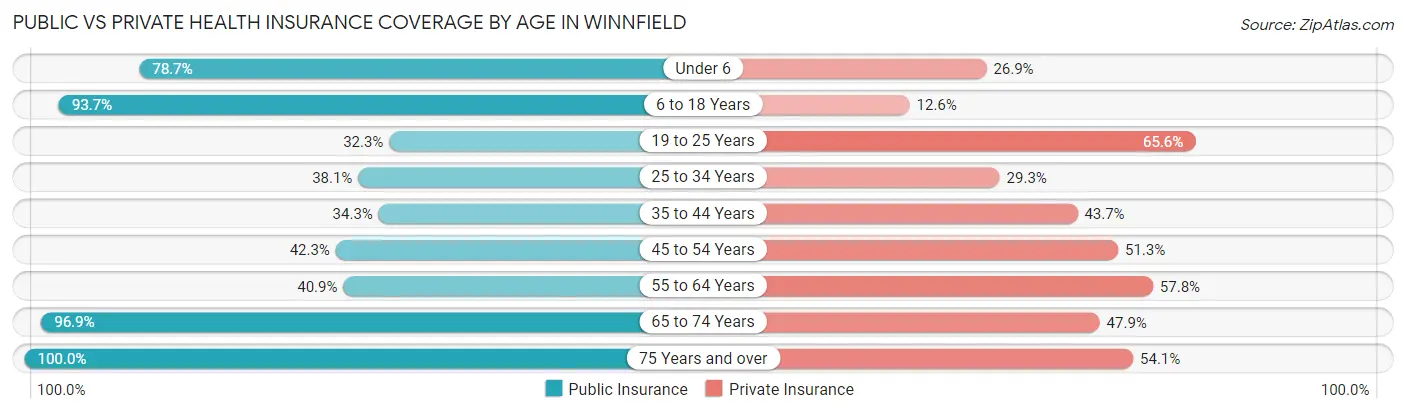
| Age Bracket | Public Insurance | Private Insurance |
| Under 6 | 340 (78.7%) | 116 (26.9%) |
| 6 to 18 Years | 781 (93.6%) | 105 (12.6%) |
| 19 to 25 Years | 107 (32.3%) | 217 (65.6%) |
| 25 to 34 Years | 230 (38.1%) | 177 (29.3%) |
| 35 to 44 Years | 145 (34.3%) | 185 (43.7%) |
| 45 to 54 Years | 183 (42.3%) | 222 (51.3%) |
| 55 to 64 Years | 174 (40.8%) | 246 (57.8%) |
| 65 to 74 Years | 249 (96.9%) | 123 (47.9%) |
| 75 Years and over | 172 (100.0%) | 93 (54.1%) |
| Total | 2,381 (60.9%) | 1,484 (37.9%) |
Disability Status by Sex by Age in Winnfield
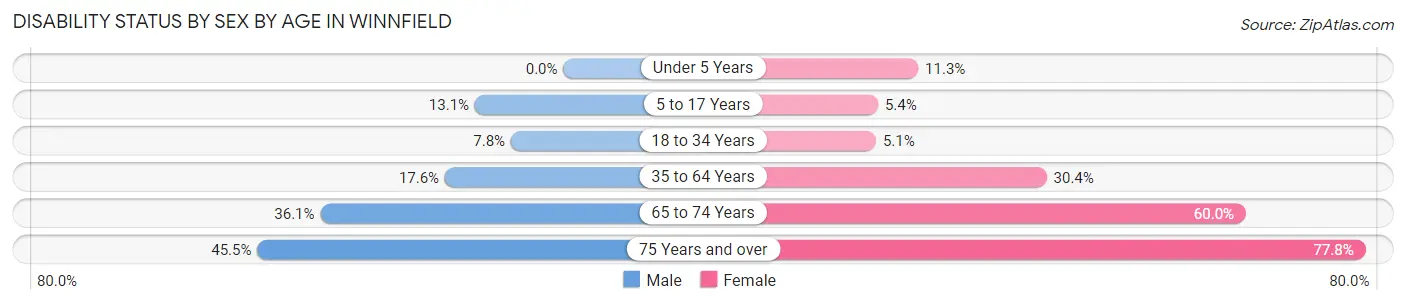
| Age Bracket | Male | Female |
| Under 5 Years | 0 (0.0%) | 27 (11.3%) |
| 5 to 17 Years | 60 (13.1%) | 21 (5.4%) |
| 18 to 34 Years | 41 (7.8%) | 25 (5.1%) |
| 35 to 64 Years | 93 (17.6%) | 229 (30.4%) |
| 65 to 74 Years | 35 (36.1%) | 96 (60.0%) |
| 75 Years and over | 25 (45.5%) | 91 (77.8%) |
Disability Class by Sex by Age in Winnfield
Disability Class: Hearing Difficulty
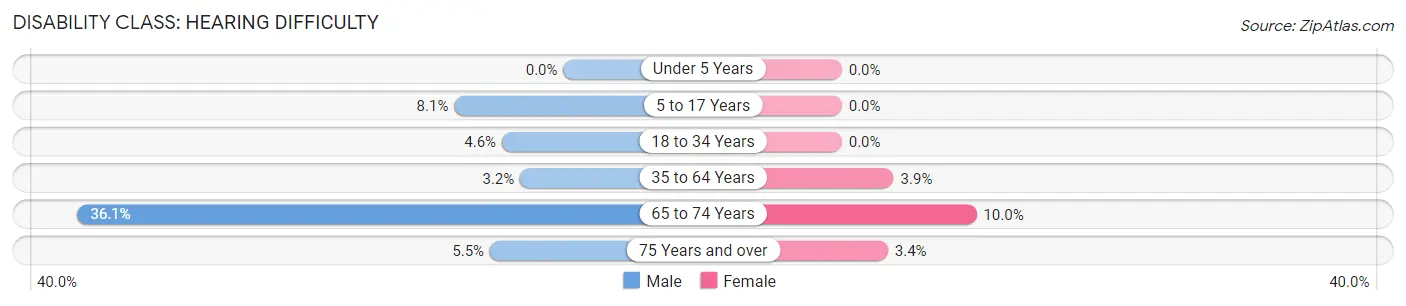
| Age Bracket | Male | Female |
| Under 5 Years | 0 (0.0%) | 0 (0.0%) |
| 5 to 17 Years | 37 (8.1%) | 0 (0.0%) |
| 18 to 34 Years | 24 (4.6%) | 0 (0.0%) |
| 35 to 64 Years | 17 (3.2%) | 29 (3.8%) |
| 65 to 74 Years | 35 (36.1%) | 16 (10.0%) |
| 75 Years and over | 3 (5.4%) | 4 (3.4%) |
Disability Class: Vision Difficulty
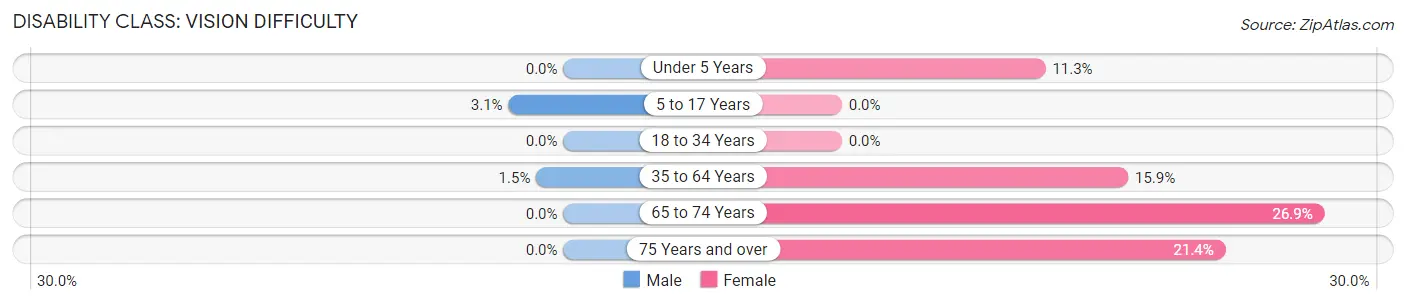
| Age Bracket | Male | Female |
| Under 5 Years | 0 (0.0%) | 27 (11.3%) |
| 5 to 17 Years | 14 (3.1%) | 0 (0.0%) |
| 18 to 34 Years | 0 (0.0%) | 0 (0.0%) |
| 35 to 64 Years | 8 (1.5%) | 120 (15.9%) |
| 65 to 74 Years | 0 (0.0%) | 43 (26.9%) |
| 75 Years and over | 0 (0.0%) | 25 (21.4%) |
Disability Class: Cognitive Difficulty
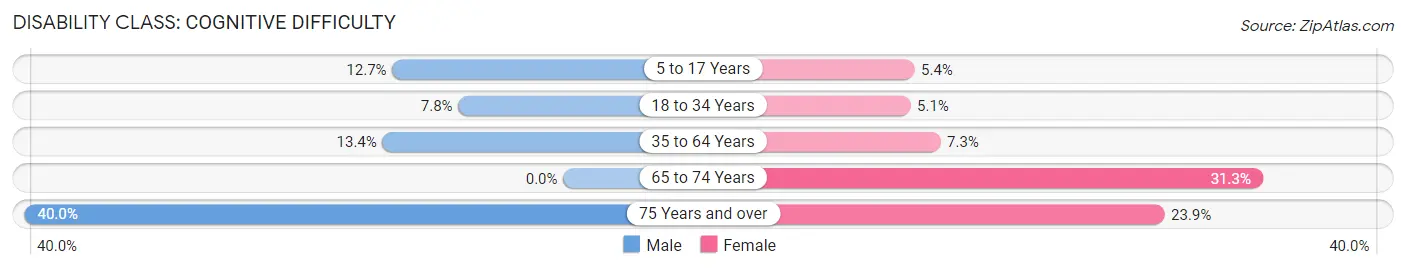
| Age Bracket | Male | Female |
| 5 to 17 Years | 58 (12.7%) | 21 (5.4%) |
| 18 to 34 Years | 41 (7.8%) | 25 (5.1%) |
| 35 to 64 Years | 71 (13.4%) | 55 (7.3%) |
| 65 to 74 Years | 0 (0.0%) | 50 (31.2%) |
| 75 Years and over | 22 (40.0%) | 28 (23.9%) |
Disability Class: Ambulatory Difficulty
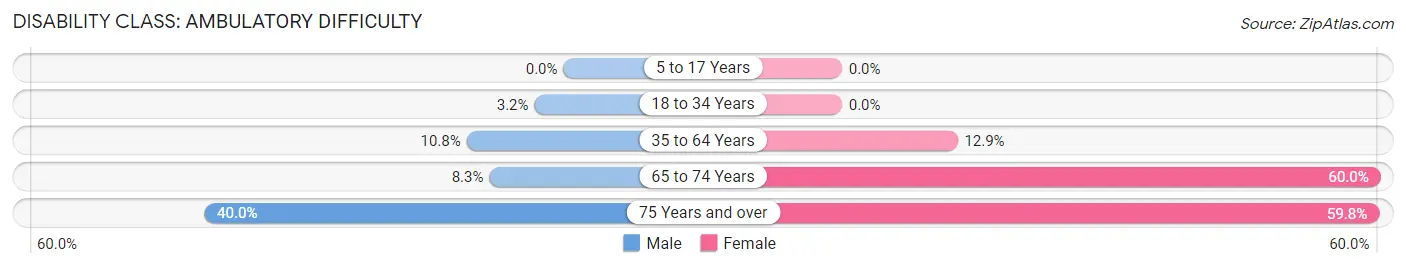
| Age Bracket | Male | Female |
| 5 to 17 Years | 0 (0.0%) | 0 (0.0%) |
| 18 to 34 Years | 17 (3.2%) | 0 (0.0%) |
| 35 to 64 Years | 57 (10.8%) | 97 (12.9%) |
| 65 to 74 Years | 8 (8.3%) | 96 (60.0%) |
| 75 Years and over | 22 (40.0%) | 70 (59.8%) |
Disability Class: Self-Care Difficulty
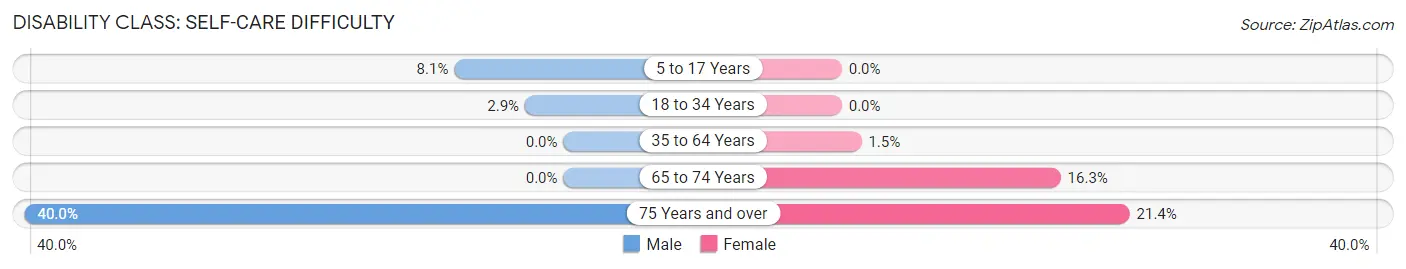
| Age Bracket | Male | Female |
| 5 to 17 Years | 37 (8.1%) | 0 (0.0%) |
| 18 to 34 Years | 15 (2.9%) | 0 (0.0%) |
| 35 to 64 Years | 0 (0.0%) | 11 (1.5%) |
| 65 to 74 Years | 0 (0.0%) | 26 (16.3%) |
| 75 Years and over | 22 (40.0%) | 25 (21.4%) |
Technology Access in Winnfield
Computing Device Access in Winnfield
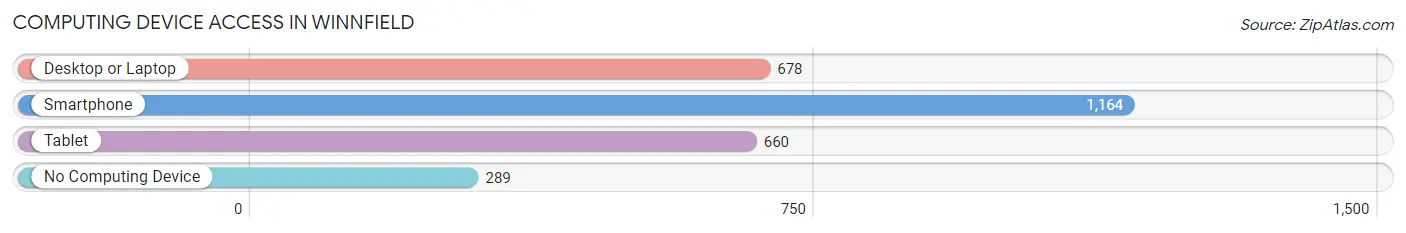
| Device Type | # Households | % Households |
| Desktop or Laptop | 678 | 45.3% |
| Smartphone | 1,164 | 77.8% |
| Tablet | 660 | 44.1% |
| No Computing Device | 289 | 19.3% |
| Total | 1,497 | 100.0% |
Internet Access in Winnfield
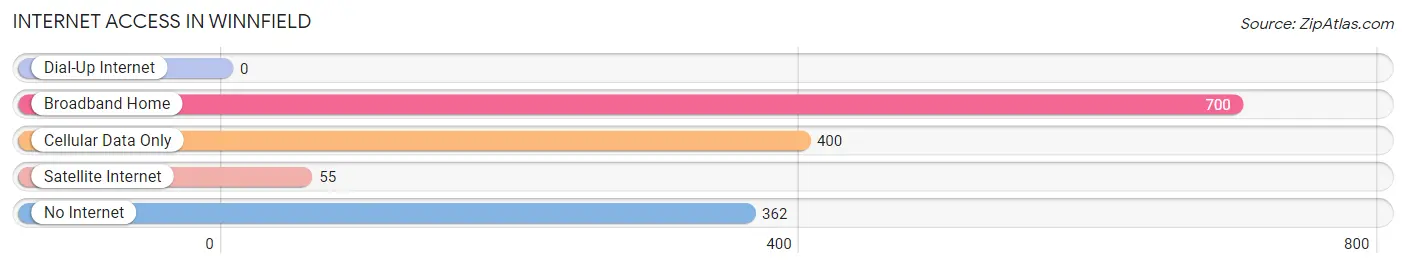
| Internet Type | # Households | % Households |
| Dial-Up Internet | 0 | 0.0% |
| Broadband Home | 700 | 46.8% |
| Cellular Data Only | 400 | 26.7% |
| Satellite Internet | 55 | 3.7% |
| No Internet | 362 | 24.2% |
| Total | 1,497 | 100.0% |
Winnfield Summary
Winnfield is a city located in the northern part of the U.S. state of Louisiana. It is the parish seat of Winn Parish and is located in the heart of the Kisatchie National Forest. The city has a population of 5,749 as of the 2010 census.
History
Winnfield was founded in 1852 by settlers from the nearby town of Winnsboro. The town was named after the Winn family, who were prominent landowners in the area. The town was incorporated in 1871 and has since grown to become the largest city in Winn Parish.
Geography
Winnfield is located at the intersection of U.S. Routes 84 and 167 in northern Louisiana. It is situated in the Kisatchie National Forest and is surrounded by rolling hills and pine forests. The city is located approximately 80 miles east of Shreveport and 110 miles west of Monroe.
Economy
Winnfield’s economy is largely based on agriculture and timber production. The city is home to several large timber companies, including Weyerhaeuser and International Paper. The city also has a strong manufacturing sector, with several factories producing furniture, clothing, and other goods.
Demographics
As of the 2010 census, Winnfield had a population of 5,749. The racial makeup of the city was 57.3% White, 39.3% African American, 0.3% Native American, 0.2% Asian, 0.1% Pacific Islander, 1.2% from other races, and 1.6% from two or more races. Hispanic or Latino of any race were 2.7% of the population.
The median income for a household in the city was $25,938, and the median income for a family was $32,917. Males had a median income of $30,917 versus $20,938 for females. The per capita income for the city was $14,917. About 18.2% of families and 22.2% of the population were below the poverty line, including 28.2% of those under age 18 and 18.7% of those age 65 or over.
Conclusion
Winnfield is a small city located in northern Louisiana. It is the parish seat of Winn Parish and is surrounded by the Kisatchie National Forest. The city has a population of 5,749 and is largely supported by its agricultural and timber industries. The racial makeup of the city is predominantly White and African American, with a small percentage of other races. The median income for a household in the city is $25,938, and the per capita income is $14,917.
Common Questions
What is Per Capita Income in Winnfield?
Per Capita income in Winnfield is $24,262.
What is the Median Family Income in Winnfield?
Median Family Income in Winnfield is $55,137.
What is the Median Household income in Winnfield?
Median Household Income in Winnfield is $37,477.
What is Income or Wage Gap in Winnfield?
Income or Wage Gap in Winnfield is 37.1%.
Women in Winnfield earn 62.9 cents for every dollar earned by a man.
What is Family Income Deficit in Winnfield?
Family Income Deficit in Winnfield is $15,007.
Families that are below poverty line in Winnfield earn $15,007 less on average than the poverty threshold level.
What is Inequality or Gini Index in Winnfield?
Inequality or Gini Index in Winnfield is 0.51.
What is the Total Population of Winnfield?
Total Population of Winnfield is 4,124.
What is the Total Male Population of Winnfield?
Total Male Population of Winnfield is 1,880.
What is the Total Female Population of Winnfield?
Total Female Population of Winnfield is 2,244.
What is the Ratio of Males per 100 Females in Winnfield?
There are 83.78 Males per 100 Females in Winnfield.
What is the Ratio of Females per 100 Males in Winnfield?
There are 119.36 Females per 100 Males in Winnfield.
What is the Median Population Age in Winnfield?
Median Population Age in Winnfield is 33.3 Years.
What is the Average Family Size in Winnfield
Average Family Size in Winnfield is 3.8 People.
What is the Average Household Size in Winnfield
Average Household Size in Winnfield is 2.6 People.
How Large is the Labor Force in Winnfield?
There are 1,700 People in the Labor Forcein in Winnfield.
What is the Percentage of People in the Labor Force in Winnfield?
56.4% of People are in the Labor Force in Winnfield.
What is the Unemployment Rate in Winnfield?
Unemployment Rate in Winnfield is 8.1%.