White Castle, LA Map & Demographics
White Castle Map
White Castle Overview
$15,620
PER CAPITA INCOME
$26,750
AVG FAMILY INCOME
$22,574
AVG HOUSEHOLD INCOME
19.1%
WAGE / INCOME GAP [ % ]
80.9¢/ $1
WAGE / INCOME GAP [ $ ]
0.61
INEQUALITY / GINI INDEX
2,394
TOTAL POPULATION
1,092
MALE POPULATION
1,302
FEMALE POPULATION
83.87
MALES / 100 FEMALES
119.23
FEMALES / 100 MALES
29.9
MEDIAN AGE
3.8
AVG FAMILY SIZE
3.0
AVG HOUSEHOLD SIZE
820
LABOR FORCE [ PEOPLE ]
50.1%
PERCENT IN LABOR FORCE
18.7%
UNEMPLOYMENT RATE
White Castle Zip Codes
White Castle Area Codes
Income in White Castle
Income Overview in White Castle
Per Capita Income in White Castle is $15,620, while median incomes of families and households are $26,750 and $22,574 respectively.
| Characteristic | Number | Measure |
| Per Capita Income | 2,394 | $15,620 |
| Median Family Income | 511 | $26,750 |
| Mean Family Income | 511 | $54,842 |
| Median Household Income | 805 | $22,574 |
| Mean Household Income | 805 | $44,866 |
| Income Deficit | 511 | $0 |
| Wage / Income Gap (%) | 2,394 | 19.08% |
| Wage / Income Gap ($) | 2,394 | 80.92¢ per $1 |
| Gini / Inequality Index | 2,394 | 0.61 |
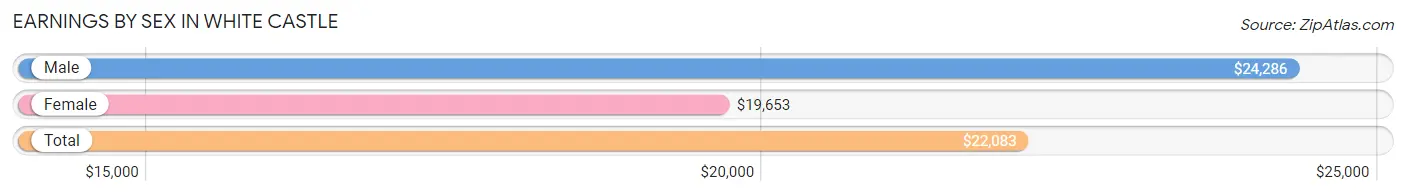
Earnings by Sex in White Castle
Average Earnings in White Castle are $22,083, $24,286 for men and $19,653 for women, a difference of 19.1%.
| Sex | Number | Average Earnings |
| Male | 408 (49.8%) | $24,286 |
| Female | 412 (50.2%) | $19,653 |
| Total | 820 (100.0%) | $22,083 |
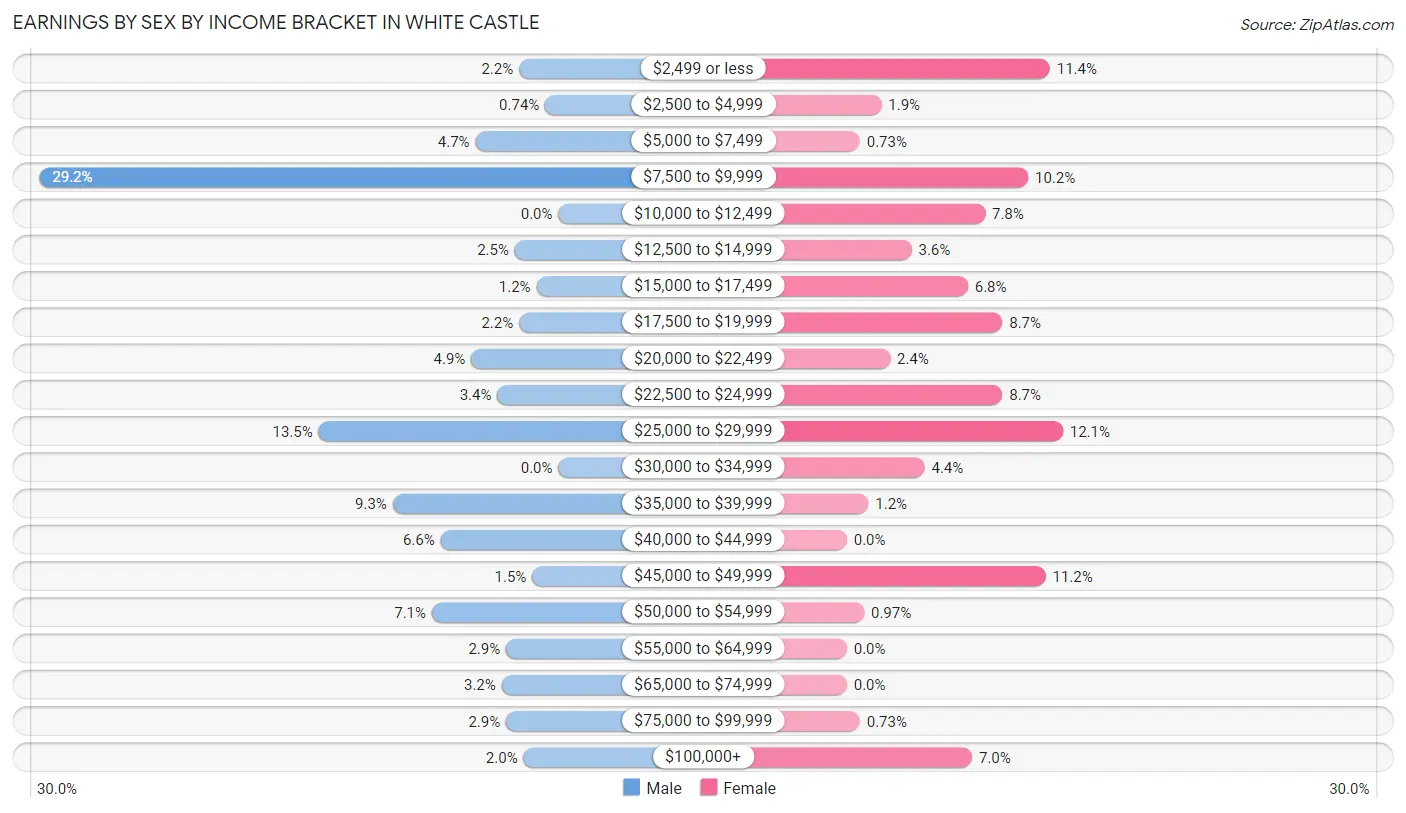
Earnings by Sex by Income Bracket in White Castle
The most common earnings brackets in White Castle are $7,500 to $9,999 for men (119 | 29.2%) and $25,000 to $29,999 for women (50 | 12.1%).
| Income | Male | Female |
| $2,499 or less | 9 (2.2%) | 47 (11.4%) |
| $2,500 to $4,999 | 3 (0.7%) | 8 (1.9%) |
| $5,000 to $7,499 | 19 (4.7%) | 3 (0.7%) |
| $7,500 to $9,999 | 119 (29.2%) | 42 (10.2%) |
| $10,000 to $12,499 | 0 (0.0%) | 32 (7.8%) |
| $12,500 to $14,999 | 10 (2.5%) | 15 (3.6%) |
| $15,000 to $17,499 | 5 (1.2%) | 28 (6.8%) |
| $17,500 to $19,999 | 9 (2.2%) | 36 (8.7%) |
| $20,000 to $22,499 | 20 (4.9%) | 10 (2.4%) |
| $22,500 to $24,999 | 14 (3.4%) | 36 (8.7%) |
| $25,000 to $29,999 | 55 (13.5%) | 50 (12.1%) |
| $30,000 to $34,999 | 0 (0.0%) | 18 (4.4%) |
| $35,000 to $39,999 | 38 (9.3%) | 5 (1.2%) |
| $40,000 to $44,999 | 27 (6.6%) | 0 (0.0%) |
| $45,000 to $49,999 | 6 (1.5%) | 46 (11.2%) |
| $50,000 to $54,999 | 29 (7.1%) | 4 (1.0%) |
| $55,000 to $64,999 | 12 (2.9%) | 0 (0.0%) |
| $65,000 to $74,999 | 13 (3.2%) | 0 (0.0%) |
| $75,000 to $99,999 | 12 (2.9%) | 3 (0.7%) |
| $100,000+ | 8 (2.0%) | 29 (7.0%) |
| Total | 408 (100.0%) | 412 (100.0%) |
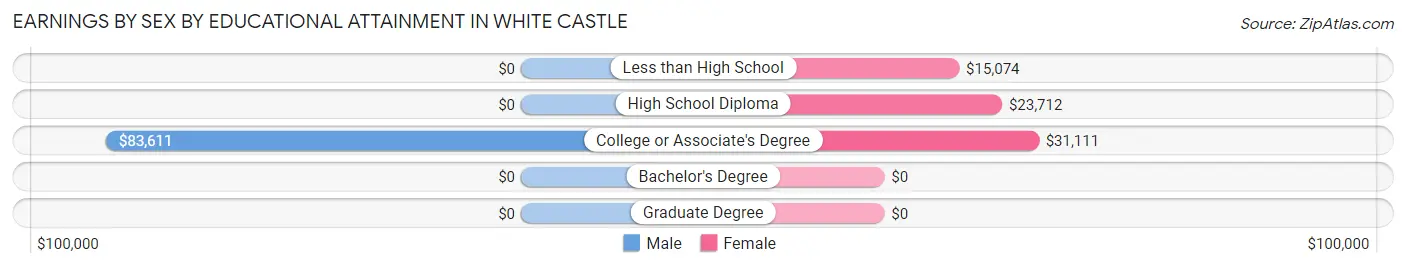
Earnings by Sex by Educational Attainment in White Castle
Average earnings in White Castle are $24,500 for men and $24,618 for women, a difference of 0.5%. Men with an educational attainment of college or associate's degree enjoy the highest average annual earnings of $83,611, while those with college or associate's degree education earn the least with $83,611. Women with an educational attainment of college or associate's degree earn the most with the average annual earnings of $31,111, while those with less than high school education have the smallest earnings of $15,074.
| Educational Attainment | Male Income | Female Income |
| Less than High School | - | - |
| High School Diploma | - | - |
| College or Associate's Degree | $83,611 | $31,111 |
| Bachelor's Degree | - | - |
| Graduate Degree | - | - |
| Total | $24,500 | $24,618 |
Family Income in White Castle
Family Income Brackets in White Castle
According to the White Castle family income data, there are 157 families falling into the less than $10,000 income range, which is the most common income bracket and makes up 30.7% of all families. Conversely, the $200,000+ income bracket is the least frequent group with only 7 families (1.4%) belonging to this category.
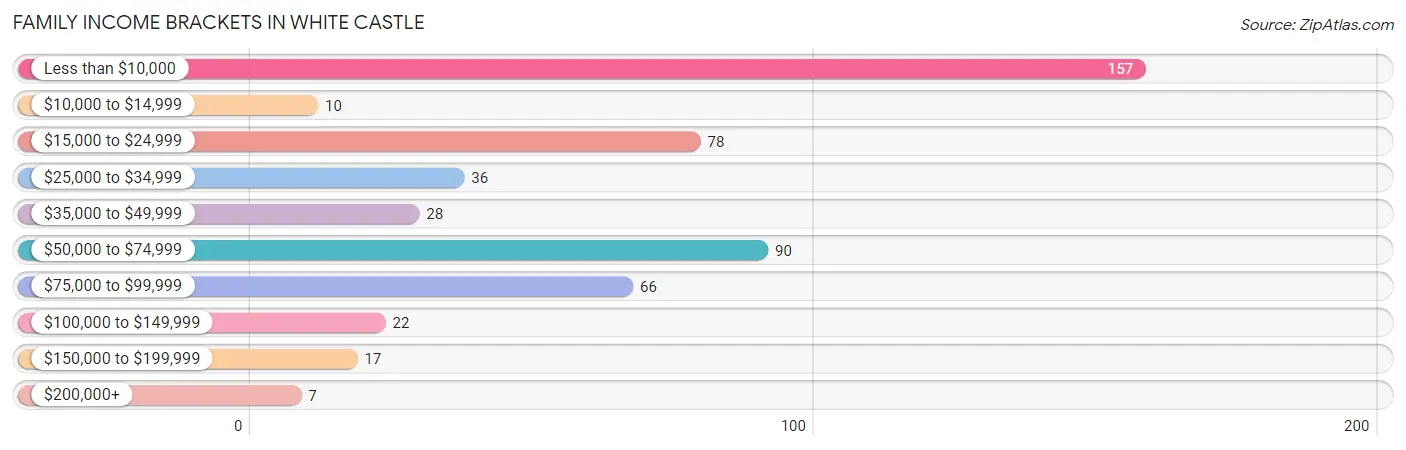
| Income Bracket | # Families | % Families |
| Less than $10,000 | 157 | 30.7% |
| $10,000 to $14,999 | 10 | 2.0% |
| $15,000 to $24,999 | 78 | 15.3% |
| $25,000 to $34,999 | 36 | 7.0% |
| $35,000 to $49,999 | 28 | 5.5% |
| $50,000 to $74,999 | 90 | 17.6% |
| $75,000 to $99,999 | 66 | 12.9% |
| $100,000 to $149,999 | 22 | 4.3% |
| $150,000 to $199,999 | 17 | 3.3% |
| $200,000+ | 7 | 1.4% |
Family Income by Famaliy Size in White Castle
2-person families (105 | 20.5%) account for the highest median family income in White Castle with $66,438 per family, while 2-person families (105 | 20.5%) have the highest median income of $33,219 per family member.
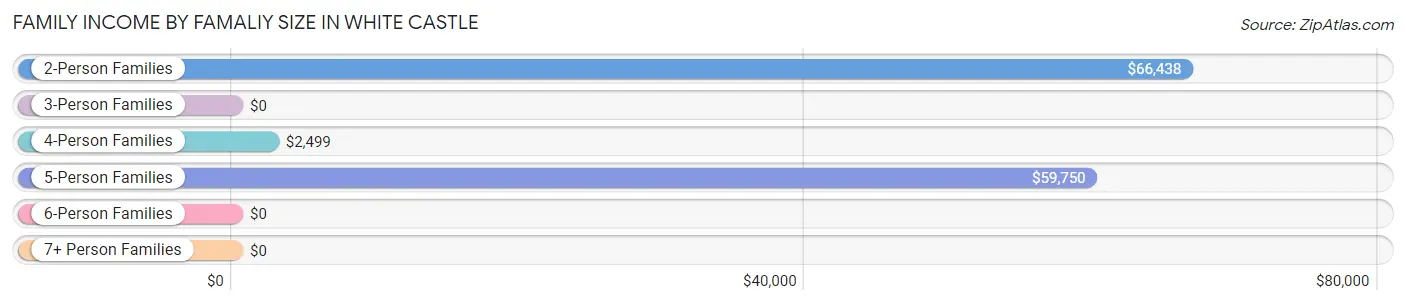
| Income Bracket | # Families | Median Income |
| 2-Person Families | 105 (20.5%) | $66,438 |
| 3-Person Families | 123 (24.1%) | $0 |
| 4-Person Families | 177 (34.6%) | $2,499 |
| 5-Person Families | 91 (17.8%) | $59,750 |
| 6-Person Families | 7 (1.4%) | $0 |
| 7+ Person Families | 8 (1.6%) | $0 |
| Total | 511 (100.0%) | $26,750 |
Family Income by Number of Earners in White Castle
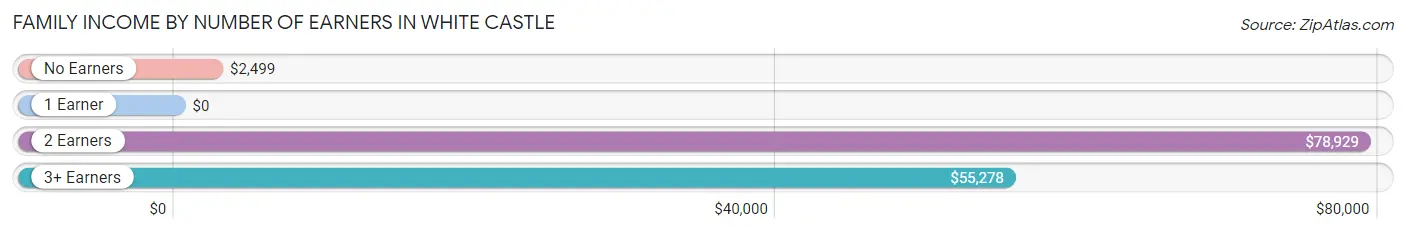
| Number of Earners | # Families | Median Income |
| No Earners | 190 (37.2%) | $2,499 |
| 1 Earner | 129 (25.2%) | $0 |
| 2 Earners | 146 (28.6%) | $78,929 |
| 3+ Earners | 46 (9.0%) | $55,278 |
| Total | 511 (100.0%) | $26,750 |
Household Income in White Castle
Household Income Brackets in White Castle
With 201 households falling in the category, the less than $10,000 income range is the most frequent in White Castle, accounting for 25.0% of all households. In contrast, only 7 households (0.9%) fall into the $200,000+ income bracket, making it the least populous group.
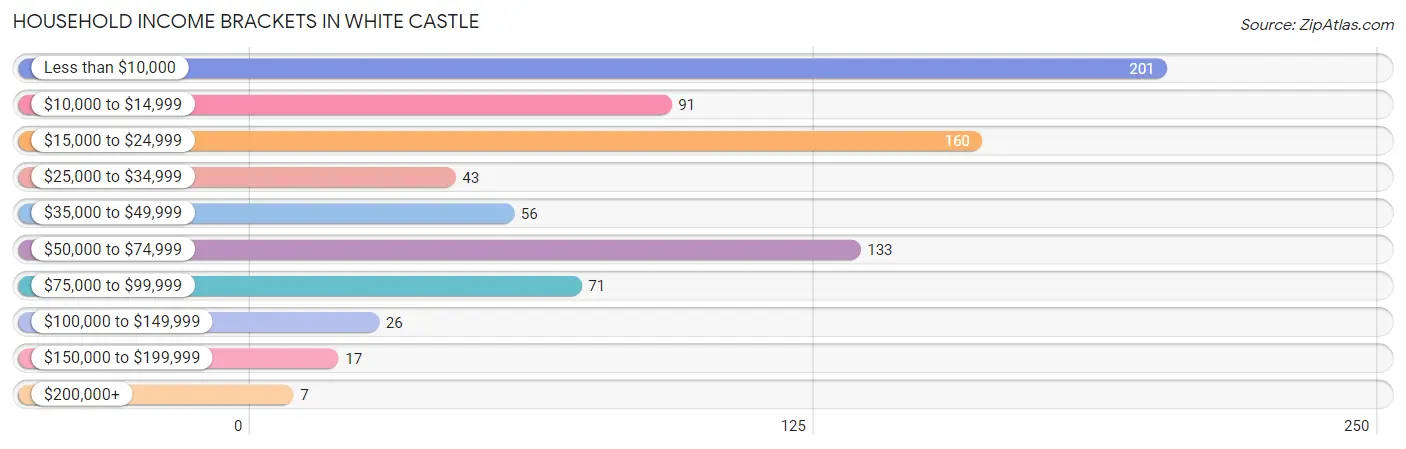
| Income Bracket | # Households | % Households |
| Less than $10,000 | 201 | 25.0% |
| $10,000 to $14,999 | 91 | 11.3% |
| $15,000 to $24,999 | 160 | 19.9% |
| $25,000 to $34,999 | 43 | 5.3% |
| $35,000 to $49,999 | 56 | 7.0% |
| $50,000 to $74,999 | 133 | 16.5% |
| $75,000 to $99,999 | 71 | 8.8% |
| $100,000 to $149,999 | 26 | 3.2% |
| $150,000 to $199,999 | 17 | 2.1% |
| $200,000+ | 7 | 0.9% |
Household Income by Householder Age in White Castle
The median household income in White Castle is $22,574, with the highest median household income of $17,644 found in the 25 to 44 years age bracket for the primary householder. A total of 333 households (41.4%) fall into this category. Meanwhile, the 15 to 24 years age bracket for the primary householder has the lowest median household income of $0, with 9 households (1.1%) in this group.
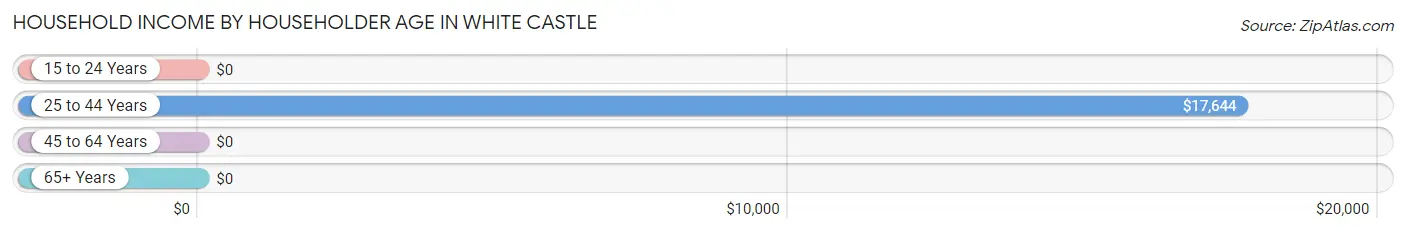
| Income Bracket | # Households | Median Income |
| 15 to 24 Years | 9 (1.1%) | $0 |
| 25 to 44 Years | 333 (41.4%) | $17,644 |
| 45 to 64 Years | 271 (33.7%) | $0 |
| 65+ Years | 192 (23.8%) | $0 |
| Total | 805 (100.0%) | $22,574 |
Poverty in White Castle
Income Below Poverty by Sex and Age in White Castle
With 42.6% poverty level for males and 52.1% for females among the residents of White Castle, under 5 year old males and 12 to 14 year old females are the most vulnerable to poverty, with 130 males (100.0%) and 95 females (100.0%) in their respective age groups living below the poverty level.
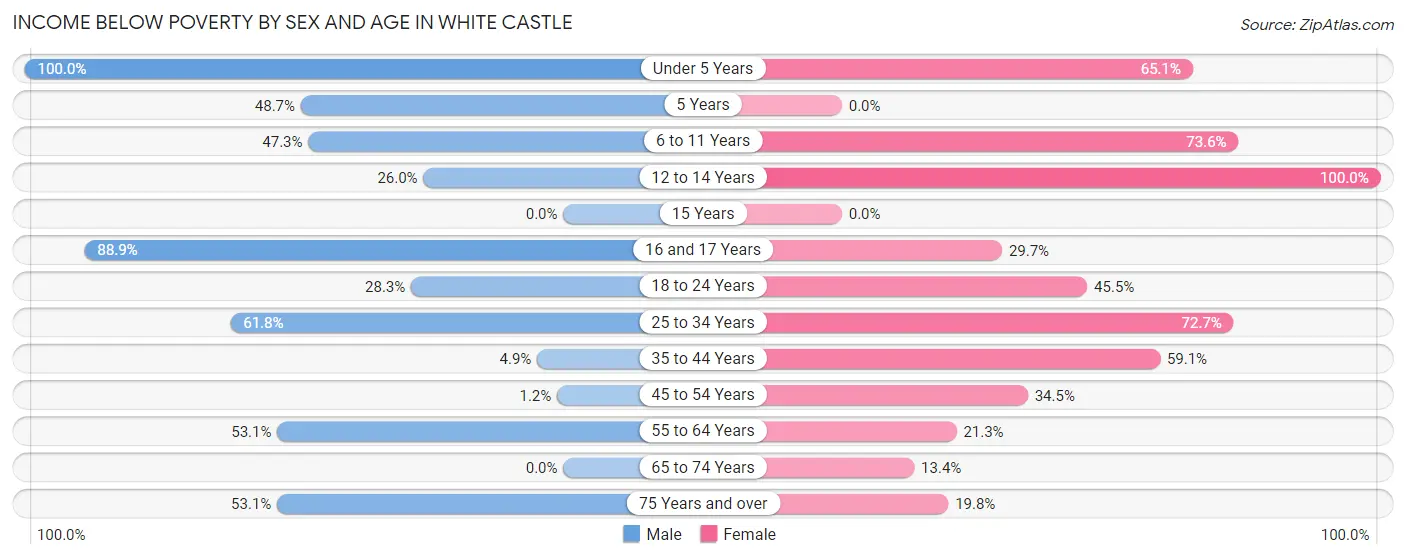
| Age Bracket | Male | Female |
| Under 5 Years | 130 (100.0%) | 71 (65.1%) |
| 5 Years | 19 (48.7%) | 0 (0.0%) |
| 6 to 11 Years | 71 (47.3%) | 106 (73.6%) |
| 12 to 14 Years | 20 (26.0%) | 95 (100.0%) |
| 15 Years | 0 (0.0%) | 0 (0.0%) |
| 16 and 17 Years | 8 (88.9%) | 11 (29.7%) |
| 18 to 24 Years | 26 (28.3%) | 92 (45.5%) |
| 25 to 34 Years | 123 (61.8%) | 72 (72.7%) |
| 35 to 44 Years | 7 (4.9%) | 137 (59.1%) |
| 45 to 54 Years | 1 (1.2%) | 49 (34.5%) |
| 55 to 64 Years | 43 (53.1%) | 20 (21.3%) |
| 65 to 74 Years | 0 (0.0%) | 9 (13.4%) |
| 75 Years and over | 17 (53.1%) | 16 (19.8%) |
| Total | 465 (42.6%) | 678 (52.1%) |
Income Above Poverty by Sex and Age in White Castle
According to the poverty statistics in White Castle, males aged 15 years and females aged 65 to 74 years are the age groups that are most secure financially, with 100.0% of males and 86.6% of females in these age groups living above the poverty line.
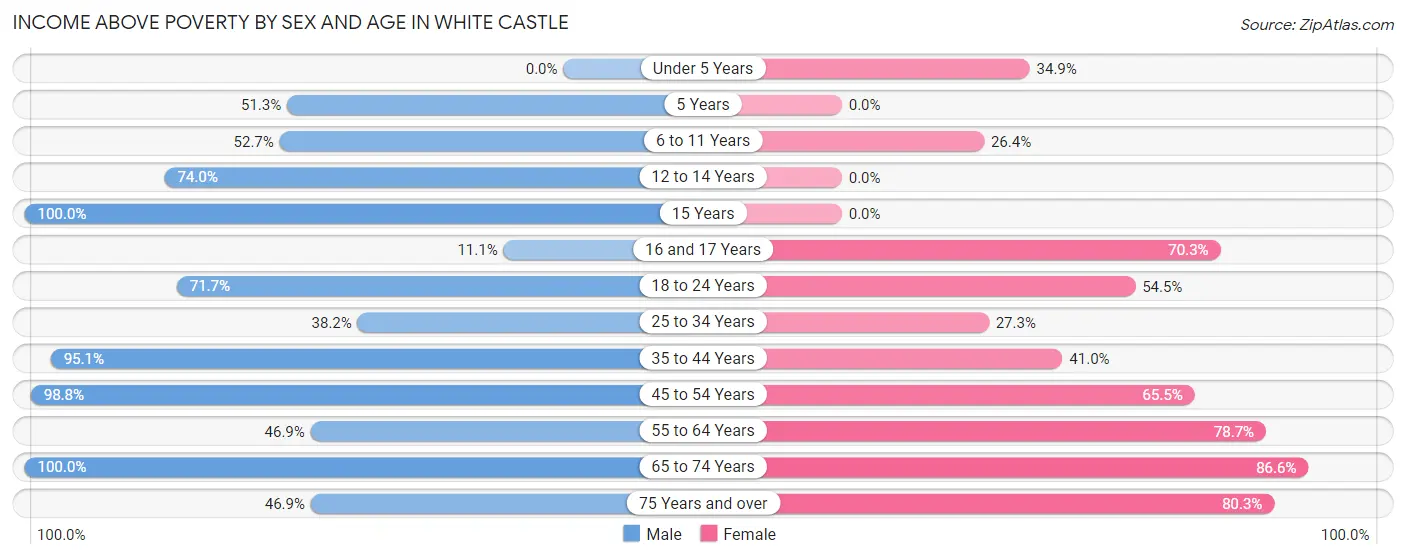
| Age Bracket | Male | Female |
| Under 5 Years | 0 (0.0%) | 38 (34.9%) |
| 5 Years | 20 (51.3%) | 0 (0.0%) |
| 6 to 11 Years | 79 (52.7%) | 38 (26.4%) |
| 12 to 14 Years | 57 (74.0%) | 0 (0.0%) |
| 15 Years | 14 (100.0%) | 0 (0.0%) |
| 16 and 17 Years | 1 (11.1%) | 26 (70.3%) |
| 18 to 24 Years | 66 (71.7%) | 110 (54.5%) |
| 25 to 34 Years | 76 (38.2%) | 27 (27.3%) |
| 35 to 44 Years | 137 (95.1%) | 95 (40.9%) |
| 45 to 54 Years | 85 (98.8%) | 93 (65.5%) |
| 55 to 64 Years | 38 (46.9%) | 74 (78.7%) |
| 65 to 74 Years | 39 (100.0%) | 58 (86.6%) |
| 75 Years and over | 15 (46.9%) | 65 (80.2%) |
| Total | 627 (57.4%) | 624 (47.9%) |
Income Below Poverty Among Married-Couple Families in White Castle
The poverty statistics for married-couple families in White Castle show that 7.6% or 10 of the total 132 families live below the poverty line. Families with 1 or 2 children have the highest poverty rate of 17.2%, comprising of 10 families. On the other hand, families with no children have the lowest poverty rate of 0.0%, which includes 0 families.
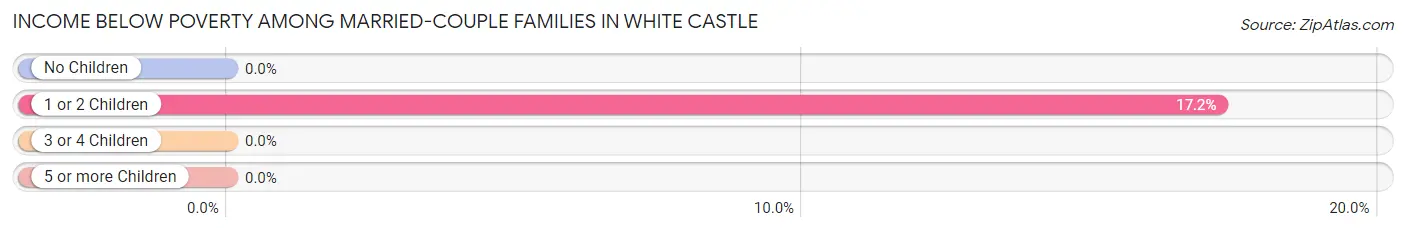
| Children | Above Poverty | Below Poverty |
| No Children | 66 (100.0%) | 0 (0.0%) |
| 1 or 2 Children | 48 (82.8%) | 10 (17.2%) |
| 3 or 4 Children | 8 (100.0%) | 0 (0.0%) |
| 5 or more Children | 0 (0.0%) | 0 (0.0%) |
| Total | 122 (92.4%) | 10 (7.6%) |
Income Below Poverty Among Single-Parent Households in White Castle
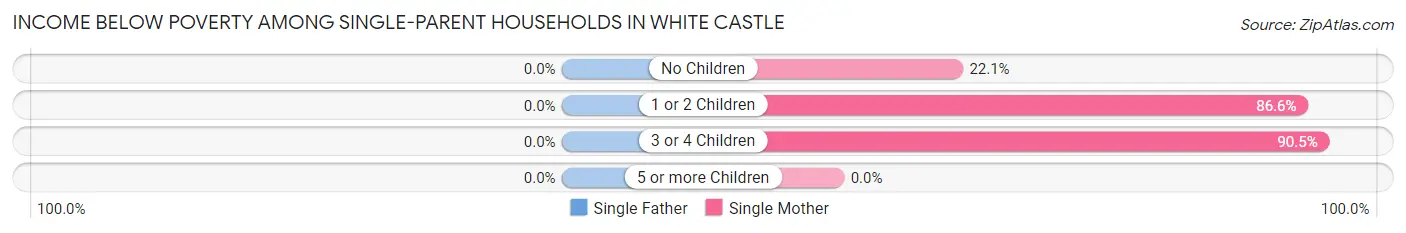
| Children | Single Father | Single Mother |
| No Children | 0 (0.0%) | 23 (22.1%) |
| 1 or 2 Children | 0 (0.0%) | 148 (86.6%) |
| 3 or 4 Children | 0 (0.0%) | 57 (90.5%) |
| 5 or more Children | 0 (0.0%) | 0 (0.0%) |
| Total | 0 (0.0%) | 228 (67.5%) |
Income Below Poverty Among Married-Couple vs Single-Parent Households in White Castle
The poverty data for White Castle shows that 10 of the married-couple family households (7.6%) and 228 of the single-parent households (60.2%) are living below the poverty level. Within the married-couple family households, those with 1 or 2 children have the highest poverty rate, with 10 households (17.2%) falling below the poverty line. Among the single-parent households, those with 1 or 2 children have the highest poverty rate, with 148 household (86.6%) living below poverty.
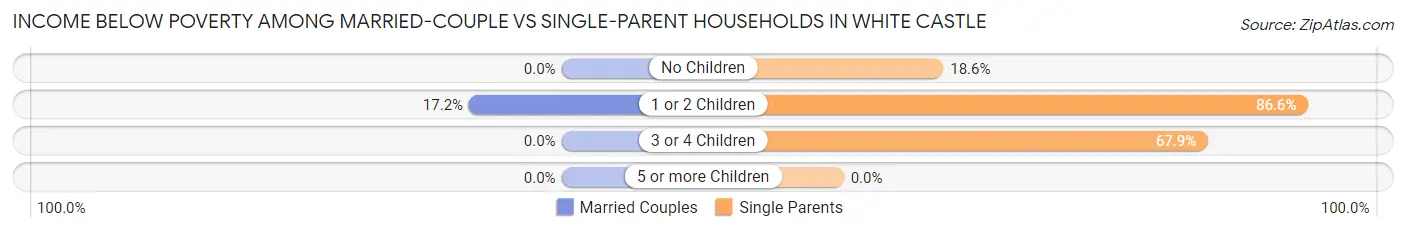
| Children | Married-Couple Families | Single-Parent Households |
| No Children | 0 (0.0%) | 23 (18.5%) |
| 1 or 2 Children | 10 (17.2%) | 148 (86.6%) |
| 3 or 4 Children | 0 (0.0%) | 57 (67.9%) |
| 5 or more Children | 0 (0.0%) | 0 (0.0%) |
| Total | 10 (7.6%) | 228 (60.2%) |
Race in White Castle
The most populous races in White Castle are Black / African American (2,255 | 94.2%), White / Caucasian (132 | 5.5%), and Two or more Races (7 | 0.3%).
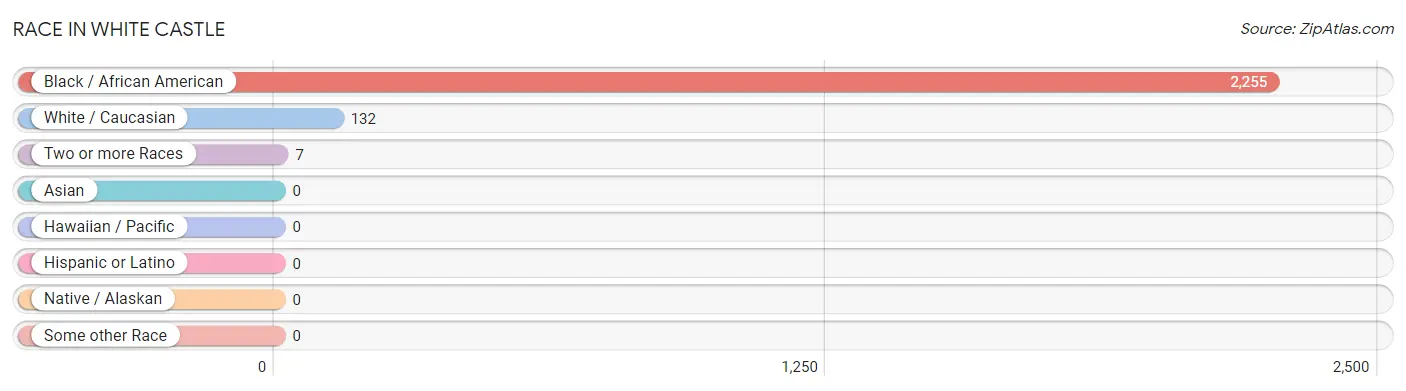
| Race | # Population | % Population |
| Asian | 0 | 0.0% |
| Black / African American | 2,255 | 94.2% |
| Hawaiian / Pacific | 0 | 0.0% |
| Hispanic or Latino | 0 | 0.0% |
| Native / Alaskan | 0 | 0.0% |
| White / Caucasian | 132 | 5.5% |
| Two or more Races | 7 | 0.3% |
| Some other Race | 0 | 0.0% |
| Total | 2,394 | 100.0% |
Ancestry in White Castle
The most populous ancestries reported in White Castle are American (72 | 3.0%), French (53 | 2.2%), Italian (22 | 0.9%), French Canadian (21 | 0.9%), and German (12 | 0.5%), together accounting for 7.5% of all White Castle residents.
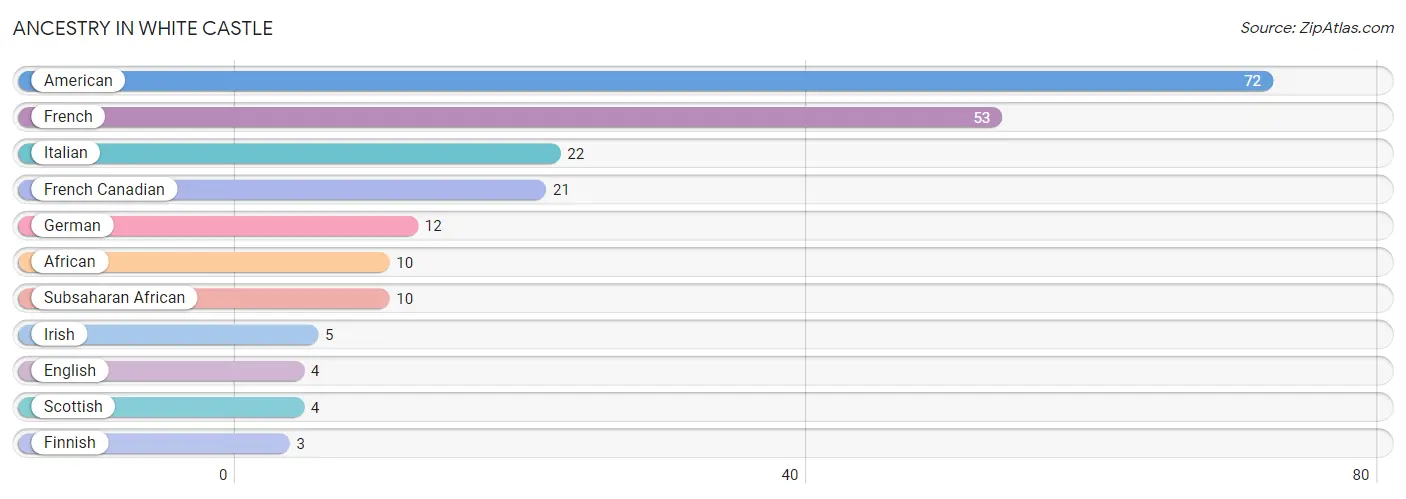
| Ancestry | # Population | % Population |
| African | 10 | 0.4% |
| American | 72 | 3.0% |
| English | 4 | 0.2% |
| Finnish | 3 | 0.1% |
| French | 53 | 2.2% |
| French Canadian | 21 | 0.9% |
| German | 12 | 0.5% |
| Irish | 5 | 0.2% |
| Italian | 22 | 0.9% |
| Scottish | 4 | 0.2% |
| Subsaharan African | 10 | 0.4% | View All 11 Rows |
Immigrants in White Castle
The most numerous immigrant groups reported in White Castle came from Central America (5 | 0.2%), Latin America (5 | 0.2%), and Panama (5 | 0.2%), together accounting for 0.6% of all White Castle residents.
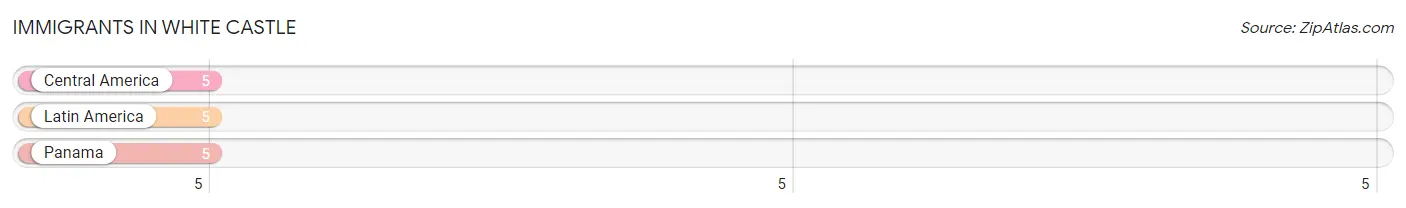
| Immigration Origin | # Population | % Population |
| Central America | 5 | 0.2% |
| Latin America | 5 | 0.2% |
| Panama | 5 | 0.2% | View All 3 Rows |
Sex and Age in White Castle
Sex and Age in White Castle
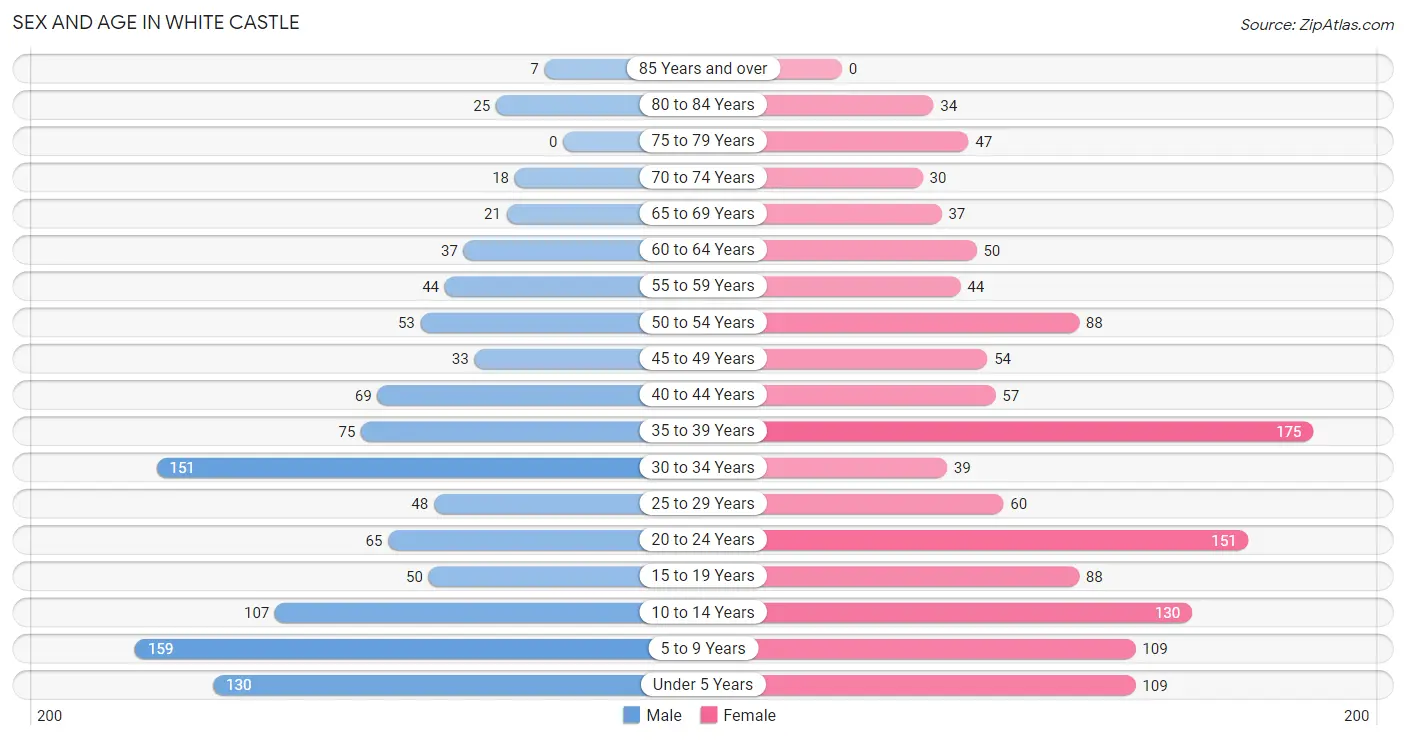
The most populous age groups in White Castle are 5 to 9 Years (159 | 14.6%) for men and 35 to 39 Years (175 | 13.4%) for women.
| Age Bracket | Male | Female |
| Under 5 Years | 130 (11.9%) | 109 (8.4%) |
| 5 to 9 Years | 159 (14.6%) | 109 (8.4%) |
| 10 to 14 Years | 107 (9.8%) | 130 (10.0%) |
| 15 to 19 Years | 50 (4.6%) | 88 (6.8%) |
| 20 to 24 Years | 65 (5.9%) | 151 (11.6%) |
| 25 to 29 Years | 48 (4.4%) | 60 (4.6%) |
| 30 to 34 Years | 151 (13.8%) | 39 (3.0%) |
| 35 to 39 Years | 75 (6.9%) | 175 (13.4%) |
| 40 to 44 Years | 69 (6.3%) | 57 (4.4%) |
| 45 to 49 Years | 33 (3.0%) | 54 (4.2%) |
| 50 to 54 Years | 53 (4.9%) | 88 (6.8%) |
| 55 to 59 Years | 44 (4.0%) | 44 (3.4%) |
| 60 to 64 Years | 37 (3.4%) | 50 (3.8%) |
| 65 to 69 Years | 21 (1.9%) | 37 (2.8%) |
| 70 to 74 Years | 18 (1.7%) | 30 (2.3%) |
| 75 to 79 Years | 0 (0.0%) | 47 (3.6%) |
| 80 to 84 Years | 25 (2.3%) | 34 (2.6%) |
| 85 Years and over | 7 (0.6%) | 0 (0.0%) |
| Total | 1,092 (100.0%) | 1,302 (100.0%) |
Families and Households in White Castle
Median Family Size in White Castle
The median family size in White Castle is 3.77 persons per family, with married-couple families (132 | 25.8%) accounting for the largest median family size of 4.74 persons per family. On the other hand, single male/father families (41 | 8.0%) represent the smallest median family size with 3.12 persons per family.
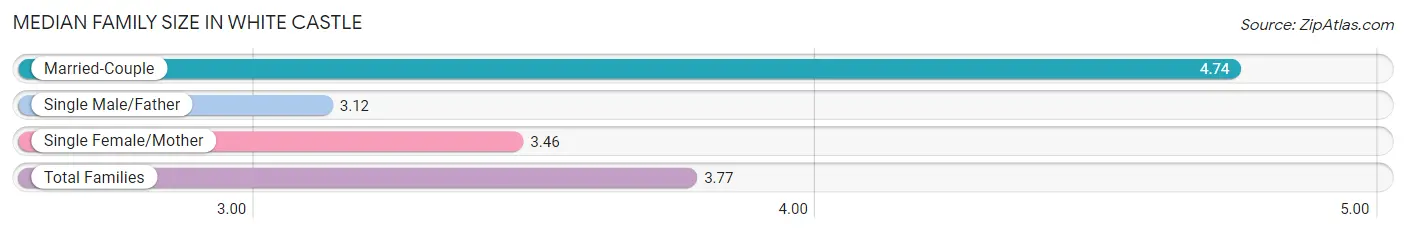
| Family Type | # Families | Family Size |
| Married-Couple | 132 (25.8%) | 4.74 |
| Single Male/Father | 41 (8.0%) | 3.12 |
| Single Female/Mother | 338 (66.1%) | 3.46 |
| Total Families | 511 (100.0%) | 3.77 |
Median Household Size in White Castle
The median household size in White Castle is 2.97 persons per household, with married-couple households (132 | 16.4%) accounting for the largest median household size of 4.74 persons per household. non-family households (294 | 36.5%) represent the smallest median household size with 1.25 persons per household.
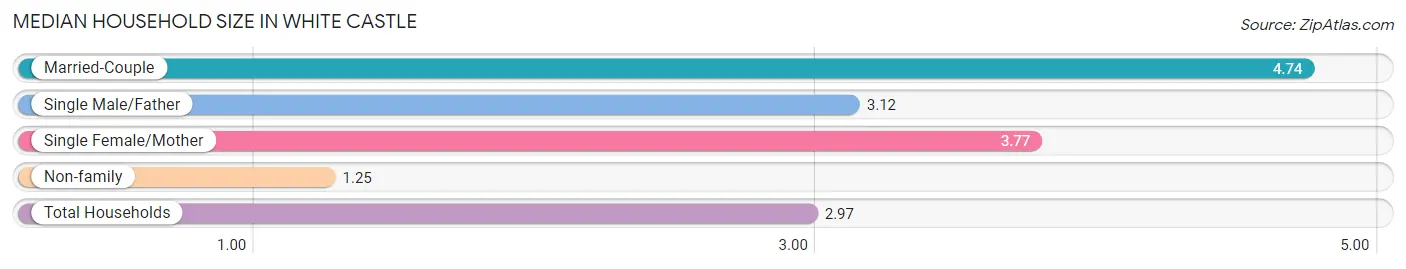
| Household Type | # Households | Household Size |
| Married-Couple | 132 (16.4%) | 4.74 |
| Single Male/Father | 41 (5.1%) | 3.12 |
| Single Female/Mother | 338 (42.0%) | 3.77 |
| Non-family | 294 (36.5%) | 1.25 |
| Total Households | 805 (100.0%) | 2.97 |
Household Size by Marriage Status in White Castle
Out of a total of 805 households in White Castle, 511 (63.5%) are family households, while 294 (36.5%) are nonfamily households. The most numerous type of family households are 4-person households, comprising 200, and the most common type of nonfamily households are 1-person households, comprising 262.
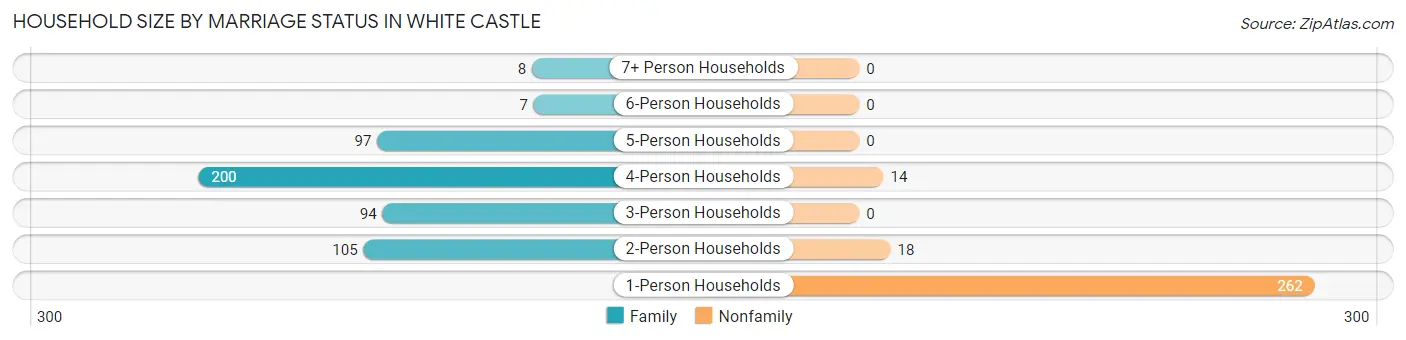
| Household Size | Family Households | Nonfamily Households |
| 1-Person Households | - | 262 (32.6%) |
| 2-Person Households | 105 (13.0%) | 18 (2.2%) |
| 3-Person Households | 94 (11.7%) | 0 (0.0%) |
| 4-Person Households | 200 (24.8%) | 14 (1.7%) |
| 5-Person Households | 97 (12.0%) | 0 (0.0%) |
| 6-Person Households | 7 (0.9%) | 0 (0.0%) |
| 7+ Person Households | 8 (1.0%) | 0 (0.0%) |
| Total | 511 (63.5%) | 294 (36.5%) |
Female Fertility in White Castle
Fertility by Age in White Castle
Average fertility rate in White Castle is 112.0 births per 1,000 women. Women in the age bracket of 20 to 34 years have the highest fertility rate with 292.0 births per 1,000 women. Women in the age bracket of 20 to 34 years acount for 100.0% of all women with births.
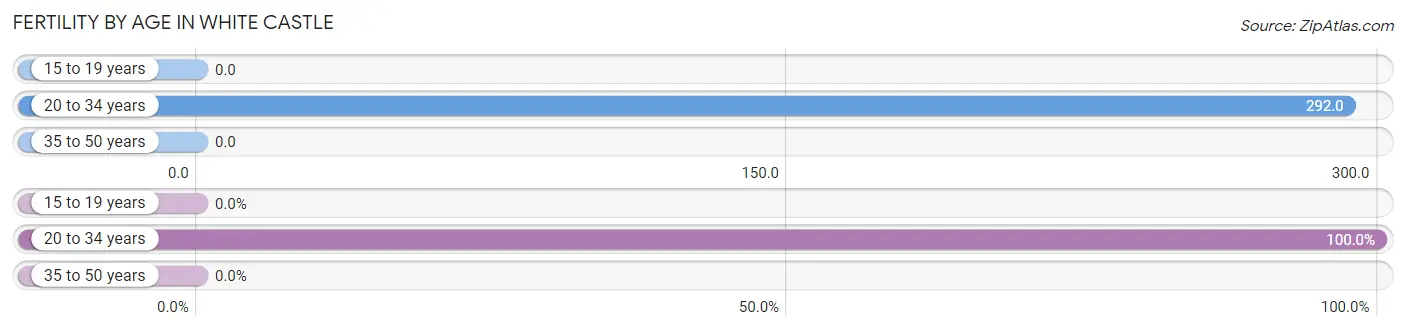
| Age Bracket | Women with Births | Births / 1,000 Women |
| 15 to 19 years | 0 (0.0%) | 0.0 |
| 20 to 34 years | 73 (100.0%) | 292.0 |
| 35 to 50 years | 0 (0.0%) | 0.0 |
| Total | 73 (100.0%) | 112.0 |
Fertility by Age by Marriage Status in White Castle
1.4% of women with births (73) in White Castle are married. The highest percentage of unmarried women with births falls into 20 to 34 years age bracket with 98.6% of them unmarried at the time of birth, while the lowest percentage of unmarried women with births belong to 20 to 34 years age bracket with 98.6% of them unmarried.
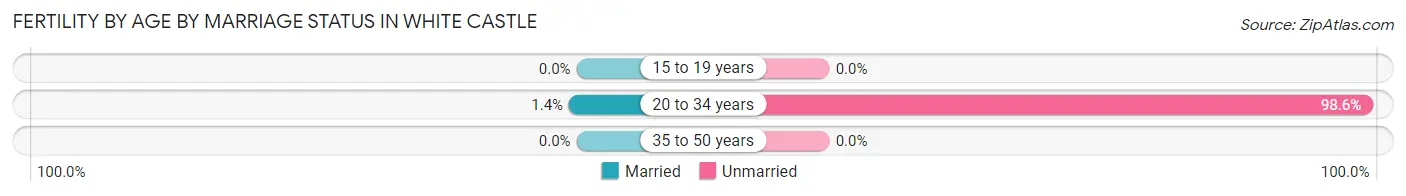
| Age Bracket | Married | Unmarried |
| 15 to 19 years | 0 (0.0%) | 0 (0.0%) |
| 20 to 34 years | 1 (1.4%) | 72 (98.6%) |
| 35 to 50 years | 0 (0.0%) | 0 (0.0%) |
| Total | 1 (1.4%) | 72 (98.6%) |
Fertility by Education in White Castle
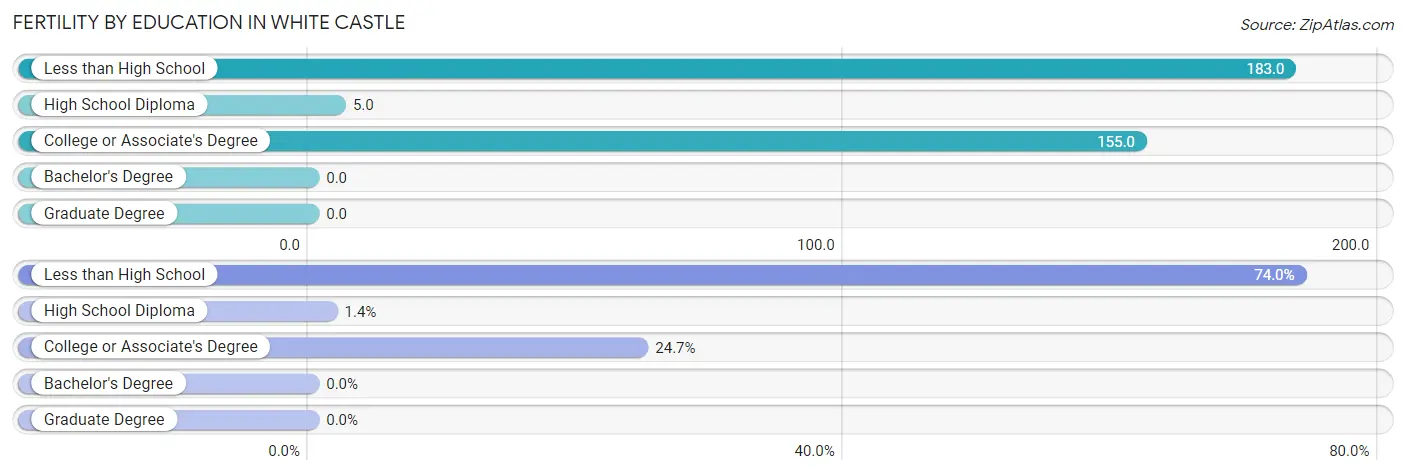
| Educational Attainment | Women with Births | Births / 1,000 Women |
| Less than High School | 54 (74.0%) | 183.0 |
| High School Diploma | 1 (1.4%) | 5.0 |
| College or Associate's Degree | 18 (24.7%) | 155.0 |
| Bachelor's Degree | 0 (0.0%) | 0.0 |
| Graduate Degree | 0 (0.0%) | 0.0 |
| Total | 73 (100.0%) | 112.0 |
Fertility by Education by Marriage Status in White Castle
98.6% of women with births in White Castle are unmarried. Women with the educational attainment of high school diploma are most likely to be married with 100.0% of them married at childbirth, while women with the educational attainment of less than high school are least likely to be married with 100.0% of them unmarried at childbirth.
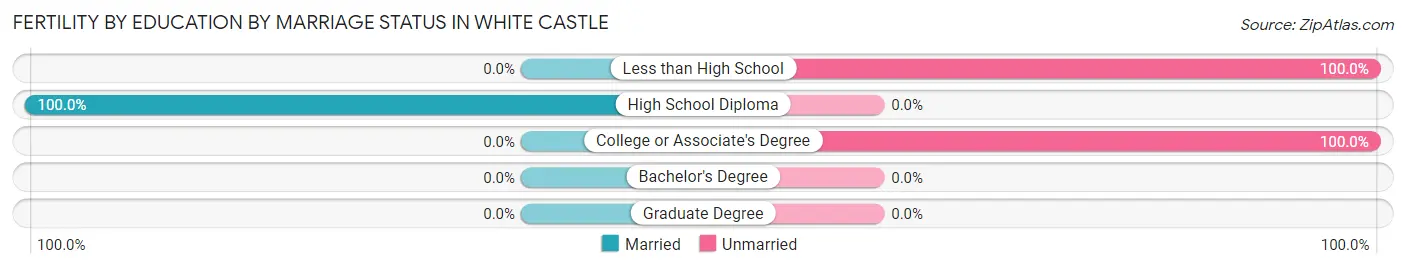
| Educational Attainment | Married | Unmarried |
| Less than High School | 0 (0.0%) | 54 (100.0%) |
| High School Diploma | 1 (100.0%) | 0 (0.0%) |
| College or Associate's Degree | 0 (0.0%) | 18 (100.0%) |
| Bachelor's Degree | 0 (0.0%) | 0 (0.0%) |
| Graduate Degree | 0 (0.0%) | 0 (0.0%) |
| Total | 1 (1.4%) | 72 (98.6%) |
Employment Characteristics in White Castle
Employment by Class of Employer in White Castle
Among the 665 employed individuals in White Castle, private company employees (448 | 67.4%), not-for-profit organizations (75 | 11.3%), and local government employees (49 | 7.4%) make up the most common classes of employment.
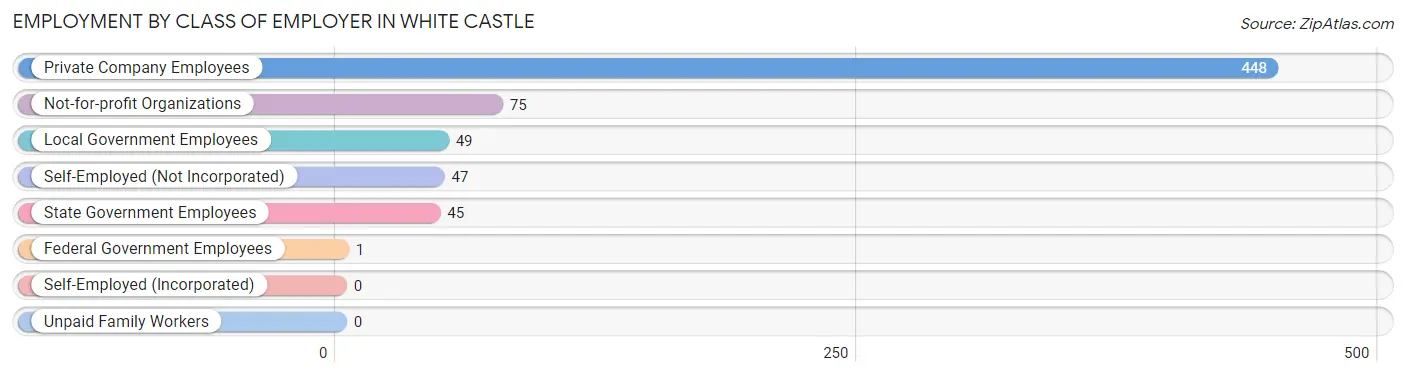
| Employer Class | # Employees | % Employees |
| Private Company Employees | 448 | 67.4% |
| Self-Employed (Incorporated) | 0 | 0.0% |
| Self-Employed (Not Incorporated) | 47 | 7.1% |
| Not-for-profit Organizations | 75 | 11.3% |
| Local Government Employees | 49 | 7.4% |
| State Government Employees | 45 | 6.8% |
| Federal Government Employees | 1 | 0.2% |
| Unpaid Family Workers | 0 | 0.0% |
| Total | 665 | 100.0% |
Employment Status by Age in White Castle
According to the labor force statistics for White Castle, out of the total population over 16 years of age (1,636), 50.1% or 820 individuals are in the labor force, with 18.7% or 153 of them unemployed. The age group with the highest labor force participation rate is 30 to 34 years, with 82.6% or 157 individuals in the labor force. Within the labor force, the 30 to 34 years age range has the highest percentage of unemployed individuals, with 66.9% or 105 of them being unemployed.
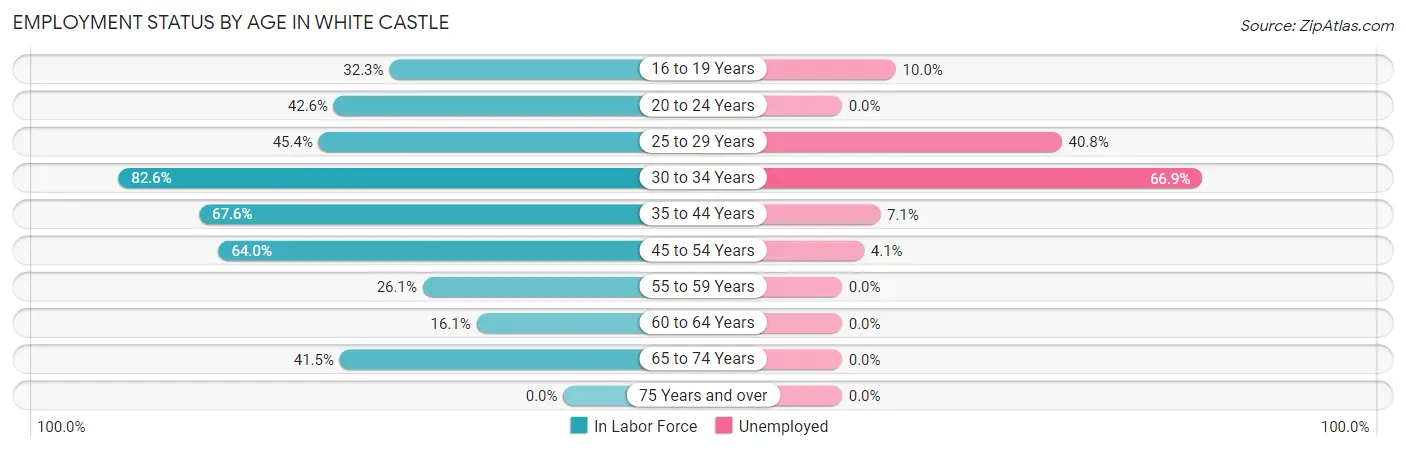
| Age Bracket | In Labor Force | Unemployed |
| 16 to 19 Years | 40 (32.3%) | 4 (10.0%) |
| 20 to 24 Years | 92 (42.6%) | 0 (0.0%) |
| 25 to 29 Years | 49 (45.4%) | 20 (40.8%) |
| 30 to 34 Years | 157 (82.6%) | 105 (66.9%) |
| 35 to 44 Years | 254 (67.6%) | 18 (7.1%) |
| 45 to 54 Years | 146 (64.0%) | 6 (4.1%) |
| 55 to 59 Years | 23 (26.1%) | 0 (0.0%) |
| 60 to 64 Years | 14 (16.1%) | 0 (0.0%) |
| 65 to 74 Years | 44 (41.5%) | 0 (0.0%) |
| 75 Years and over | 0 (0.0%) | 0 (0.0%) |
| Total | 820 (50.1%) | 153 (18.7%) |
Employment Status by Educational Attainment in White Castle
According to labor force statistics for White Castle, 59.7% of individuals (643) out of the total population between 25 and 64 years of age (1,077) are in the labor force, with 23.2% or 149 of them being unemployed. The group with the highest labor force participation rate are those with the educational attainment of high school diploma, with 72.7% or 362 individuals in the labor force. Within the labor force, individuals with high school diploma education have the highest percentage of unemployment, with 33.1% or 120 of them being unemployed.
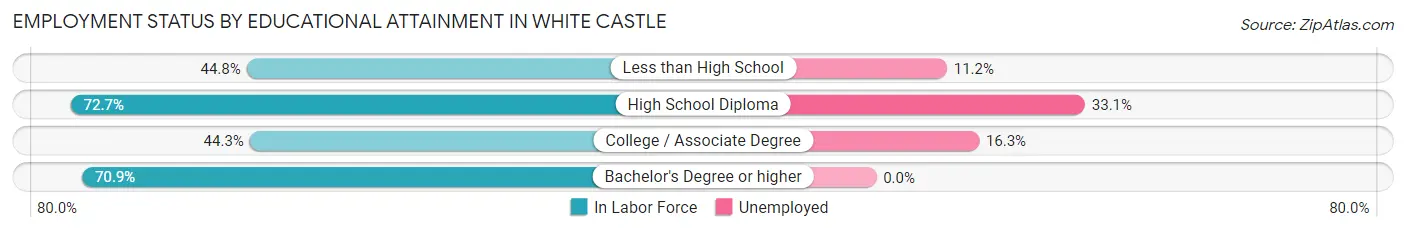
| Educational Attainment | In Labor Force | Unemployed |
| Less than High School | 134 (44.8%) | 33 (11.2%) |
| High School Diploma | 362 (72.7%) | 165 (33.1%) |
| College / Associate Degree | 86 (44.3%) | 32 (16.3%) |
| Bachelor's Degree or higher | 61 (70.9%) | 0 (0.0%) |
| Total | 643 (59.7%) | 250 (23.2%) |
Employment Occupations by Sex in White Castle
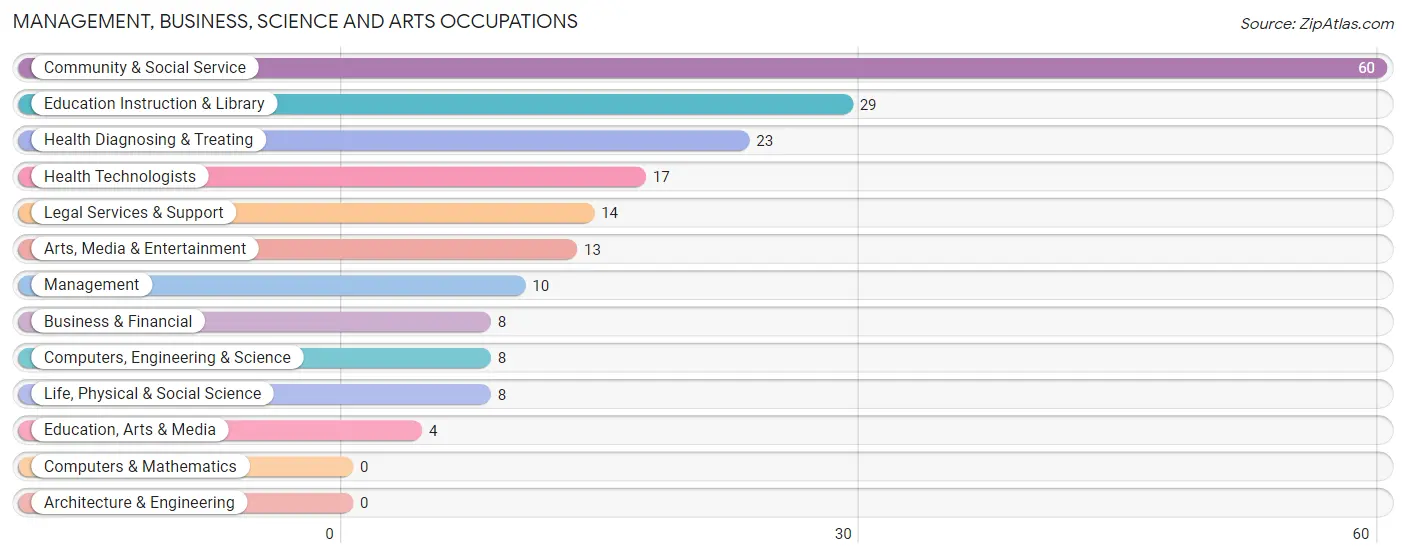
Management, Business, Science and Arts Occupations
The most common Management, Business, Science and Arts occupations in White Castle are Community & Social Service (60 | 9.0%), Education Instruction & Library (29 | 4.3%), Health Diagnosing & Treating (23 | 3.5%), Health Technologists (17 | 2.5%), and Legal Services & Support (14 | 2.1%).
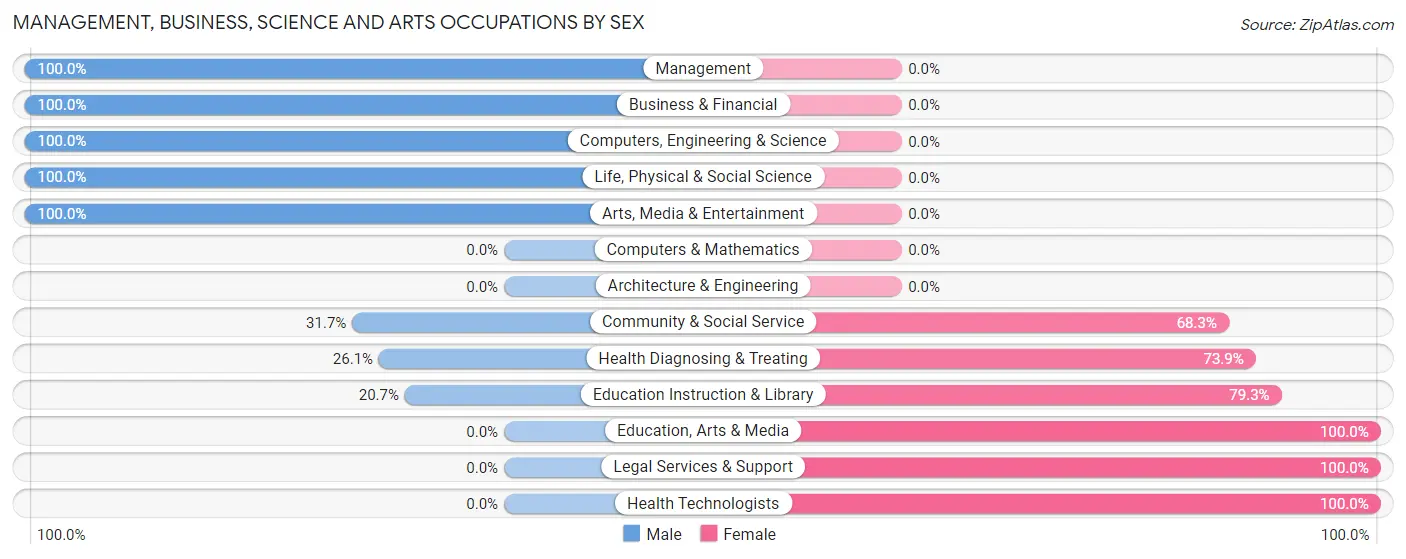
Management, Business, Science and Arts Occupations by Sex
Within the Management, Business, Science and Arts occupations in White Castle, the most male-oriented occupations are Management (100.0%), Business & Financial (100.0%), and Computers, Engineering & Science (100.0%), while the most female-oriented occupations are Education, Arts & Media (100.0%), Legal Services & Support (100.0%), and Health Technologists (100.0%).
| Occupation | Male | Female |
| Management | 10 (100.0%) | 0 (0.0%) |
| Business & Financial | 8 (100.0%) | 0 (0.0%) |
| Computers, Engineering & Science | 8 (100.0%) | 0 (0.0%) |
| Computers & Mathematics | 0 (0.0%) | 0 (0.0%) |
| Architecture & Engineering | 0 (0.0%) | 0 (0.0%) |
| Life, Physical & Social Science | 8 (100.0%) | 0 (0.0%) |
| Community & Social Service | 19 (31.7%) | 41 (68.3%) |
| Education, Arts & Media | 0 (0.0%) | 4 (100.0%) |
| Legal Services & Support | 0 (0.0%) | 14 (100.0%) |
| Education Instruction & Library | 6 (20.7%) | 23 (79.3%) |
| Arts, Media & Entertainment | 13 (100.0%) | 0 (0.0%) |
| Health Diagnosing & Treating | 6 (26.1%) | 17 (73.9%) |
| Health Technologists | 0 (0.0%) | 17 (100.0%) |
| Total (Category) | 51 (46.8%) | 58 (53.2%) |
| Total (Overall) | 304 (45.7%) | 362 (54.3%) |
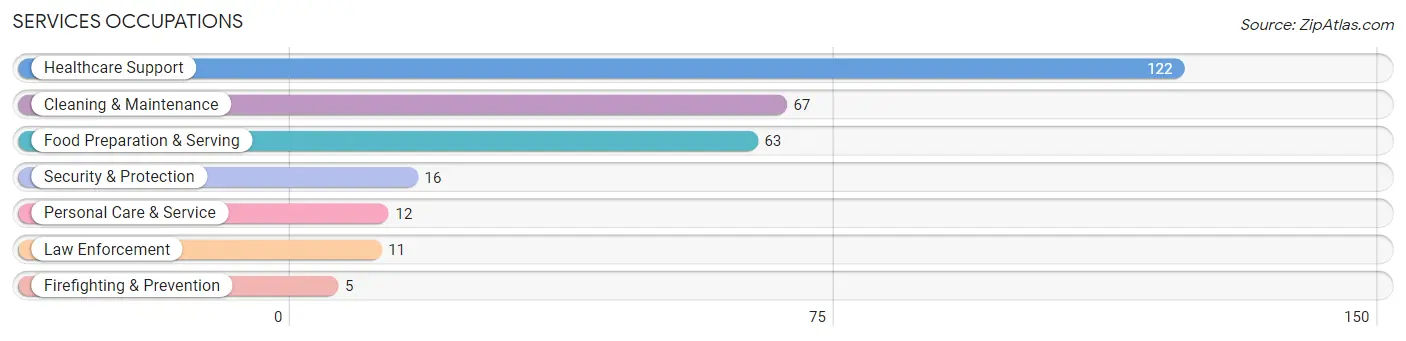
Services Occupations
The most common Services occupations in White Castle are Healthcare Support (122 | 18.3%), Cleaning & Maintenance (67 | 10.1%), Food Preparation & Serving (63 | 9.5%), Security & Protection (16 | 2.4%), and Personal Care & Service (12 | 1.8%).
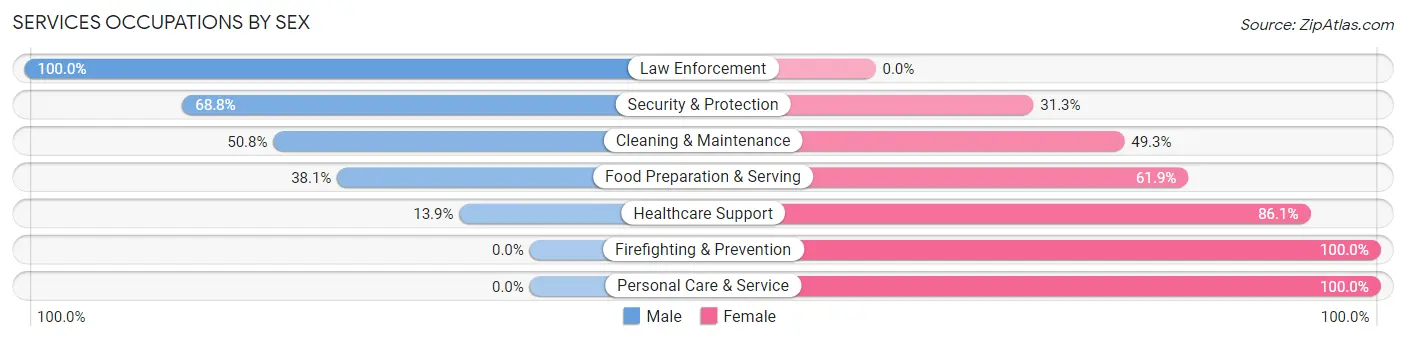
Services Occupations by Sex
Within the Services occupations in White Castle, the most male-oriented occupations are Law Enforcement (100.0%), Security & Protection (68.8%), and Cleaning & Maintenance (50.7%), while the most female-oriented occupations are Firefighting & Prevention (100.0%), Personal Care & Service (100.0%), and Healthcare Support (86.1%).
| Occupation | Male | Female |
| Healthcare Support | 17 (13.9%) | 105 (86.1%) |
| Security & Protection | 11 (68.8%) | 5 (31.2%) |
| Firefighting & Prevention | 0 (0.0%) | 5 (100.0%) |
| Law Enforcement | 11 (100.0%) | 0 (0.0%) |
| Food Preparation & Serving | 24 (38.1%) | 39 (61.9%) |
| Cleaning & Maintenance | 34 (50.7%) | 33 (49.2%) |
| Personal Care & Service | 0 (0.0%) | 12 (100.0%) |
| Total (Category) | 86 (30.7%) | 194 (69.3%) |
| Total (Overall) | 304 (45.7%) | 362 (54.3%) |
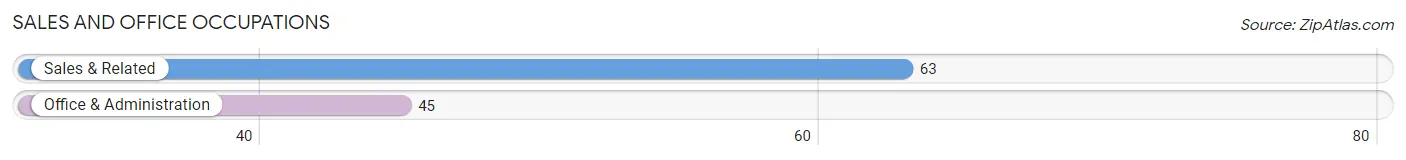
Sales and Office Occupations
The most common Sales and Office occupations in White Castle are Sales & Related (63 | 9.5%), and Office & Administration (45 | 6.8%).
Sales and Office Occupations by Sex
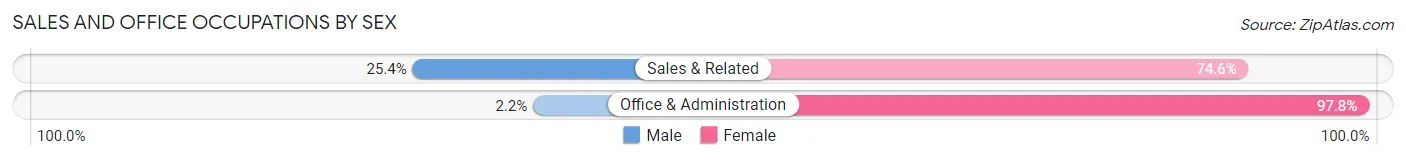
| Occupation | Male | Female |
| Sales & Related | 16 (25.4%) | 47 (74.6%) |
| Office & Administration | 1 (2.2%) | 44 (97.8%) |
| Total (Category) | 17 (15.7%) | 91 (84.3%) |
| Total (Overall) | 304 (45.7%) | 362 (54.3%) |
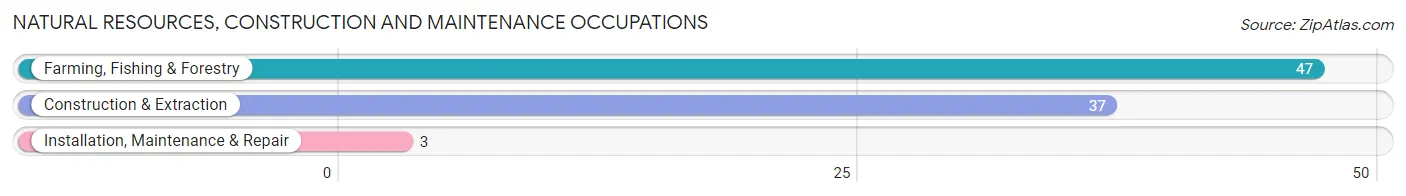
Natural Resources, Construction and Maintenance Occupations
The most common Natural Resources, Construction and Maintenance occupations in White Castle are Farming, Fishing & Forestry (47 | 7.1%), Construction & Extraction (37 | 5.6%), and Installation, Maintenance & Repair (3 | 0.4%).
Natural Resources, Construction and Maintenance Occupations by Sex
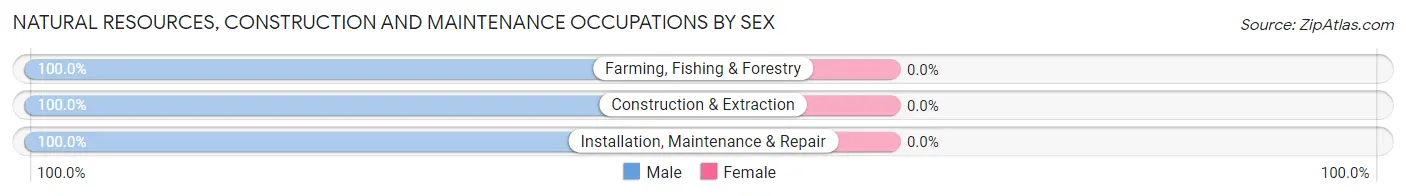
| Occupation | Male | Female |
| Farming, Fishing & Forestry | 47 (100.0%) | 0 (0.0%) |
| Construction & Extraction | 37 (100.0%) | 0 (0.0%) |
| Installation, Maintenance & Repair | 3 (100.0%) | 0 (0.0%) |
| Total (Category) | 87 (100.0%) | 0 (0.0%) |
| Total (Overall) | 304 (45.7%) | 362 (54.3%) |
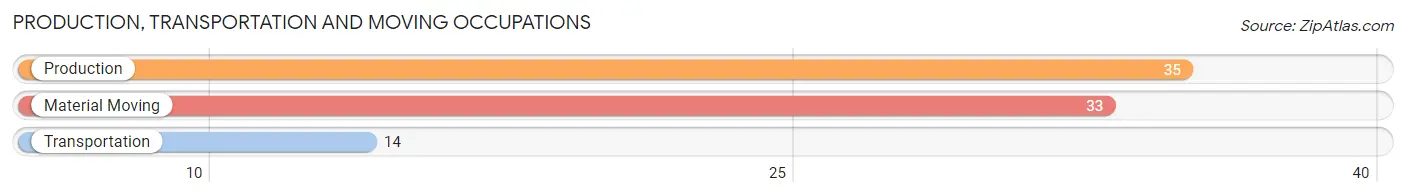
Production, Transportation and Moving Occupations
The most common Production, Transportation and Moving occupations in White Castle are Production (35 | 5.3%), Material Moving (33 | 5.0%), and Transportation (14 | 2.1%).
Production, Transportation and Moving Occupations by Sex
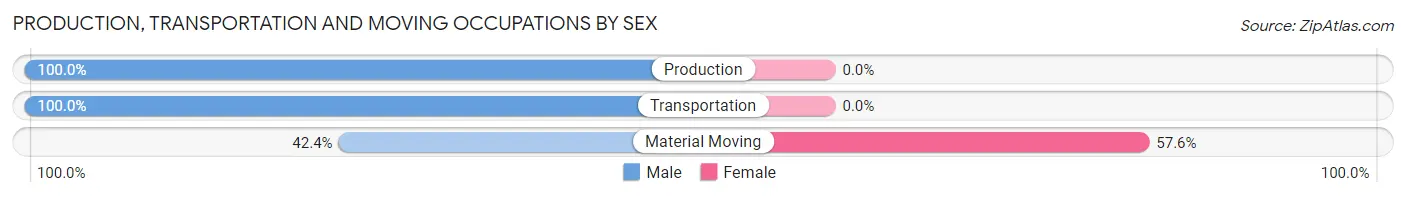
| Occupation | Male | Female |
| Production | 35 (100.0%) | 0 (0.0%) |
| Transportation | 14 (100.0%) | 0 (0.0%) |
| Material Moving | 14 (42.4%) | 19 (57.6%) |
| Total (Category) | 63 (76.8%) | 19 (23.2%) |
| Total (Overall) | 304 (45.7%) | 362 (54.3%) |
Employment Industries by Sex in White Castle
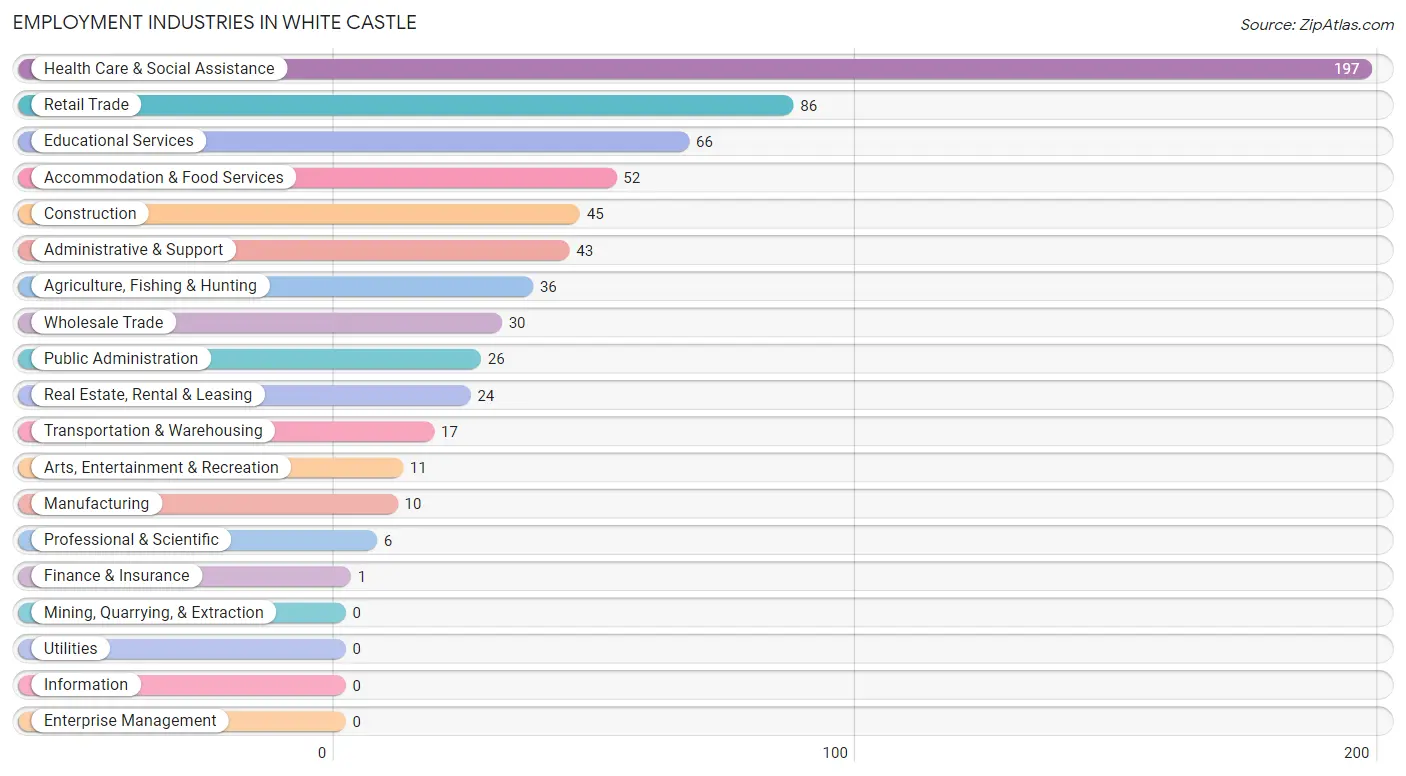
Employment Industries in White Castle
The major employment industries in White Castle include Health Care & Social Assistance (197 | 29.6%), Retail Trade (86 | 12.9%), Educational Services (66 | 9.9%), Accommodation & Food Services (52 | 7.8%), and Construction (45 | 6.8%).
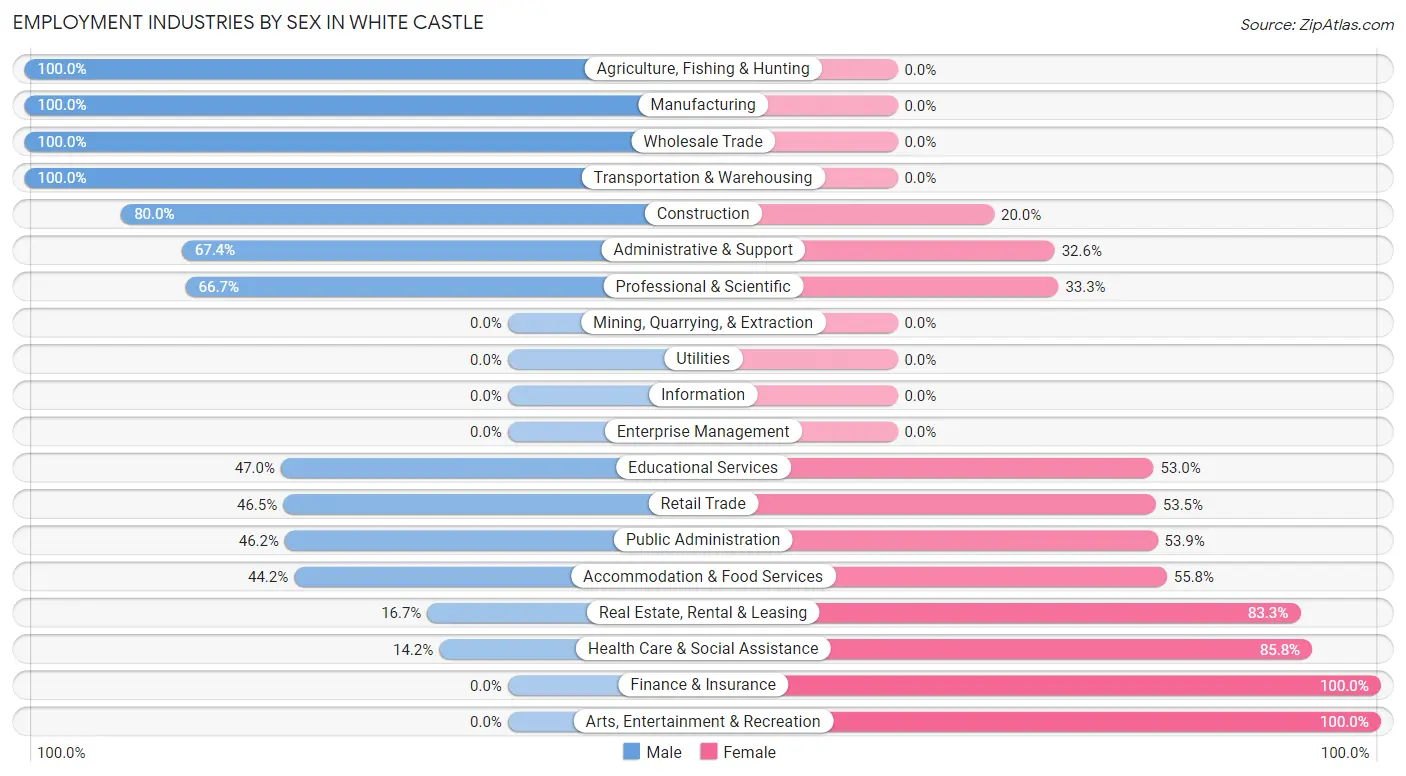
Employment Industries by Sex in White Castle
The White Castle industries that see more men than women are Agriculture, Fishing & Hunting (100.0%), Manufacturing (100.0%), and Wholesale Trade (100.0%), whereas the industries that tend to have a higher number of women are Finance & Insurance (100.0%), Arts, Entertainment & Recreation (100.0%), and Health Care & Social Assistance (85.8%).
| Industry | Male | Female |
| Agriculture, Fishing & Hunting | 36 (100.0%) | 0 (0.0%) |
| Mining, Quarrying, & Extraction | 0 (0.0%) | 0 (0.0%) |
| Construction | 36 (80.0%) | 9 (20.0%) |
| Manufacturing | 10 (100.0%) | 0 (0.0%) |
| Wholesale Trade | 30 (100.0%) | 0 (0.0%) |
| Retail Trade | 40 (46.5%) | 46 (53.5%) |
| Transportation & Warehousing | 17 (100.0%) | 0 (0.0%) |
| Utilities | 0 (0.0%) | 0 (0.0%) |
| Information | 0 (0.0%) | 0 (0.0%) |
| Finance & Insurance | 0 (0.0%) | 1 (100.0%) |
| Real Estate, Rental & Leasing | 4 (16.7%) | 20 (83.3%) |
| Professional & Scientific | 4 (66.7%) | 2 (33.3%) |
| Enterprise Management | 0 (0.0%) | 0 (0.0%) |
| Administrative & Support | 29 (67.4%) | 14 (32.6%) |
| Educational Services | 31 (47.0%) | 35 (53.0%) |
| Health Care & Social Assistance | 28 (14.2%) | 169 (85.8%) |
| Arts, Entertainment & Recreation | 0 (0.0%) | 11 (100.0%) |
| Accommodation & Food Services | 23 (44.2%) | 29 (55.8%) |
| Public Administration | 12 (46.2%) | 14 (53.8%) |
| Total | 304 (45.7%) | 362 (54.3%) |
Education in White Castle
School Enrollment in White Castle
The most common levels of schooling among the 758 students in White Castle are high school (213 | 28.1%), elementary school (210 | 27.7%), and middle school (126 | 16.6%).
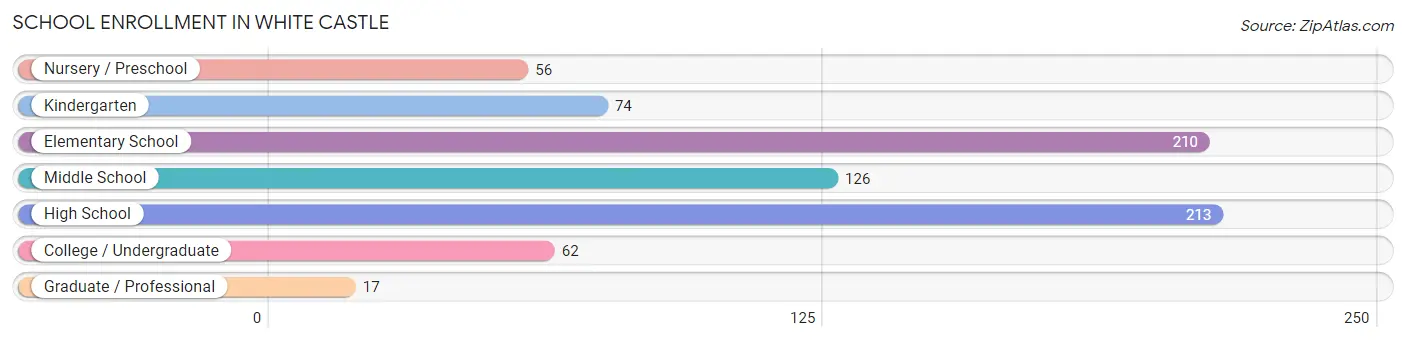
| School Level | # Students | % Students |
| Nursery / Preschool | 56 | 7.4% |
| Kindergarten | 74 | 9.8% |
| Elementary School | 210 | 27.7% |
| Middle School | 126 | 16.6% |
| High School | 213 | 28.1% |
| College / Undergraduate | 62 | 8.2% |
| Graduate / Professional | 17 | 2.2% |
| Total | 758 | 100.0% |
School Enrollment by Age by Funding Source in White Castle
Out of a total of 758 students who are enrolled in schools in White Castle, 41 (5.4%) attend a private institution, while the remaining 717 (94.6%) are enrolled in public schools. The age group of 35 years and over has the highest likelihood of being enrolled in private schools, with 15 (48.4% in the age bracket) enrolled. Conversely, the age group of 3 to 4 year olds has the lowest likelihood of being enrolled in a private school, with 56 (100.0% in the age bracket) attending a public institution.
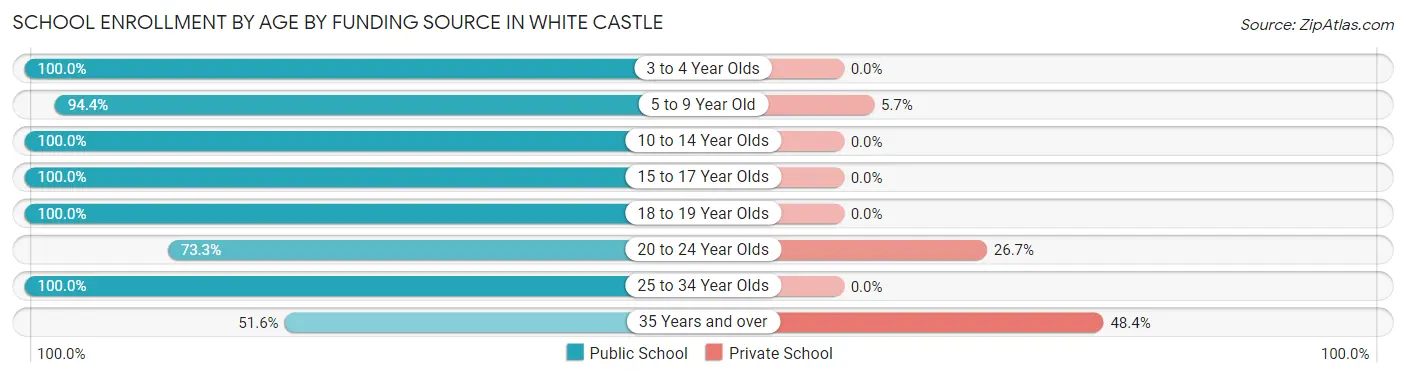
| Age Bracket | Public School | Private School |
| 3 to 4 Year Olds | 56 (100.0%) | 0 (0.0%) |
| 5 to 9 Year Old | 234 (94.4%) | 14 (5.7%) |
| 10 to 14 Year Olds | 237 (100.0%) | 0 (0.0%) |
| 15 to 17 Year Olds | 60 (100.0%) | 0 (0.0%) |
| 18 to 19 Year Olds | 73 (100.0%) | 0 (0.0%) |
| 20 to 24 Year Olds | 33 (73.3%) | 12 (26.7%) |
| 25 to 34 Year Olds | 8 (100.0%) | 0 (0.0%) |
| 35 Years and over | 16 (51.6%) | 15 (48.4%) |
| Total | 717 (94.6%) | 41 (5.4%) |
Educational Attainment by Field of Study in White Castle
Business (61 | 57.0%), education (17 | 15.9%), science & technology (16 | 14.9%), literature & languages (5 | 4.7%), and liberal arts & history (3 | 2.8%) are the most common fields of study among 107 individuals in White Castle who have obtained a bachelor's degree or higher.
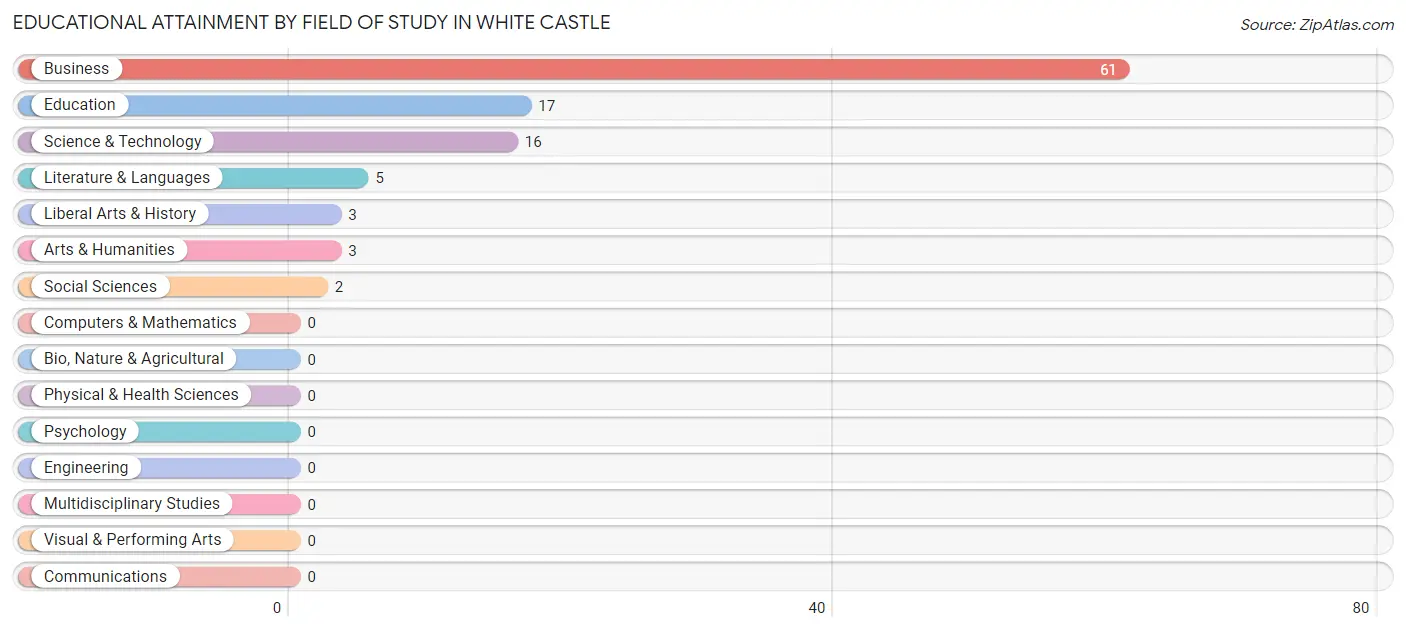
| Field of Study | # Graduates | % Graduates |
| Computers & Mathematics | 0 | 0.0% |
| Bio, Nature & Agricultural | 0 | 0.0% |
| Physical & Health Sciences | 0 | 0.0% |
| Psychology | 0 | 0.0% |
| Social Sciences | 2 | 1.9% |
| Engineering | 0 | 0.0% |
| Multidisciplinary Studies | 0 | 0.0% |
| Science & Technology | 16 | 14.9% |
| Business | 61 | 57.0% |
| Education | 17 | 15.9% |
| Literature & Languages | 5 | 4.7% |
| Liberal Arts & History | 3 | 2.8% |
| Visual & Performing Arts | 0 | 0.0% |
| Communications | 0 | 0.0% |
| Arts & Humanities | 3 | 2.8% |
| Total | 107 | 100.0% |
Transportation & Commute in White Castle
Vehicle Availability by Sex in White Castle
The most prevalent vehicle ownership categories in White Castle are males with 1 vehicle (143, accounting for 47.0%) and females with 1 vehicle (121, making up 39.6%).
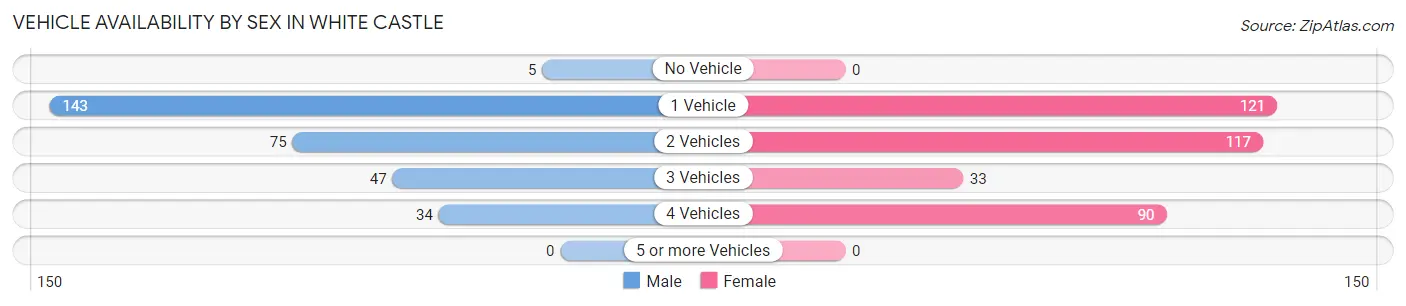
| Vehicles Available | Male | Female |
| No Vehicle | 5 (1.6%) | 0 (0.0%) |
| 1 Vehicle | 143 (47.0%) | 121 (33.5%) |
| 2 Vehicles | 75 (24.7%) | 117 (32.4%) |
| 3 Vehicles | 47 (15.5%) | 33 (9.1%) |
| 4 Vehicles | 34 (11.2%) | 90 (24.9%) |
| 5 or more Vehicles | 0 (0.0%) | 0 (0.0%) |
| Total | 304 (100.0%) | 361 (100.0%) |
Commute Time in White Castle
The most frequently occuring commute durations in White Castle are 15 to 19 minutes (134 commuters, 20.2%), 10 to 14 minutes (99 commuters, 14.9%), and 25 to 29 minutes (73 commuters, 11.0%).
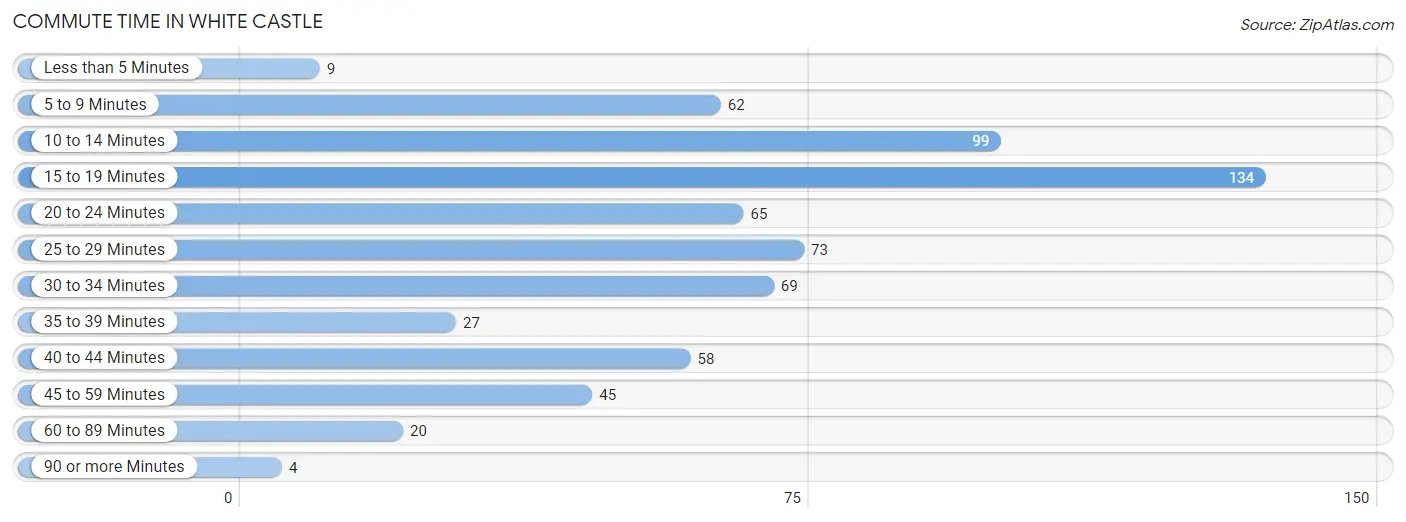
| Commute Time | # Commuters | % Commuters |
| Less than 5 Minutes | 9 | 1.3% |
| 5 to 9 Minutes | 62 | 9.3% |
| 10 to 14 Minutes | 99 | 14.9% |
| 15 to 19 Minutes | 134 | 20.2% |
| 20 to 24 Minutes | 65 | 9.8% |
| 25 to 29 Minutes | 73 | 11.0% |
| 30 to 34 Minutes | 69 | 10.4% |
| 35 to 39 Minutes | 27 | 4.1% |
| 40 to 44 Minutes | 58 | 8.7% |
| 45 to 59 Minutes | 45 | 6.8% |
| 60 to 89 Minutes | 20 | 3.0% |
| 90 or more Minutes | 4 | 0.6% |
Commute Time by Sex in White Castle
The most common commute times in White Castle are 15 to 19 minutes (74 commuters, 24.3%) for males and 30 to 34 minutes (61 commuters, 16.9%) for females.
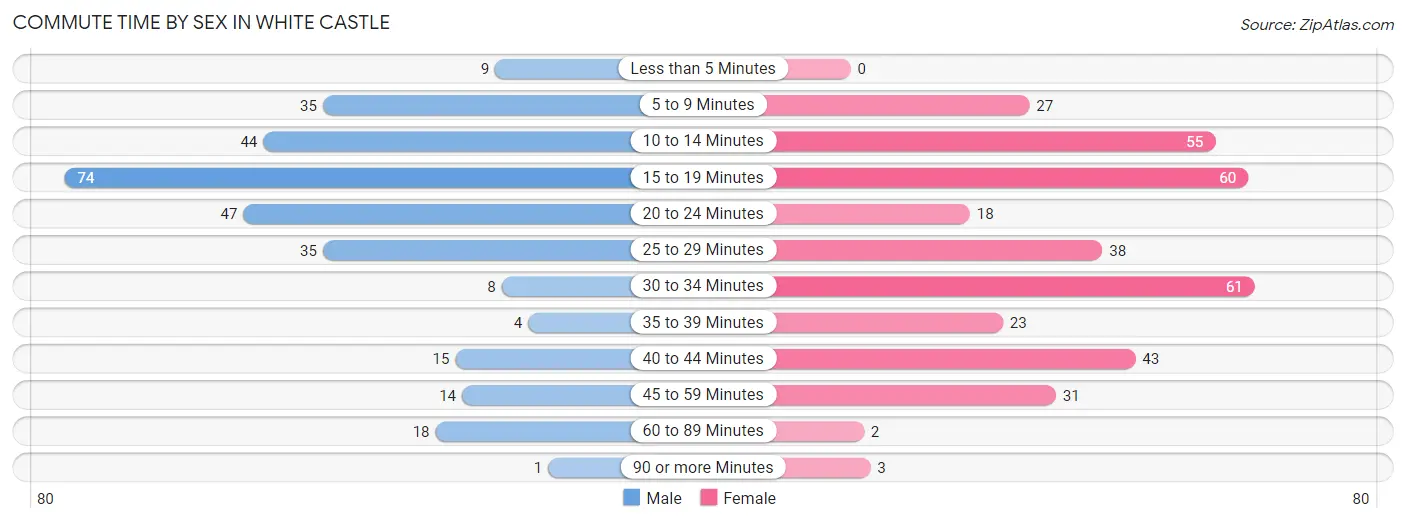
| Commute Time | Male | Female |
| Less than 5 Minutes | 9 (3.0%) | 0 (0.0%) |
| 5 to 9 Minutes | 35 (11.5%) | 27 (7.5%) |
| 10 to 14 Minutes | 44 (14.5%) | 55 (15.2%) |
| 15 to 19 Minutes | 74 (24.3%) | 60 (16.6%) |
| 20 to 24 Minutes | 47 (15.5%) | 18 (5.0%) |
| 25 to 29 Minutes | 35 (11.5%) | 38 (10.5%) |
| 30 to 34 Minutes | 8 (2.6%) | 61 (16.9%) |
| 35 to 39 Minutes | 4 (1.3%) | 23 (6.4%) |
| 40 to 44 Minutes | 15 (4.9%) | 43 (11.9%) |
| 45 to 59 Minutes | 14 (4.6%) | 31 (8.6%) |
| 60 to 89 Minutes | 18 (5.9%) | 2 (0.5%) |
| 90 or more Minutes | 1 (0.3%) | 3 (0.8%) |
Time of Departure to Work by Sex in White Castle
The most frequent times of departure to work in White Castle are 6:30 AM to 6:59 AM (65, 21.4%) for males and 6:00 AM to 6:29 AM (95, 26.3%) for females.
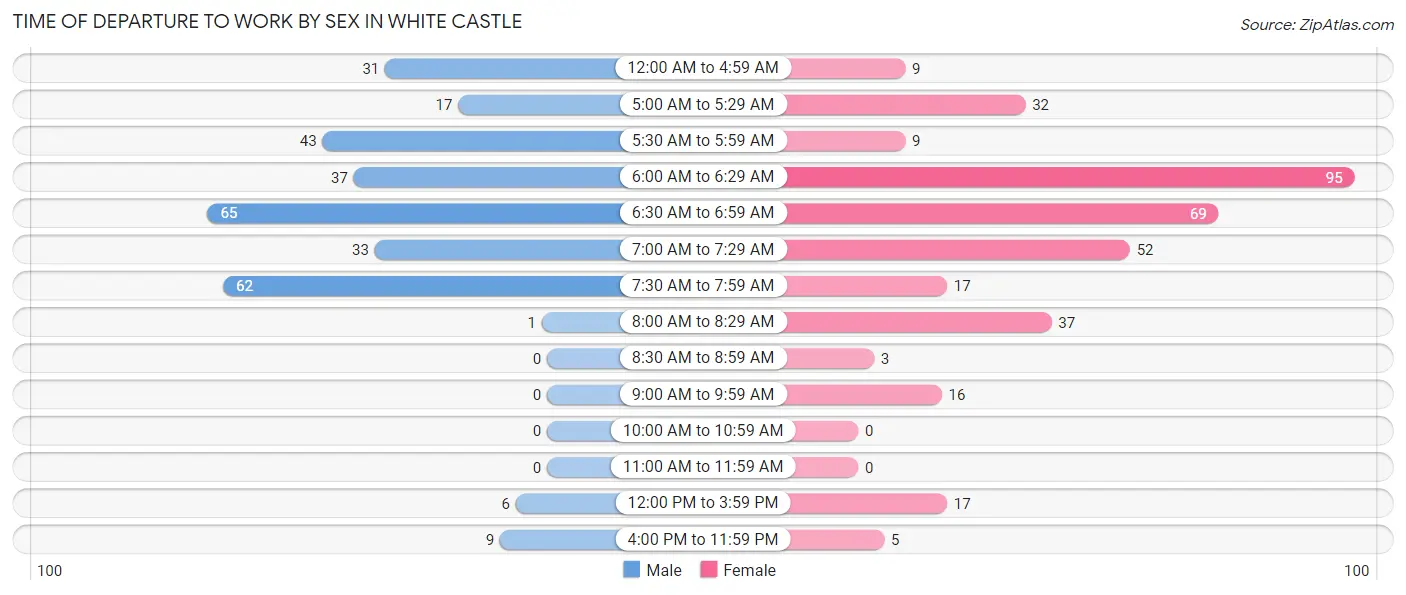
| Time of Departure | Male | Female |
| 12:00 AM to 4:59 AM | 31 (10.2%) | 9 (2.5%) |
| 5:00 AM to 5:29 AM | 17 (5.6%) | 32 (8.9%) |
| 5:30 AM to 5:59 AM | 43 (14.1%) | 9 (2.5%) |
| 6:00 AM to 6:29 AM | 37 (12.2%) | 95 (26.3%) |
| 6:30 AM to 6:59 AM | 65 (21.4%) | 69 (19.1%) |
| 7:00 AM to 7:29 AM | 33 (10.9%) | 52 (14.4%) |
| 7:30 AM to 7:59 AM | 62 (20.4%) | 17 (4.7%) |
| 8:00 AM to 8:29 AM | 1 (0.3%) | 37 (10.2%) |
| 8:30 AM to 8:59 AM | 0 (0.0%) | 3 (0.8%) |
| 9:00 AM to 9:59 AM | 0 (0.0%) | 16 (4.4%) |
| 10:00 AM to 10:59 AM | 0 (0.0%) | 0 (0.0%) |
| 11:00 AM to 11:59 AM | 0 (0.0%) | 0 (0.0%) |
| 12:00 PM to 3:59 PM | 6 (2.0%) | 17 (4.7%) |
| 4:00 PM to 11:59 PM | 9 (3.0%) | 5 (1.4%) |
| Total | 304 (100.0%) | 361 (100.0%) |
Housing Occupancy in White Castle
Occupancy by Ownership in White Castle
Of the total 805 dwellings in White Castle, owner-occupied units account for 282 (35.0%), while renter-occupied units make up 523 (65.0%).
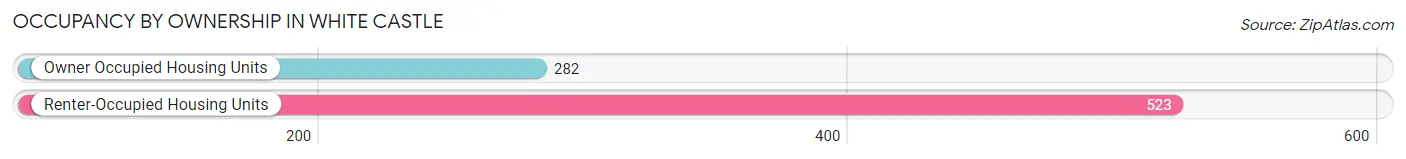
| Occupancy | # Housing Units | % Housing Units |
| Owner Occupied Housing Units | 282 | 35.0% |
| Renter-Occupied Housing Units | 523 | 65.0% |
| Total Occupied Housing Units | 805 | 100.0% |
Occupancy by Household Size in White Castle
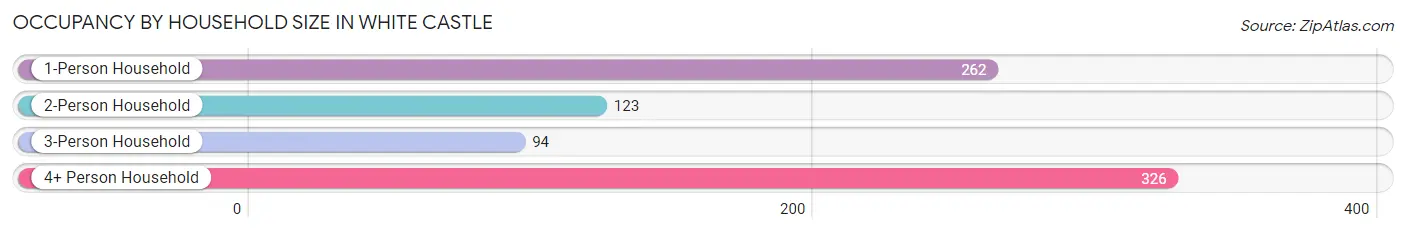
| Household Size | # Housing Units | % Housing Units |
| 1-Person Household | 262 | 32.6% |
| 2-Person Household | 123 | 15.3% |
| 3-Person Household | 94 | 11.7% |
| 4+ Person Household | 326 | 40.5% |
| Total Housing Units | 805 | 100.0% |
Occupancy by Ownership by Household Size in White Castle
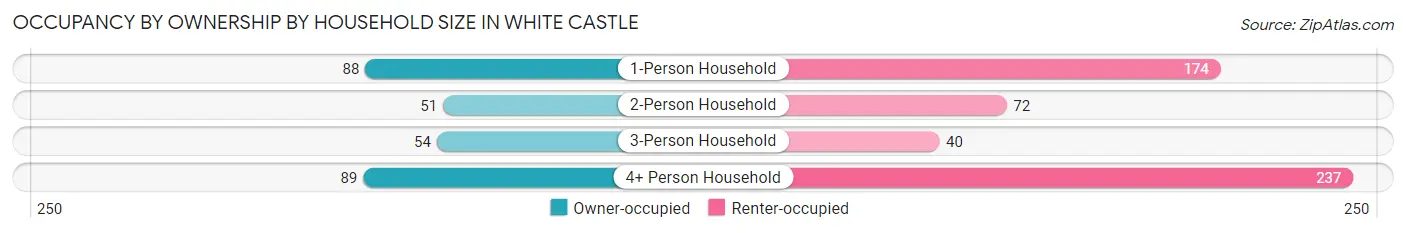
| Household Size | Owner-occupied | Renter-occupied |
| 1-Person Household | 88 (33.6%) | 174 (66.4%) |
| 2-Person Household | 51 (41.5%) | 72 (58.5%) |
| 3-Person Household | 54 (57.5%) | 40 (42.5%) |
| 4+ Person Household | 89 (27.3%) | 237 (72.7%) |
| Total Housing Units | 282 (35.0%) | 523 (65.0%) |
Occupancy by Educational Attainment in White Castle
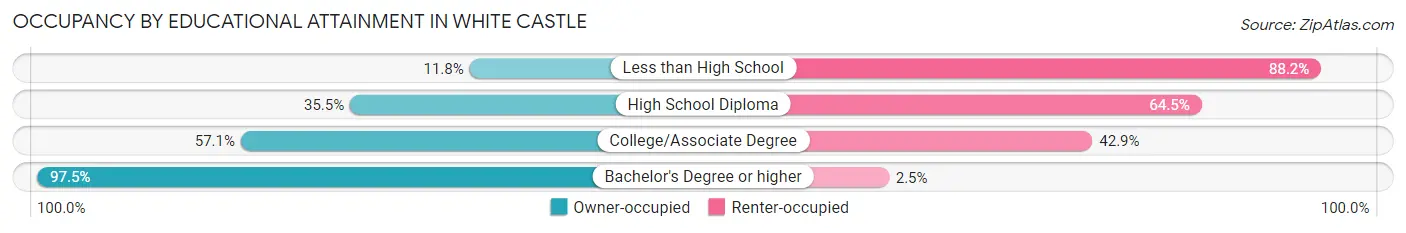
| Household Size | Owner-occupied | Renter-occupied |
| Less than High School | 33 (11.8%) | 247 (88.2%) |
| High School Diploma | 110 (35.5%) | 200 (64.5%) |
| College/Associate Degree | 100 (57.1%) | 75 (42.9%) |
| Bachelor's Degree or higher | 39 (97.5%) | 1 (2.5%) |
Occupancy by Age of Householder in White Castle
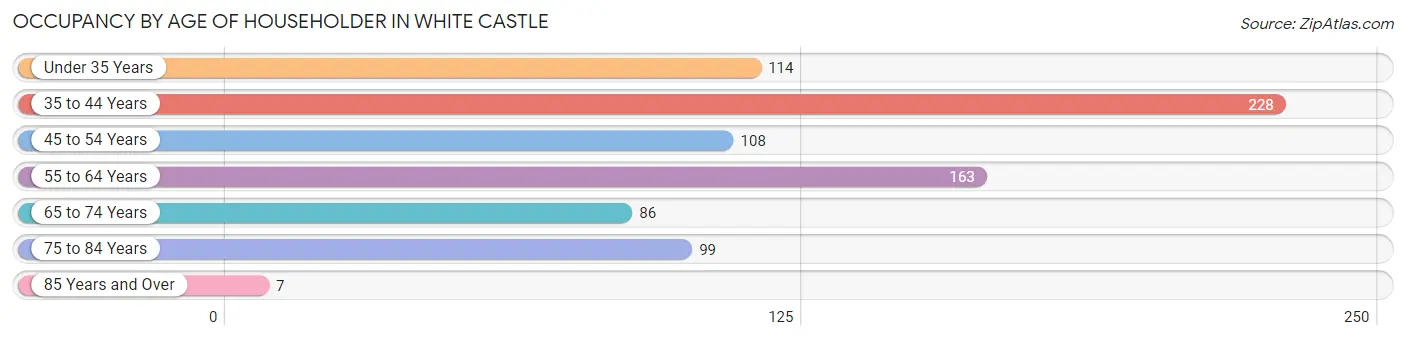
| Age Bracket | # Households | % Households |
| Under 35 Years | 114 | 14.2% |
| 35 to 44 Years | 228 | 28.3% |
| 45 to 54 Years | 108 | 13.4% |
| 55 to 64 Years | 163 | 20.3% |
| 65 to 74 Years | 86 | 10.7% |
| 75 to 84 Years | 99 | 12.3% |
| 85 Years and Over | 7 | 0.9% |
| Total | 805 | 100.0% |
Housing Finances in White Castle
Median Income by Occupancy in White Castle
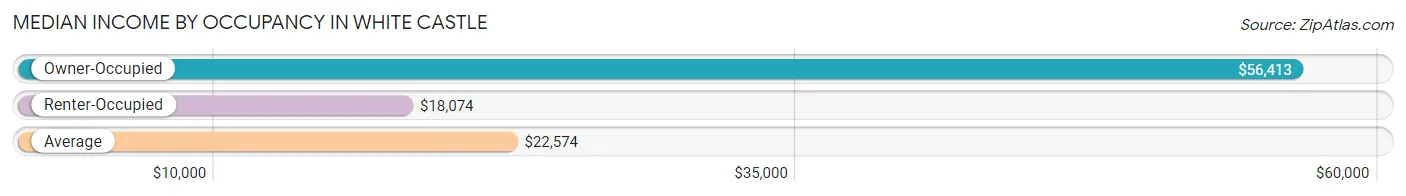
| Occupancy Type | # Households | Median Income |
| Owner-Occupied | 282 (35.0%) | $56,413 |
| Renter-Occupied | 523 (65.0%) | $18,074 |
| Average | 805 (100.0%) | $22,574 |
Occupancy by Householder Income Bracket in White Castle
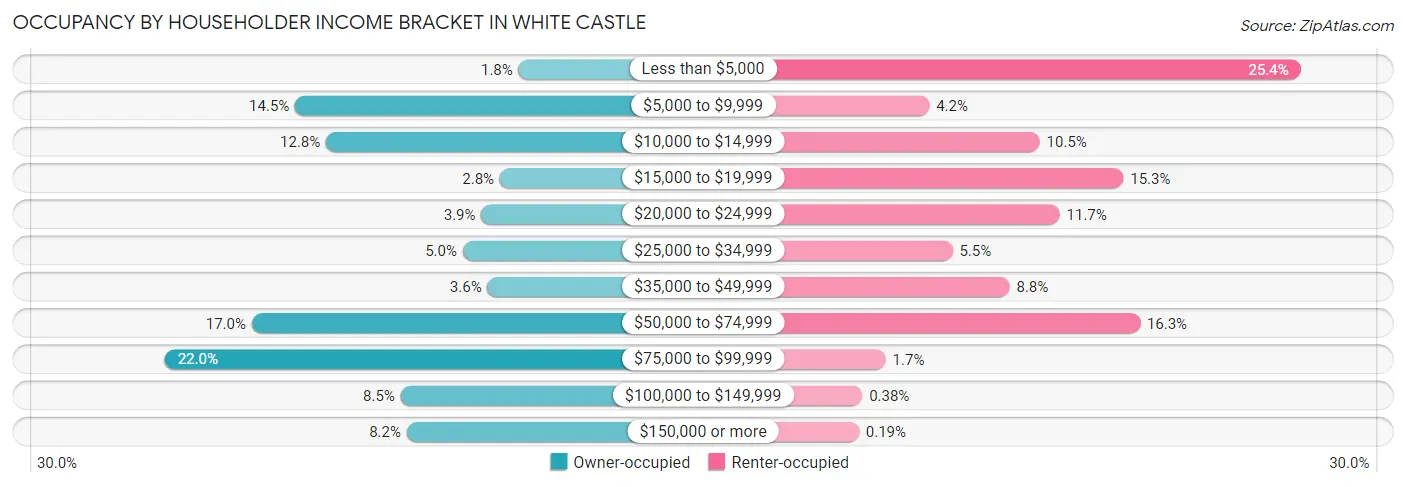
| Income Bracket | Owner-occupied | Renter-occupied |
| Less than $5,000 | 5 (1.8%) | 133 (25.4%) |
| $5,000 to $9,999 | 41 (14.5%) | 22 (4.2%) |
| $10,000 to $14,999 | 36 (12.8%) | 55 (10.5%) |
| $15,000 to $19,999 | 8 (2.8%) | 80 (15.3%) |
| $20,000 to $24,999 | 11 (3.9%) | 61 (11.7%) |
| $25,000 to $34,999 | 14 (5.0%) | 29 (5.5%) |
| $35,000 to $49,999 | 10 (3.5%) | 46 (8.8%) |
| $50,000 to $74,999 | 48 (17.0%) | 85 (16.3%) |
| $75,000 to $99,999 | 62 (22.0%) | 9 (1.7%) |
| $100,000 to $149,999 | 24 (8.5%) | 2 (0.4%) |
| $150,000 or more | 23 (8.2%) | 1 (0.2%) |
| Total | 282 (100.0%) | 523 (100.0%) |
Monthly Housing Cost Tiers in White Castle
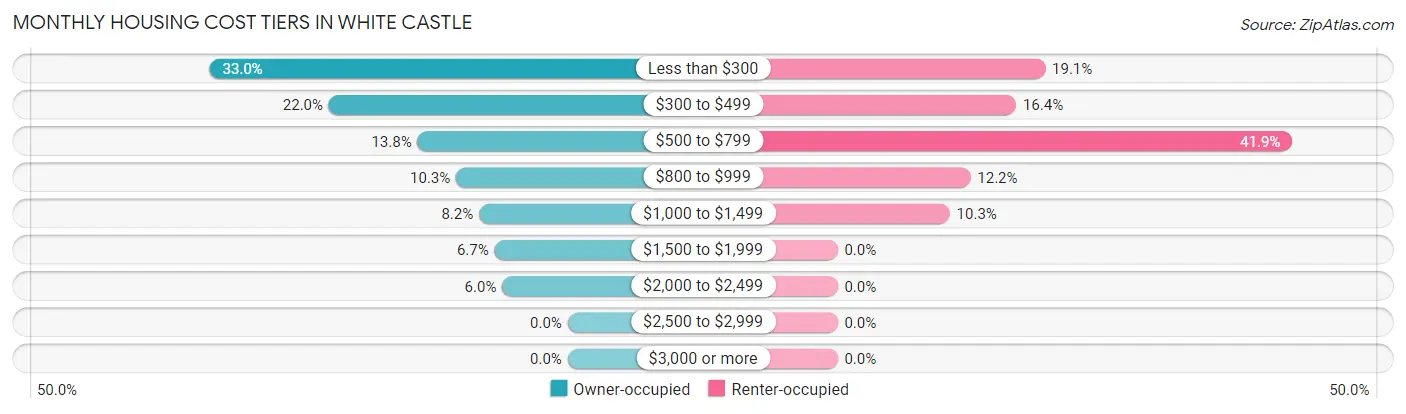
| Monthly Cost | Owner-occupied | Renter-occupied |
| Less than $300 | 93 (33.0%) | 100 (19.1%) |
| $300 to $499 | 62 (22.0%) | 86 (16.4%) |
| $500 to $799 | 39 (13.8%) | 219 (41.9%) |
| $800 to $999 | 29 (10.3%) | 64 (12.2%) |
| $1,000 to $1,499 | 23 (8.2%) | 54 (10.3%) |
| $1,500 to $1,999 | 19 (6.7%) | 0 (0.0%) |
| $2,000 to $2,499 | 17 (6.0%) | 0 (0.0%) |
| $2,500 to $2,999 | 0 (0.0%) | 0 (0.0%) |
| $3,000 or more | 0 (0.0%) | 0 (0.0%) |
| Total | 282 (100.0%) | 523 (100.0%) |
Physical Housing Characteristics in White Castle
Housing Structures in White Castle
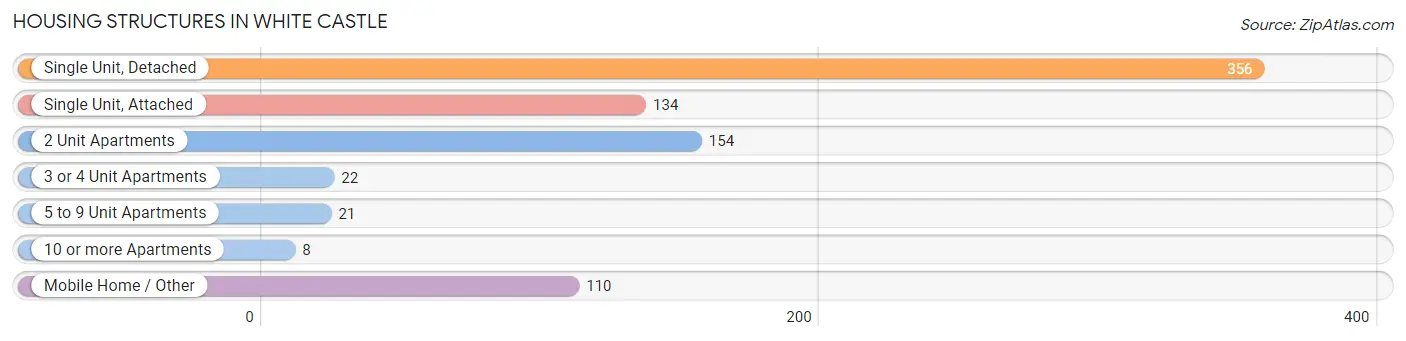
| Structure Type | # Housing Units | % Housing Units |
| Single Unit, Detached | 356 | 44.2% |
| Single Unit, Attached | 134 | 16.7% |
| 2 Unit Apartments | 154 | 19.1% |
| 3 or 4 Unit Apartments | 22 | 2.7% |
| 5 to 9 Unit Apartments | 21 | 2.6% |
| 10 or more Apartments | 8 | 1.0% |
| Mobile Home / Other | 110 | 13.7% |
| Total | 805 | 100.0% |
Housing Structures by Occupancy in White Castle
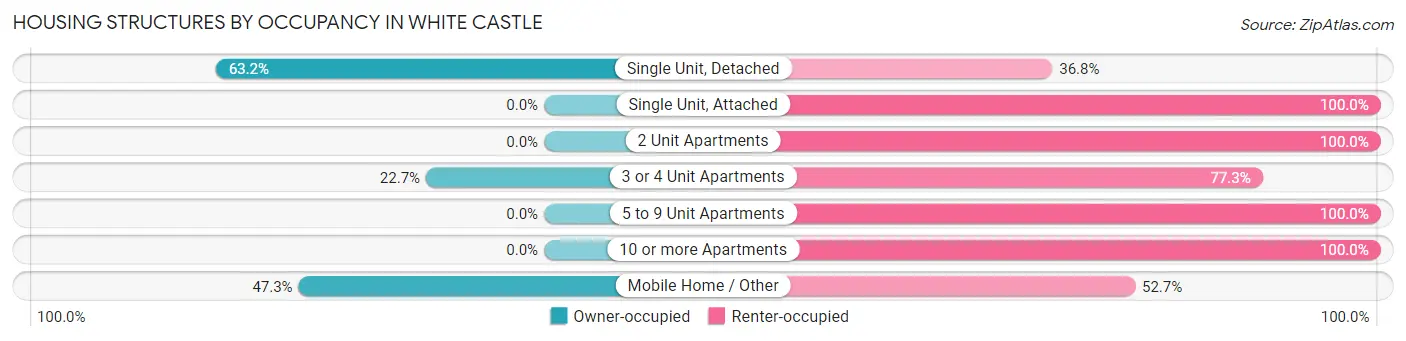
| Structure Type | Owner-occupied | Renter-occupied |
| Single Unit, Detached | 225 (63.2%) | 131 (36.8%) |
| Single Unit, Attached | 0 (0.0%) | 134 (100.0%) |
| 2 Unit Apartments | 0 (0.0%) | 154 (100.0%) |
| 3 or 4 Unit Apartments | 5 (22.7%) | 17 (77.3%) |
| 5 to 9 Unit Apartments | 0 (0.0%) | 21 (100.0%) |
| 10 or more Apartments | 0 (0.0%) | 8 (100.0%) |
| Mobile Home / Other | 52 (47.3%) | 58 (52.7%) |
| Total | 282 (35.0%) | 523 (65.0%) |
Housing Structures by Number of Rooms in White Castle
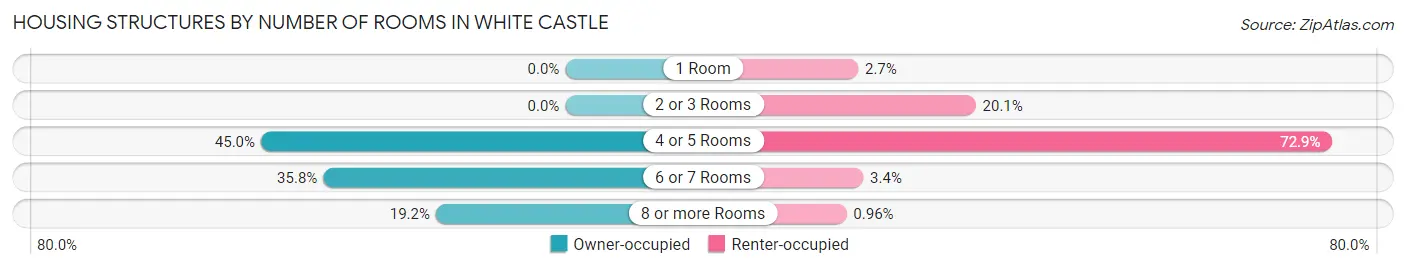
| Number of Rooms | Owner-occupied | Renter-occupied |
| 1 Room | 0 (0.0%) | 14 (2.7%) |
| 2 or 3 Rooms | 0 (0.0%) | 105 (20.1%) |
| 4 or 5 Rooms | 127 (45.0%) | 381 (72.9%) |
| 6 or 7 Rooms | 101 (35.8%) | 18 (3.4%) |
| 8 or more Rooms | 54 (19.2%) | 5 (1.0%) |
| Total | 282 (100.0%) | 523 (100.0%) |
Housing Structure by Heating Type in White Castle
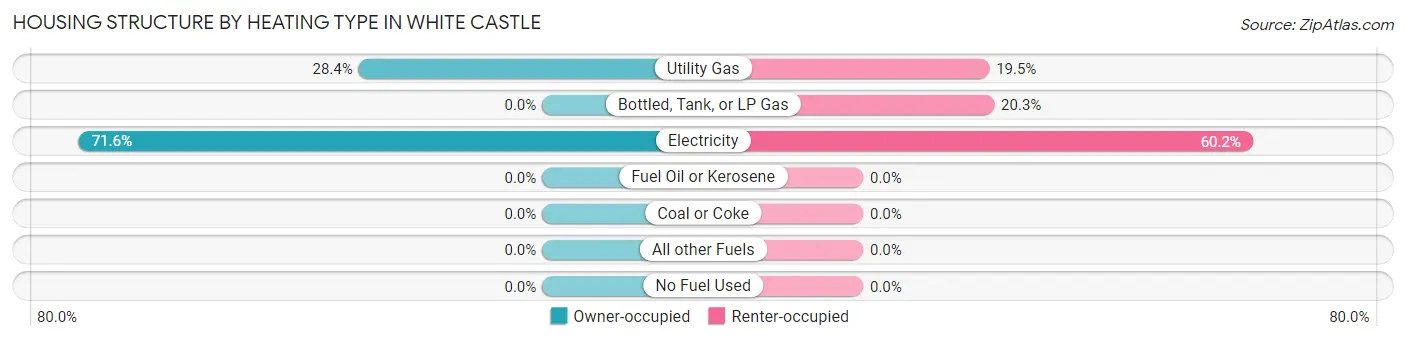
| Heating Type | Owner-occupied | Renter-occupied |
| Utility Gas | 80 (28.4%) | 102 (19.5%) |
| Bottled, Tank, or LP Gas | 0 (0.0%) | 106 (20.3%) |
| Electricity | 202 (71.6%) | 315 (60.2%) |
| Fuel Oil or Kerosene | 0 (0.0%) | 0 (0.0%) |
| Coal or Coke | 0 (0.0%) | 0 (0.0%) |
| All other Fuels | 0 (0.0%) | 0 (0.0%) |
| No Fuel Used | 0 (0.0%) | 0 (0.0%) |
| Total | 282 (100.0%) | 523 (100.0%) |
Household Vehicle Usage in White Castle
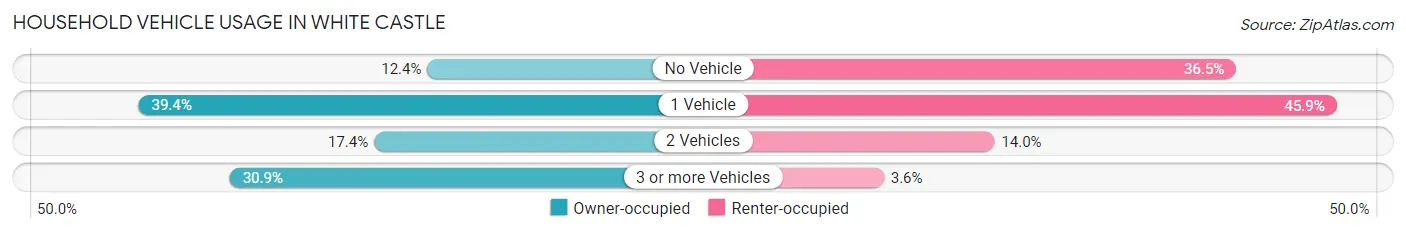
| Vehicles per Household | Owner-occupied | Renter-occupied |
| No Vehicle | 35 (12.4%) | 191 (36.5%) |
| 1 Vehicle | 111 (39.4%) | 240 (45.9%) |
| 2 Vehicles | 49 (17.4%) | 73 (14.0%) |
| 3 or more Vehicles | 87 (30.8%) | 19 (3.6%) |
| Total | 282 (100.0%) | 523 (100.0%) |
Real Estate & Mortgages in White Castle
Real Estate and Mortgage Overview in White Castle
| Characteristic | Without Mortgage | With Mortgage |
| Housing Units | 192 | 90 |
| Median Property Value | $102,300 | $146,400 |
| Median Household Income | - | - |
| Monthly Housing Costs | $325 | $0 |
| Real Estate Taxes | $199 | $29 |
Property Value by Mortgage Status in White Castle
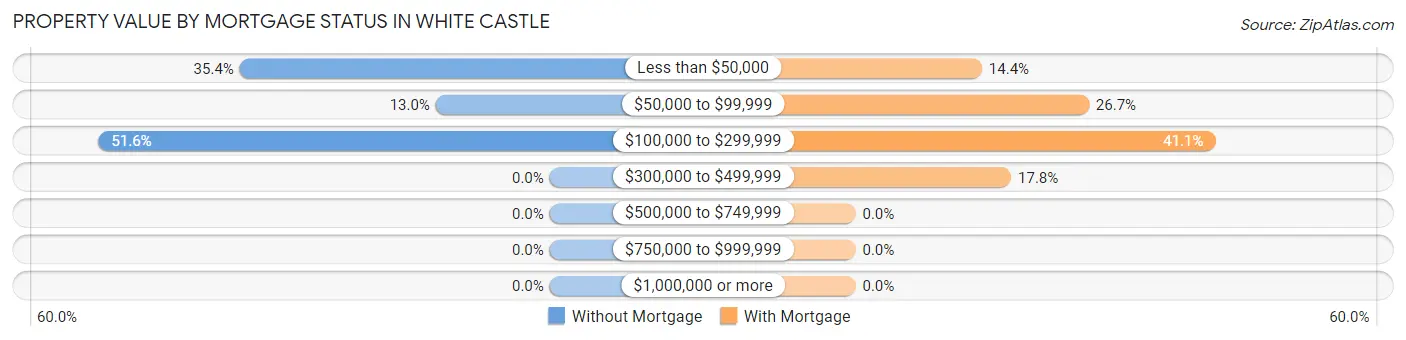
| Property Value | Without Mortgage | With Mortgage |
| Less than $50,000 | 68 (35.4%) | 13 (14.4%) |
| $50,000 to $99,999 | 25 (13.0%) | 24 (26.7%) |
| $100,000 to $299,999 | 99 (51.6%) | 37 (41.1%) |
| $300,000 to $499,999 | 0 (0.0%) | 16 (17.8%) |
| $500,000 to $749,999 | 0 (0.0%) | 0 (0.0%) |
| $750,000 to $999,999 | 0 (0.0%) | 0 (0.0%) |
| $1,000,000 or more | 0 (0.0%) | 0 (0.0%) |
| Total | 192 (100.0%) | 90 (100.0%) |
Household Income by Mortgage Status in White Castle
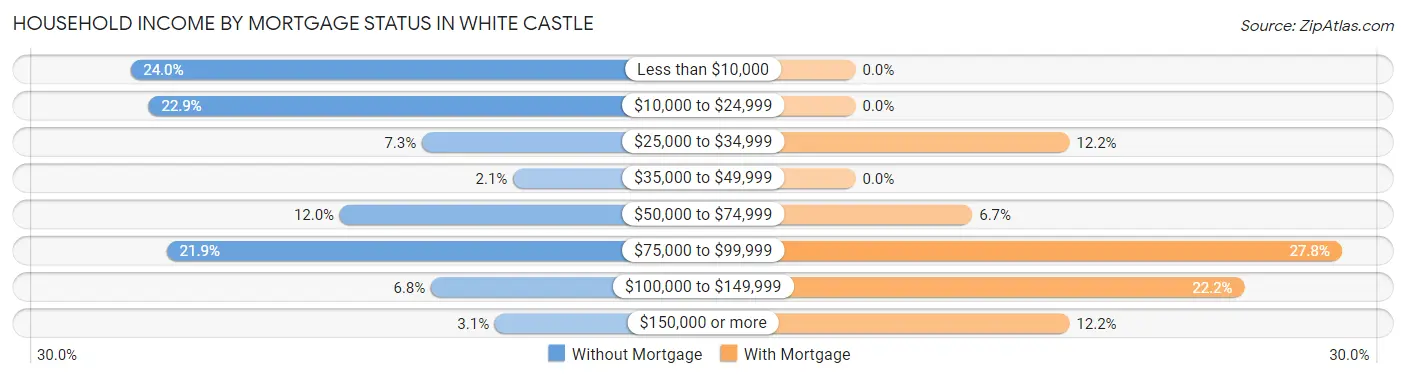
| Household Income | Without Mortgage | With Mortgage |
| Less than $10,000 | 46 (24.0%) | 0 (0.0%) |
| $10,000 to $24,999 | 44 (22.9%) | 0 (0.0%) |
| $25,000 to $34,999 | 14 (7.3%) | 11 (12.2%) |
| $35,000 to $49,999 | 4 (2.1%) | 0 (0.0%) |
| $50,000 to $74,999 | 23 (12.0%) | 6 (6.7%) |
| $75,000 to $99,999 | 42 (21.9%) | 25 (27.8%) |
| $100,000 to $149,999 | 13 (6.8%) | 20 (22.2%) |
| $150,000 or more | 6 (3.1%) | 11 (12.2%) |
| Total | 192 (100.0%) | 90 (100.0%) |
Property Value to Household Income Ratio in White Castle
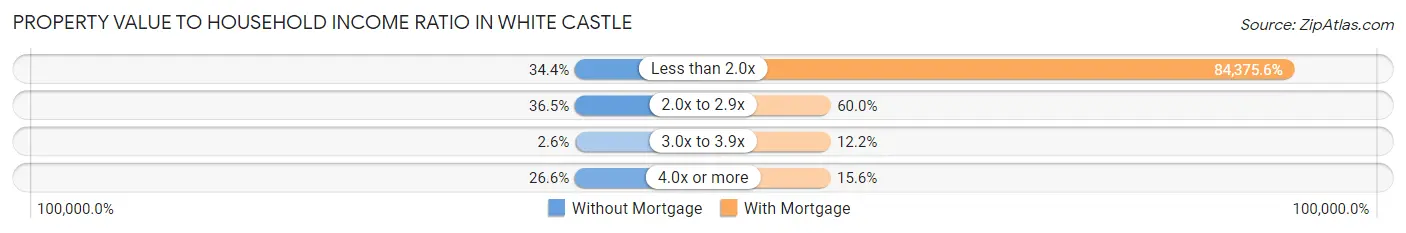
| Value-to-Income Ratio | Without Mortgage | With Mortgage |
| Less than 2.0x | 66 (34.4%) | 75,938 (84,375.6%) |
| 2.0x to 2.9x | 70 (36.5%) | 54 (60.0%) |
| 3.0x to 3.9x | 5 (2.6%) | 11 (12.2%) |
| 4.0x or more | 51 (26.6%) | 14 (15.6%) |
| Total | 192 (100.0%) | 90 (100.0%) |
Real Estate Taxes by Mortgage Status in White Castle
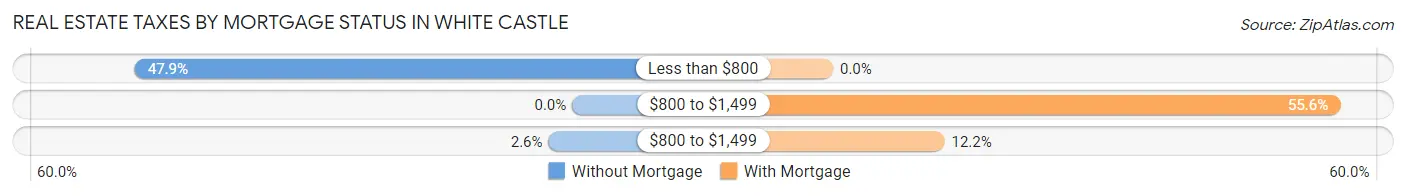
| Property Taxes | Without Mortgage | With Mortgage |
| Less than $800 | 92 (47.9%) | 0 (0.0%) |
| $800 to $1,499 | 0 (0.0%) | 50 (55.6%) |
| $800 to $1,499 | 5 (2.6%) | 11 (12.2%) |
| Total | 192 (100.0%) | 90 (100.0%) |
Health & Disability in White Castle
Health Insurance Coverage by Age in White Castle
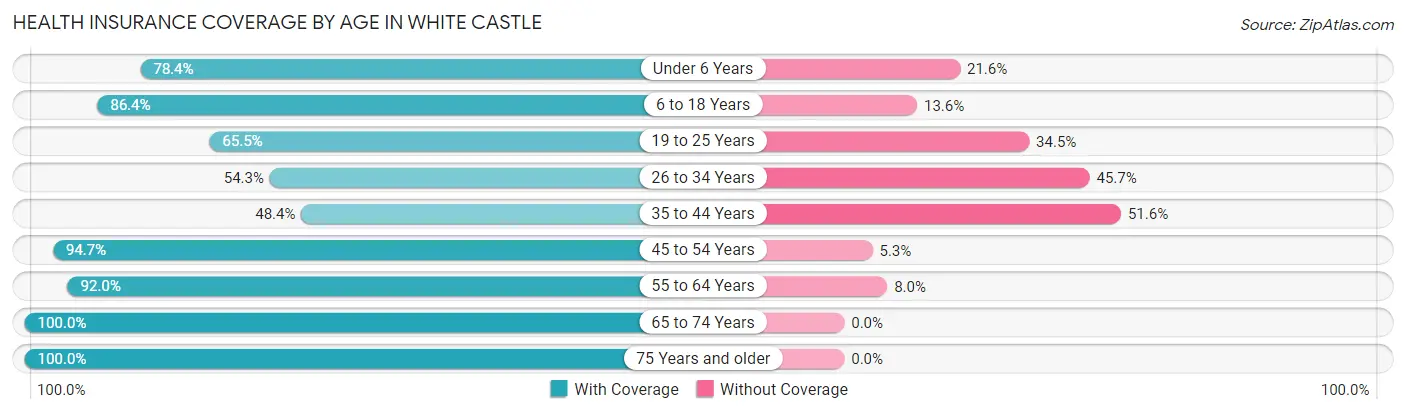
| Age Bracket | With Coverage | Without Coverage |
| Under 6 Years | 218 (78.4%) | 60 (21.6%) |
| 6 to 18 Years | 510 (86.4%) | 80 (13.6%) |
| 19 to 25 Years | 154 (65.5%) | 81 (34.5%) |
| 26 to 34 Years | 159 (54.3%) | 134 (45.7%) |
| 35 to 44 Years | 182 (48.4%) | 194 (51.6%) |
| 45 to 54 Years | 216 (94.7%) | 12 (5.3%) |
| 55 to 64 Years | 161 (92.0%) | 14 (8.0%) |
| 65 to 74 Years | 106 (100.0%) | 0 (0.0%) |
| 75 Years and older | 113 (100.0%) | 0 (0.0%) |
| Total | 1,819 (76.0%) | 575 (24.0%) |
Health Insurance Coverage by Citizenship Status in White Castle
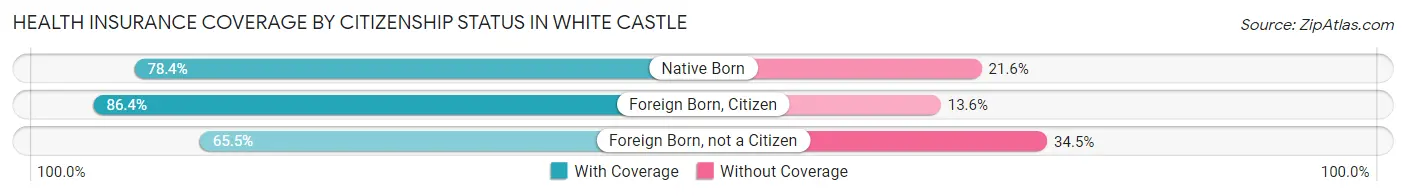
| Citizenship Status | With Coverage | Without Coverage |
| Native Born | 218 (78.4%) | 60 (21.6%) |
| Foreign Born, Citizen | 510 (86.4%) | 80 (13.6%) |
| Foreign Born, not a Citizen | 154 (65.5%) | 81 (34.5%) |
Health Insurance Coverage by Household Income in White Castle
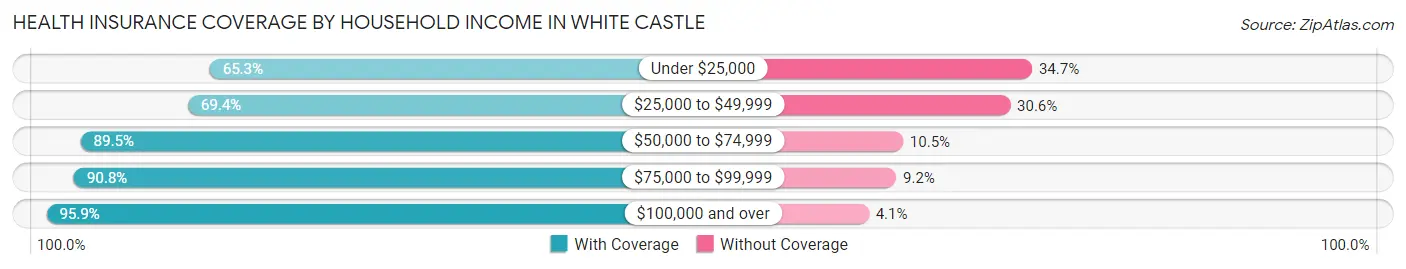
| Household Income | With Coverage | Without Coverage |
| Under $25,000 | 798 (65.3%) | 424 (34.7%) |
| $25,000 to $49,999 | 161 (69.4%) | 71 (30.6%) |
| $50,000 to $74,999 | 400 (89.5%) | 47 (10.5%) |
| $75,000 to $99,999 | 226 (90.8%) | 23 (9.2%) |
| $100,000 and over | 234 (95.9%) | 10 (4.1%) |
Public vs Private Health Insurance Coverage by Age in White Castle
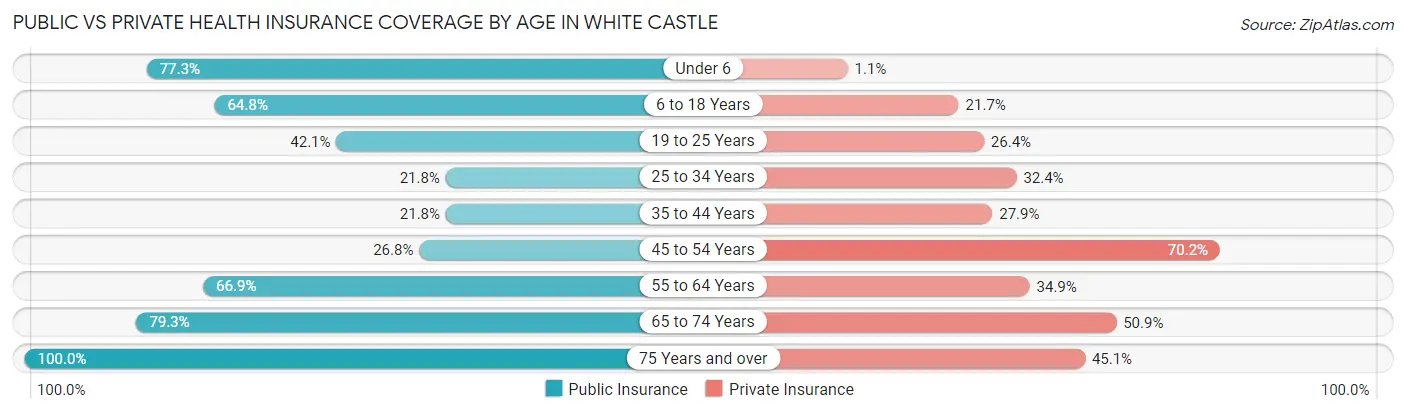
| Age Bracket | Public Insurance | Private Insurance |
| Under 6 | 215 (77.3%) | 3 (1.1%) |
| 6 to 18 Years | 382 (64.7%) | 128 (21.7%) |
| 19 to 25 Years | 99 (42.1%) | 62 (26.4%) |
| 25 to 34 Years | 64 (21.8%) | 95 (32.4%) |
| 35 to 44 Years | 82 (21.8%) | 105 (27.9%) |
| 45 to 54 Years | 61 (26.8%) | 160 (70.2%) |
| 55 to 64 Years | 117 (66.9%) | 61 (34.9%) |
| 65 to 74 Years | 84 (79.2%) | 54 (50.9%) |
| 75 Years and over | 113 (100.0%) | 51 (45.1%) |
| Total | 1,217 (50.8%) | 719 (30.0%) |
Disability Status by Sex by Age in White Castle
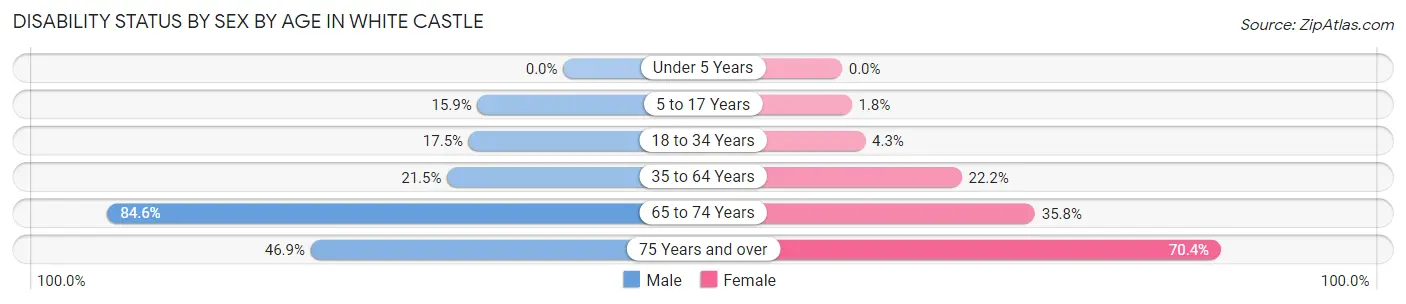
| Age Bracket | Male | Female |
| Under 5 Years | 0 (0.0%) | 0 (0.0%) |
| 5 to 17 Years | 46 (15.9%) | 5 (1.8%) |
| 18 to 34 Years | 51 (17.5%) | 13 (4.3%) |
| 35 to 64 Years | 67 (21.5%) | 104 (22.2%) |
| 65 to 74 Years | 33 (84.6%) | 24 (35.8%) |
| 75 Years and over | 15 (46.9%) | 57 (70.4%) |
Disability Class by Sex by Age in White Castle
Disability Class: Hearing Difficulty
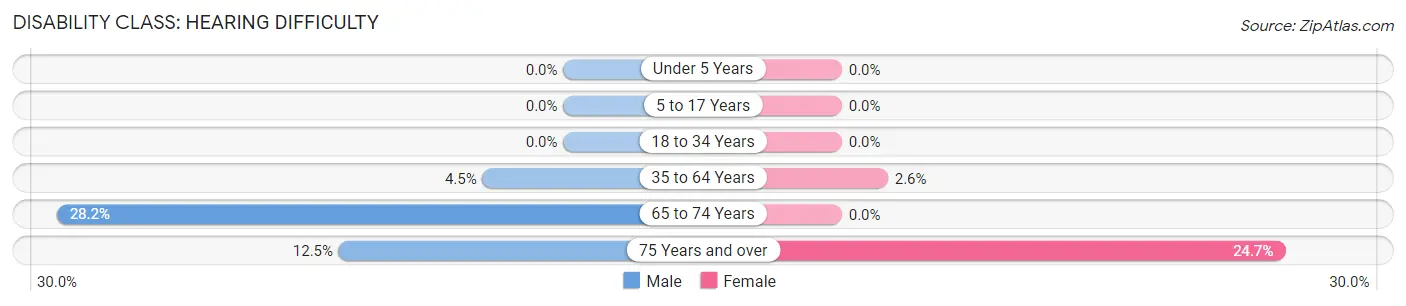
| Age Bracket | Male | Female |
| Under 5 Years | 0 (0.0%) | 0 (0.0%) |
| 5 to 17 Years | 0 (0.0%) | 0 (0.0%) |
| 18 to 34 Years | 0 (0.0%) | 0 (0.0%) |
| 35 to 64 Years | 14 (4.5%) | 12 (2.6%) |
| 65 to 74 Years | 11 (28.2%) | 0 (0.0%) |
| 75 Years and over | 4 (12.5%) | 20 (24.7%) |
Disability Class: Vision Difficulty
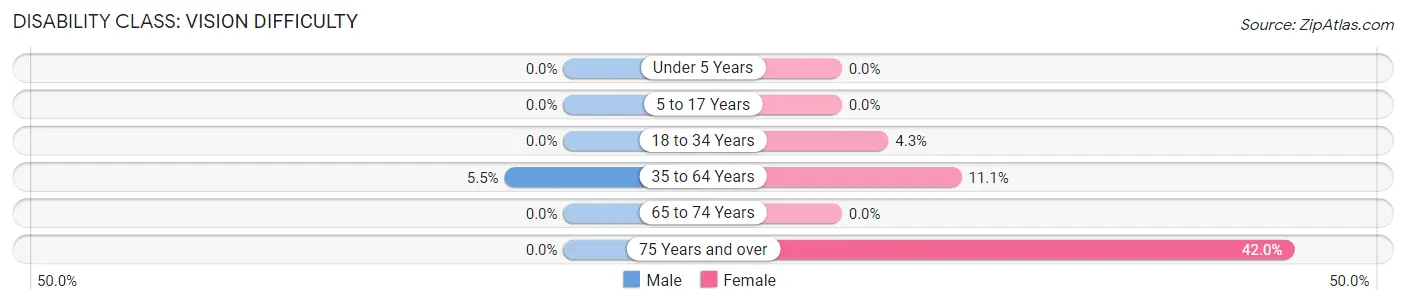
| Age Bracket | Male | Female |
| Under 5 Years | 0 (0.0%) | 0 (0.0%) |
| 5 to 17 Years | 0 (0.0%) | 0 (0.0%) |
| 18 to 34 Years | 0 (0.0%) | 13 (4.3%) |
| 35 to 64 Years | 17 (5.5%) | 52 (11.1%) |
| 65 to 74 Years | 0 (0.0%) | 0 (0.0%) |
| 75 Years and over | 0 (0.0%) | 34 (42.0%) |
Disability Class: Cognitive Difficulty
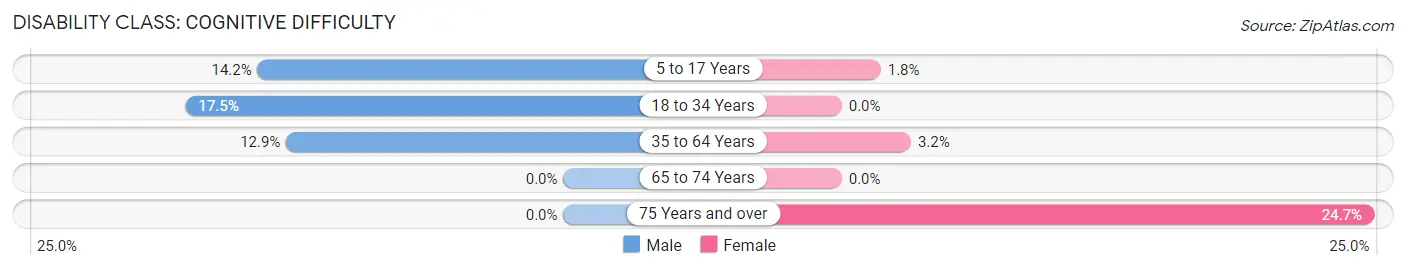
| Age Bracket | Male | Female |
| 5 to 17 Years | 41 (14.2%) | 5 (1.8%) |
| 18 to 34 Years | 51 (17.5%) | 0 (0.0%) |
| 35 to 64 Years | 40 (12.9%) | 15 (3.2%) |
| 65 to 74 Years | 0 (0.0%) | 0 (0.0%) |
| 75 Years and over | 0 (0.0%) | 20 (24.7%) |
Disability Class: Ambulatory Difficulty
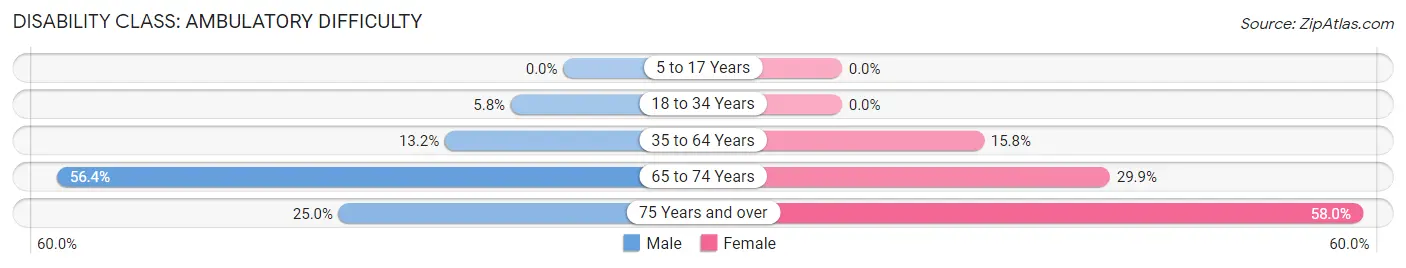
| Age Bracket | Male | Female |
| 5 to 17 Years | 0 (0.0%) | 0 (0.0%) |
| 18 to 34 Years | 17 (5.8%) | 0 (0.0%) |
| 35 to 64 Years | 41 (13.2%) | 74 (15.8%) |
| 65 to 74 Years | 22 (56.4%) | 20 (29.8%) |
| 75 Years and over | 8 (25.0%) | 47 (58.0%) |
Disability Class: Self-Care Difficulty
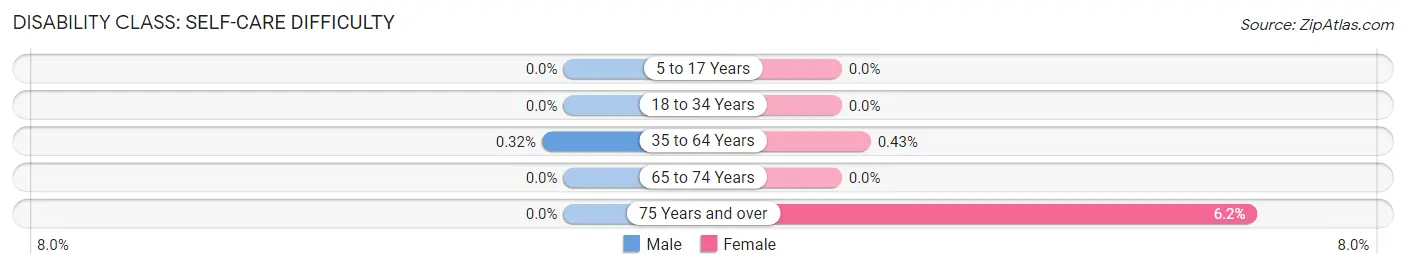
| Age Bracket | Male | Female |
| 5 to 17 Years | 0 (0.0%) | 0 (0.0%) |
| 18 to 34 Years | 0 (0.0%) | 0 (0.0%) |
| 35 to 64 Years | 1 (0.3%) | 2 (0.4%) |
| 65 to 74 Years | 0 (0.0%) | 0 (0.0%) |
| 75 Years and over | 0 (0.0%) | 5 (6.2%) |
Technology Access in White Castle
Computing Device Access in White Castle
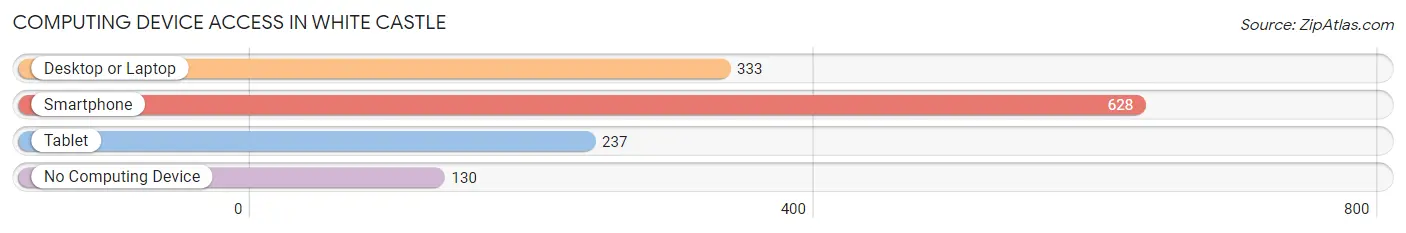
| Device Type | # Households | % Households |
| Desktop or Laptop | 333 | 41.4% |
| Smartphone | 628 | 78.0% |
| Tablet | 237 | 29.4% |
| No Computing Device | 130 | 16.2% |
| Total | 805 | 100.0% |
Internet Access in White Castle
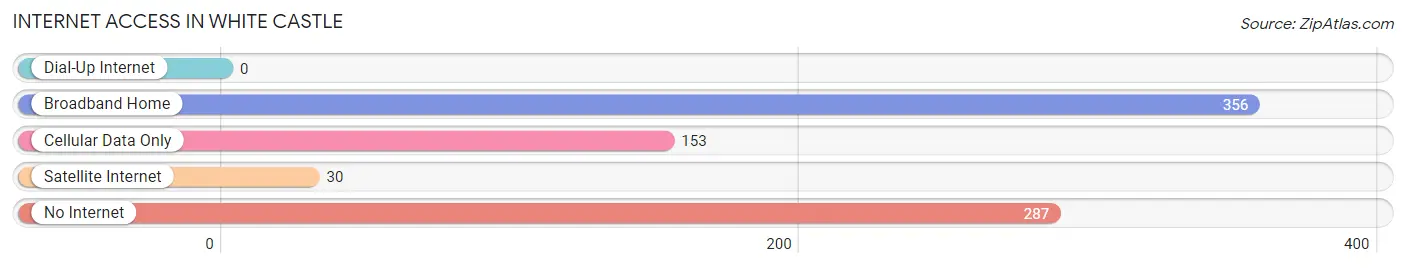
| Internet Type | # Households | % Households |
| Dial-Up Internet | 0 | 0.0% |
| Broadband Home | 356 | 44.2% |
| Cellular Data Only | 153 | 19.0% |
| Satellite Internet | 30 | 3.7% |
| No Internet | 287 | 35.6% |
| Total | 805 | 100.0% |
White Castle Summary
History
The small town of White Castle, Louisiana is located in Iberville Parish, approximately 30 miles west of Baton Rouge. The town was founded in 1877 by a group of German immigrants who had come to the area to work in the sugar cane fields. The town was named after a white castle-like structure that was built by the immigrants as a place of worship.
The town grew slowly over the years, but it was not until the early 1900s that it began to experience significant growth. In the early 1900s, the town was home to a number of businesses, including a general store, a blacksmith shop, a sawmill, and a cotton gin. The town also had a post office, a bank, and a hotel.
In the 1920s, the town experienced a period of rapid growth as the sugar industry in the area expanded. This growth was fueled by the construction of a sugar mill in White Castle, which provided jobs for many of the town’s residents. The town also benefited from the construction of a railroad line that connected it to Baton Rouge and New Orleans.
The town continued to grow throughout the 20th century, and by the year 2000, it had a population of approximately 1,500 people.
Geography
White Castle is located in Iberville Parish, in the southeastern part of Louisiana. The town is situated on the banks of the Mississippi River, approximately 30 miles west of Baton Rouge. The town is surrounded by a number of small towns and villages, including Plaquemine, Maringouin, and Rosedale.
The town is located in a flat, low-lying area, and is surrounded by swamps and marshes. The climate in White Castle is humid and subtropical, with hot summers and mild winters.
Economy
The economy of White Castle is largely based on agriculture. The town is home to a number of sugar cane farms, as well as a number of other agricultural businesses. The town is also home to a number of small businesses, including restaurants, stores, and other services.
The town is also home to a number of manufacturing businesses, including a paper mill and a chemical plant. The town is also home to a number of oil and gas companies, which are involved in the exploration and production of oil and gas in the area.
Demographics
As of the year 2000, the population of White Castle was approximately 1,500 people. The town is predominantly white, with a small African American population. The town is also home to a small Hispanic population, as well as a small Asian population.
The town has a median household income of approximately $30,000, and the median home value is approximately $90,000. The town has a high rate of poverty, with approximately 25% of the population living below the poverty line.
Conclusion
White Castle, Louisiana is a small town located in Iberville Parish, approximately 30 miles west of Baton Rouge. The town was founded in 1877 by a group of German immigrants, and it has since grown to a population of approximately 1,500 people. The town’s economy is largely based on agriculture, and it is also home to a number of manufacturing businesses. The town has a predominantly white population, with a small African American, Hispanic, and Asian population. The town has a median household income of approximately $30,000, and the median home value is approximately $90,000.
Common Questions
What is Per Capita Income in White Castle?
Per Capita income in White Castle is $15,620.
What is the Median Family Income in White Castle?
Median Family Income in White Castle is $26,750.
What is the Median Household income in White Castle?
Median Household Income in White Castle is $22,574.
What is Income or Wage Gap in White Castle?
Income or Wage Gap in White Castle is 19.1%.
Women in White Castle earn 80.9 cents for every dollar earned by a man.
What is Inequality or Gini Index in White Castle?
Inequality or Gini Index in White Castle is 0.61.
What is the Total Population of White Castle?
Total Population of White Castle is 2,394.
What is the Total Male Population of White Castle?
Total Male Population of White Castle is 1,092.
What is the Total Female Population of White Castle?
Total Female Population of White Castle is 1,302.
What is the Ratio of Males per 100 Females in White Castle?
There are 83.87 Males per 100 Females in White Castle.
What is the Ratio of Females per 100 Males in White Castle?
There are 119.23 Females per 100 Males in White Castle.
What is the Median Population Age in White Castle?
Median Population Age in White Castle is 29.9 Years.
What is the Average Family Size in White Castle
Average Family Size in White Castle is 3.8 People.
What is the Average Household Size in White Castle
Average Household Size in White Castle is 3.0 People.
How Large is the Labor Force in White Castle?
There are 820 People in the Labor Forcein in White Castle.
What is the Percentage of People in the Labor Force in White Castle?
50.1% of People are in the Labor Force in White Castle.
What is the Unemployment Rate in White Castle?
Unemployment Rate in White Castle is 18.7%.