Waterproof, LA Map & Demographics
Waterproof Map
Waterproof Overview
$11,021
PER CAPITA INCOME
$21,953
AVG HOUSEHOLD INCOME
42.4%
WAGE / INCOME GAP [ % ]
57.6¢/ $1
WAGE / INCOME GAP [ $ ]
$12,939
FAMILY INCOME DEFICIT
0.38
INEQUALITY / GINI INDEX
604
TOTAL POPULATION
171
MALE POPULATION
433
FEMALE POPULATION
39.49
MALES / 100 FEMALES
253.22
FEMALES / 100 MALES
37.0
MEDIAN AGE
7.6
AVG FAMILY SIZE
3.2
AVG HOUSEHOLD SIZE
118
LABOR FORCE [ PEOPLE ]
28.0%
PERCENT IN LABOR FORCE
11.0%
UNEMPLOYMENT RATE
Waterproof Zip Codes
Waterproof Area Codes
Income in Waterproof
Income Overview in Waterproof
| Characteristic | Number | Measure |
| Per Capita Income | 604 | $11,021 |
| Median Family Income | 62 | $0 |
| Mean Family Income | 62 | $33,861 |
| Median Household Income | 191 | $21,953 |
| Mean Household Income | 191 | $27,105 |
| Income Deficit | 62 | $12,939 |
| Wage / Income Gap (%) | 604 | 42.42% |
| Wage / Income Gap ($) | 604 | 57.58¢ per $1 |
| Gini / Inequality Index | 604 | 0.38 |
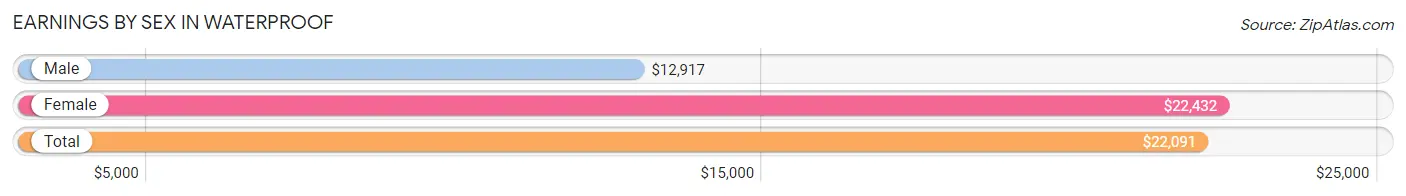
Earnings by Sex in Waterproof
Average Earnings in Waterproof are $22,091, $12,917 for men and $22,432 for women, a difference of 42.4%.
| Sex | Number | Average Earnings |
| Male | 49 (30.6%) | $12,917 |
| Female | 111 (69.4%) | $22,432 |
| Total | 160 (100.0%) | $22,091 |
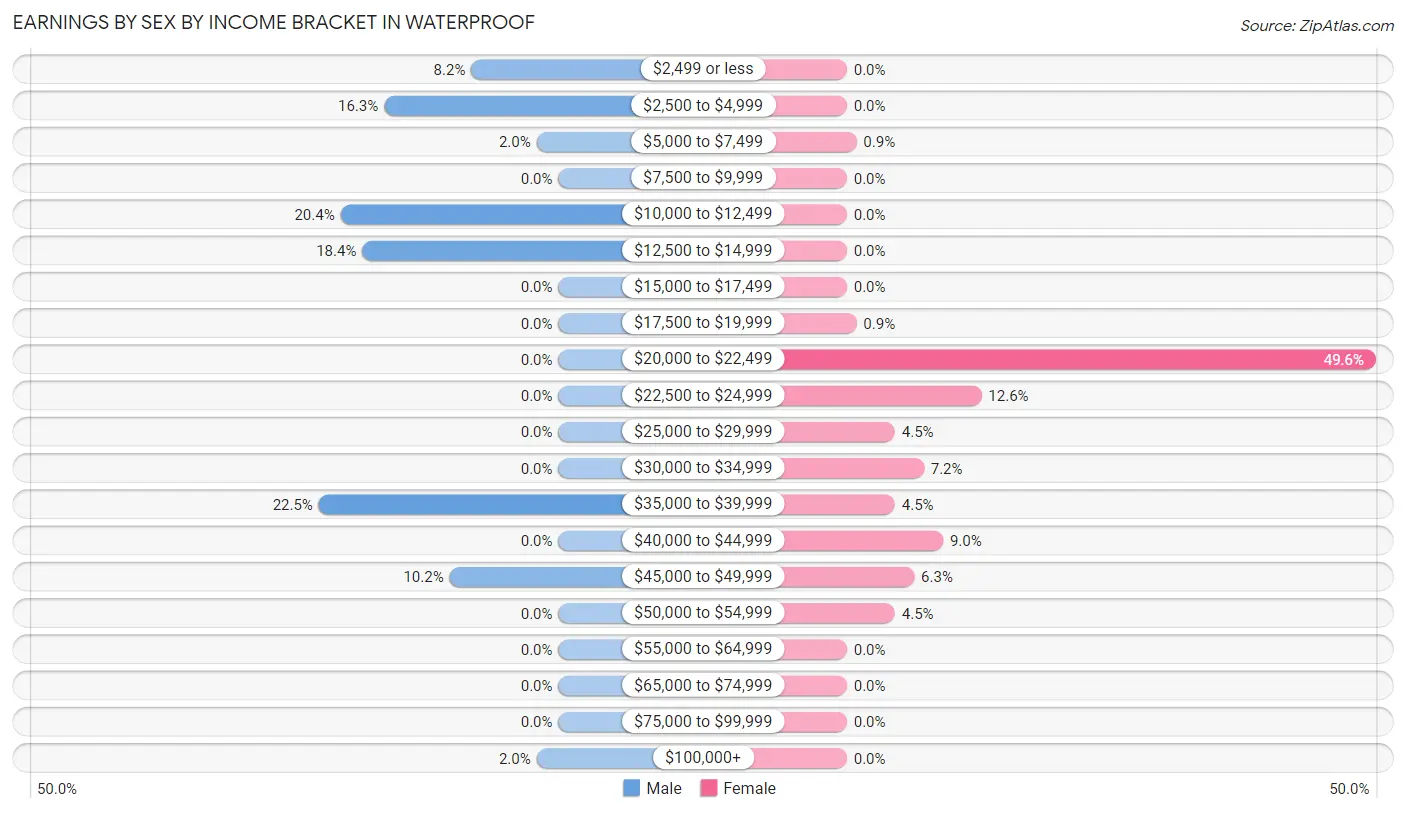
Earnings by Sex by Income Bracket in Waterproof
The most common earnings brackets in Waterproof are $35,000 to $39,999 for men (11 | 22.5%) and $20,000 to $22,499 for women (55 | 49.5%).
| Income | Male | Female |
| $2,499 or less | 4 (8.2%) | 0 (0.0%) |
| $2,500 to $4,999 | 8 (16.3%) | 0 (0.0%) |
| $5,000 to $7,499 | 1 (2.0%) | 1 (0.9%) |
| $7,500 to $9,999 | 0 (0.0%) | 0 (0.0%) |
| $10,000 to $12,499 | 10 (20.4%) | 0 (0.0%) |
| $12,500 to $14,999 | 9 (18.4%) | 0 (0.0%) |
| $15,000 to $17,499 | 0 (0.0%) | 0 (0.0%) |
| $17,500 to $19,999 | 0 (0.0%) | 1 (0.9%) |
| $20,000 to $22,499 | 0 (0.0%) | 55 (49.5%) |
| $22,500 to $24,999 | 0 (0.0%) | 14 (12.6%) |
| $25,000 to $29,999 | 0 (0.0%) | 5 (4.5%) |
| $30,000 to $34,999 | 0 (0.0%) | 8 (7.2%) |
| $35,000 to $39,999 | 11 (22.5%) | 5 (4.5%) |
| $40,000 to $44,999 | 0 (0.0%) | 10 (9.0%) |
| $45,000 to $49,999 | 5 (10.2%) | 7 (6.3%) |
| $50,000 to $54,999 | 0 (0.0%) | 5 (4.5%) |
| $55,000 to $64,999 | 0 (0.0%) | 0 (0.0%) |
| $65,000 to $74,999 | 0 (0.0%) | 0 (0.0%) |
| $75,000 to $99,999 | 0 (0.0%) | 0 (0.0%) |
| $100,000+ | 1 (2.0%) | 0 (0.0%) |
| Total | 49 (100.0%) | 111 (100.0%) |
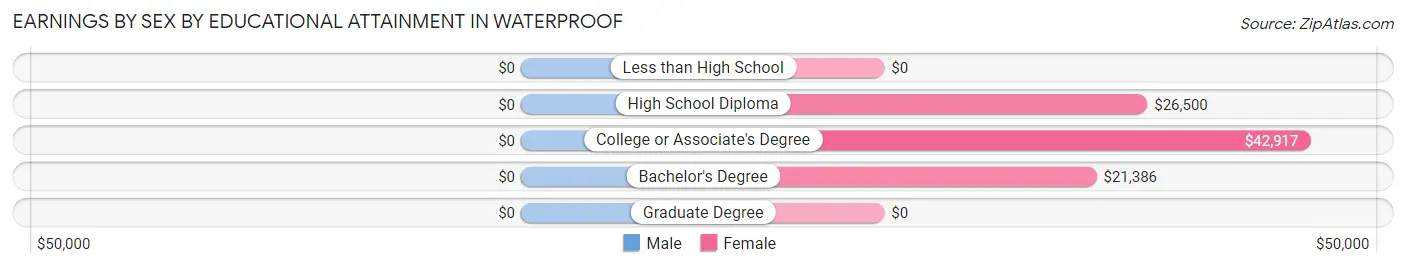
Earnings by Sex by Educational Attainment in Waterproof
| Educational Attainment | Male Income | Female Income |
| Less than High School | - | - |
| High School Diploma | - | - |
| College or Associate's Degree | - | - |
| Bachelor's Degree | - | - |
| Graduate Degree | - | - |
| Total | - | - |
Family Income in Waterproof
Family Income Brackets in Waterproof
According to the Waterproof family income data, there are 20 families falling into the $10,000 to $14,999 income range, which is the most common income bracket and makes up 32.3% of all families.
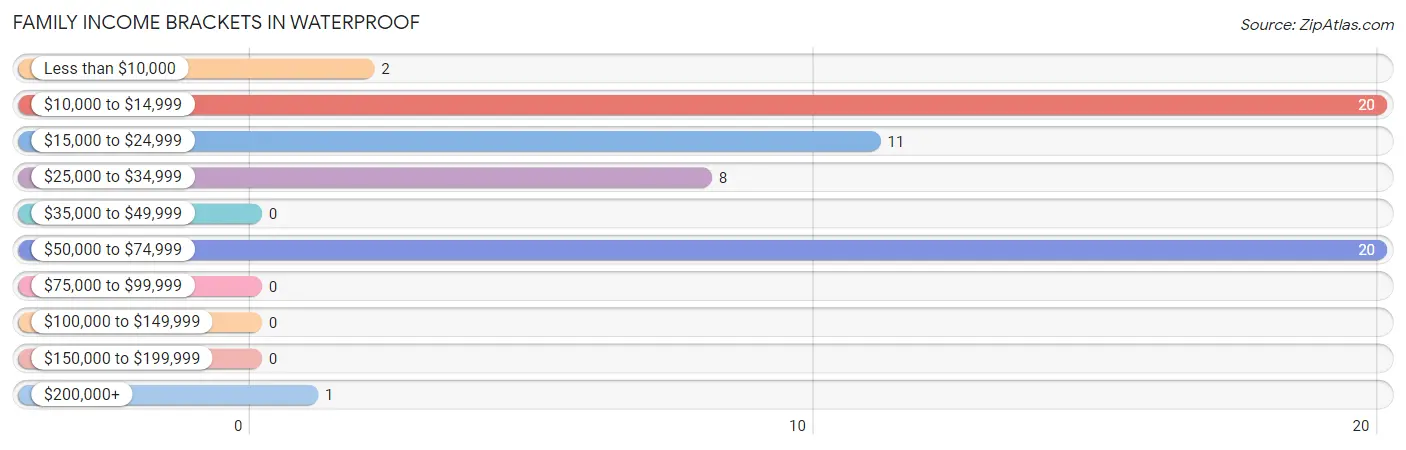
| Income Bracket | # Families | % Families |
| Less than $10,000 | 2 | 3.2% |
| $10,000 to $14,999 | 20 | 32.3% |
| $15,000 to $24,999 | 11 | 17.7% |
| $25,000 to $34,999 | 8 | 12.9% |
| $35,000 to $49,999 | 0 | 0.0% |
| $50,000 to $74,999 | 20 | 32.3% |
| $75,000 to $99,999 | 0 | 0.0% |
| $100,000 to $149,999 | 0 | 0.0% |
| $150,000 to $199,999 | 0 | 0.0% |
| $200,000+ | 1 | 1.6% |
Family Income by Famaliy Size in Waterproof
2-person families (30 | 48.4%) account for the highest median family income in Waterproof with $53,750 per family, while 2-person families (30 | 48.4%) have the highest median income of $26,875 per family member.
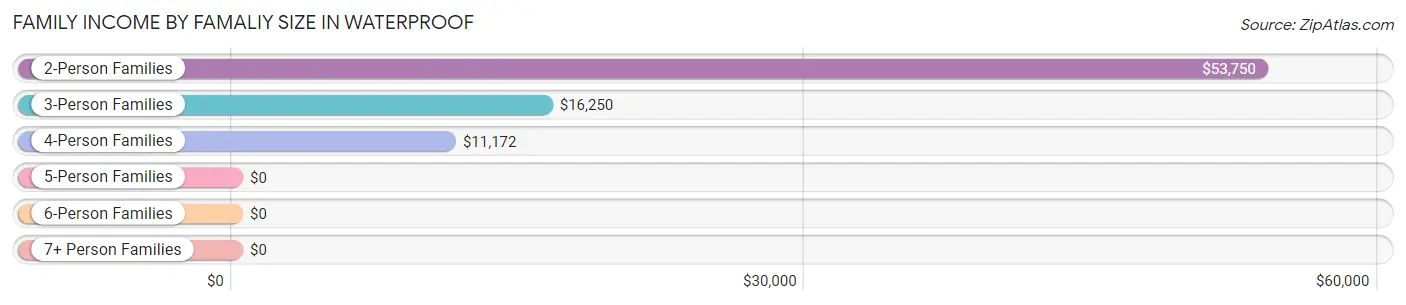
| Income Bracket | # Families | Median Income |
| 2-Person Families | 30 (48.4%) | $53,750 |
| 3-Person Families | 10 (16.1%) | $16,250 |
| 4-Person Families | 19 (30.6%) | $11,172 |
| 5-Person Families | 3 (4.8%) | $0 |
| 6-Person Families | 0 (0.0%) | $0 |
| 7+ Person Families | 0 (0.0%) | $0 |
| Total | 62 (100.0%) | $0 |
Family Income by Number of Earners in Waterproof
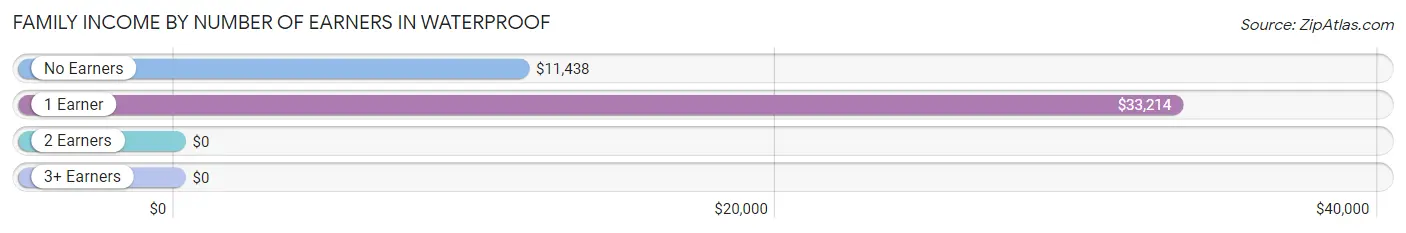
| Number of Earners | # Families | Median Income |
| No Earners | 27 (43.5%) | $11,438 |
| 1 Earner | 20 (32.3%) | $33,214 |
| 2 Earners | 14 (22.6%) | $0 |
| 3+ Earners | 1 (1.6%) | $0 |
| Total | 62 (100.0%) | $0 |
Household Income in Waterproof
Household Income Brackets in Waterproof
With 44 households falling in the category, the $10,000 to $14,999 income range is the most frequent in Waterproof, accounting for 23.0% of all households.
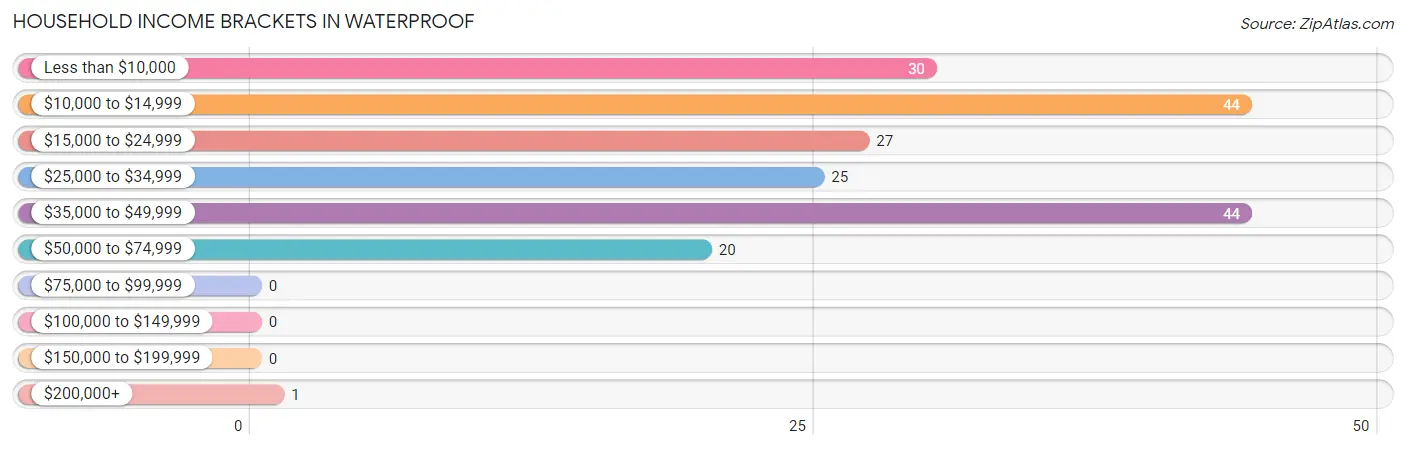
| Income Bracket | # Households | % Households |
| Less than $10,000 | 30 | 15.7% |
| $10,000 to $14,999 | 44 | 23.0% |
| $15,000 to $24,999 | 27 | 14.1% |
| $25,000 to $34,999 | 25 | 13.1% |
| $35,000 to $49,999 | 44 | 23.0% |
| $50,000 to $74,999 | 20 | 10.5% |
| $75,000 to $99,999 | 0 | 0.0% |
| $100,000 to $149,999 | 0 | 0.0% |
| $150,000 to $199,999 | 0 | 0.0% |
| $200,000+ | 1 | 0.5% |
Household Income by Householder Age in Waterproof
The median household income in Waterproof is $21,953, with the highest median household income of $38,125 found in the 45 to 64 years age bracket for the primary householder. A total of 43 households (22.5%) fall into this category. Meanwhile, the 15 to 24 years age bracket for the primary householder has the lowest median household income of $0, with 2 households (1.1%) in this group.
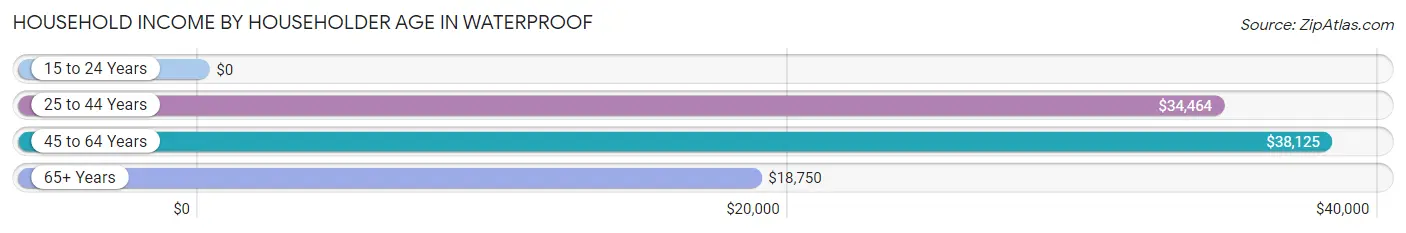
| Income Bracket | # Households | Median Income |
| 15 to 24 Years | 2 (1.1%) | $0 |
| 25 to 44 Years | 17 (8.9%) | $34,464 |
| 45 to 64 Years | 43 (22.5%) | $38,125 |
| 65+ Years | 129 (67.5%) | $18,750 |
| Total | 191 (100.0%) | $21,953 |
Poverty in Waterproof
Income Below Poverty by Sex and Age in Waterproof
With 62.0% poverty level for males and 79.7% for females among the residents of Waterproof, 5 year old males and 5 year old females are the most vulnerable to poverty, with 10 males (100.0%) and 11 females (100.0%) in their respective age groups living below the poverty level.
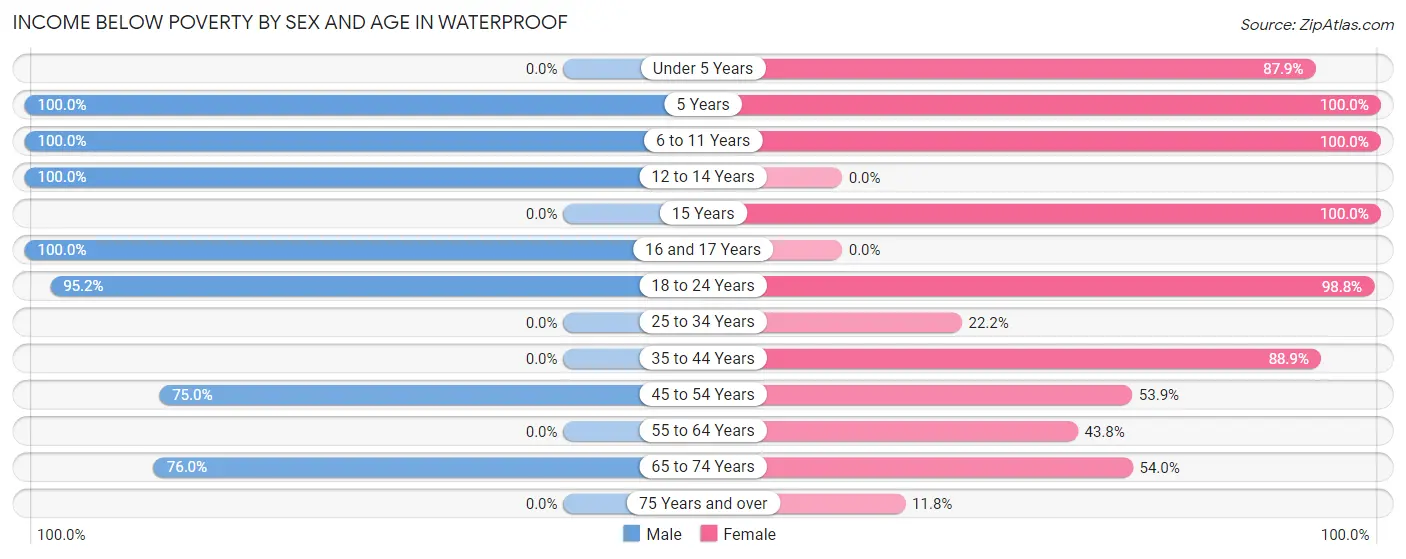
| Age Bracket | Male | Female |
| Under 5 Years | 0 (0.0%) | 58 (87.9%) |
| 5 Years | 10 (100.0%) | 11 (100.0%) |
| 6 to 11 Years | 8 (100.0%) | 15 (100.0%) |
| 12 to 14 Years | 6 (100.0%) | 0 (0.0%) |
| 15 Years | 0 (0.0%) | 66 (100.0%) |
| 16 and 17 Years | 6 (100.0%) | 0 (0.0%) |
| 18 to 24 Years | 20 (95.2%) | 80 (98.8%) |
| 25 to 34 Years | 0 (0.0%) | 2 (22.2%) |
| 35 to 44 Years | 0 (0.0%) | 56 (88.9%) |
| 45 to 54 Years | 18 (75.0%) | 14 (53.8%) |
| 55 to 64 Years | 0 (0.0%) | 7 (43.8%) |
| 65 to 74 Years | 38 (76.0%) | 34 (54.0%) |
| 75 Years and over | 0 (0.0%) | 2 (11.8%) |
| Total | 106 (62.0%) | 345 (79.7%) |
Income Above Poverty by Sex and Age in Waterproof
According to the poverty statistics in Waterproof, males aged 55 to 64 years and females aged 75 years and over are the age groups that are most secure financially, with 100.0% of males and 88.2% of females in these age groups living above the poverty line.
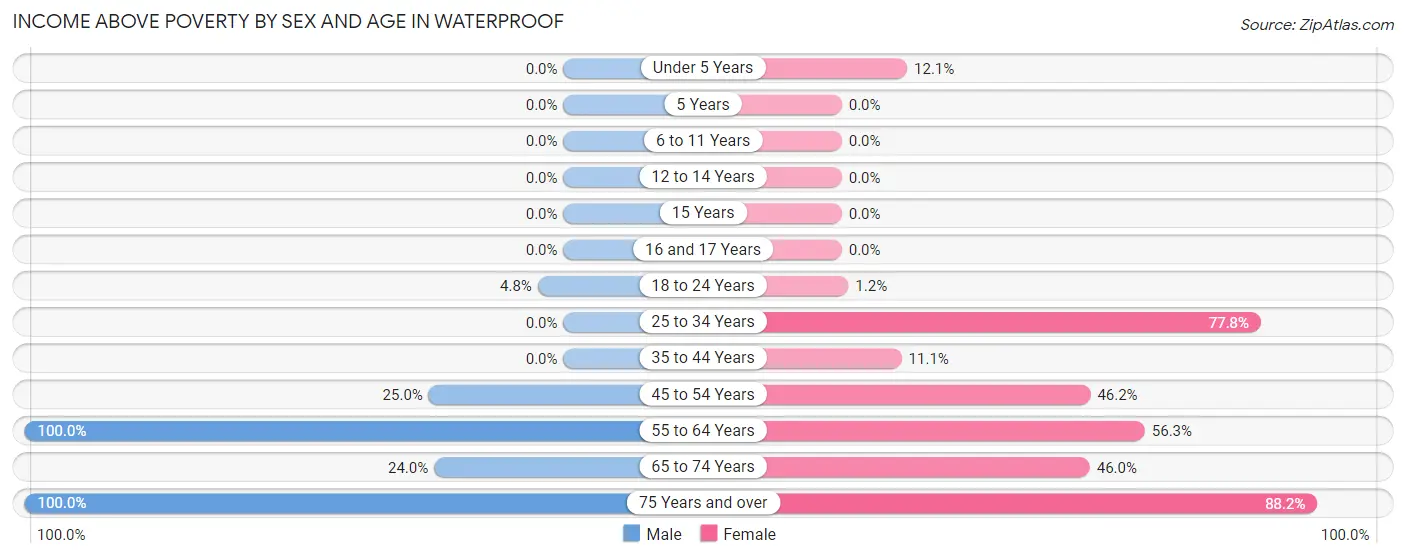
| Age Bracket | Male | Female |
| Under 5 Years | 0 (0.0%) | 8 (12.1%) |
| 5 Years | 0 (0.0%) | 0 (0.0%) |
| 6 to 11 Years | 0 (0.0%) | 0 (0.0%) |
| 12 to 14 Years | 0 (0.0%) | 0 (0.0%) |
| 15 Years | 0 (0.0%) | 0 (0.0%) |
| 16 and 17 Years | 0 (0.0%) | 0 (0.0%) |
| 18 to 24 Years | 1 (4.8%) | 1 (1.2%) |
| 25 to 34 Years | 0 (0.0%) | 7 (77.8%) |
| 35 to 44 Years | 0 (0.0%) | 7 (11.1%) |
| 45 to 54 Years | 6 (25.0%) | 12 (46.2%) |
| 55 to 64 Years | 22 (100.0%) | 9 (56.2%) |
| 65 to 74 Years | 12 (24.0%) | 29 (46.0%) |
| 75 Years and over | 24 (100.0%) | 15 (88.2%) |
| Total | 65 (38.0%) | 88 (20.3%) |
Income Below Poverty Among Married-Couple Families in Waterproof
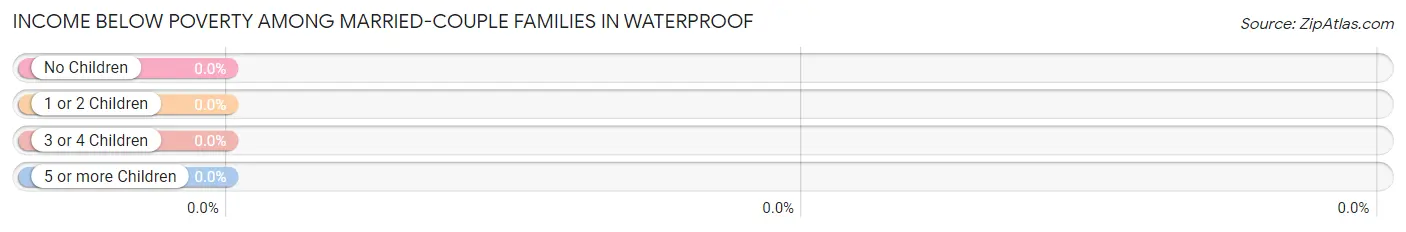
| Children | Above Poverty | Below Poverty |
| No Children | 19 (100.0%) | 0 (0.0%) |
| 1 or 2 Children | 0 (0.0%) | 0 (0.0%) |
| 3 or 4 Children | 0 (0.0%) | 0 (0.0%) |
| 5 or more Children | 0 (0.0%) | 0 (0.0%) |
| Total | 19 (100.0%) | 0 (0.0%) |
Income Below Poverty Among Single-Parent Households in Waterproof
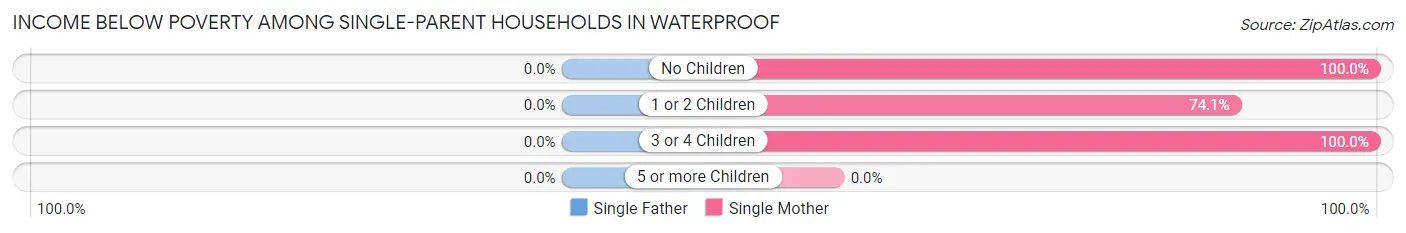
| Children | Single Father | Single Mother |
| No Children | 0 (0.0%) | 6 (100.0%) |
| 1 or 2 Children | 0 (0.0%) | 20 (74.1%) |
| 3 or 4 Children | 0 (0.0%) | 5 (100.0%) |
| 5 or more Children | 0 (0.0%) | 0 (0.0%) |
| Total | 0 (0.0%) | 31 (81.6%) |
Income Below Poverty Among Married-Couple vs Single-Parent Households in Waterproof
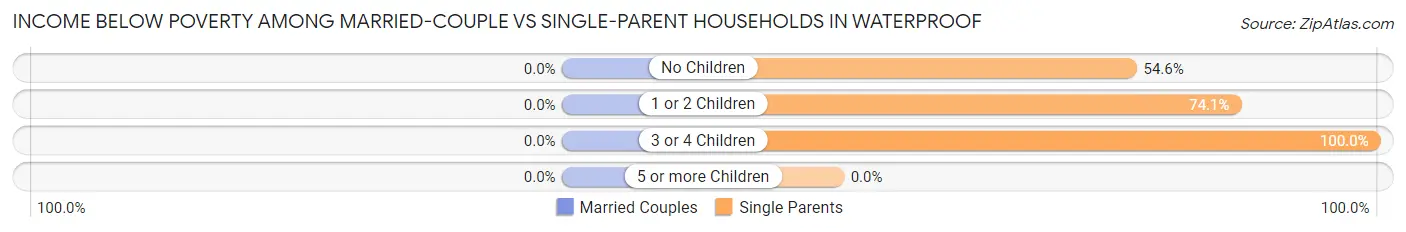
| Children | Married-Couple Families | Single-Parent Households |
| No Children | 0 (0.0%) | 6 (54.5%) |
| 1 or 2 Children | 0 (0.0%) | 20 (74.1%) |
| 3 or 4 Children | 0 (0.0%) | 5 (100.0%) |
| 5 or more Children | 0 (0.0%) | 0 (0.0%) |
| Total | 0 (0.0%) | 31 (72.1%) |
Race in Waterproof
The most populous races in Waterproof are Black / African American (514 | 85.1%), White / Caucasian (48 | 8.0%), and Asian (34 | 5.6%).
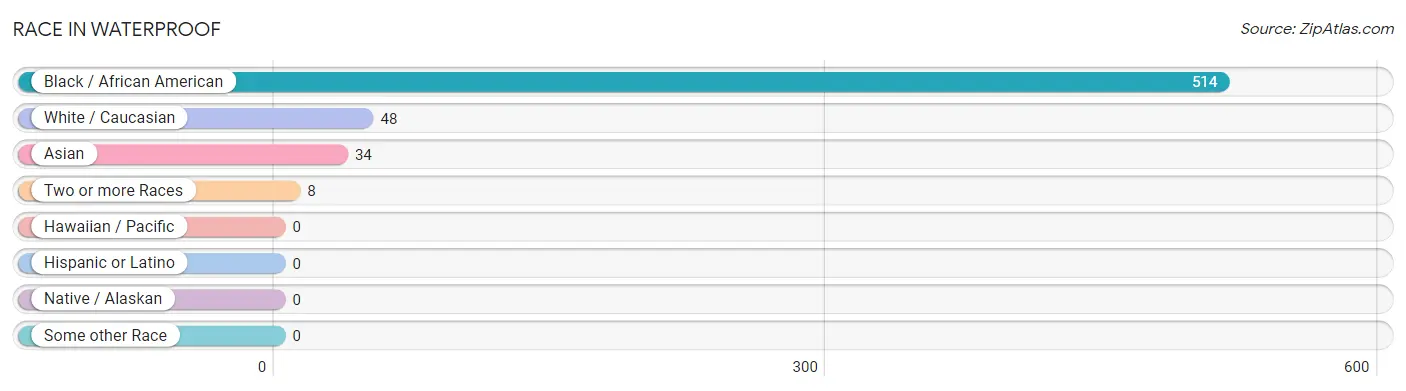
| Race | # Population | % Population |
| Asian | 34 | 5.6% |
| Black / African American | 514 | 85.1% |
| Hawaiian / Pacific | 0 | 0.0% |
| Hispanic or Latino | 0 | 0.0% |
| Native / Alaskan | 0 | 0.0% |
| White / Caucasian | 48 | 8.0% |
| Two or more Races | 8 | 1.3% |
| Some other Race | 0 | 0.0% |
| Total | 604 | 100.0% |
Ancestry in Waterproof
The most populous ancestries reported in Waterproof are German (6 | 1.0%), and Irish (6 | 1.0%), together accounting for 2.0% of all Waterproof residents.
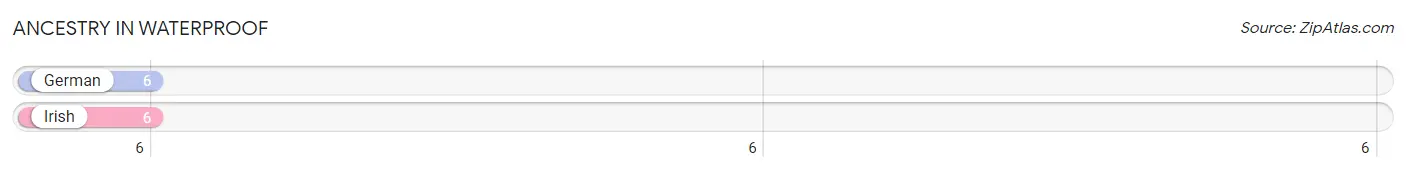
| Ancestry | # Population | % Population |
| German | 6 | 1.0% |
| Irish | 6 | 1.0% | View All 2 Rows |
Immigrants in Waterproof
The most numerous immigrant groups reported in Waterproof came from Asia (4 | 0.7%), Malaysia (4 | 0.7%), and South Eastern Asia (4 | 0.7%), together accounting for 2.0% of all Waterproof residents.
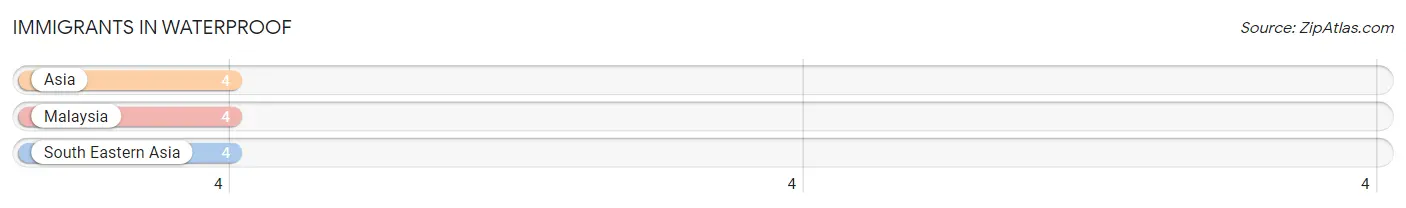
| Immigration Origin | # Population | % Population |
| Asia | 4 | 0.7% |
| Malaysia | 4 | 0.7% |
| South Eastern Asia | 4 | 0.7% | View All 3 Rows |
Sex and Age in Waterproof
Sex and Age in Waterproof
The most populous age groups in Waterproof are 65 to 69 Years (40 | 23.4%) for men and 15 to 19 Years (146 | 33.7%) for women.
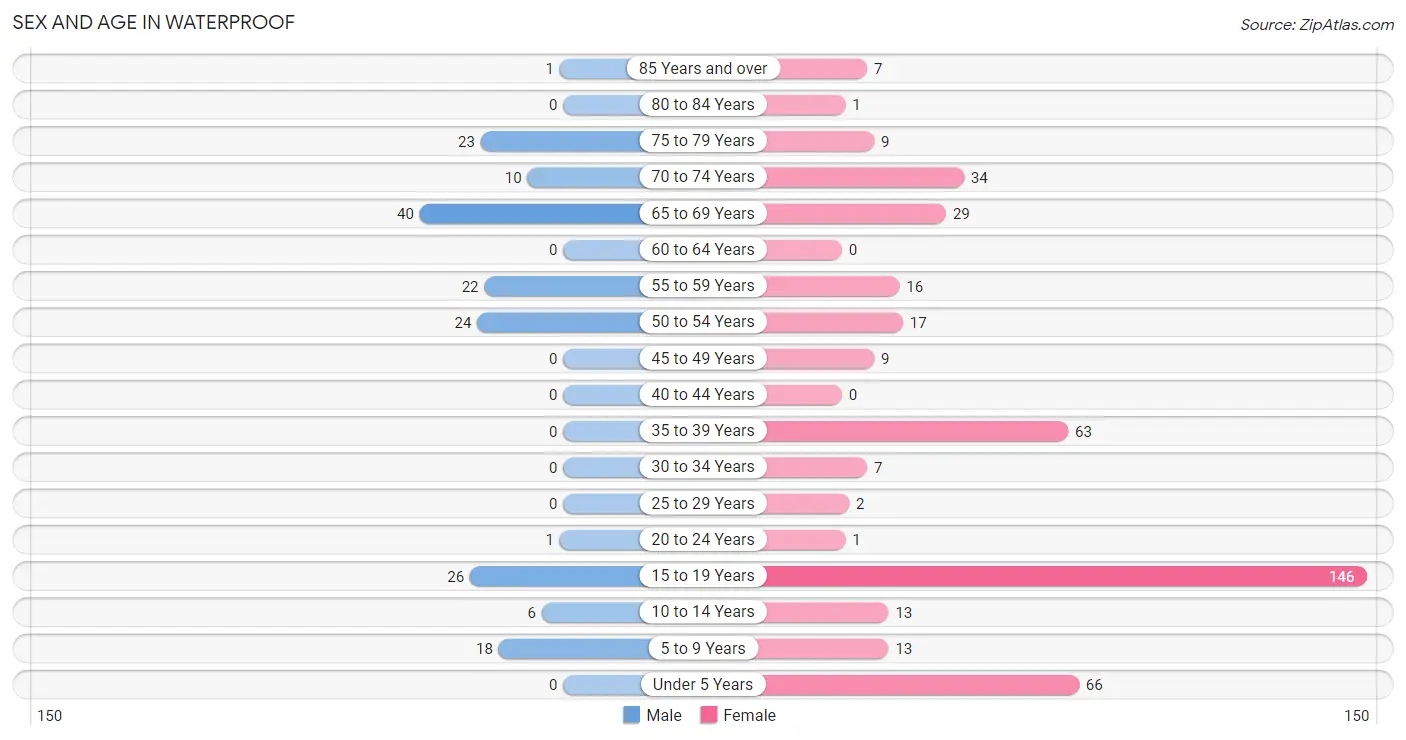
| Age Bracket | Male | Female |
| Under 5 Years | 0 (0.0%) | 66 (15.2%) |
| 5 to 9 Years | 18 (10.5%) | 13 (3.0%) |
| 10 to 14 Years | 6 (3.5%) | 13 (3.0%) |
| 15 to 19 Years | 26 (15.2%) | 146 (33.7%) |
| 20 to 24 Years | 1 (0.6%) | 1 (0.2%) |
| 25 to 29 Years | 0 (0.0%) | 2 (0.5%) |
| 30 to 34 Years | 0 (0.0%) | 7 (1.6%) |
| 35 to 39 Years | 0 (0.0%) | 63 (14.5%) |
| 40 to 44 Years | 0 (0.0%) | 0 (0.0%) |
| 45 to 49 Years | 0 (0.0%) | 9 (2.1%) |
| 50 to 54 Years | 24 (14.0%) | 17 (3.9%) |
| 55 to 59 Years | 22 (12.9%) | 16 (3.7%) |
| 60 to 64 Years | 0 (0.0%) | 0 (0.0%) |
| 65 to 69 Years | 40 (23.4%) | 29 (6.7%) |
| 70 to 74 Years | 10 (5.9%) | 34 (7.9%) |
| 75 to 79 Years | 23 (13.5%) | 9 (2.1%) |
| 80 to 84 Years | 0 (0.0%) | 1 (0.2%) |
| 85 Years and over | 1 (0.6%) | 7 (1.6%) |
| Total | 171 (100.0%) | 433 (100.0%) |
Families and Households in Waterproof
Median Family Size in Waterproof
The median family size in Waterproof is 7.58 persons per family, with single female/mother families (38 | 61.3%) accounting for the largest median family size of 10.71 persons per family. On the other hand, married-couple families (19 | 30.6%) represent the smallest median family size with 1.84 persons per family.
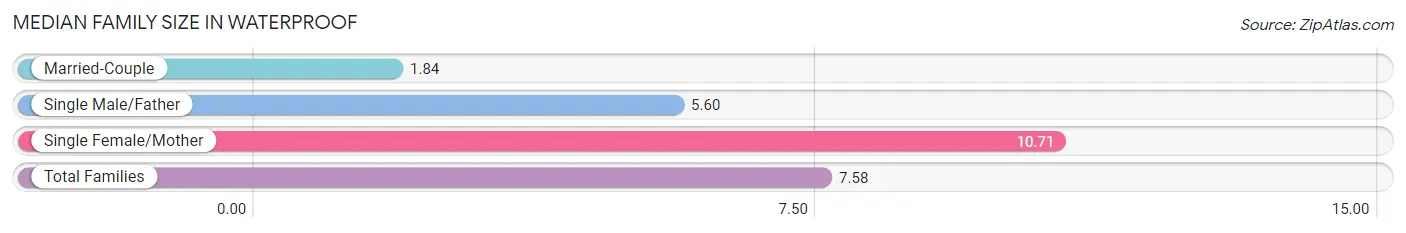
| Family Type | # Families | Family Size |
| Married-Couple | 19 (30.6%) | 1.84 |
| Single Male/Father | 5 (8.1%) | 5.60 |
| Single Female/Mother | 38 (61.3%) | 10.71 |
| Total Families | 62 (100.0%) | 7.58 |
Median Household Size in Waterproof
The median household size in Waterproof is 3.16 persons per household, with single female/mother households (38 | 19.9%) accounting for the largest median household size of 10.71 persons per household. non-family households (129 | 67.5%) represent the smallest median household size with 1.04 persons per household.
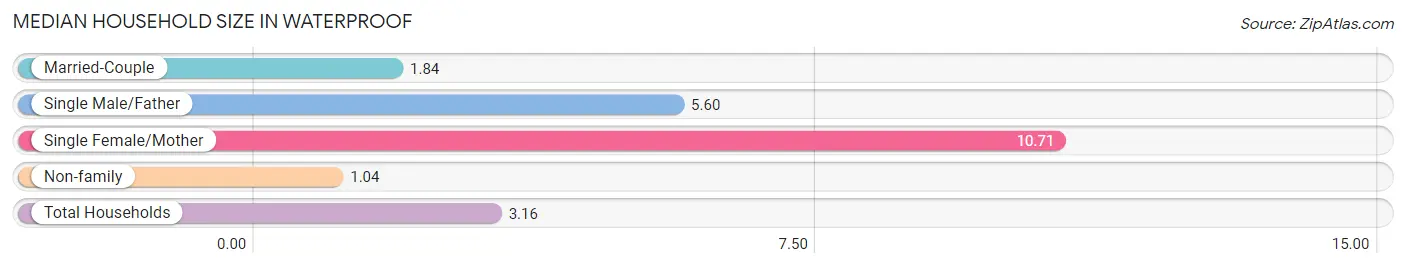
| Household Type | # Households | Household Size |
| Married-Couple | 19 (10.0%) | 1.84 |
| Single Male/Father | 5 (2.6%) | 5.60 |
| Single Female/Mother | 38 (19.9%) | 10.71 |
| Non-family | 129 (67.5%) | 1.04 |
| Total Households | 191 (100.0%) | 3.16 |
Household Size by Marriage Status in Waterproof
Out of a total of 191 households in Waterproof, 62 (32.5%) are family households, while 129 (67.5%) are nonfamily households. The most numerous type of family households are 2-person households, comprising 30, and the most common type of nonfamily households are 1-person households, comprising 122.
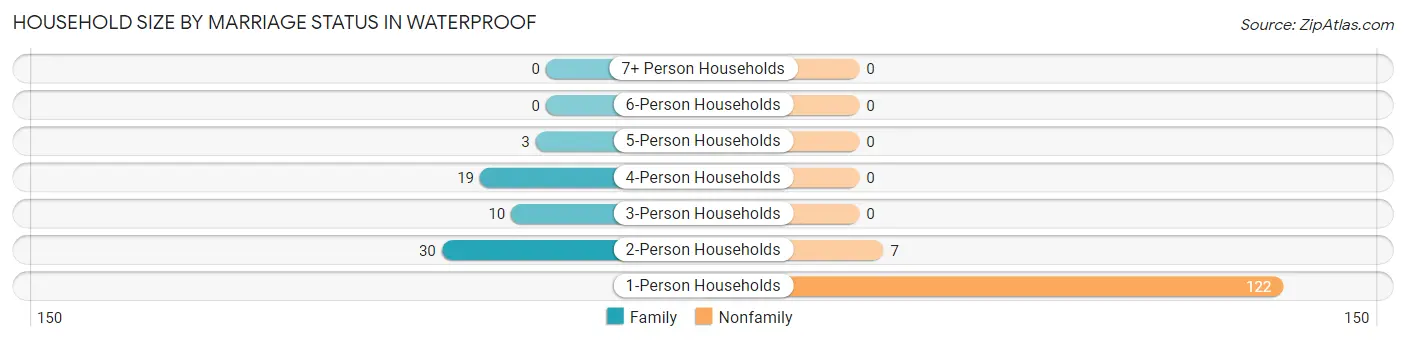
| Household Size | Family Households | Nonfamily Households |
| 1-Person Households | - | 122 (63.9%) |
| 2-Person Households | 30 (15.7%) | 7 (3.7%) |
| 3-Person Households | 10 (5.2%) | 0 (0.0%) |
| 4-Person Households | 19 (10.0%) | 0 (0.0%) |
| 5-Person Households | 3 (1.6%) | 0 (0.0%) |
| 6-Person Households | 0 (0.0%) | 0 (0.0%) |
| 7+ Person Households | 0 (0.0%) | 0 (0.0%) |
| Total | 62 (32.5%) | 129 (67.5%) |
Female Fertility in Waterproof
Fertility by Age in Waterproof
| Age Bracket | Women with Births | Births / 1,000 Women |
| 15 to 19 years | 0 (0.0%) | 0.0 |
| 20 to 34 years | 0 (0.0%) | 0.0 |
| 35 to 50 years | 0 (0.0%) | 0.0 |
| Total | 0 (0.0%) | 0.0 |
Fertility by Age by Marriage Status in Waterproof
| Age Bracket | Married | Unmarried |
| 15 to 19 years | 0 (0.0%) | 0 (0.0%) |
| 20 to 34 years | 0 (0.0%) | 0 (0.0%) |
| 35 to 50 years | 0 (0.0%) | 0 (0.0%) |
| Total | 0 (0.0%) | 0 (0.0%) |
Fertility by Education in Waterproof
| Educational Attainment | Women with Births | Births / 1,000 Women |
| Less than High School | 0 (0.0%) | 0.0 |
| High School Diploma | 0 (0.0%) | 0.0 |
| College or Associate's Degree | 0 (0.0%) | 0.0 |
| Bachelor's Degree | 0 (0.0%) | 0.0 |
| Graduate Degree | 0 (0.0%) | 0.0 |
| Total | 0 (0.0%) | 0.0 |
Fertility by Education by Marriage Status in Waterproof
| Educational Attainment | Married | Unmarried |
| Less than High School | 0 (0.0%) | 0 (0.0%) |
| High School Diploma | 0 (0.0%) | 0 (0.0%) |
| College or Associate's Degree | 0 (0.0%) | 0 (0.0%) |
| Bachelor's Degree | 0 (0.0%) | 0 (0.0%) |
| Graduate Degree | 0 (0.0%) | 0 (0.0%) |
| Total | 0 (0.0%) | 0 (0.0%) |
Employment Characteristics in Waterproof
Employment by Class of Employer in Waterproof
Among the 103 employed individuals in Waterproof, private company employees (78 | 75.7%), local government employees (21 | 20.4%), and federal government employees (3 | 2.9%) make up the most common classes of employment.
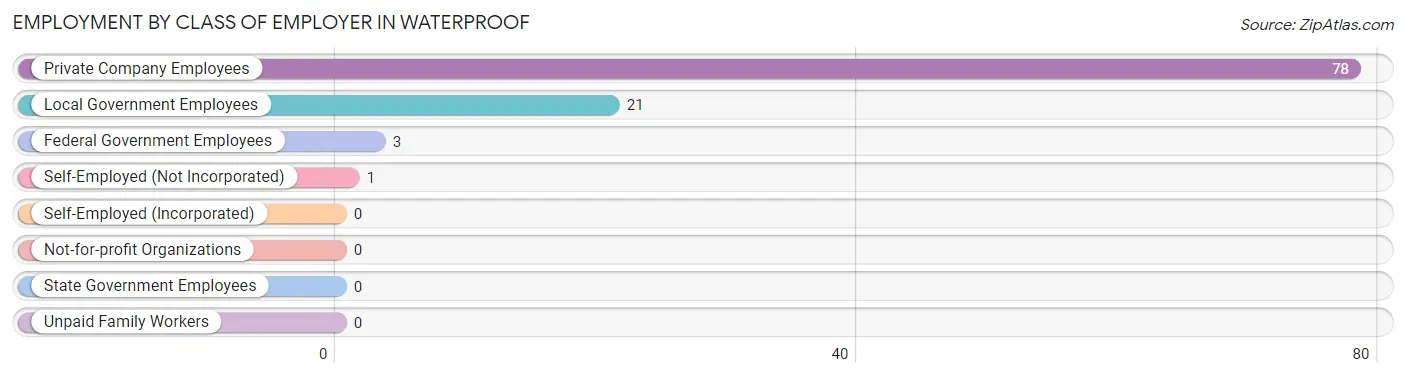
| Employer Class | # Employees | % Employees |
| Private Company Employees | 78 | 75.7% |
| Self-Employed (Incorporated) | 0 | 0.0% |
| Self-Employed (Not Incorporated) | 1 | 1.0% |
| Not-for-profit Organizations | 0 | 0.0% |
| Local Government Employees | 21 | 20.4% |
| State Government Employees | 0 | 0.0% |
| Federal Government Employees | 3 | 2.9% |
| Unpaid Family Workers | 0 | 0.0% |
| Total | 103 | 100.0% |
Employment Status by Age in Waterproof
According to the labor force statistics for Waterproof, out of the total population over 16 years of age (422), 28.0% or 118 individuals are in the labor force, with 11.0% or 13 of them unemployed. The age group with the highest labor force participation rate is 20 to 24 years, with 100.0% or 2 individuals in the labor force. Within the labor force, the 16 to 19 years age range has the highest percentage of unemployed individuals, with 61.9% or 13 of them being unemployed.
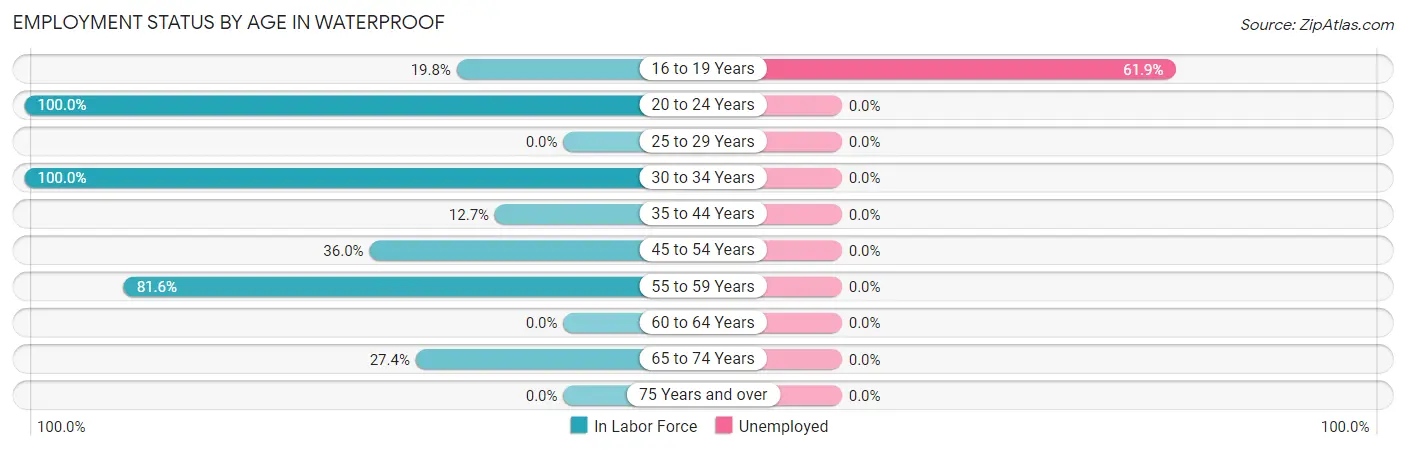
| Age Bracket | In Labor Force | Unemployed |
| 16 to 19 Years | 21 (19.8%) | 13 (61.9%) |
| 20 to 24 Years | 2 (100.0%) | 0 (0.0%) |
| 25 to 29 Years | 0 (0.0%) | 0 (0.0%) |
| 30 to 34 Years | 7 (100.0%) | 0 (0.0%) |
| 35 to 44 Years | 8 (12.7%) | 0 (0.0%) |
| 45 to 54 Years | 18 (36.0%) | 0 (0.0%) |
| 55 to 59 Years | 31 (81.6%) | 0 (0.0%) |
| 60 to 64 Years | 0 (0.0%) | 0 (0.0%) |
| 65 to 74 Years | 31 (27.4%) | 0 (0.0%) |
| 75 Years and over | 0 (0.0%) | 0 (0.0%) |
| Total | 118 (28.0%) | 13 (11.0%) |
Employment Status by Educational Attainment in Waterproof
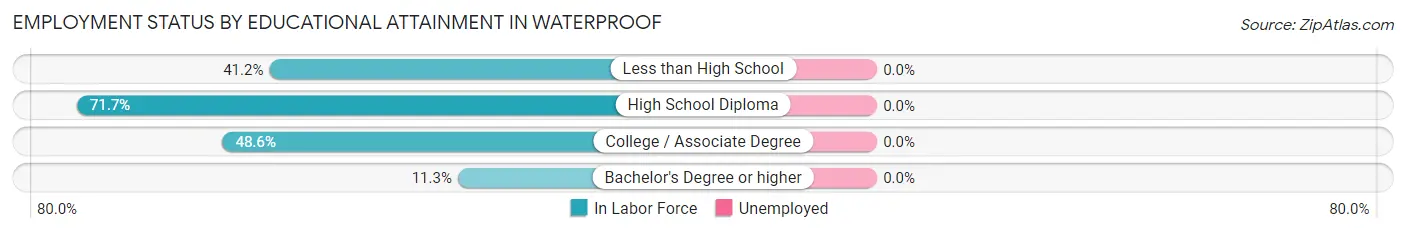
| Educational Attainment | In Labor Force | Unemployed |
| Less than High School | 7 (41.2%) | 0 (0.0%) |
| High School Diploma | 33 (71.7%) | 0 (0.0%) |
| College / Associate Degree | 17 (48.6%) | 0 (0.0%) |
| Bachelor's Degree or higher | 7 (11.3%) | 0 (0.0%) |
| Total | 64 (40.0%) | 0 (0.0%) |
Employment Occupations by Sex in Waterproof
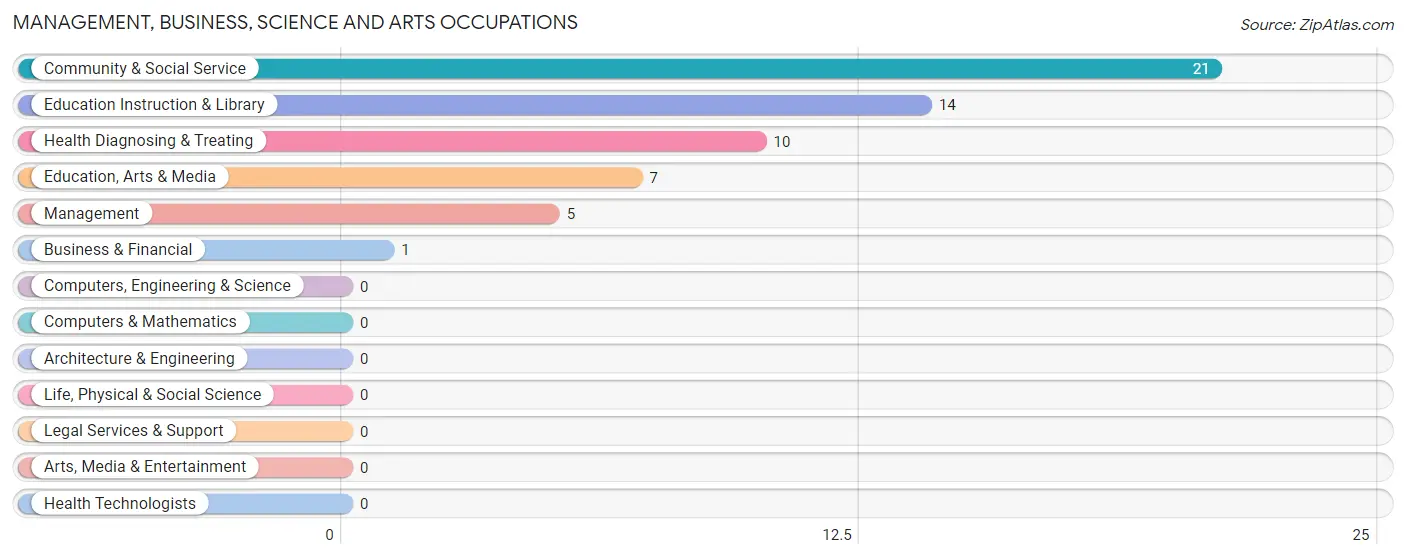
Management, Business, Science and Arts Occupations
The most common Management, Business, Science and Arts occupations in Waterproof are Community & Social Service (21 | 20.0%), Education Instruction & Library (14 | 13.3%), Health Diagnosing & Treating (10 | 9.5%), Education, Arts & Media (7 | 6.7%), and Management (5 | 4.8%).
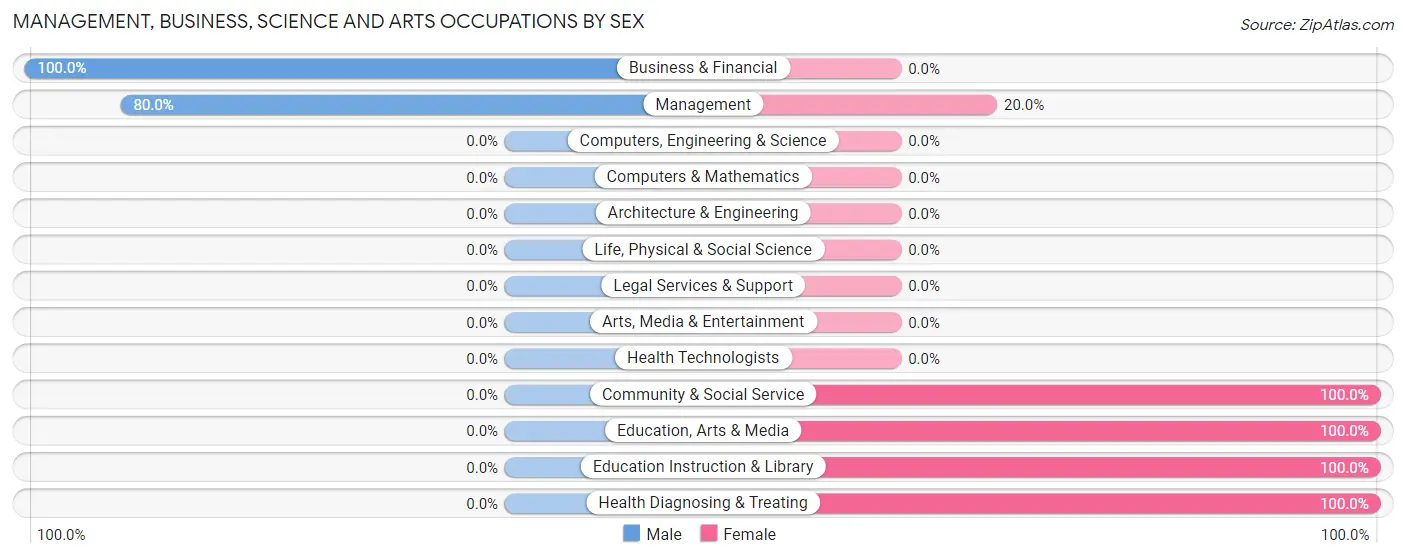
Management, Business, Science and Arts Occupations by Sex
Within the Management, Business, Science and Arts occupations in Waterproof, the most male-oriented occupations are Business & Financial (100.0%), and Management (80.0%), while the most female-oriented occupations are Community & Social Service (100.0%), Education, Arts & Media (100.0%), and Education Instruction & Library (100.0%).
| Occupation | Male | Female |
| Management | 4 (80.0%) | 1 (20.0%) |
| Business & Financial | 1 (100.0%) | 0 (0.0%) |
| Computers, Engineering & Science | 0 (0.0%) | 0 (0.0%) |
| Computers & Mathematics | 0 (0.0%) | 0 (0.0%) |
| Architecture & Engineering | 0 (0.0%) | 0 (0.0%) |
| Life, Physical & Social Science | 0 (0.0%) | 0 (0.0%) |
| Community & Social Service | 0 (0.0%) | 21 (100.0%) |
| Education, Arts & Media | 0 (0.0%) | 7 (100.0%) |
| Legal Services & Support | 0 (0.0%) | 0 (0.0%) |
| Education Instruction & Library | 0 (0.0%) | 14 (100.0%) |
| Arts, Media & Entertainment | 0 (0.0%) | 0 (0.0%) |
| Health Diagnosing & Treating | 0 (0.0%) | 10 (100.0%) |
| Health Technologists | 0 (0.0%) | 0 (0.0%) |
| Total (Category) | 5 (13.5%) | 32 (86.5%) |
| Total (Overall) | 49 (46.7%) | 56 (53.3%) |
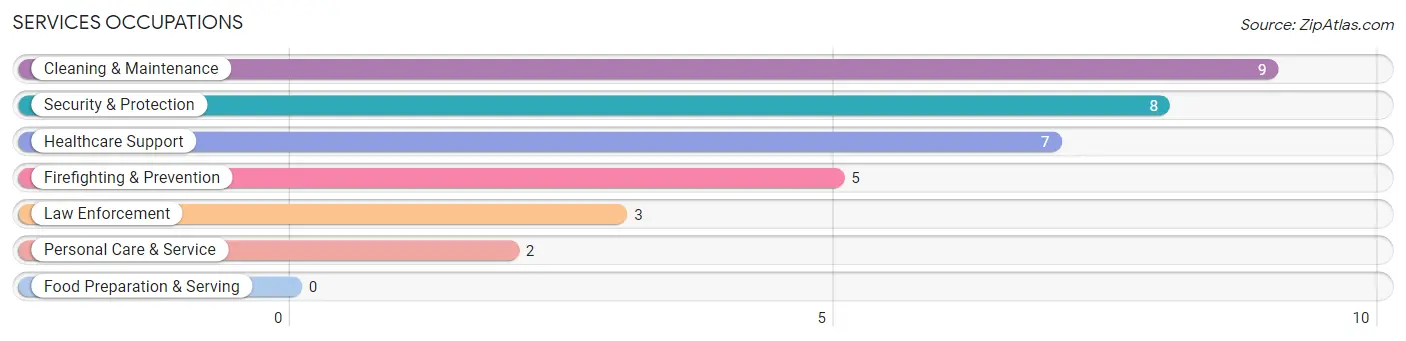
Services Occupations
The most common Services occupations in Waterproof are Cleaning & Maintenance (9 | 8.6%), Security & Protection (8 | 7.6%), Healthcare Support (7 | 6.7%), Firefighting & Prevention (5 | 4.8%), and Law Enforcement (3 | 2.9%).
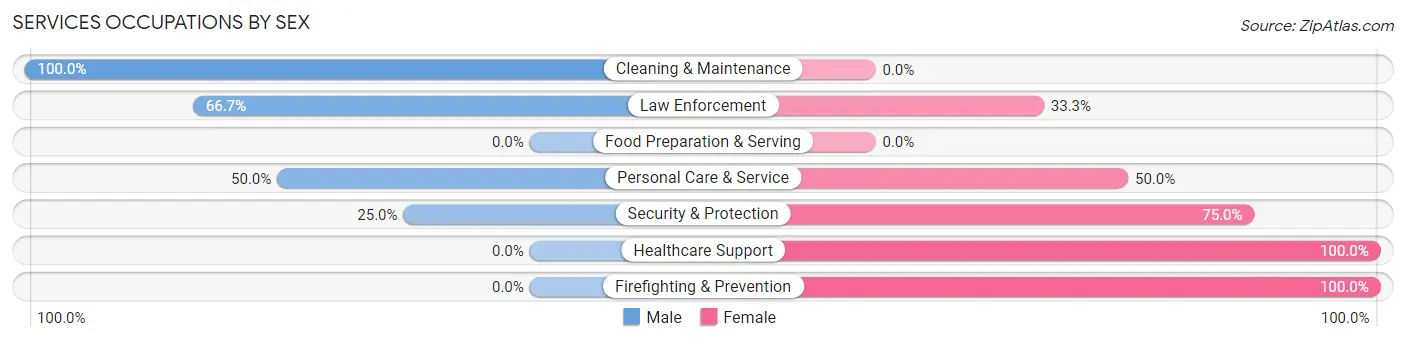
Services Occupations by Sex
Within the Services occupations in Waterproof, the most male-oriented occupations are Cleaning & Maintenance (100.0%), Law Enforcement (66.7%), and Personal Care & Service (50.0%), while the most female-oriented occupations are Healthcare Support (100.0%), Firefighting & Prevention (100.0%), and Security & Protection (75.0%).
| Occupation | Male | Female |
| Healthcare Support | 0 (0.0%) | 7 (100.0%) |
| Security & Protection | 2 (25.0%) | 6 (75.0%) |
| Firefighting & Prevention | 0 (0.0%) | 5 (100.0%) |
| Law Enforcement | 2 (66.7%) | 1 (33.3%) |
| Food Preparation & Serving | 0 (0.0%) | 0 (0.0%) |
| Cleaning & Maintenance | 9 (100.0%) | 0 (0.0%) |
| Personal Care & Service | 1 (50.0%) | 1 (50.0%) |
| Total (Category) | 12 (46.2%) | 14 (53.8%) |
| Total (Overall) | 49 (46.7%) | 56 (53.3%) |
Sales and Office Occupations
The most common Sales and Office occupations in Waterproof are , and Office & Administration (1 | 0.9%).
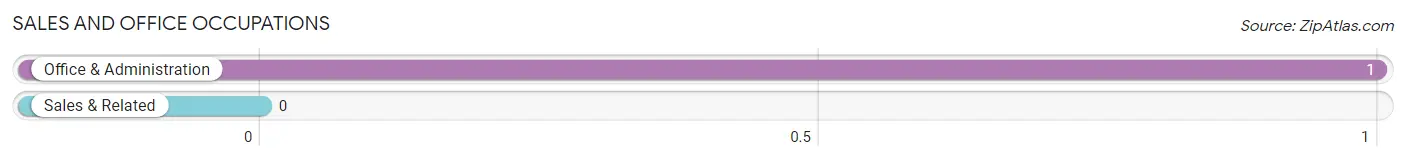
Sales and Office Occupations by Sex
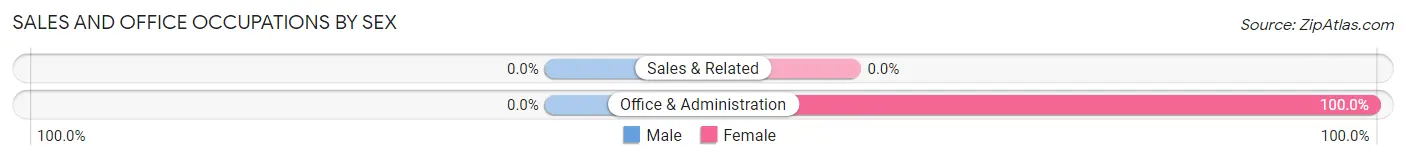
| Occupation | Male | Female |
| Sales & Related | 0 (0.0%) | 0 (0.0%) |
| Office & Administration | 0 (0.0%) | 1 (100.0%) |
| Total (Category) | 0 (0.0%) | 1 (100.0%) |
| Total (Overall) | 49 (46.7%) | 56 (53.3%) |
Natural Resources, Construction and Maintenance Occupations
The most common Natural Resources, Construction and Maintenance occupations in Waterproof are , and Farming, Fishing & Forestry (19 | 18.1%).
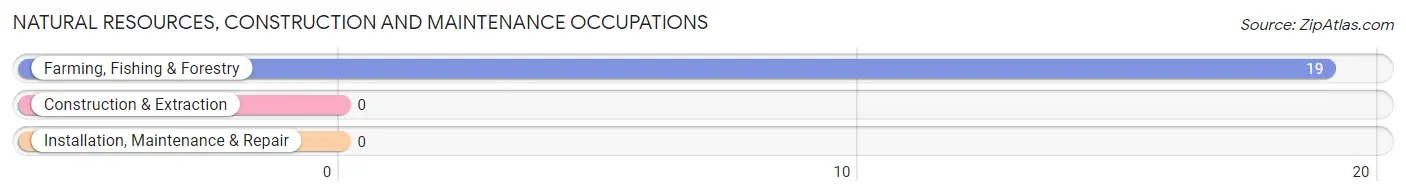
Natural Resources, Construction and Maintenance Occupations by Sex
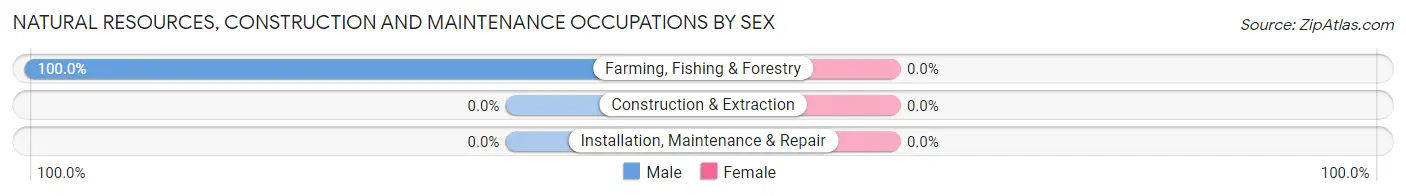
| Occupation | Male | Female |
| Farming, Fishing & Forestry | 19 (100.0%) | 0 (0.0%) |
| Construction & Extraction | 0 (0.0%) | 0 (0.0%) |
| Installation, Maintenance & Repair | 0 (0.0%) | 0 (0.0%) |
| Total (Category) | 19 (100.0%) | 0 (0.0%) |
| Total (Overall) | 49 (46.7%) | 56 (53.3%) |
Production, Transportation and Moving Occupations
The most common Production, Transportation and Moving occupations in Waterproof are Transportation (13 | 12.4%), and Production (9 | 8.6%).
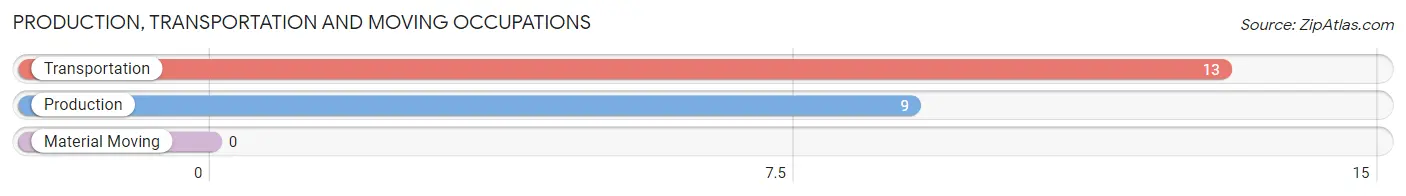
Production, Transportation and Moving Occupations by Sex
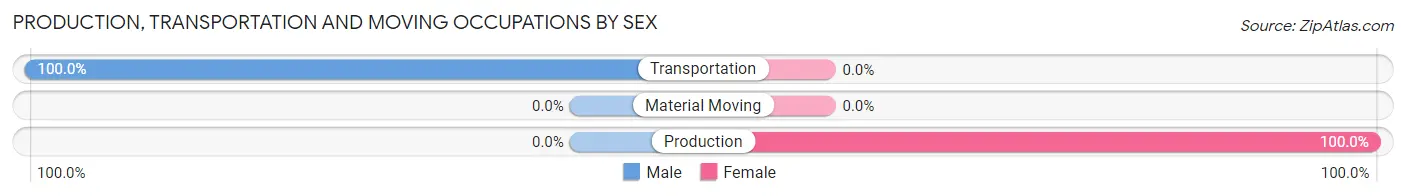
| Occupation | Male | Female |
| Production | 0 (0.0%) | 9 (100.0%) |
| Transportation | 13 (100.0%) | 0 (0.0%) |
| Material Moving | 0 (0.0%) | 0 (0.0%) |
| Total (Category) | 13 (59.1%) | 9 (40.9%) |
| Total (Overall) | 49 (46.7%) | 56 (53.3%) |
Employment Industries by Sex in Waterproof
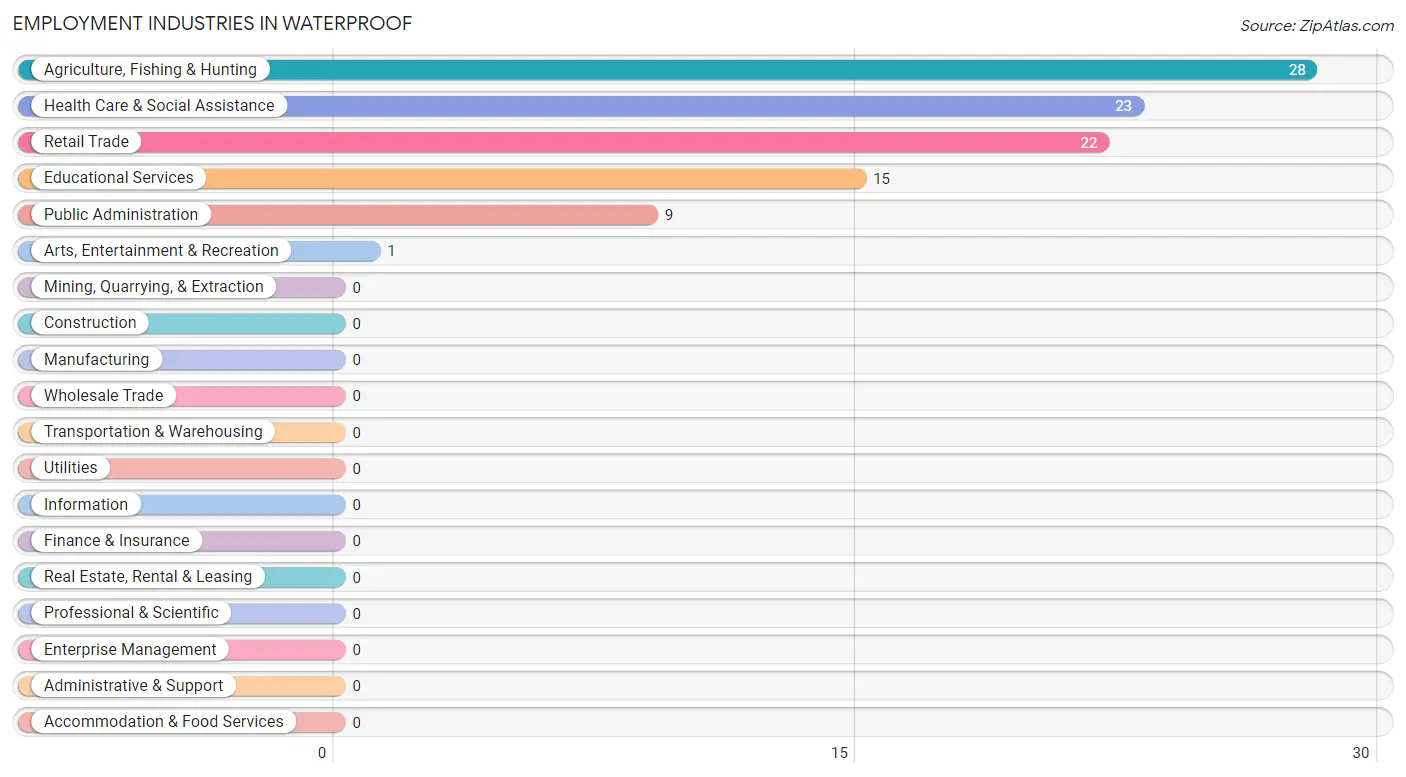
Employment Industries in Waterproof
The major employment industries in Waterproof include Agriculture, Fishing & Hunting (28 | 26.7%), Health Care & Social Assistance (23 | 21.9%), Retail Trade (22 | 20.9%), Educational Services (15 | 14.3%), and Public Administration (9 | 8.6%).
Employment Industries by Sex in Waterproof
The Waterproof industries that see more men than women are Agriculture, Fishing & Hunting (100.0%), Arts, Entertainment & Recreation (100.0%), and Health Care & Social Assistance (39.1%), whereas the industries that tend to have a higher number of women are Educational Services (100.0%), Public Administration (66.7%), and Retail Trade (63.6%).
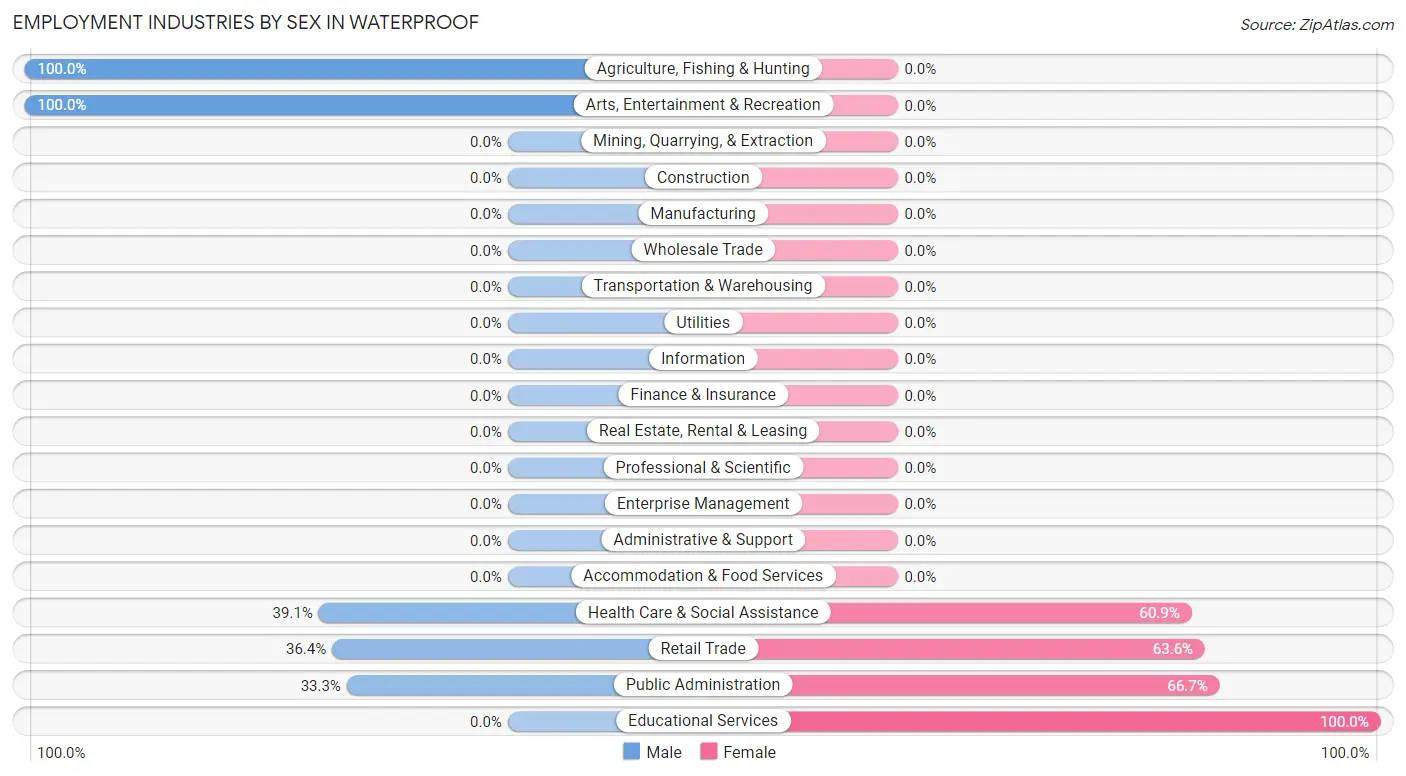
| Industry | Male | Female |
| Agriculture, Fishing & Hunting | 28 (100.0%) | 0 (0.0%) |
| Mining, Quarrying, & Extraction | 0 (0.0%) | 0 (0.0%) |
| Construction | 0 (0.0%) | 0 (0.0%) |
| Manufacturing | 0 (0.0%) | 0 (0.0%) |
| Wholesale Trade | 0 (0.0%) | 0 (0.0%) |
| Retail Trade | 8 (36.4%) | 14 (63.6%) |
| Transportation & Warehousing | 0 (0.0%) | 0 (0.0%) |
| Utilities | 0 (0.0%) | 0 (0.0%) |
| Information | 0 (0.0%) | 0 (0.0%) |
| Finance & Insurance | 0 (0.0%) | 0 (0.0%) |
| Real Estate, Rental & Leasing | 0 (0.0%) | 0 (0.0%) |
| Professional & Scientific | 0 (0.0%) | 0 (0.0%) |
| Enterprise Management | 0 (0.0%) | 0 (0.0%) |
| Administrative & Support | 0 (0.0%) | 0 (0.0%) |
| Educational Services | 0 (0.0%) | 15 (100.0%) |
| Health Care & Social Assistance | 9 (39.1%) | 14 (60.9%) |
| Arts, Entertainment & Recreation | 1 (100.0%) | 0 (0.0%) |
| Accommodation & Food Services | 0 (0.0%) | 0 (0.0%) |
| Public Administration | 3 (33.3%) | 6 (66.7%) |
| Total | 49 (46.7%) | 56 (53.3%) |
Education in Waterproof
School Enrollment in Waterproof
The most common levels of schooling among the 261 students in Waterproof are high school (98 | 37.6%), middle school (71 | 27.2%), and nursery / preschool (61 | 23.4%).
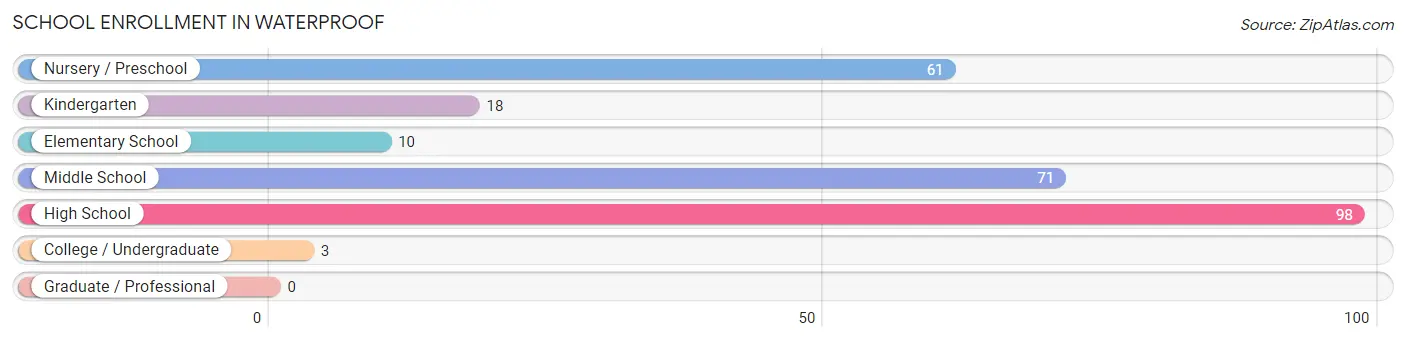
| School Level | # Students | % Students |
| Nursery / Preschool | 61 | 23.4% |
| Kindergarten | 18 | 6.9% |
| Elementary School | 10 | 3.8% |
| Middle School | 71 | 27.2% |
| High School | 98 | 37.6% |
| College / Undergraduate | 3 | 1.1% |
| Graduate / Professional | 0 | 0.0% |
| Total | 261 | 100.0% |
School Enrollment by Age by Funding Source in Waterproof
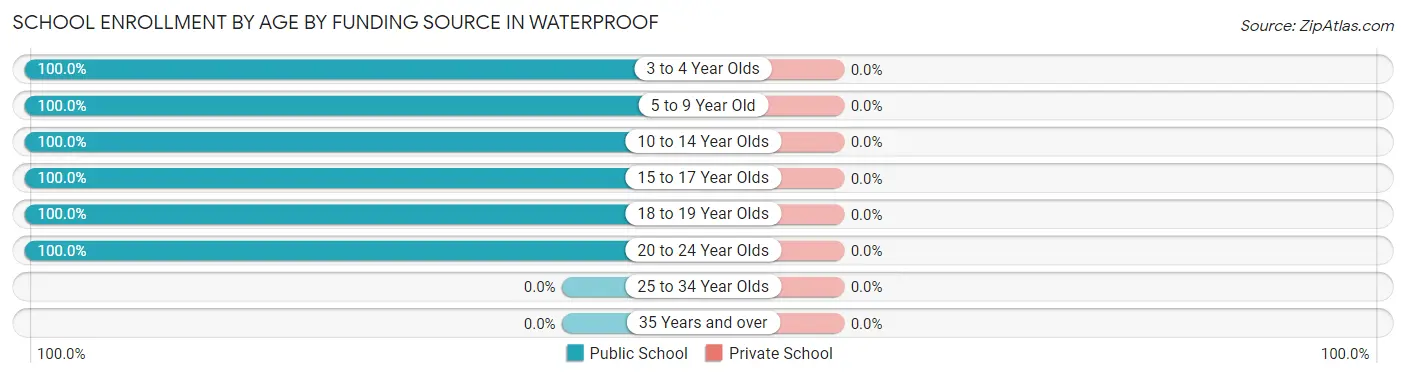
| Age Bracket | Public School | Private School |
| 3 to 4 Year Olds | 58 (100.0%) | 0 (0.0%) |
| 5 to 9 Year Old | 31 (100.0%) | 0 (0.0%) |
| 10 to 14 Year Olds | 19 (100.0%) | 0 (0.0%) |
| 15 to 17 Year Olds | 72 (100.0%) | 0 (0.0%) |
| 18 to 19 Year Olds | 80 (100.0%) | 0 (0.0%) |
| 20 to 24 Year Olds | 1 (100.0%) | 0 (0.0%) |
| 25 to 34 Year Olds | 0 (0.0%) | 0 (0.0%) |
| 35 Years and over | 0 (0.0%) | 0 (0.0%) |
| Total | 261 (100.0%) | 0 (0.0%) |
Educational Attainment by Field of Study in Waterproof
Arts & humanities (55 | 85.9%), psychology (5 | 7.8%), education (2 | 3.1%), computers & mathematics (1 | 1.6%), and communications (1 | 1.6%) are the most common fields of study among 64 individuals in Waterproof who have obtained a bachelor's degree or higher.
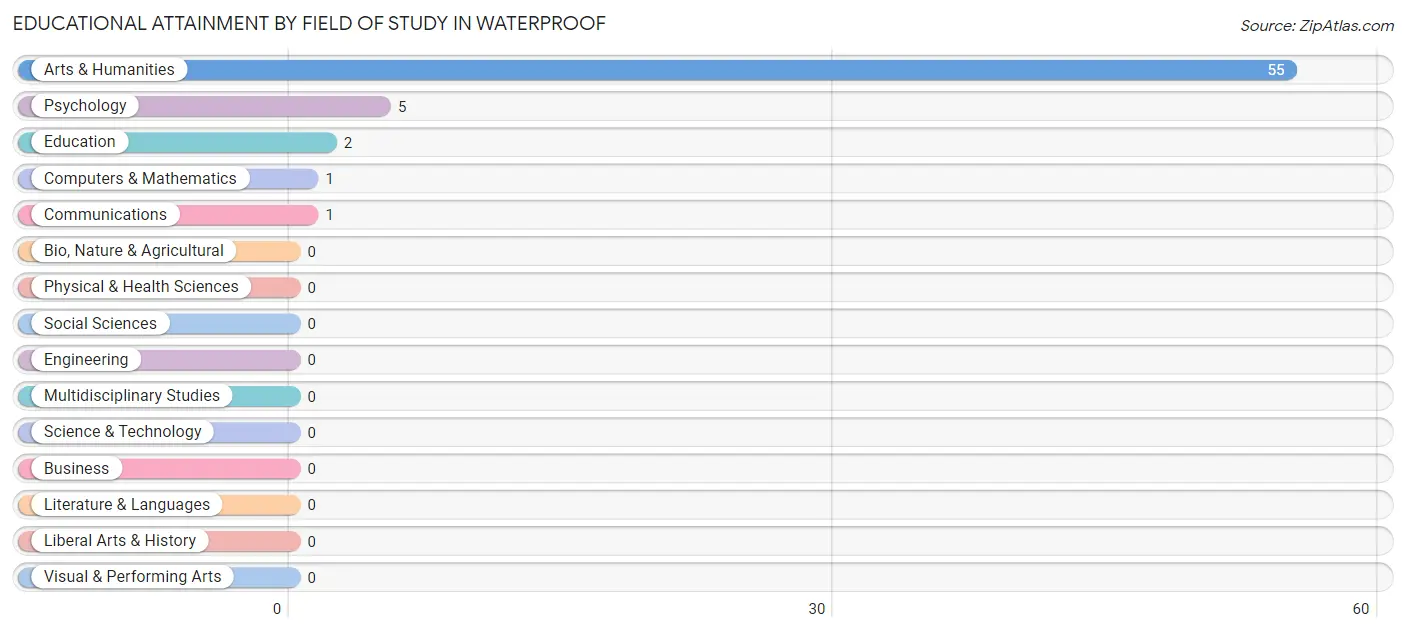
| Field of Study | # Graduates | % Graduates |
| Computers & Mathematics | 1 | 1.6% |
| Bio, Nature & Agricultural | 0 | 0.0% |
| Physical & Health Sciences | 0 | 0.0% |
| Psychology | 5 | 7.8% |
| Social Sciences | 0 | 0.0% |
| Engineering | 0 | 0.0% |
| Multidisciplinary Studies | 0 | 0.0% |
| Science & Technology | 0 | 0.0% |
| Business | 0 | 0.0% |
| Education | 2 | 3.1% |
| Literature & Languages | 0 | 0.0% |
| Liberal Arts & History | 0 | 0.0% |
| Visual & Performing Arts | 0 | 0.0% |
| Communications | 1 | 1.6% |
| Arts & Humanities | 55 | 85.9% |
| Total | 64 | 100.0% |
Transportation & Commute in Waterproof
Vehicle Availability by Sex in Waterproof
The most prevalent vehicle ownership categories in Waterproof are males with 1 vehicle (18, accounting for 37.5%) and females with 1 vehicle (34, making up 32.7%).
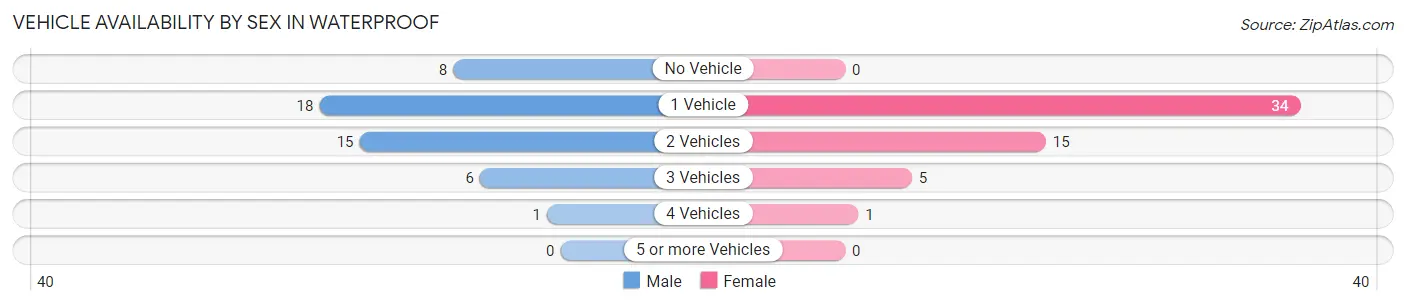
| Vehicles Available | Male | Female |
| No Vehicle | 8 (16.7%) | 0 (0.0%) |
| 1 Vehicle | 18 (37.5%) | 34 (61.8%) |
| 2 Vehicles | 15 (31.2%) | 15 (27.3%) |
| 3 Vehicles | 6 (12.5%) | 5 (9.1%) |
| 4 Vehicles | 1 (2.1%) | 1 (1.8%) |
| 5 or more Vehicles | 0 (0.0%) | 0 (0.0%) |
| Total | 48 (100.0%) | 55 (100.0%) |
Commute Time in Waterproof
The most frequently occuring commute durations in Waterproof are 30 to 34 minutes (28 commuters, 27.5%), 45 to 59 minutes (17 commuters, 16.7%), and 20 to 24 minutes (16 commuters, 15.7%).
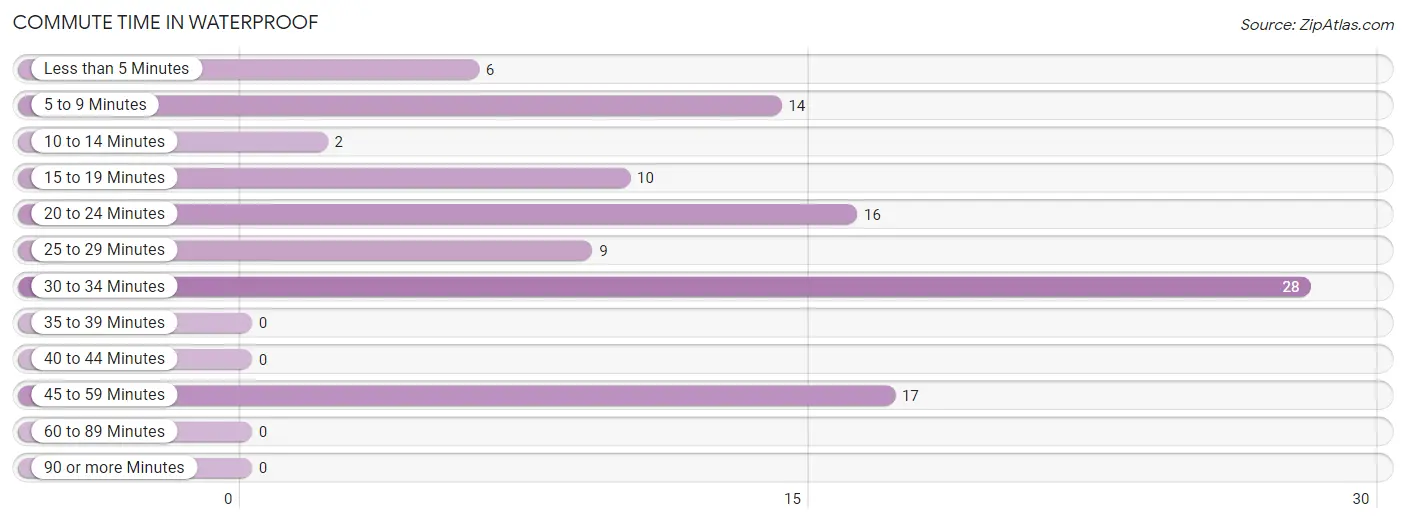
| Commute Time | # Commuters | % Commuters |
| Less than 5 Minutes | 6 | 5.9% |
| 5 to 9 Minutes | 14 | 13.7% |
| 10 to 14 Minutes | 2 | 2.0% |
| 15 to 19 Minutes | 10 | 9.8% |
| 20 to 24 Minutes | 16 | 15.7% |
| 25 to 29 Minutes | 9 | 8.8% |
| 30 to 34 Minutes | 28 | 27.5% |
| 35 to 39 Minutes | 0 | 0.0% |
| 40 to 44 Minutes | 0 | 0.0% |
| 45 to 59 Minutes | 17 | 16.7% |
| 60 to 89 Minutes | 0 | 0.0% |
| 90 or more Minutes | 0 | 0.0% |
Commute Time by Sex in Waterproof
The most common commute times in Waterproof are 20 to 24 minutes (16 commuters, 33.3%) for males and 30 to 34 minutes (24 commuters, 44.4%) for females.
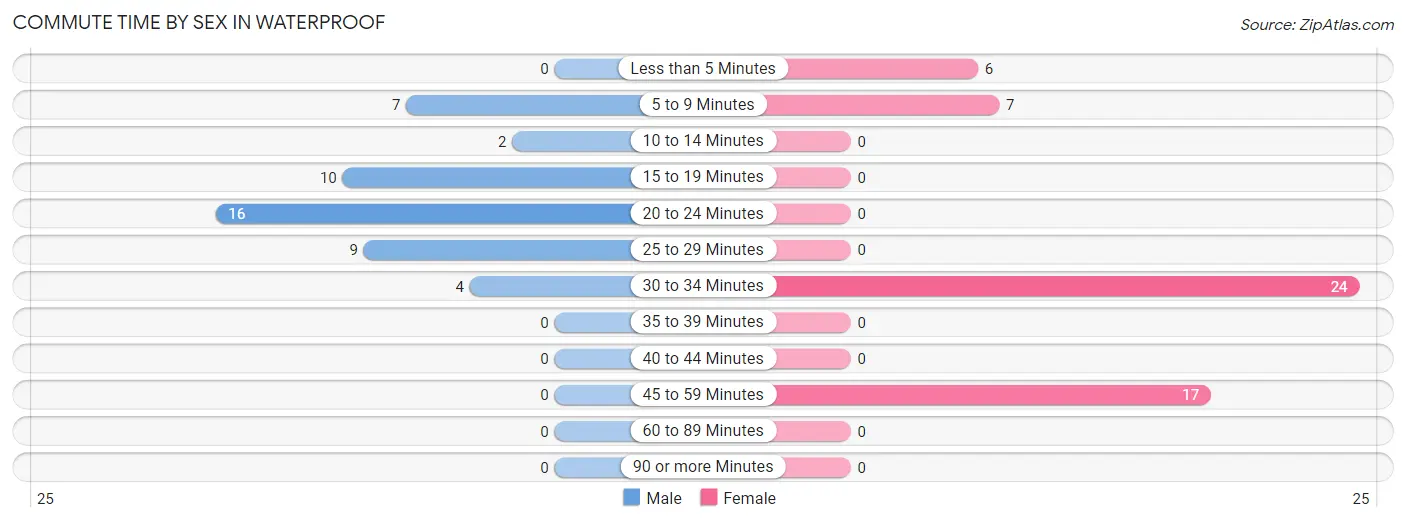
| Commute Time | Male | Female |
| Less than 5 Minutes | 0 (0.0%) | 6 (11.1%) |
| 5 to 9 Minutes | 7 (14.6%) | 7 (13.0%) |
| 10 to 14 Minutes | 2 (4.2%) | 0 (0.0%) |
| 15 to 19 Minutes | 10 (20.8%) | 0 (0.0%) |
| 20 to 24 Minutes | 16 (33.3%) | 0 (0.0%) |
| 25 to 29 Minutes | 9 (18.8%) | 0 (0.0%) |
| 30 to 34 Minutes | 4 (8.3%) | 24 (44.4%) |
| 35 to 39 Minutes | 0 (0.0%) | 0 (0.0%) |
| 40 to 44 Minutes | 0 (0.0%) | 0 (0.0%) |
| 45 to 59 Minutes | 0 (0.0%) | 17 (31.5%) |
| 60 to 89 Minutes | 0 (0.0%) | 0 (0.0%) |
| 90 or more Minutes | 0 (0.0%) | 0 (0.0%) |
Time of Departure to Work by Sex in Waterproof
The most frequent times of departure to work in Waterproof are 7:00 AM to 7:29 AM (13, 27.1%) for males and 7:00 AM to 7:29 AM (16, 29.6%) for females.
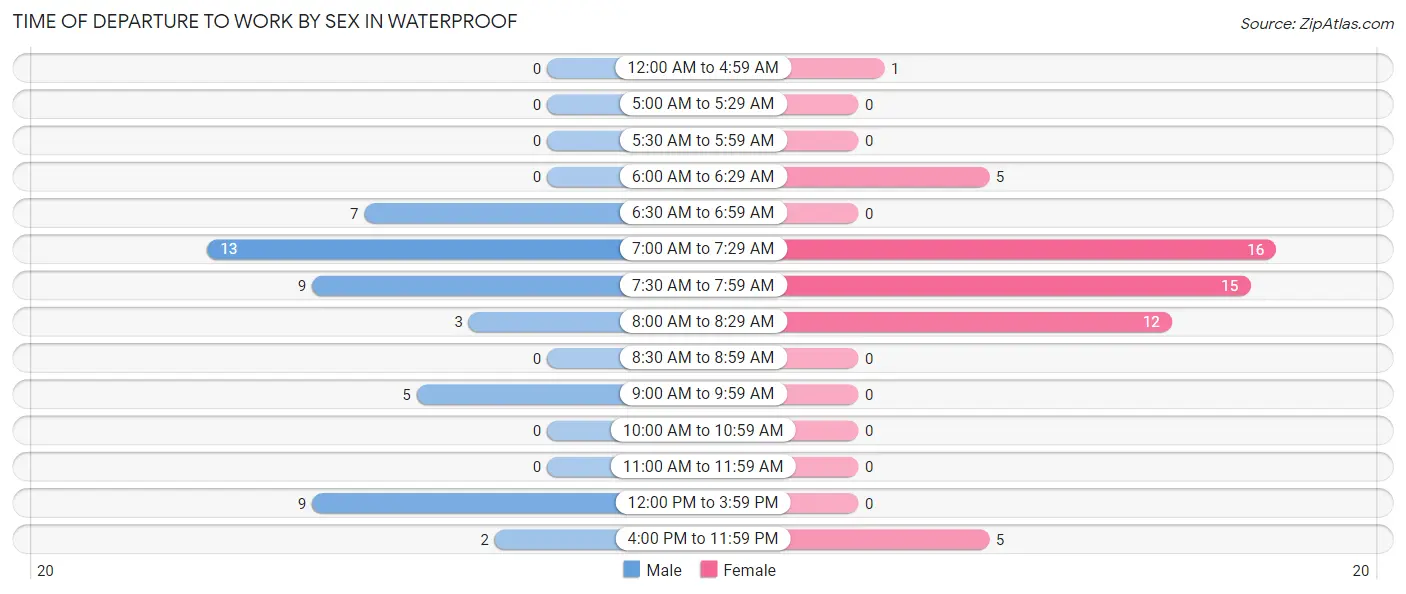
| Time of Departure | Male | Female |
| 12:00 AM to 4:59 AM | 0 (0.0%) | 1 (1.8%) |
| 5:00 AM to 5:29 AM | 0 (0.0%) | 0 (0.0%) |
| 5:30 AM to 5:59 AM | 0 (0.0%) | 0 (0.0%) |
| 6:00 AM to 6:29 AM | 0 (0.0%) | 5 (9.3%) |
| 6:30 AM to 6:59 AM | 7 (14.6%) | 0 (0.0%) |
| 7:00 AM to 7:29 AM | 13 (27.1%) | 16 (29.6%) |
| 7:30 AM to 7:59 AM | 9 (18.8%) | 15 (27.8%) |
| 8:00 AM to 8:29 AM | 3 (6.2%) | 12 (22.2%) |
| 8:30 AM to 8:59 AM | 0 (0.0%) | 0 (0.0%) |
| 9:00 AM to 9:59 AM | 5 (10.4%) | 0 (0.0%) |
| 10:00 AM to 10:59 AM | 0 (0.0%) | 0 (0.0%) |
| 11:00 AM to 11:59 AM | 0 (0.0%) | 0 (0.0%) |
| 12:00 PM to 3:59 PM | 9 (18.8%) | 0 (0.0%) |
| 4:00 PM to 11:59 PM | 2 (4.2%) | 5 (9.3%) |
| Total | 48 (100.0%) | 54 (100.0%) |
Housing Occupancy in Waterproof
Occupancy by Ownership in Waterproof
Of the total 191 dwellings in Waterproof, owner-occupied units account for 121 (63.3%), while renter-occupied units make up 70 (36.6%).
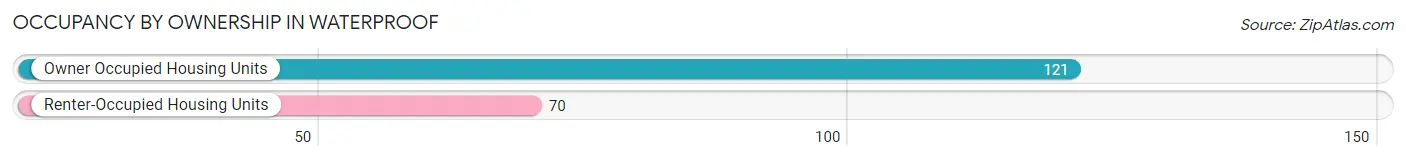
| Occupancy | # Housing Units | % Housing Units |
| Owner Occupied Housing Units | 121 | 63.3% |
| Renter-Occupied Housing Units | 70 | 36.6% |
| Total Occupied Housing Units | 191 | 100.0% |
Occupancy by Household Size in Waterproof
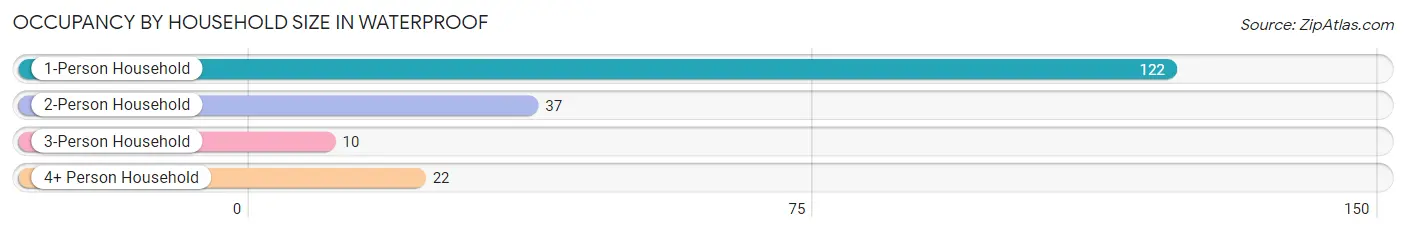
| Household Size | # Housing Units | % Housing Units |
| 1-Person Household | 122 | 63.9% |
| 2-Person Household | 37 | 19.4% |
| 3-Person Household | 10 | 5.2% |
| 4+ Person Household | 22 | 11.5% |
| Total Housing Units | 191 | 100.0% |
Occupancy by Ownership by Household Size in Waterproof
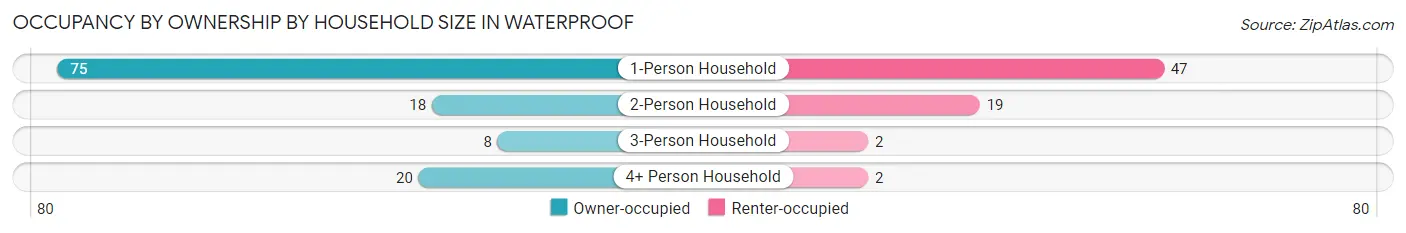
| Household Size | Owner-occupied | Renter-occupied |
| 1-Person Household | 75 (61.5%) | 47 (38.5%) |
| 2-Person Household | 18 (48.6%) | 19 (51.3%) |
| 3-Person Household | 8 (80.0%) | 2 (20.0%) |
| 4+ Person Household | 20 (90.9%) | 2 (9.1%) |
| Total Housing Units | 121 (63.3%) | 70 (36.6%) |
Occupancy by Educational Attainment in Waterproof
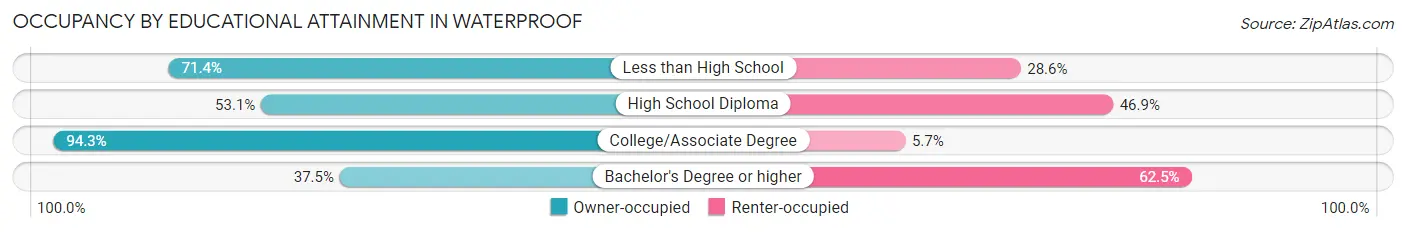
| Household Size | Owner-occupied | Renter-occupied |
| Less than High School | 25 (71.4%) | 10 (28.6%) |
| High School Diploma | 60 (53.1%) | 53 (46.9%) |
| College/Associate Degree | 33 (94.3%) | 2 (5.7%) |
| Bachelor's Degree or higher | 3 (37.5%) | 5 (62.5%) |
Occupancy by Age of Householder in Waterproof
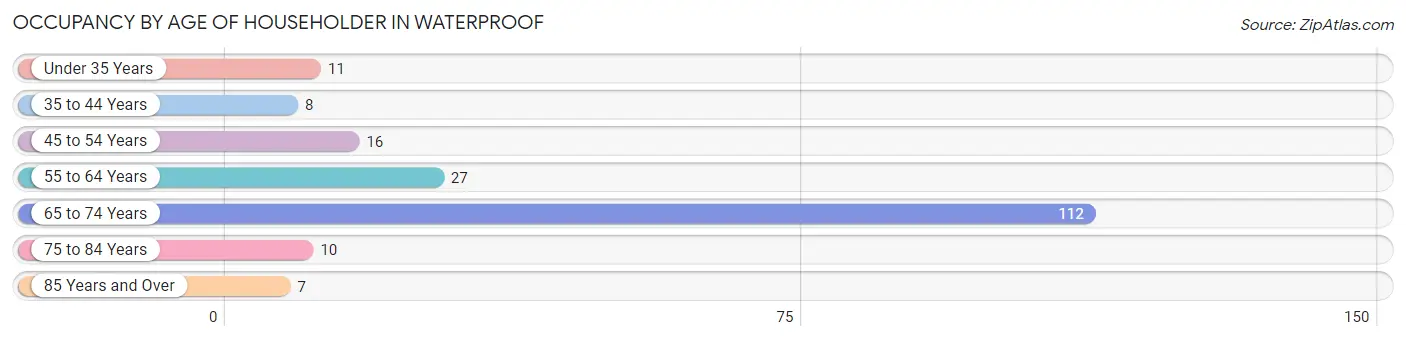
| Age Bracket | # Households | % Households |
| Under 35 Years | 11 | 5.8% |
| 35 to 44 Years | 8 | 4.2% |
| 45 to 54 Years | 16 | 8.4% |
| 55 to 64 Years | 27 | 14.1% |
| 65 to 74 Years | 112 | 58.6% |
| 75 to 84 Years | 10 | 5.2% |
| 85 Years and Over | 7 | 3.7% |
| Total | 191 | 100.0% |
Housing Finances in Waterproof
Median Income by Occupancy in Waterproof
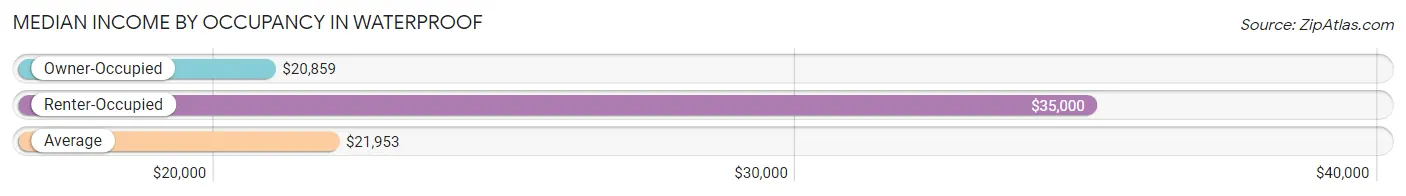
| Occupancy Type | # Households | Median Income |
| Owner-Occupied | 121 (63.3%) | $20,859 |
| Renter-Occupied | 70 (36.6%) | $35,000 |
| Average | 191 (100.0%) | $21,953 |
Occupancy by Householder Income Bracket in Waterproof
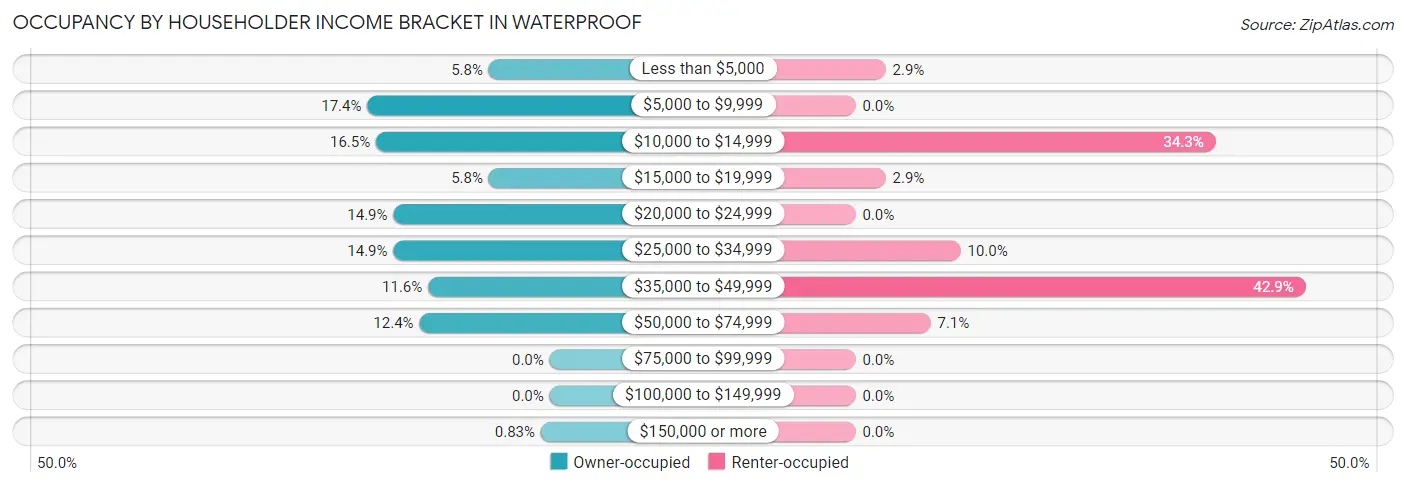
| Income Bracket | Owner-occupied | Renter-occupied |
| Less than $5,000 | 7 (5.8%) | 2 (2.9%) |
| $5,000 to $9,999 | 21 (17.4%) | 0 (0.0%) |
| $10,000 to $14,999 | 20 (16.5%) | 24 (34.3%) |
| $15,000 to $19,999 | 7 (5.8%) | 2 (2.9%) |
| $20,000 to $24,999 | 18 (14.9%) | 0 (0.0%) |
| $25,000 to $34,999 | 18 (14.9%) | 7 (10.0%) |
| $35,000 to $49,999 | 14 (11.6%) | 30 (42.9%) |
| $50,000 to $74,999 | 15 (12.4%) | 5 (7.1%) |
| $75,000 to $99,999 | 0 (0.0%) | 0 (0.0%) |
| $100,000 to $149,999 | 0 (0.0%) | 0 (0.0%) |
| $150,000 or more | 1 (0.8%) | 0 (0.0%) |
| Total | 121 (100.0%) | 70 (100.0%) |
Monthly Housing Cost Tiers in Waterproof
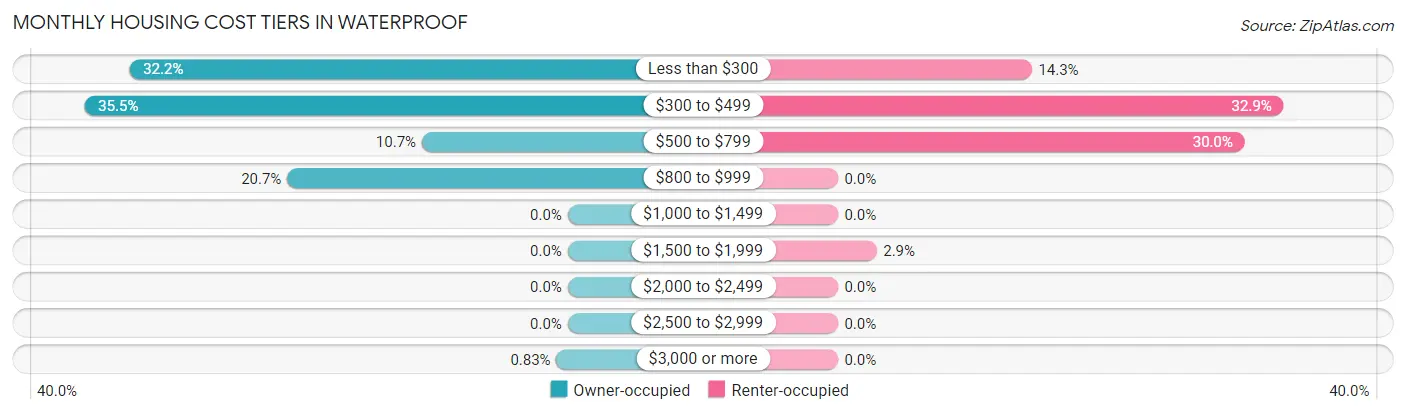
| Monthly Cost | Owner-occupied | Renter-occupied |
| Less than $300 | 39 (32.2%) | 10 (14.3%) |
| $300 to $499 | 43 (35.5%) | 23 (32.9%) |
| $500 to $799 | 13 (10.7%) | 21 (30.0%) |
| $800 to $999 | 25 (20.7%) | 0 (0.0%) |
| $1,000 to $1,499 | 0 (0.0%) | 0 (0.0%) |
| $1,500 to $1,999 | 0 (0.0%) | 2 (2.9%) |
| $2,000 to $2,499 | 0 (0.0%) | 0 (0.0%) |
| $2,500 to $2,999 | 0 (0.0%) | 0 (0.0%) |
| $3,000 or more | 1 (0.8%) | 0 (0.0%) |
| Total | 121 (100.0%) | 70 (100.0%) |
Physical Housing Characteristics in Waterproof
Housing Structures in Waterproof
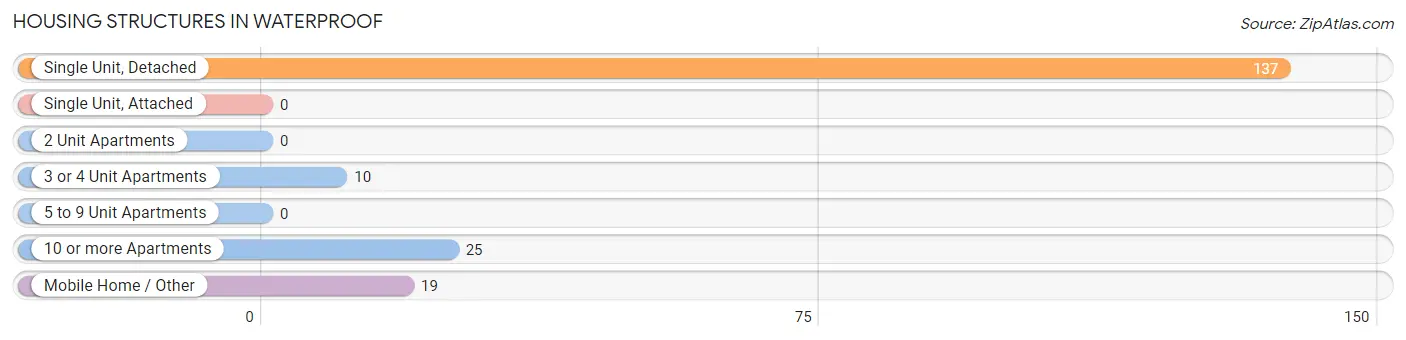
| Structure Type | # Housing Units | % Housing Units |
| Single Unit, Detached | 137 | 71.7% |
| Single Unit, Attached | 0 | 0.0% |
| 2 Unit Apartments | 0 | 0.0% |
| 3 or 4 Unit Apartments | 10 | 5.2% |
| 5 to 9 Unit Apartments | 0 | 0.0% |
| 10 or more Apartments | 25 | 13.1% |
| Mobile Home / Other | 19 | 10.0% |
| Total | 191 | 100.0% |
Housing Structures by Occupancy in Waterproof
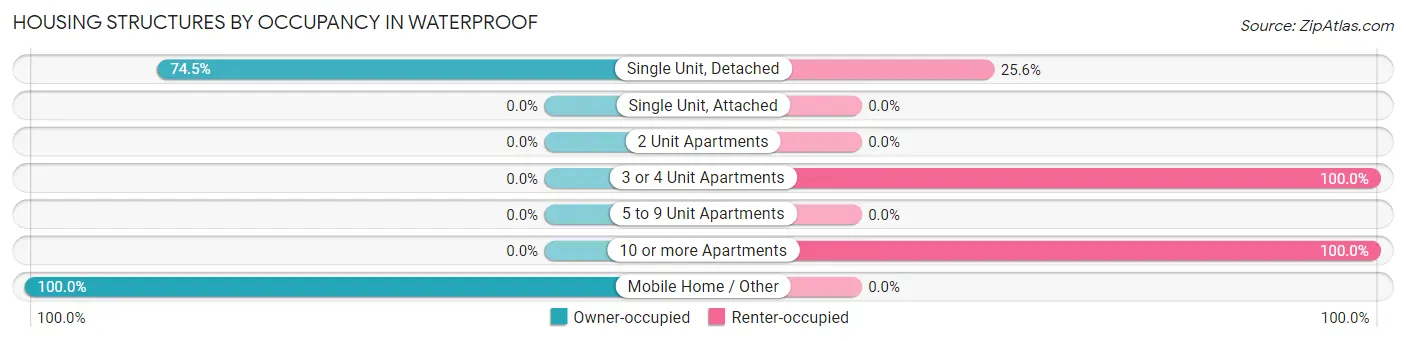
| Structure Type | Owner-occupied | Renter-occupied |
| Single Unit, Detached | 102 (74.5%) | 35 (25.6%) |
| Single Unit, Attached | 0 (0.0%) | 0 (0.0%) |
| 2 Unit Apartments | 0 (0.0%) | 0 (0.0%) |
| 3 or 4 Unit Apartments | 0 (0.0%) | 10 (100.0%) |
| 5 to 9 Unit Apartments | 0 (0.0%) | 0 (0.0%) |
| 10 or more Apartments | 0 (0.0%) | 25 (100.0%) |
| Mobile Home / Other | 19 (100.0%) | 0 (0.0%) |
| Total | 121 (63.3%) | 70 (36.6%) |
Housing Structures by Number of Rooms in Waterproof
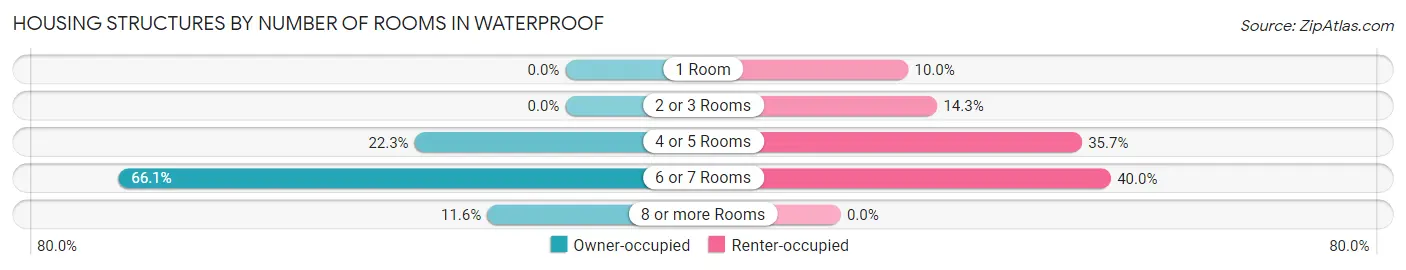
| Number of Rooms | Owner-occupied | Renter-occupied |
| 1 Room | 0 (0.0%) | 7 (10.0%) |
| 2 or 3 Rooms | 0 (0.0%) | 10 (14.3%) |
| 4 or 5 Rooms | 27 (22.3%) | 25 (35.7%) |
| 6 or 7 Rooms | 80 (66.1%) | 28 (40.0%) |
| 8 or more Rooms | 14 (11.6%) | 0 (0.0%) |
| Total | 121 (100.0%) | 70 (100.0%) |
Housing Structure by Heating Type in Waterproof
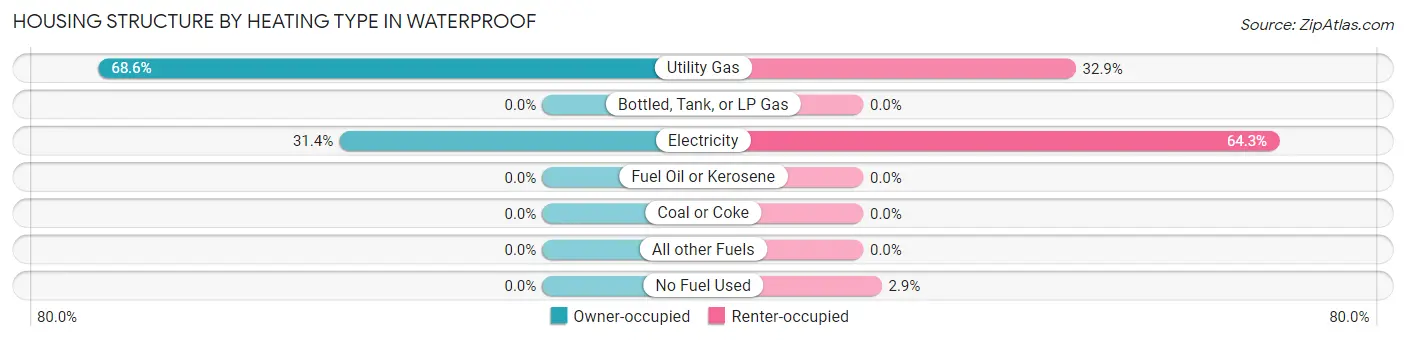
| Heating Type | Owner-occupied | Renter-occupied |
| Utility Gas | 83 (68.6%) | 23 (32.9%) |
| Bottled, Tank, or LP Gas | 0 (0.0%) | 0 (0.0%) |
| Electricity | 38 (31.4%) | 45 (64.3%) |
| Fuel Oil or Kerosene | 0 (0.0%) | 0 (0.0%) |
| Coal or Coke | 0 (0.0%) | 0 (0.0%) |
| All other Fuels | 0 (0.0%) | 0 (0.0%) |
| No Fuel Used | 0 (0.0%) | 2 (2.9%) |
| Total | 121 (100.0%) | 70 (100.0%) |
Household Vehicle Usage in Waterproof
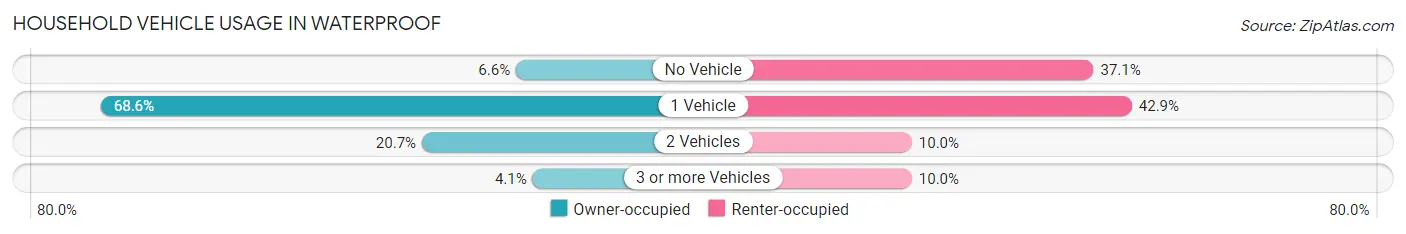
| Vehicles per Household | Owner-occupied | Renter-occupied |
| No Vehicle | 8 (6.6%) | 26 (37.1%) |
| 1 Vehicle | 83 (68.6%) | 30 (42.9%) |
| 2 Vehicles | 25 (20.7%) | 7 (10.0%) |
| 3 or more Vehicles | 5 (4.1%) | 7 (10.0%) |
| Total | 121 (100.0%) | 70 (100.0%) |
Real Estate & Mortgages in Waterproof
Real Estate and Mortgage Overview in Waterproof
| Characteristic | Without Mortgage | With Mortgage |
| Housing Units | 94 | 27 |
| Median Property Value | - | - |
| Median Household Income | - | - |
| Monthly Housing Costs | $319 | $1 |
| Real Estate Taxes | $199 | $16 |
Property Value by Mortgage Status in Waterproof
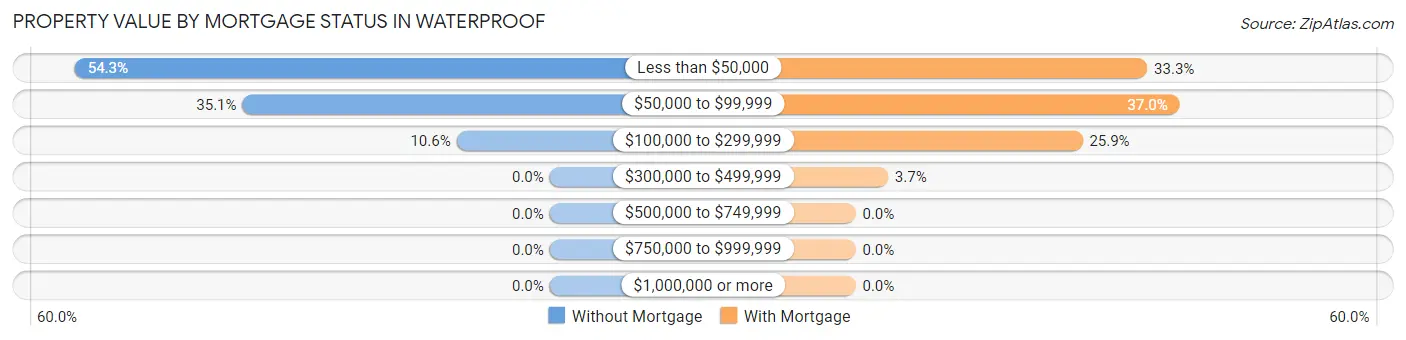
| Property Value | Without Mortgage | With Mortgage |
| Less than $50,000 | 51 (54.3%) | 9 (33.3%) |
| $50,000 to $99,999 | 33 (35.1%) | 10 (37.0%) |
| $100,000 to $299,999 | 10 (10.6%) | 7 (25.9%) |
| $300,000 to $499,999 | 0 (0.0%) | 1 (3.7%) |
| $500,000 to $749,999 | 0 (0.0%) | 0 (0.0%) |
| $750,000 to $999,999 | 0 (0.0%) | 0 (0.0%) |
| $1,000,000 or more | 0 (0.0%) | 0 (0.0%) |
| Total | 94 (100.0%) | 27 (100.0%) |
Household Income by Mortgage Status in Waterproof
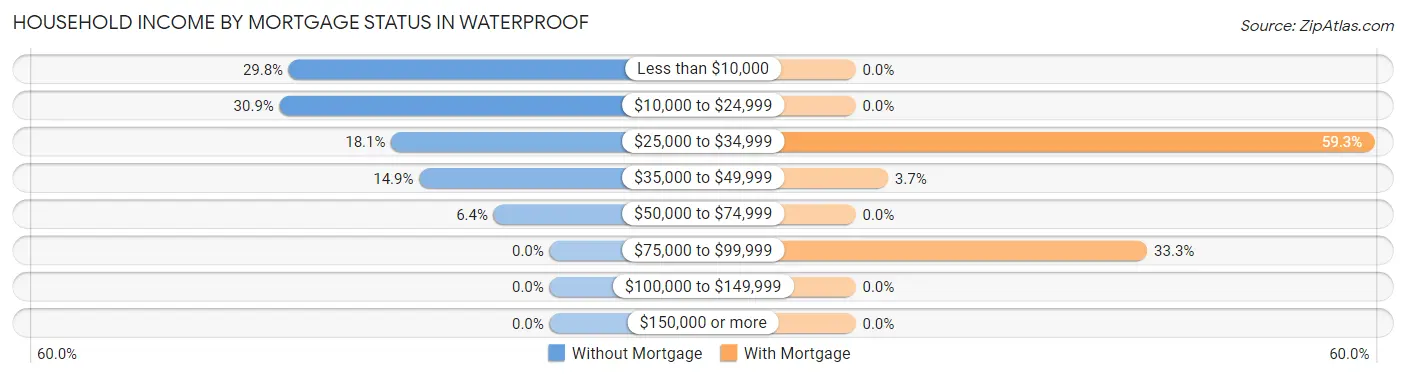
| Household Income | Without Mortgage | With Mortgage |
| Less than $10,000 | 28 (29.8%) | 0 (0.0%) |
| $10,000 to $24,999 | 29 (30.8%) | 0 (0.0%) |
| $25,000 to $34,999 | 17 (18.1%) | 16 (59.3%) |
| $35,000 to $49,999 | 14 (14.9%) | 1 (3.7%) |
| $50,000 to $74,999 | 6 (6.4%) | 0 (0.0%) |
| $75,000 to $99,999 | 0 (0.0%) | 9 (33.3%) |
| $100,000 to $149,999 | 0 (0.0%) | 0 (0.0%) |
| $150,000 or more | 0 (0.0%) | 0 (0.0%) |
| Total | 94 (100.0%) | 27 (100.0%) |
Property Value to Household Income Ratio in Waterproof
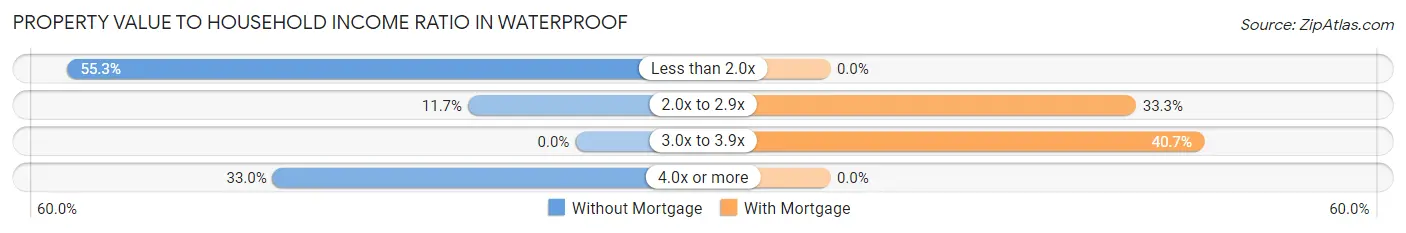
| Value-to-Income Ratio | Without Mortgage | With Mortgage |
| Less than 2.0x | 52 (55.3%) | 0 (0.0%) |
| 2.0x to 2.9x | 11 (11.7%) | 9 (33.3%) |
| 3.0x to 3.9x | 0 (0.0%) | 11 (40.7%) |
| 4.0x or more | 31 (33.0%) | 0 (0.0%) |
| Total | 94 (100.0%) | 27 (100.0%) |
Real Estate Taxes by Mortgage Status in Waterproof
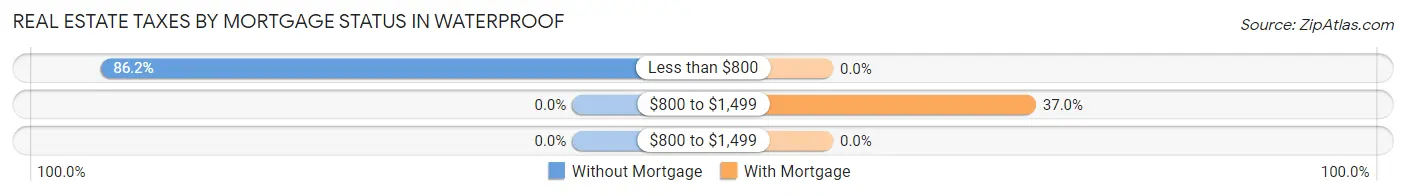
| Property Taxes | Without Mortgage | With Mortgage |
| Less than $800 | 81 (86.2%) | 0 (0.0%) |
| $800 to $1,499 | 0 (0.0%) | 10 (37.0%) |
| $800 to $1,499 | 0 (0.0%) | 0 (0.0%) |
| Total | 94 (100.0%) | 27 (100.0%) |
Health & Disability in Waterproof
Health Insurance Coverage by Age in Waterproof
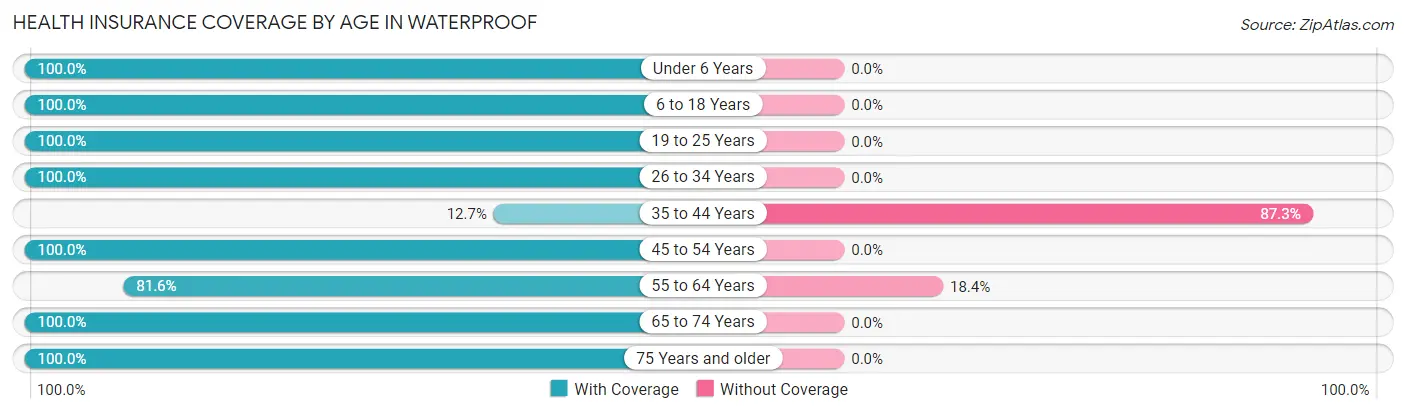
| Age Bracket | With Coverage | Without Coverage |
| Under 6 Years | 87 (100.0%) | 0 (0.0%) |
| 6 to 18 Years | 191 (100.0%) | 0 (0.0%) |
| 19 to 25 Years | 12 (100.0%) | 0 (0.0%) |
| 26 to 34 Years | 9 (100.0%) | 0 (0.0%) |
| 35 to 44 Years | 8 (12.7%) | 55 (87.3%) |
| 45 to 54 Years | 50 (100.0%) | 0 (0.0%) |
| 55 to 64 Years | 31 (81.6%) | 7 (18.4%) |
| 65 to 74 Years | 113 (100.0%) | 0 (0.0%) |
| 75 Years and older | 41 (100.0%) | 0 (0.0%) |
| Total | 542 (89.7%) | 62 (10.3%) |
Health Insurance Coverage by Citizenship Status in Waterproof
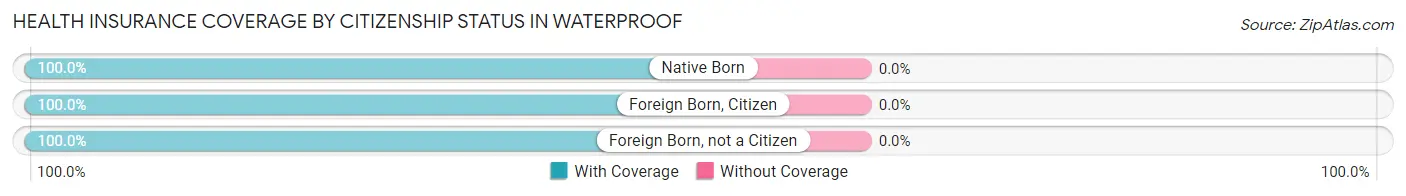
| Citizenship Status | With Coverage | Without Coverage |
| Native Born | 87 (100.0%) | 0 (0.0%) |
| Foreign Born, Citizen | 191 (100.0%) | 0 (0.0%) |
| Foreign Born, not a Citizen | 12 (100.0%) | 0 (0.0%) |
Health Insurance Coverage by Household Income in Waterproof
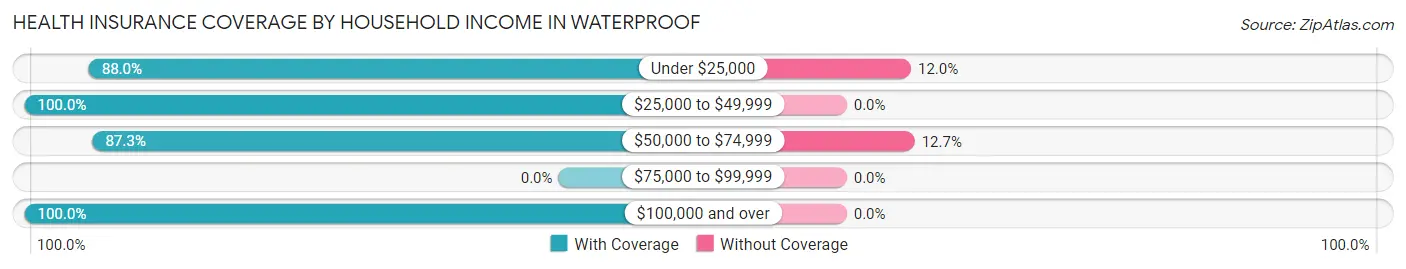
| Household Income | With Coverage | Without Coverage |
| Under $25,000 | 402 (88.0%) | 55 (12.0%) |
| $25,000 to $49,999 | 88 (100.0%) | 0 (0.0%) |
| $50,000 to $74,999 | 48 (87.3%) | 7 (12.7%) |
| $75,000 to $99,999 | 0 (0.0%) | 0 (0.0%) |
| $100,000 and over | 4 (100.0%) | 0 (0.0%) |
Public vs Private Health Insurance Coverage by Age in Waterproof
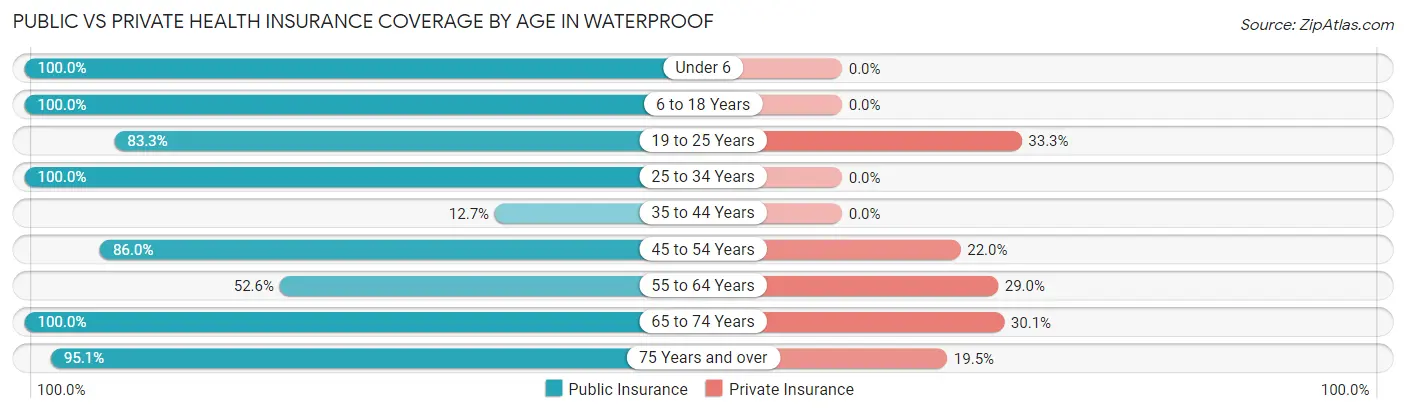
| Age Bracket | Public Insurance | Private Insurance |
| Under 6 | 87 (100.0%) | 0 (0.0%) |
| 6 to 18 Years | 191 (100.0%) | 0 (0.0%) |
| 19 to 25 Years | 10 (83.3%) | 4 (33.3%) |
| 25 to 34 Years | 9 (100.0%) | 0 (0.0%) |
| 35 to 44 Years | 8 (12.7%) | 0 (0.0%) |
| 45 to 54 Years | 43 (86.0%) | 11 (22.0%) |
| 55 to 64 Years | 20 (52.6%) | 11 (28.9%) |
| 65 to 74 Years | 113 (100.0%) | 34 (30.1%) |
| 75 Years and over | 39 (95.1%) | 8 (19.5%) |
| Total | 520 (86.1%) | 68 (11.3%) |
Disability Status by Sex by Age in Waterproof
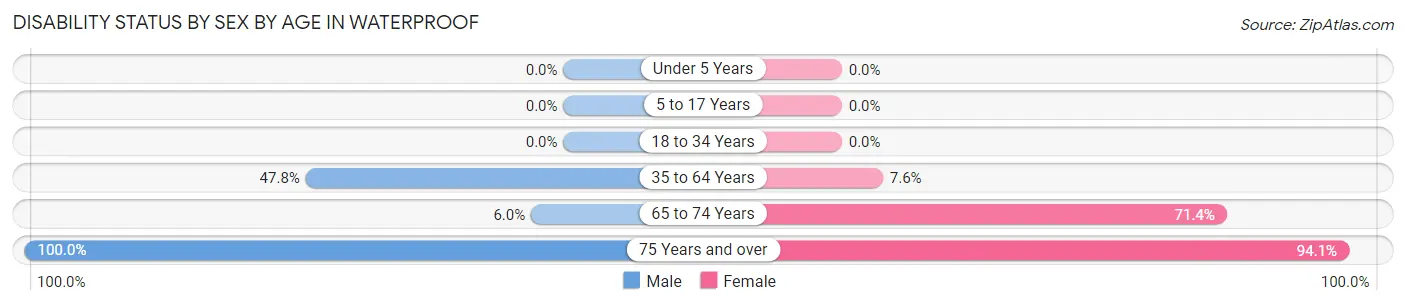
| Age Bracket | Male | Female |
| Under 5 Years | 0 (0.0%) | 0 (0.0%) |
| 5 to 17 Years | 0 (0.0%) | 0 (0.0%) |
| 18 to 34 Years | 0 (0.0%) | 0 (0.0%) |
| 35 to 64 Years | 22 (47.8%) | 8 (7.6%) |
| 65 to 74 Years | 3 (6.0%) | 45 (71.4%) |
| 75 Years and over | 24 (100.0%) | 16 (94.1%) |
Disability Class by Sex by Age in Waterproof
Disability Class: Hearing Difficulty
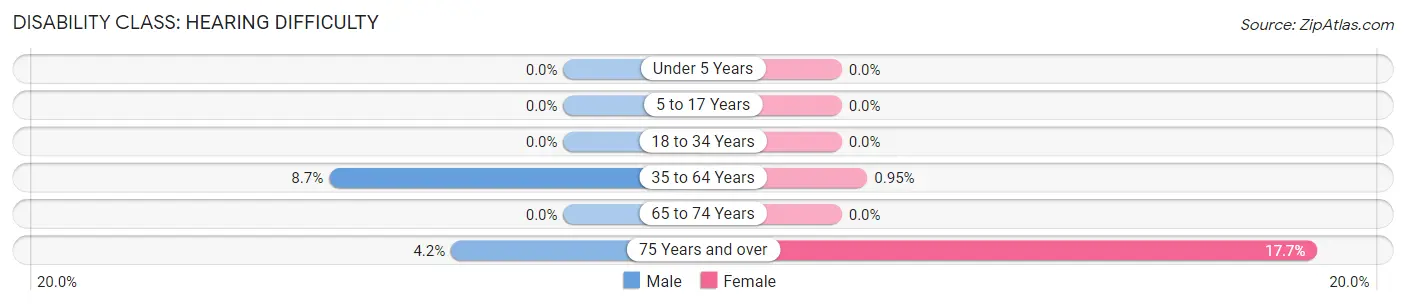
| Age Bracket | Male | Female |
| Under 5 Years | 0 (0.0%) | 0 (0.0%) |
| 5 to 17 Years | 0 (0.0%) | 0 (0.0%) |
| 18 to 34 Years | 0 (0.0%) | 0 (0.0%) |
| 35 to 64 Years | 4 (8.7%) | 1 (0.9%) |
| 65 to 74 Years | 0 (0.0%) | 0 (0.0%) |
| 75 Years and over | 1 (4.2%) | 3 (17.6%) |
Disability Class: Vision Difficulty
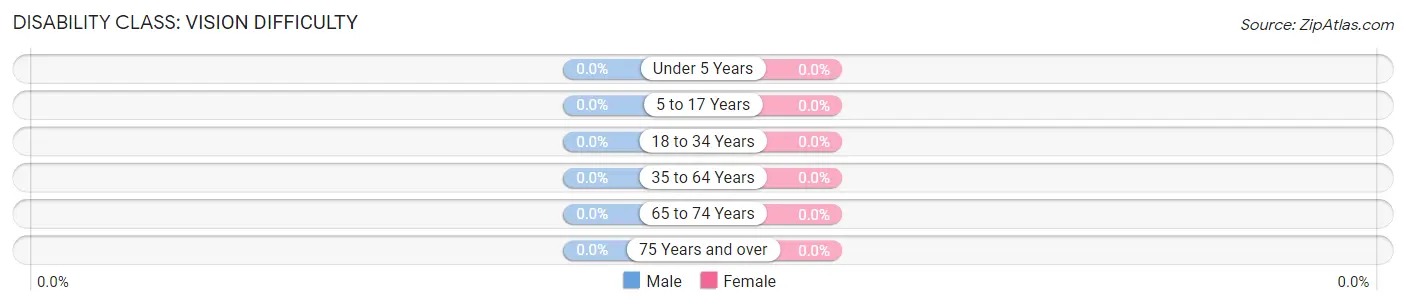
| Age Bracket | Male | Female |
| Under 5 Years | 0 (0.0%) | 0 (0.0%) |
| 5 to 17 Years | 0 (0.0%) | 0 (0.0%) |
| 18 to 34 Years | 0 (0.0%) | 0 (0.0%) |
| 35 to 64 Years | 0 (0.0%) | 0 (0.0%) |
| 65 to 74 Years | 0 (0.0%) | 0 (0.0%) |
| 75 Years and over | 0 (0.0%) | 0 (0.0%) |
Disability Class: Cognitive Difficulty
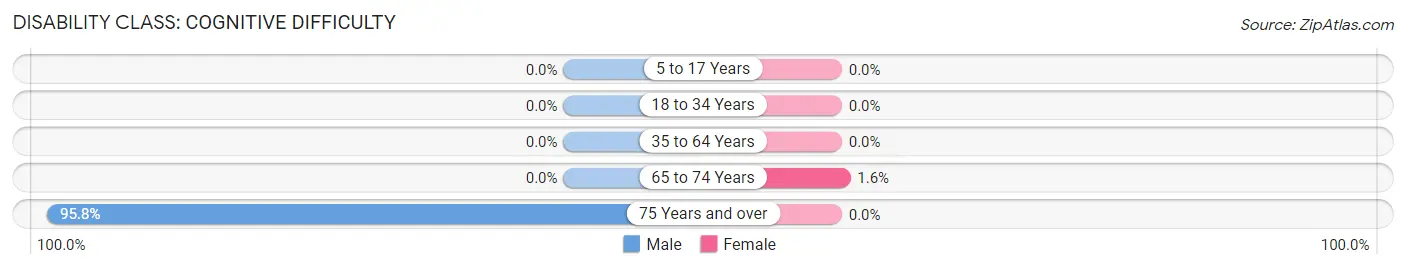
| Age Bracket | Male | Female |
| 5 to 17 Years | 0 (0.0%) | 0 (0.0%) |
| 18 to 34 Years | 0 (0.0%) | 0 (0.0%) |
| 35 to 64 Years | 0 (0.0%) | 0 (0.0%) |
| 65 to 74 Years | 0 (0.0%) | 1 (1.6%) |
| 75 Years and over | 23 (95.8%) | 0 (0.0%) |
Disability Class: Ambulatory Difficulty
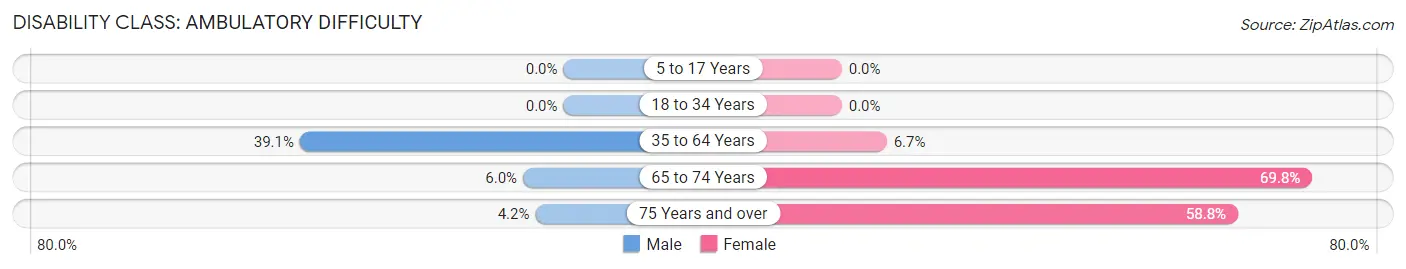
| Age Bracket | Male | Female |
| 5 to 17 Years | 0 (0.0%) | 0 (0.0%) |
| 18 to 34 Years | 0 (0.0%) | 0 (0.0%) |
| 35 to 64 Years | 18 (39.1%) | 7 (6.7%) |
| 65 to 74 Years | 3 (6.0%) | 44 (69.8%) |
| 75 Years and over | 1 (4.2%) | 10 (58.8%) |
Disability Class: Self-Care Difficulty
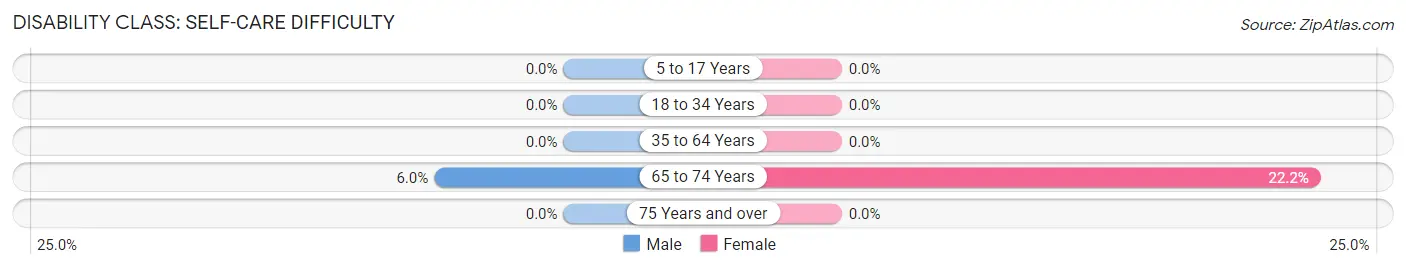
| Age Bracket | Male | Female |
| 5 to 17 Years | 0 (0.0%) | 0 (0.0%) |
| 18 to 34 Years | 0 (0.0%) | 0 (0.0%) |
| 35 to 64 Years | 0 (0.0%) | 0 (0.0%) |
| 65 to 74 Years | 3 (6.0%) | 14 (22.2%) |
| 75 Years and over | 0 (0.0%) | 0 (0.0%) |
Technology Access in Waterproof
Computing Device Access in Waterproof
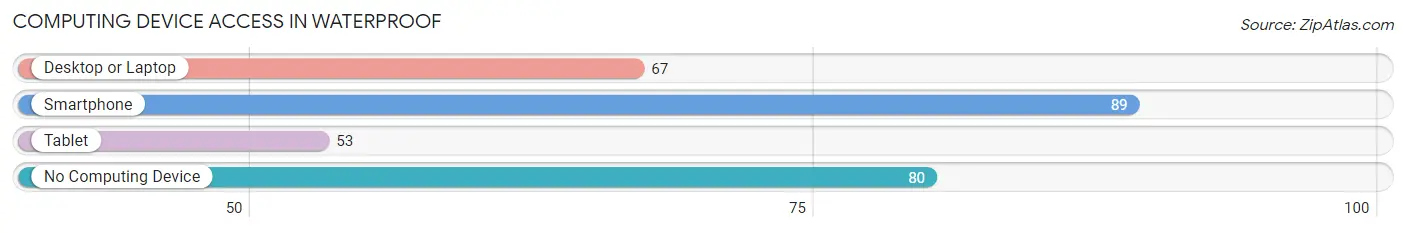
| Device Type | # Households | % Households |
| Desktop or Laptop | 67 | 35.1% |
| Smartphone | 89 | 46.6% |
| Tablet | 53 | 27.8% |
| No Computing Device | 80 | 41.9% |
| Total | 191 | 100.0% |
Internet Access in Waterproof
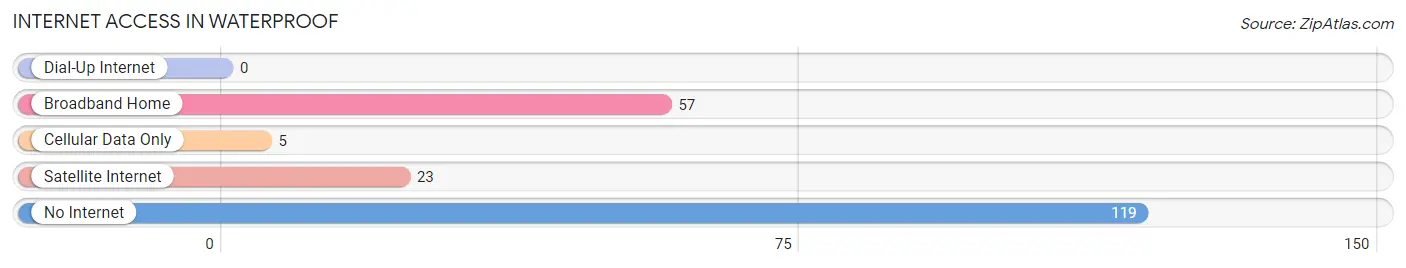
| Internet Type | # Households | % Households |
| Dial-Up Internet | 0 | 0.0% |
| Broadband Home | 57 | 29.8% |
| Cellular Data Only | 5 | 2.6% |
| Satellite Internet | 23 | 12.0% |
| No Internet | 119 | 62.3% |
| Total | 191 | 100.0% |
Waterproof Summary
Waterproof, Louisiana is a small town located in the northeastern corner of the state, in Tensas Parish. It is situated on the banks of the Mississippi River, and is home to a population of approximately 1,000 people. The town was founded in 1837, and has a rich history of agriculture, industry, and commerce.
Geography
Waterproof is located in the northeast corner of Louisiana, in Tensas Parish. It is situated on the banks of the Mississippi River, and is bordered by the Tensas River to the east and the Ouachita River to the west. The town is located in a flat, low-lying area, and is surrounded by swamps and wetlands. The climate is humid subtropical, with hot, humid summers and mild winters.
Economy
Waterproof’s economy is largely based on agriculture and forestry. The town is home to several large farms, which produce cotton, soybeans, corn, and other crops. The town also has a thriving timber industry, with several sawmills and lumber yards. In addition, Waterproof is home to several small businesses, including restaurants, retail stores, and service providers.
Demographics
As of the 2010 census, Waterproof had a population of 1,000 people. The racial makeup of the town was 79.2% African American, 19.2% White, 0.2% Native American, 0.2% Asian, and 1.2% from other races. The median household income was $25,000, and the median family income was $30,000.
The town is served by the Tensas Parish School District, which includes two elementary schools, one middle school, and one high school. The town also has a public library, a post office, and several churches.
Conclusion
Waterproof, Louisiana is a small town with a rich history and a vibrant economy. It is located in the northeast corner of the state, on the banks of the Mississippi River, and is home to a population of approximately 1,000 people. The town’s economy is largely based on agriculture and forestry, and it is served by the Tensas Parish School District. Waterproof is a diverse community, with a population that is 79.2% African American, 19.2% White, 0.2% Native American, 0.2% Asian, and 1.2% from other races.
Common Questions
What is Per Capita Income in Waterproof?
Per Capita income in Waterproof is $11,021.
What is the Median Household income in Waterproof?
Median Household Income in Waterproof is $21,953.
What is Income or Wage Gap in Waterproof?
Income or Wage Gap in Waterproof is 42.4%.
Women in Waterproof earn 57.6 cents for every dollar earned by a man.
What is Family Income Deficit in Waterproof?
Family Income Deficit in Waterproof is $12,939.
Families that are below poverty line in Waterproof earn $12,939 less on average than the poverty threshold level.
What is Inequality or Gini Index in Waterproof?
Inequality or Gini Index in Waterproof is 0.38.
What is the Total Population of Waterproof?
Total Population of Waterproof is 604.
What is the Total Male Population of Waterproof?
Total Male Population of Waterproof is 171.
What is the Total Female Population of Waterproof?
Total Female Population of Waterproof is 433.
What is the Ratio of Males per 100 Females in Waterproof?
There are 39.49 Males per 100 Females in Waterproof.
What is the Ratio of Females per 100 Males in Waterproof?
There are 253.22 Females per 100 Males in Waterproof.
What is the Median Population Age in Waterproof?
Median Population Age in Waterproof is 37.0 Years.
What is the Average Family Size in Waterproof
Average Family Size in Waterproof is 7.6 People.
What is the Average Household Size in Waterproof
Average Household Size in Waterproof is 3.2 People.
How Large is the Labor Force in Waterproof?
There are 118 People in the Labor Forcein in Waterproof.
What is the Percentage of People in the Labor Force in Waterproof?
28.0% of People are in the Labor Force in Waterproof.
What is the Unemployment Rate in Waterproof?
Unemployment Rate in Waterproof is 11.0%.