Walker, LA Map & Demographics
Walker Map
Walker Overview
$36,555
PER CAPITA INCOME
$91,164
AVG FAMILY INCOME
$86,446
AVG HOUSEHOLD INCOME
42.0%
WAGE / INCOME GAP [ % ]
58.0¢/ $1
WAGE / INCOME GAP [ $ ]
0.39
INEQUALITY / GINI INDEX
6,359
TOTAL POPULATION
3,249
MALE POPULATION
3,110
FEMALE POPULATION
104.47
MALES / 100 FEMALES
95.72
FEMALES / 100 MALES
35.3
MEDIAN AGE
3.5
AVG FAMILY SIZE
2.6
AVG HOUSEHOLD SIZE
3,107
LABOR FORCE [ PEOPLE ]
64.2%
PERCENT IN LABOR FORCE
3.3%
UNEMPLOYMENT RATE
Walker Zip Codes
Walker Area Codes
Income in Walker
Income Overview in Walker
Per Capita Income in Walker is $36,555, while median incomes of families and households are $91,164 and $86,446 respectively.
| Characteristic | Number | Measure |
| Per Capita Income | 6,359 | $36,555 |
| Median Family Income | 1,313 | $91,164 |
| Mean Family Income | 1,313 | $100,322 |
| Median Household Income | 2,403 | $86,446 |
| Mean Household Income | 2,403 | $93,936 |
| Income Deficit | 1,313 | $0 |
| Wage / Income Gap (%) | 6,359 | 42.03% |
| Wage / Income Gap ($) | 6,359 | 57.97¢ per $1 |
| Gini / Inequality Index | 6,359 | 0.39 |
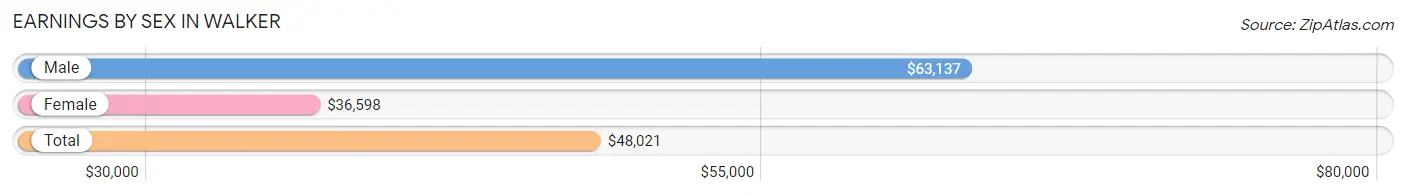
Earnings by Sex in Walker
Average Earnings in Walker are $48,021, $63,137 for men and $36,598 for women, a difference of 42.0%.
| Sex | Number | Average Earnings |
| Male | 1,760 (54.8%) | $63,137 |
| Female | 1,450 (45.2%) | $36,598 |
| Total | 3,210 (100.0%) | $48,021 |
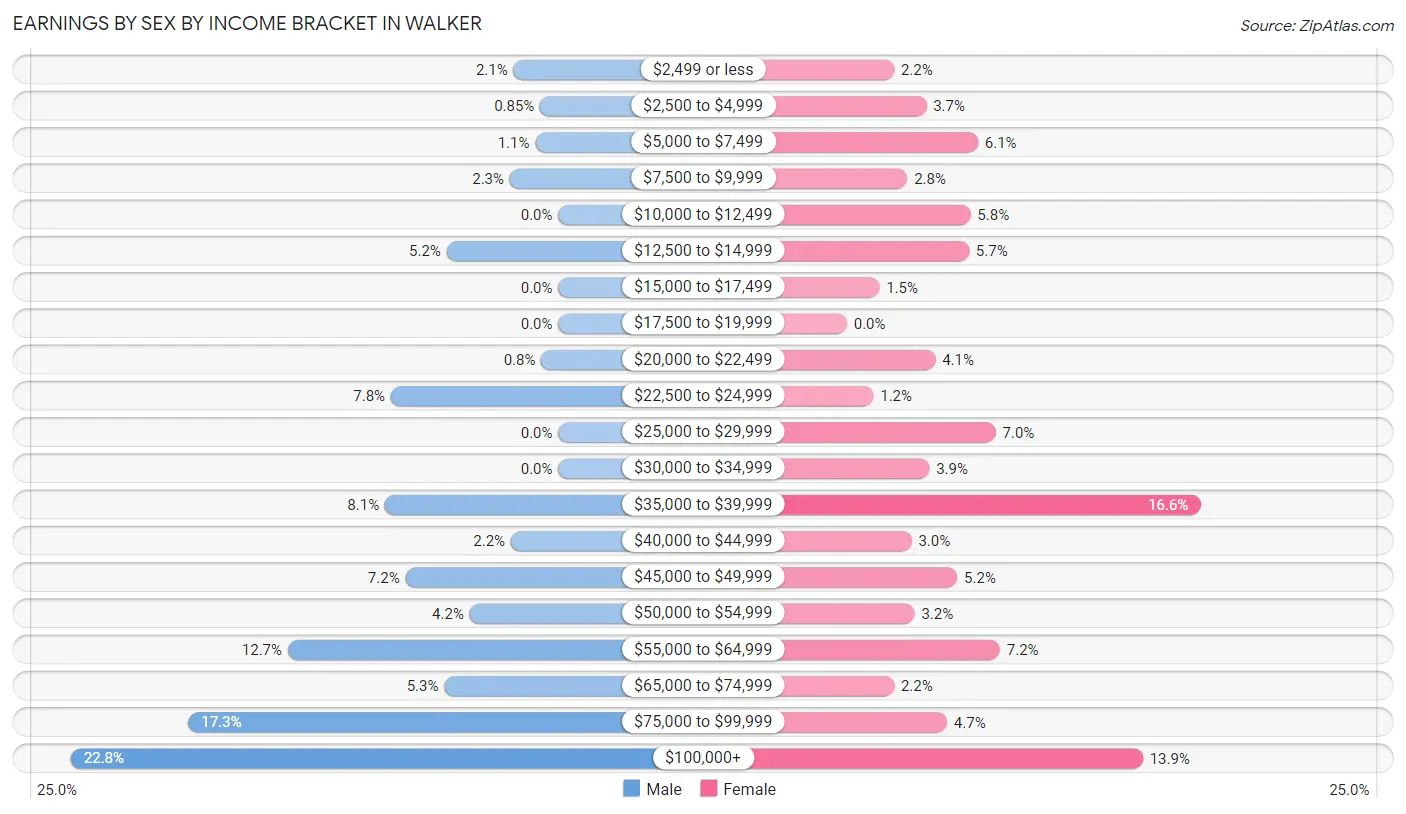
Earnings by Sex by Income Bracket in Walker
The most common earnings brackets in Walker are $100,000+ for men (402 | 22.8%) and $35,000 to $39,999 for women (240 | 16.6%).
| Income | Male | Female |
| $2,499 or less | 37 (2.1%) | 32 (2.2%) |
| $2,500 to $4,999 | 15 (0.9%) | 54 (3.7%) |
| $5,000 to $7,499 | 19 (1.1%) | 89 (6.1%) |
| $7,500 to $9,999 | 40 (2.3%) | 41 (2.8%) |
| $10,000 to $12,499 | 0 (0.0%) | 84 (5.8%) |
| $12,500 to $14,999 | 92 (5.2%) | 83 (5.7%) |
| $15,000 to $17,499 | 0 (0.0%) | 22 (1.5%) |
| $17,500 to $19,999 | 0 (0.0%) | 0 (0.0%) |
| $20,000 to $22,499 | 14 (0.8%) | 60 (4.1%) |
| $22,500 to $24,999 | 138 (7.8%) | 18 (1.2%) |
| $25,000 to $29,999 | 0 (0.0%) | 101 (7.0%) |
| $30,000 to $34,999 | 0 (0.0%) | 56 (3.9%) |
| $35,000 to $39,999 | 143 (8.1%) | 240 (16.6%) |
| $40,000 to $44,999 | 39 (2.2%) | 44 (3.0%) |
| $45,000 to $49,999 | 126 (7.2%) | 75 (5.2%) |
| $50,000 to $54,999 | 73 (4.2%) | 46 (3.2%) |
| $55,000 to $64,999 | 223 (12.7%) | 104 (7.2%) |
| $65,000 to $74,999 | 94 (5.3%) | 32 (2.2%) |
| $75,000 to $99,999 | 305 (17.3%) | 68 (4.7%) |
| $100,000+ | 402 (22.8%) | 201 (13.9%) |
| Total | 1,760 (100.0%) | 1,450 (100.0%) |
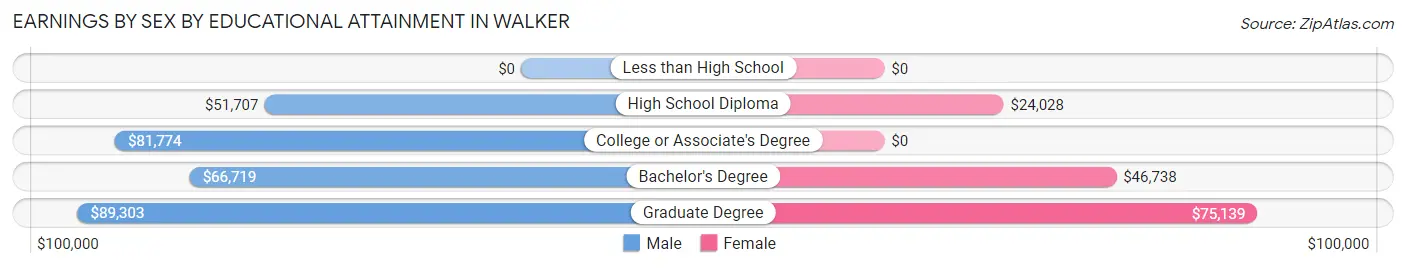
Earnings by Sex by Educational Attainment in Walker
Average earnings in Walker are $66,802 for men and $38,551 for women, a difference of 42.3%. Men with an educational attainment of graduate degree enjoy the highest average annual earnings of $89,303, while those with high school diploma education earn the least with $51,707. Women with an educational attainment of graduate degree earn the most with the average annual earnings of $75,139, while those with high school diploma education have the smallest earnings of $24,028.
| Educational Attainment | Male Income | Female Income |
| Less than High School | - | - |
| High School Diploma | $51,707 | $24,028 |
| College or Associate's Degree | $81,774 | $0 |
| Bachelor's Degree | $66,719 | $46,738 |
| Graduate Degree | $89,303 | $75,139 |
| Total | $66,802 | $38,551 |
Family Income in Walker
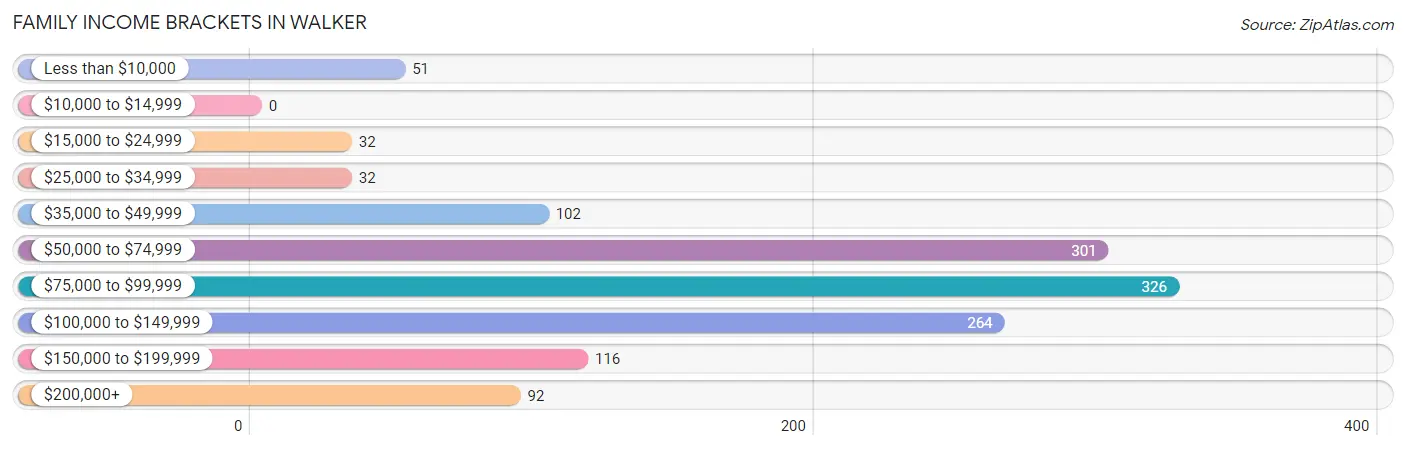
Family Income Brackets in Walker
According to the Walker family income data, there are 326 families falling into the $75,000 to $99,999 income range, which is the most common income bracket and makes up 24.8% of all families.
| Income Bracket | # Families | % Families |
| Less than $10,000 | 51 | 3.9% |
| $10,000 to $14,999 | 0 | 0.0% |
| $15,000 to $24,999 | 32 | 2.4% |
| $25,000 to $34,999 | 32 | 2.4% |
| $35,000 to $49,999 | 102 | 7.8% |
| $50,000 to $74,999 | 301 | 22.9% |
| $75,000 to $99,999 | 326 | 24.8% |
| $100,000 to $149,999 | 264 | 20.1% |
| $150,000 to $199,999 | 116 | 8.8% |
| $200,000+ | 92 | 7.0% |
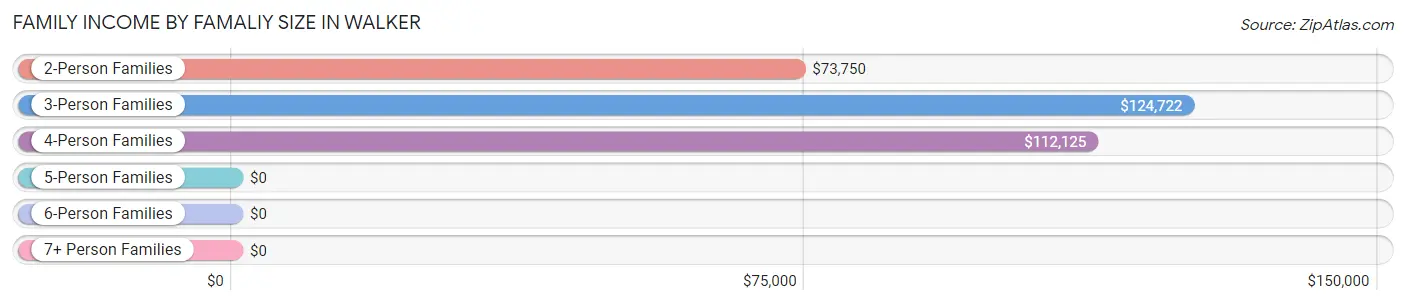
Family Income by Famaliy Size in Walker
3-person families (372 | 28.3%) account for the highest median family income in Walker with $124,722 per family, while 3-person families (372 | 28.3%) have the highest median income of $41,574 per family member.
| Income Bracket | # Families | Median Income |
| 2-Person Families | 584 (44.5%) | $73,750 |
| 3-Person Families | 372 (28.3%) | $124,722 |
| 4-Person Families | 206 (15.7%) | $112,125 |
| 5-Person Families | 117 (8.9%) | $0 |
| 6-Person Families | 34 (2.6%) | $0 |
| 7+ Person Families | 0 (0.0%) | $0 |
| Total | 1,313 (100.0%) | $91,164 |
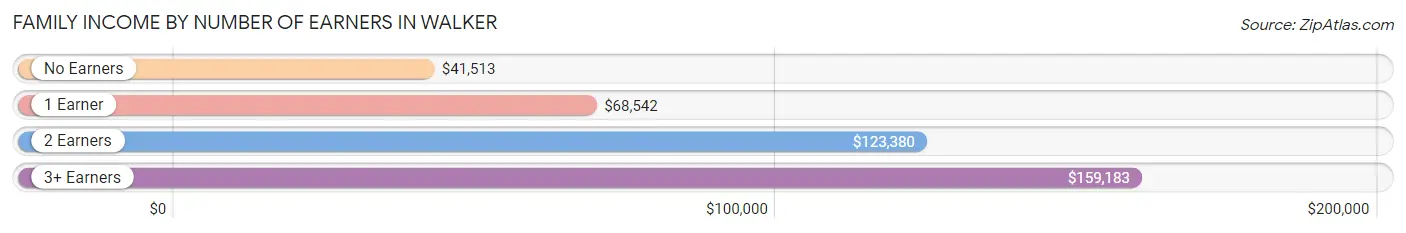
Family Income by Number of Earners in Walker
The median family income in Walker is $91,164, with families comprising 3+ earners (114) having the highest median family income of $159,183, while families with no earners (238) have the lowest median family income of $41,513, accounting for 8.7% and 18.1% of families, respectively.
| Number of Earners | # Families | Median Income |
| No Earners | 238 (18.1%) | $41,513 |
| 1 Earner | 508 (38.7%) | $68,542 |
| 2 Earners | 453 (34.5%) | $123,380 |
| 3+ Earners | 114 (8.7%) | $159,183 |
| Total | 1,313 (100.0%) | $91,164 |
Household Income in Walker
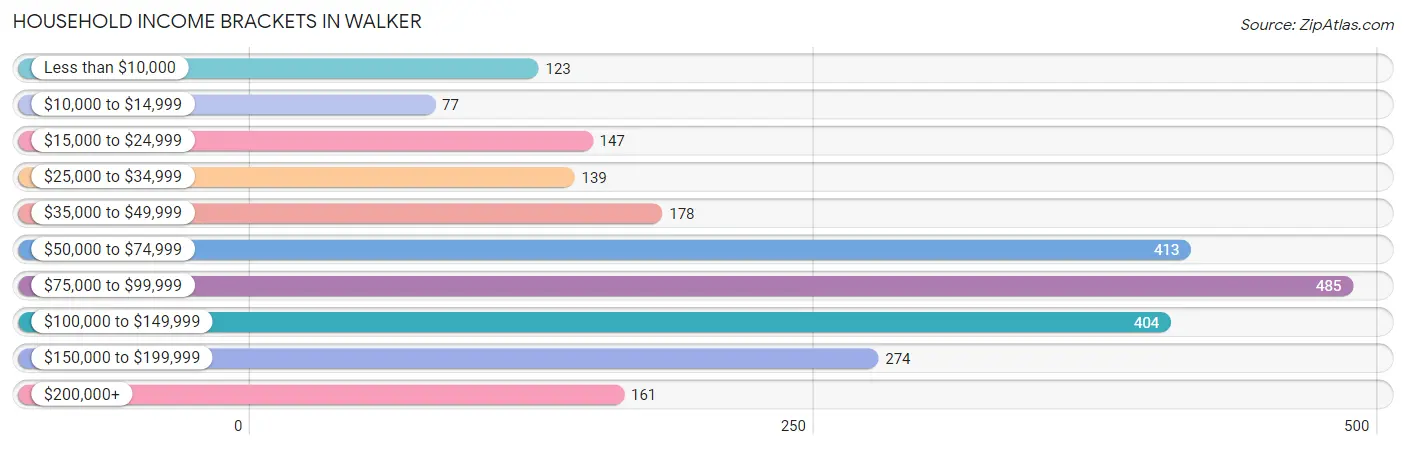
Household Income Brackets in Walker
With 485 households falling in the category, the $75,000 to $99,999 income range is the most frequent in Walker, accounting for 20.2% of all households. In contrast, only 77 households (3.2%) fall into the $10,000 to $14,999 income bracket, making it the least populous group.
| Income Bracket | # Households | % Households |
| Less than $10,000 | 123 | 5.1% |
| $10,000 to $14,999 | 77 | 3.2% |
| $15,000 to $24,999 | 147 | 6.1% |
| $25,000 to $34,999 | 139 | 5.8% |
| $35,000 to $49,999 | 178 | 7.4% |
| $50,000 to $74,999 | 413 | 17.2% |
| $75,000 to $99,999 | 485 | 20.2% |
| $100,000 to $149,999 | 404 | 16.8% |
| $150,000 to $199,999 | 274 | 11.4% |
| $200,000+ | 161 | 6.7% |
Household Income by Householder Age in Walker
The median household income in Walker is $86,446, with the highest median household income of $92,880 found in the 25 to 44 years age bracket for the primary householder. A total of 835 households (34.7%) fall into this category. Meanwhile, the 65+ years age bracket for the primary householder has the lowest median household income of $47,650, with 653 households (27.2%) in this group.
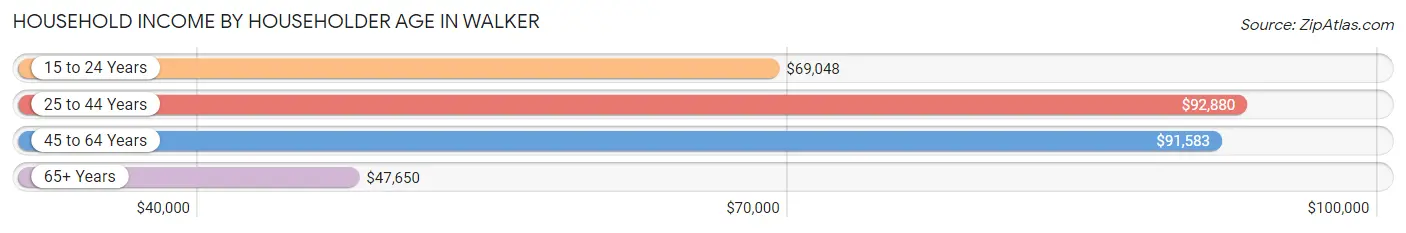
| Income Bracket | # Households | Median Income |
| 15 to 24 Years | 96 (4.0%) | $69,048 |
| 25 to 44 Years | 835 (34.7%) | $92,880 |
| 45 to 64 Years | 819 (34.1%) | $91,583 |
| 65+ Years | 653 (27.2%) | $47,650 |
| Total | 2,403 (100.0%) | $86,446 |
Poverty in Walker
Income Below Poverty by Sex and Age in Walker
With 8.4% poverty level for males and 13.6% for females among the residents of Walker, under 5 year old males and under 5 year old females are the most vulnerable to poverty, with 109 males (63.7%) and 78 females (39.0%) in their respective age groups living below the poverty level.
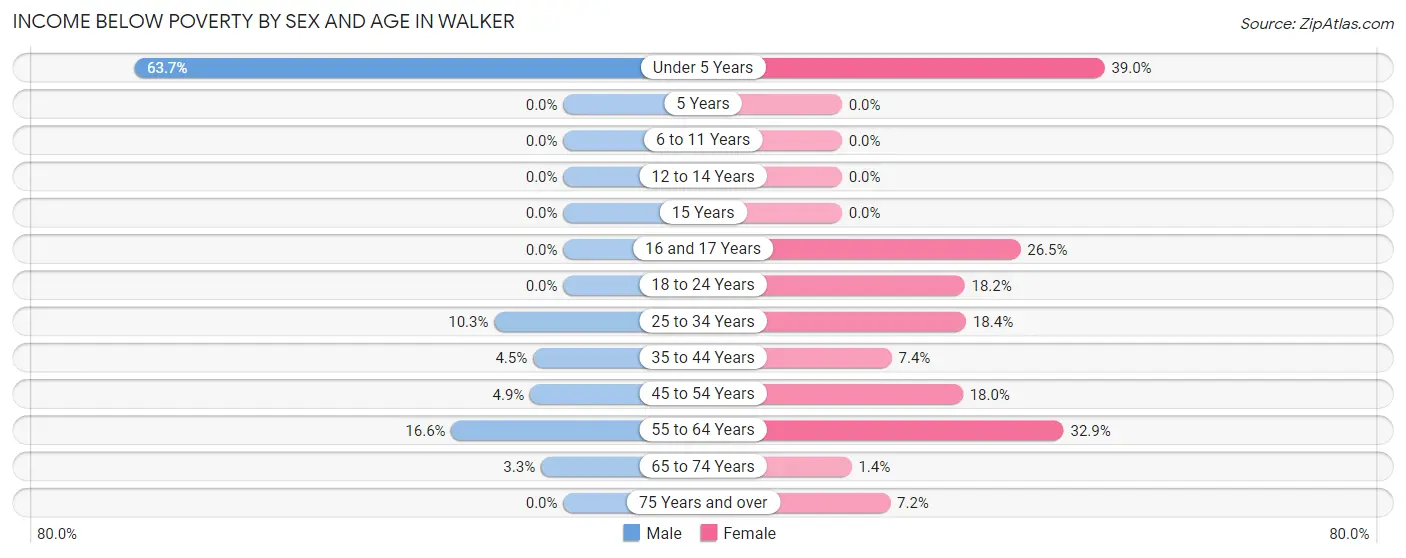
| Age Bracket | Male | Female |
| Under 5 Years | 109 (63.7%) | 78 (39.0%) |
| 5 Years | 0 (0.0%) | 0 (0.0%) |
| 6 to 11 Years | 0 (0.0%) | 0 (0.0%) |
| 12 to 14 Years | 0 (0.0%) | 0 (0.0%) |
| 15 Years | 0 (0.0%) | 0 (0.0%) |
| 16 and 17 Years | 0 (0.0%) | 31 (26.5%) |
| 18 to 24 Years | 0 (0.0%) | 35 (18.2%) |
| 25 to 34 Years | 64 (10.3%) | 71 (18.4%) |
| 35 to 44 Years | 14 (4.5%) | 35 (7.4%) |
| 45 to 54 Years | 18 (4.9%) | 93 (17.9%) |
| 55 to 64 Years | 61 (16.6%) | 54 (32.9%) |
| 65 to 74 Years | 8 (3.3%) | 6 (1.4%) |
| 75 Years and over | 0 (0.0%) | 16 (7.2%) |
| Total | 274 (8.4%) | 419 (13.6%) |
Income Above Poverty by Sex and Age in Walker
According to the poverty statistics in Walker, males aged 5 years and females aged 5 years are the age groups that are most secure financially, with 100.0% of males and 100.0% of females in these age groups living above the poverty line.
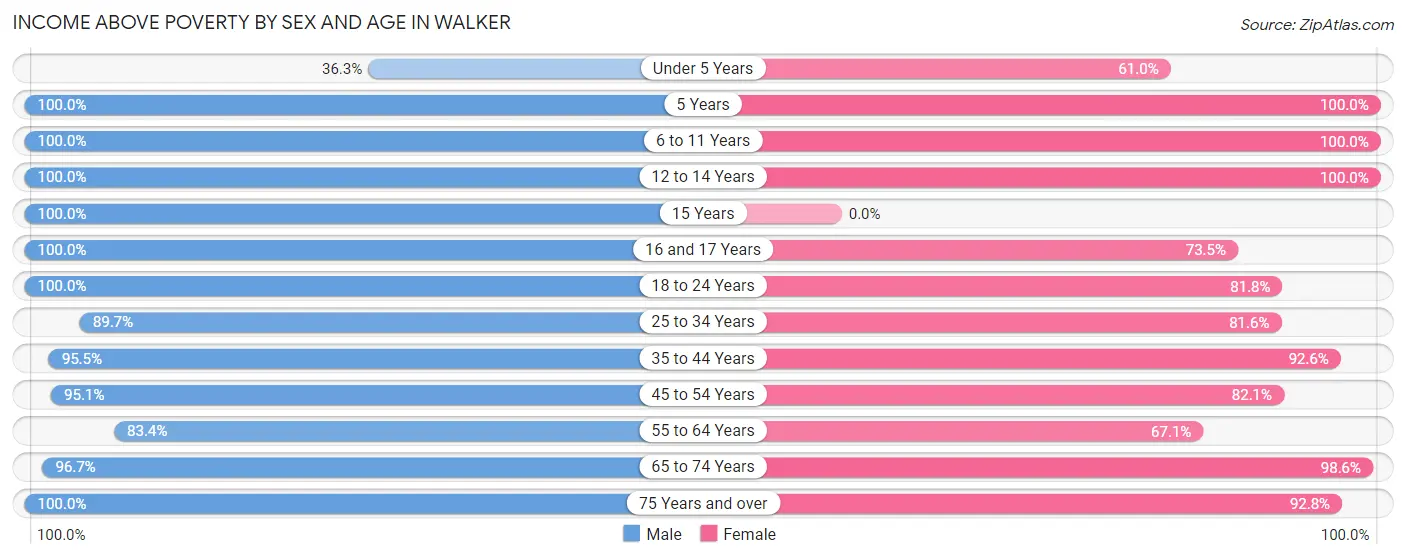
| Age Bracket | Male | Female |
| Under 5 Years | 62 (36.3%) | 122 (61.0%) |
| 5 Years | 102 (100.0%) | 41 (100.0%) |
| 6 to 11 Years | 434 (100.0%) | 138 (100.0%) |
| 12 to 14 Years | 174 (100.0%) | 208 (100.0%) |
| 15 Years | 19 (100.0%) | 0 (0.0%) |
| 16 and 17 Years | 71 (100.0%) | 86 (73.5%) |
| 18 to 24 Years | 232 (100.0%) | 157 (81.8%) |
| 25 to 34 Years | 560 (89.7%) | 314 (81.6%) |
| 35 to 44 Years | 297 (95.5%) | 438 (92.6%) |
| 45 to 54 Years | 347 (95.1%) | 425 (82.1%) |
| 55 to 64 Years | 306 (83.4%) | 110 (67.1%) |
| 65 to 74 Years | 233 (96.7%) | 413 (98.6%) |
| 75 Years and over | 138 (100.0%) | 207 (92.8%) |
| Total | 2,975 (91.6%) | 2,659 (86.4%) |
Income Below Poverty Among Married-Couple Families in Walker
The poverty statistics for married-couple families in Walker show that 2.0% or 17 of the total 863 families live below the poverty line. Families with no children have the highest poverty rate of 3.8%, comprising of 17 families. On the other hand, families with 1 or 2 children have the lowest poverty rate of 0.0%, which includes 0 families.
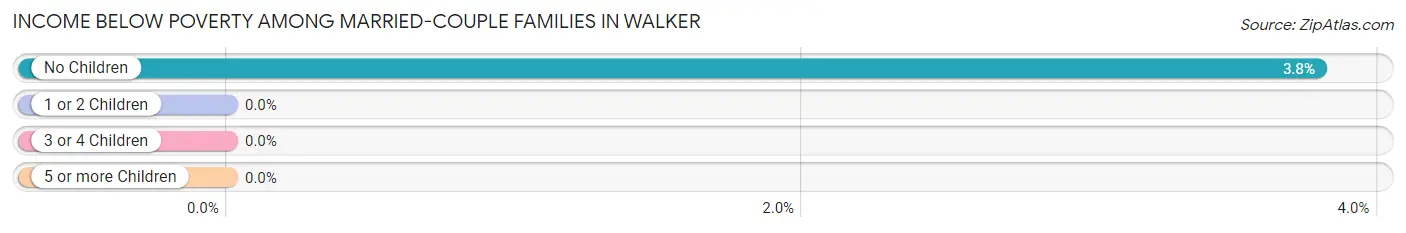
| Children | Above Poverty | Below Poverty |
| No Children | 432 (96.2%) | 17 (3.8%) |
| 1 or 2 Children | 335 (100.0%) | 0 (0.0%) |
| 3 or 4 Children | 79 (100.0%) | 0 (0.0%) |
| 5 or more Children | 0 (0.0%) | 0 (0.0%) |
| Total | 846 (98.0%) | 17 (2.0%) |
Income Below Poverty Among Single-Parent Households in Walker
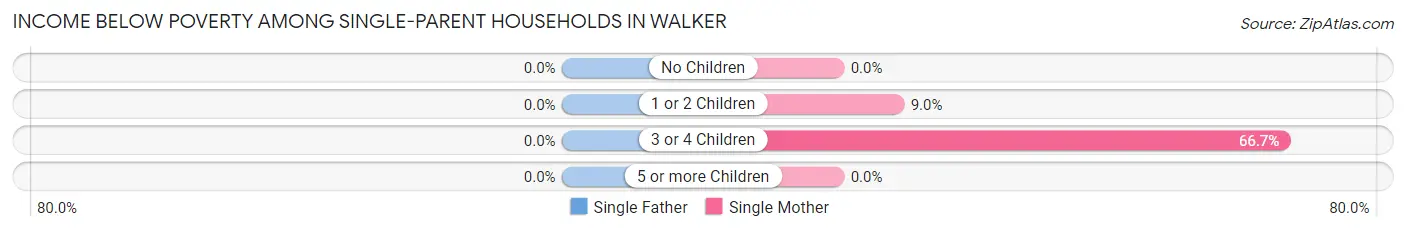
| Children | Single Father | Single Mother |
| No Children | 0 (0.0%) | 0 (0.0%) |
| 1 or 2 Children | 0 (0.0%) | 17 (8.9%) |
| 3 or 4 Children | 0 (0.0%) | 40 (66.7%) |
| 5 or more Children | 0 (0.0%) | 0 (0.0%) |
| Total | 0 (0.0%) | 57 (16.2%) |
Income Below Poverty Among Married-Couple vs Single-Parent Households in Walker
The poverty data for Walker shows that 17 of the married-couple family households (2.0%) and 57 of the single-parent households (12.7%) are living below the poverty level. Within the married-couple family households, those with no children have the highest poverty rate, with 17 households (3.8%) falling below the poverty line. Among the single-parent households, those with 3 or 4 children have the highest poverty rate, with 40 household (66.7%) living below poverty.
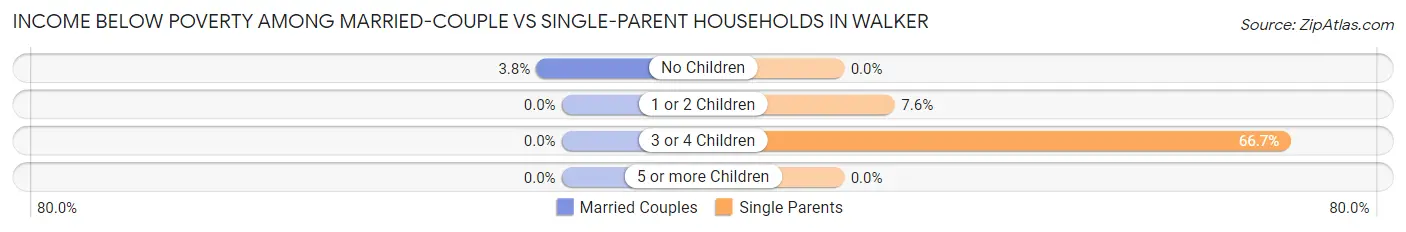
| Children | Married-Couple Families | Single-Parent Households |
| No Children | 17 (3.8%) | 0 (0.0%) |
| 1 or 2 Children | 0 (0.0%) | 17 (7.6%) |
| 3 or 4 Children | 0 (0.0%) | 40 (66.7%) |
| 5 or more Children | 0 (0.0%) | 0 (0.0%) |
| Total | 17 (2.0%) | 57 (12.7%) |
Race in Walker
The most populous races in Walker are White / Caucasian (5,416 | 85.2%), Black / African American (514 | 8.1%), and Asian (273 | 4.3%).
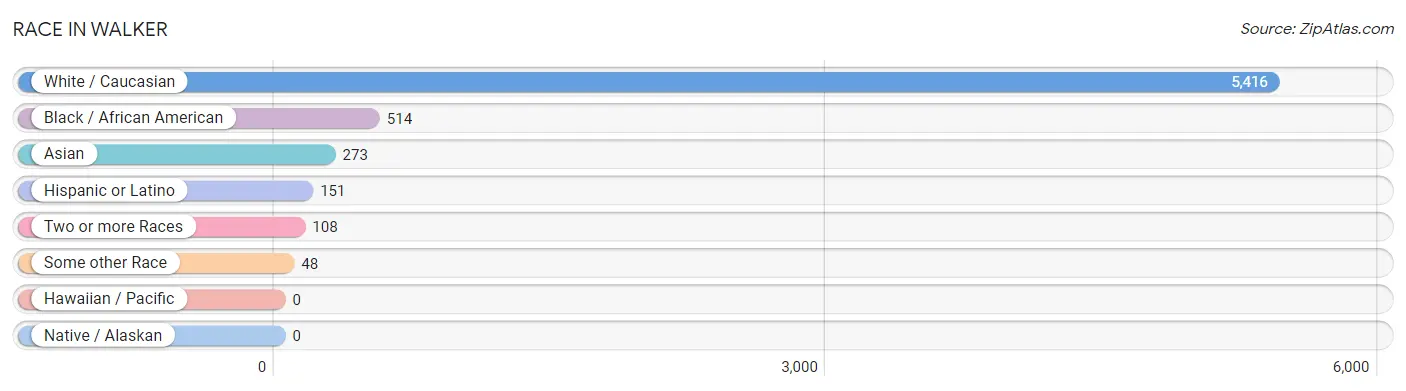
| Race | # Population | % Population |
| Asian | 273 | 4.3% |
| Black / African American | 514 | 8.1% |
| Hawaiian / Pacific | 0 | 0.0% |
| Hispanic or Latino | 151 | 2.4% |
| Native / Alaskan | 0 | 0.0% |
| White / Caucasian | 5,416 | 85.2% |
| Two or more Races | 108 | 1.7% |
| Some other Race | 48 | 0.7% |
| Total | 6,359 | 100.0% |
Ancestry in Walker
The most populous ancestries reported in Walker are French (559 | 8.8%), German (467 | 7.3%), American (421 | 6.6%), English (379 | 6.0%), and Irish (349 | 5.5%), together accounting for 34.2% of all Walker residents.
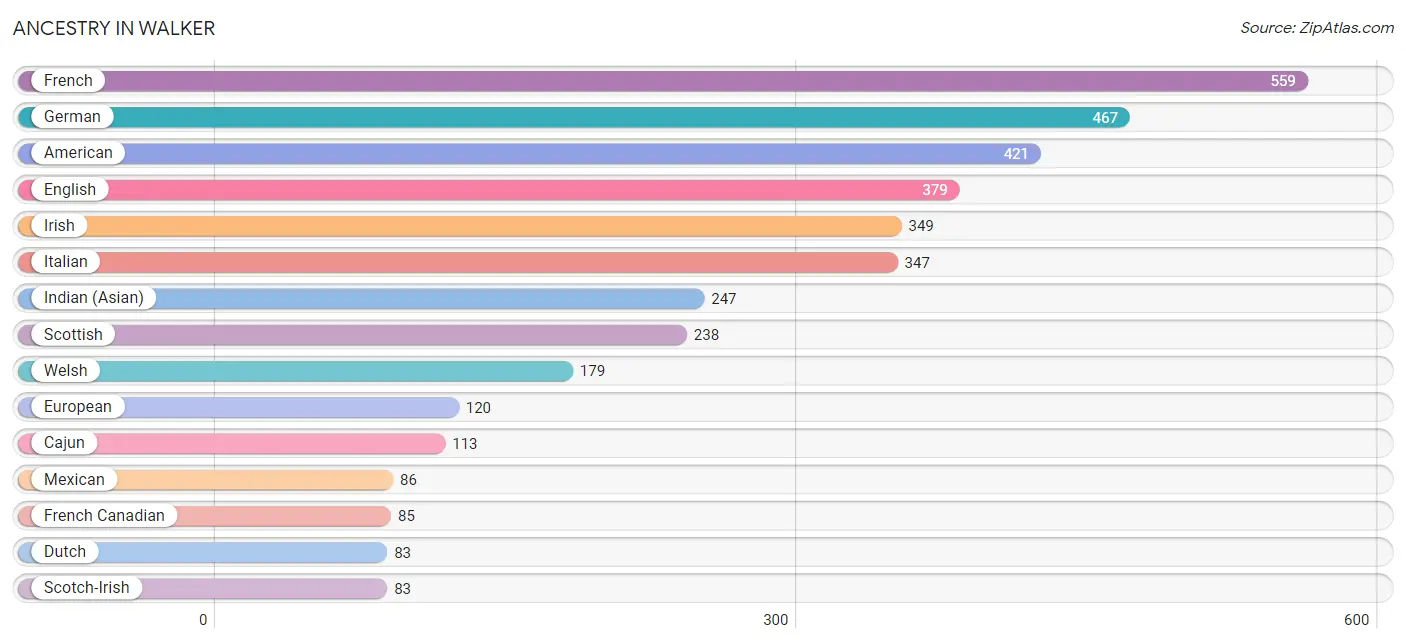
| Ancestry | # Population | % Population |
| American | 421 | 6.6% |
| Cajun | 113 | 1.8% |
| Cherokee | 11 | 0.2% |
| Choctaw | 11 | 0.2% |
| Czech | 53 | 0.8% |
| Dutch | 83 | 1.3% |
| English | 379 | 6.0% |
| European | 120 | 1.9% |
| French | 559 | 8.8% |
| French Canadian | 85 | 1.3% |
| German | 467 | 7.3% |
| Indian (Asian) | 247 | 3.9% |
| Irish | 349 | 5.5% |
| Italian | 347 | 5.5% |
| Mexican | 86 | 1.3% |
| Norwegian | 21 | 0.3% |
| Scotch-Irish | 83 | 1.3% |
| Scottish | 238 | 3.7% |
| Spanish | 48 | 0.7% |
| Spanish American | 17 | 0.3% |
| Sri Lankan | 80 | 1.3% |
| Swedish | 61 | 1.0% |
| Welsh | 179 | 2.8% | View All 23 Rows |
Immigrants in Walker
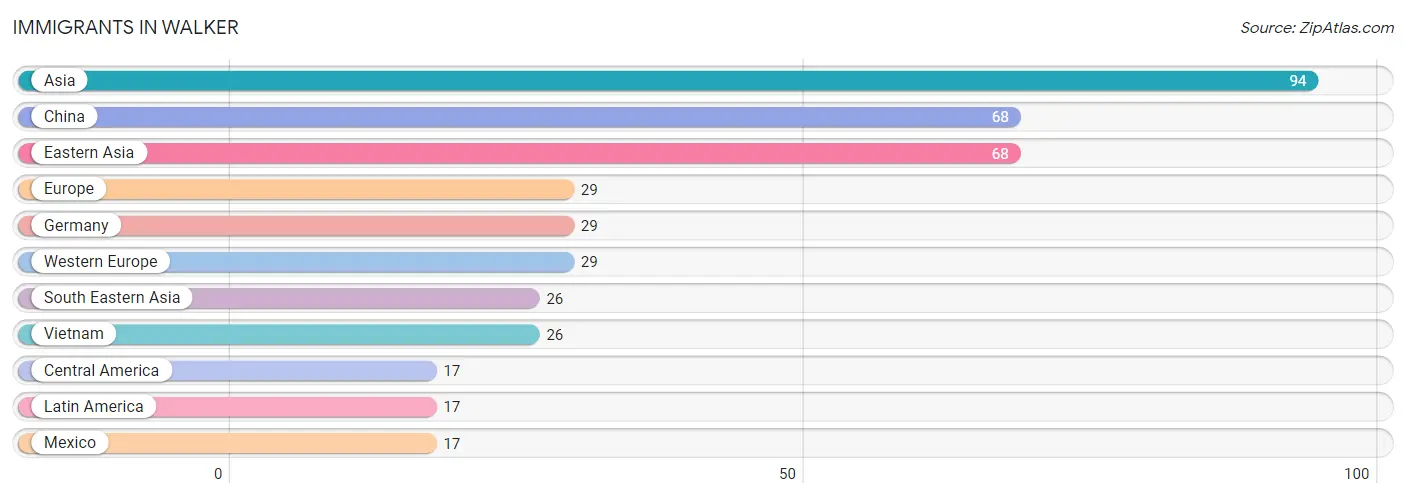
The most numerous immigrant groups reported in Walker came from Asia (94 | 1.5%), China (68 | 1.1%), Eastern Asia (68 | 1.1%), Europe (29 | 0.5%), and Germany (29 | 0.5%), together accounting for 4.5% of all Walker residents.
| Immigration Origin | # Population | % Population |
| Asia | 94 | 1.5% |
| Central America | 17 | 0.3% |
| China | 68 | 1.1% |
| Eastern Asia | 68 | 1.1% |
| Europe | 29 | 0.5% |
| Germany | 29 | 0.5% |
| Latin America | 17 | 0.3% |
| Mexico | 17 | 0.3% |
| South Eastern Asia | 26 | 0.4% |
| Vietnam | 26 | 0.4% |
| Western Europe | 29 | 0.5% | View All 11 Rows |
Sex and Age in Walker
Sex and Age in Walker
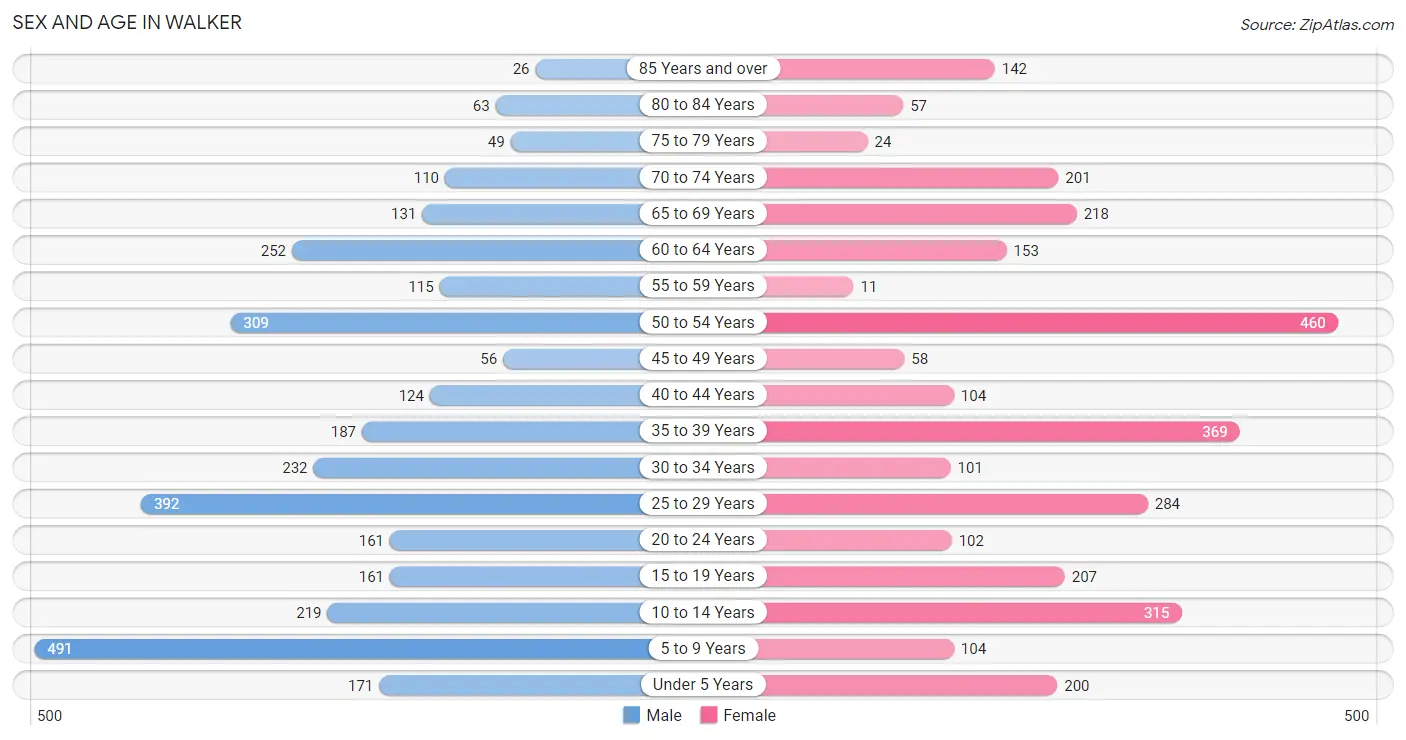
The most populous age groups in Walker are 5 to 9 Years (491 | 15.1%) for men and 50 to 54 Years (460 | 14.8%) for women.
| Age Bracket | Male | Female |
| Under 5 Years | 171 (5.3%) | 200 (6.4%) |
| 5 to 9 Years | 491 (15.1%) | 104 (3.3%) |
| 10 to 14 Years | 219 (6.7%) | 315 (10.1%) |
| 15 to 19 Years | 161 (5.0%) | 207 (6.7%) |
| 20 to 24 Years | 161 (5.0%) | 102 (3.3%) |
| 25 to 29 Years | 392 (12.1%) | 284 (9.1%) |
| 30 to 34 Years | 232 (7.1%) | 101 (3.3%) |
| 35 to 39 Years | 187 (5.8%) | 369 (11.9%) |
| 40 to 44 Years | 124 (3.8%) | 104 (3.3%) |
| 45 to 49 Years | 56 (1.7%) | 58 (1.9%) |
| 50 to 54 Years | 309 (9.5%) | 460 (14.8%) |
| 55 to 59 Years | 115 (3.5%) | 11 (0.4%) |
| 60 to 64 Years | 252 (7.8%) | 153 (4.9%) |
| 65 to 69 Years | 131 (4.0%) | 218 (7.0%) |
| 70 to 74 Years | 110 (3.4%) | 201 (6.5%) |
| 75 to 79 Years | 49 (1.5%) | 24 (0.8%) |
| 80 to 84 Years | 63 (1.9%) | 57 (1.8%) |
| 85 Years and over | 26 (0.8%) | 142 (4.6%) |
| Total | 3,249 (100.0%) | 3,110 (100.0%) |
Families and Households in Walker
Median Family Size in Walker
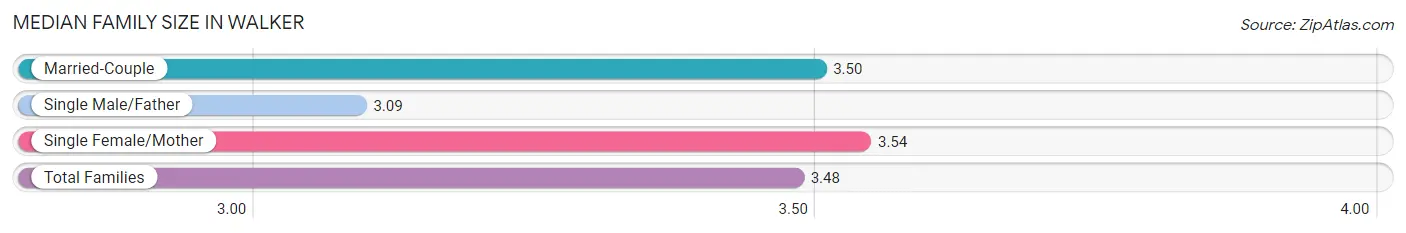
The median family size in Walker is 3.48 persons per family, with single female/mother families (353 | 26.9%) accounting for the largest median family size of 3.54 persons per family. On the other hand, single male/father families (97 | 7.4%) represent the smallest median family size with 3.09 persons per family.
| Family Type | # Families | Family Size |
| Married-Couple | 863 (65.7%) | 3.50 |
| Single Male/Father | 97 (7.4%) | 3.09 |
| Single Female/Mother | 353 (26.9%) | 3.54 |
| Total Families | 1,313 (100.0%) | 3.48 |
Median Household Size in Walker
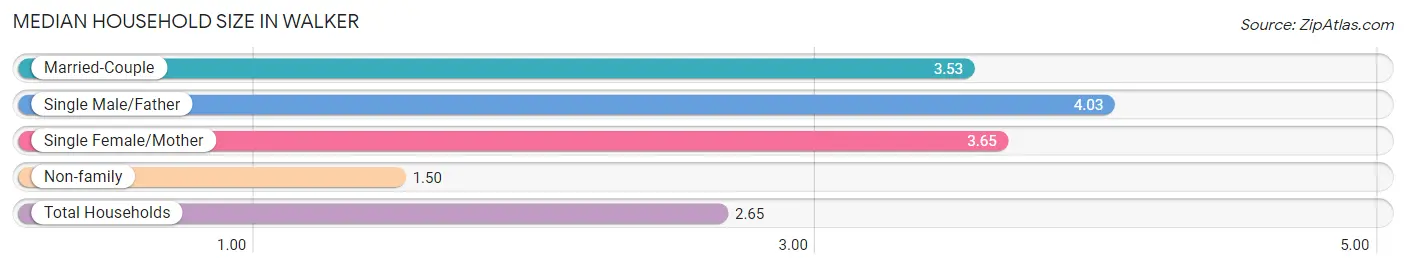
The median household size in Walker is 2.65 persons per household, with single male/father households (97 | 4.0%) accounting for the largest median household size of 4.03 persons per household. non-family households (1,090 | 45.4%) represent the smallest median household size with 1.50 persons per household.
| Household Type | # Households | Household Size |
| Married-Couple | 863 (35.9%) | 3.53 |
| Single Male/Father | 97 (4.0%) | 4.03 |
| Single Female/Mother | 353 (14.7%) | 3.65 |
| Non-family | 1,090 (45.4%) | 1.50 |
| Total Households | 2,403 (100.0%) | 2.65 |
Household Size by Marriage Status in Walker
Out of a total of 2,403 households in Walker, 1,313 (54.6%) are family households, while 1,090 (45.4%) are nonfamily households. The most numerous type of family households are 2-person households, comprising 500, and the most common type of nonfamily households are 1-person households, comprising 649.
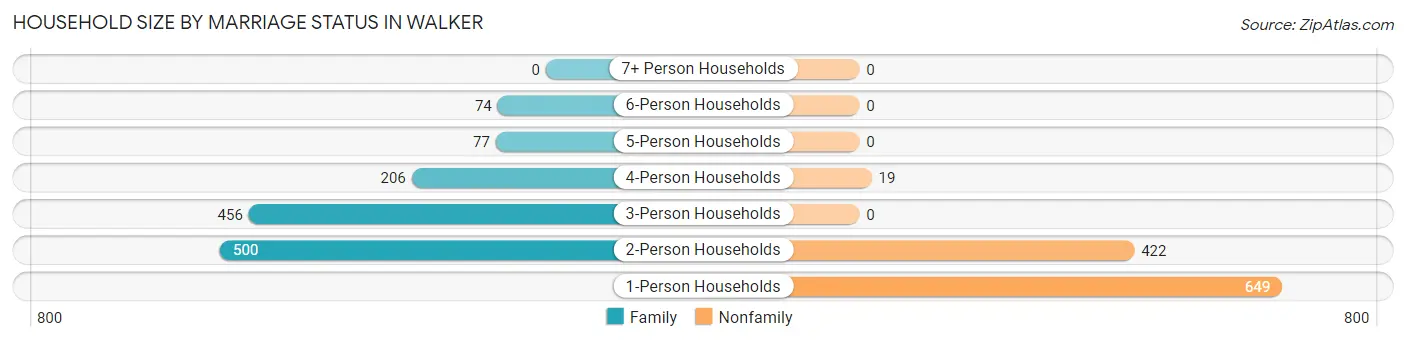
| Household Size | Family Households | Nonfamily Households |
| 1-Person Households | - | 649 (27.0%) |
| 2-Person Households | 500 (20.8%) | 422 (17.6%) |
| 3-Person Households | 456 (19.0%) | 0 (0.0%) |
| 4-Person Households | 206 (8.6%) | 19 (0.8%) |
| 5-Person Households | 77 (3.2%) | 0 (0.0%) |
| 6-Person Households | 74 (3.1%) | 0 (0.0%) |
| 7+ Person Households | 0 (0.0%) | 0 (0.0%) |
| Total | 1,313 (54.6%) | 1,090 (45.4%) |
Female Fertility in Walker
Fertility by Age in Walker
Average fertility rate in Walker is 46.0 births per 1,000 women. Women in the age bracket of 20 to 34 years have the highest fertility rate with 129.0 births per 1,000 women. Women in the age bracket of 20 to 34 years acount for 100.0% of all women with births.
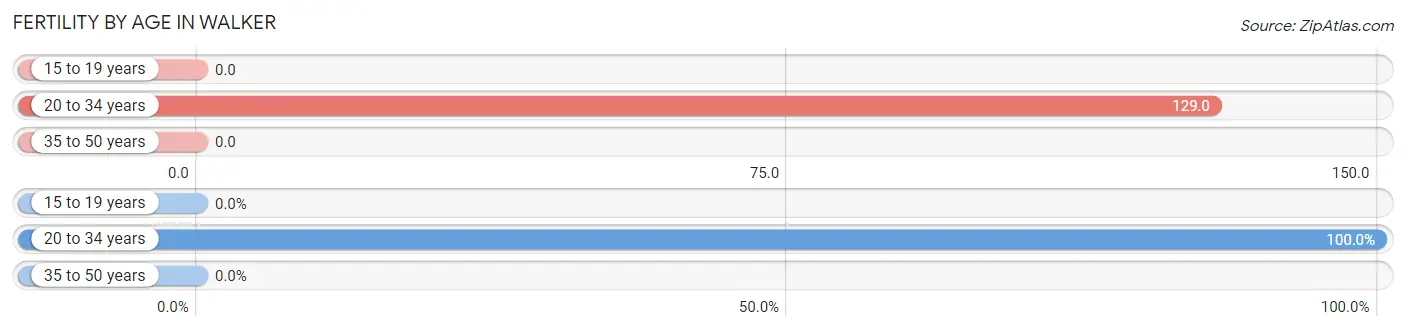
| Age Bracket | Women with Births | Births / 1,000 Women |
| 15 to 19 years | 0 (0.0%) | 0.0 |
| 20 to 34 years | 63 (100.0%) | 129.0 |
| 35 to 50 years | 0 (0.0%) | 0.0 |
| Total | 63 (100.0%) | 46.0 |
Fertility by Age by Marriage Status in Walker
19.0% of women with births (63) in Walker are married. The highest percentage of unmarried women with births falls into 20 to 34 years age bracket with 80.9% of them unmarried at the time of birth, while the lowest percentage of unmarried women with births belong to 20 to 34 years age bracket with 80.9% of them unmarried.
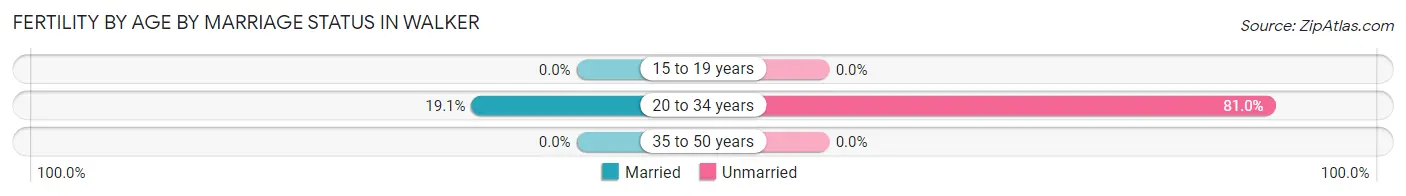
| Age Bracket | Married | Unmarried |
| 15 to 19 years | 0 (0.0%) | 0 (0.0%) |
| 20 to 34 years | 12 (19.1%) | 51 (80.9%) |
| 35 to 50 years | 0 (0.0%) | 0 (0.0%) |
| Total | 12 (19.1%) | 51 (80.9%) |
Fertility by Education in Walker
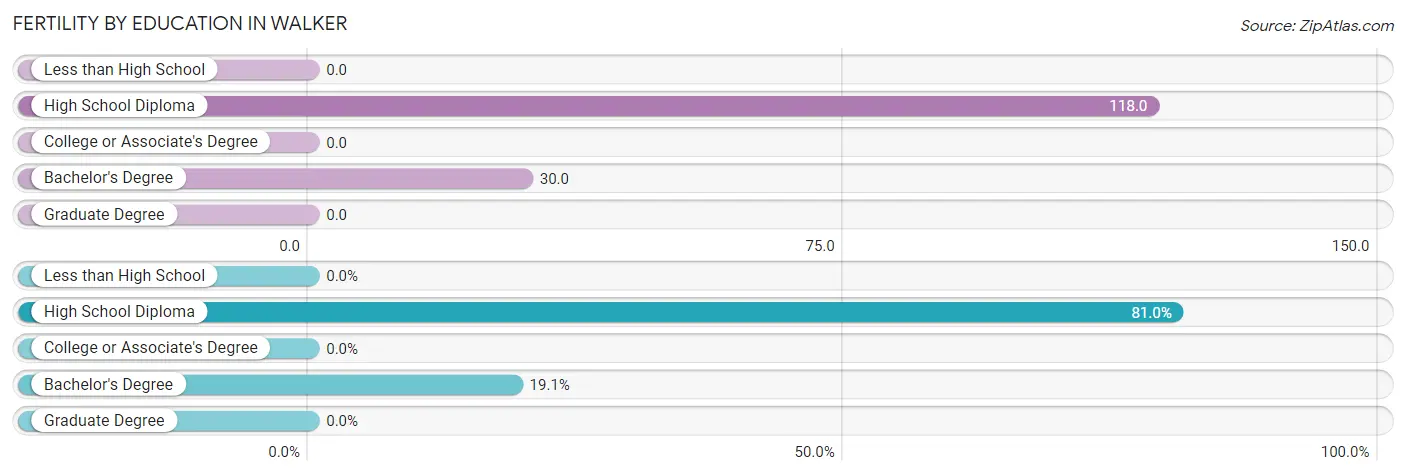
| Educational Attainment | Women with Births | Births / 1,000 Women |
| Less than High School | 0 (0.0%) | 0.0 |
| High School Diploma | 51 (80.9%) | 118.0 |
| College or Associate's Degree | 0 (0.0%) | 0.0 |
| Bachelor's Degree | 12 (19.1%) | 30.0 |
| Graduate Degree | 0 (0.0%) | 0.0 |
| Total | 63 (100.0%) | 46.0 |
Fertility by Education by Marriage Status in Walker
80.9% of women with births in Walker are unmarried. Women with the educational attainment of bachelor's degree are most likely to be married with 100.0% of them married at childbirth, while women with the educational attainment of high school diploma are least likely to be married with 100.0% of them unmarried at childbirth.
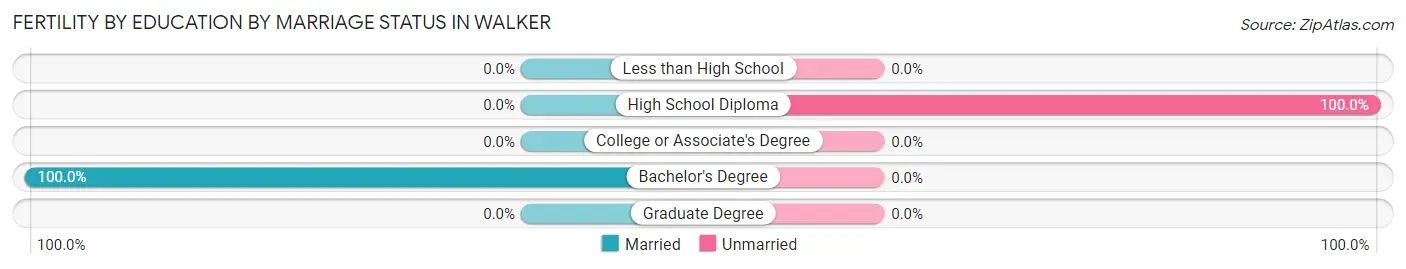
| Educational Attainment | Married | Unmarried |
| Less than High School | 0 (0.0%) | 0 (0.0%) |
| High School Diploma | 0 (0.0%) | 51 (100.0%) |
| College or Associate's Degree | 0 (0.0%) | 0 (0.0%) |
| Bachelor's Degree | 12 (100.0%) | 0 (0.0%) |
| Graduate Degree | 0 (0.0%) | 0 (0.0%) |
| Total | 12 (19.1%) | 51 (80.9%) |
Employment Characteristics in Walker
Employment by Class of Employer in Walker
Among the 2,995 employed individuals in Walker, private company employees (2,069 | 69.1%), local government employees (376 | 12.6%), and self-employed (not incorporated) (286 | 9.6%) make up the most common classes of employment.
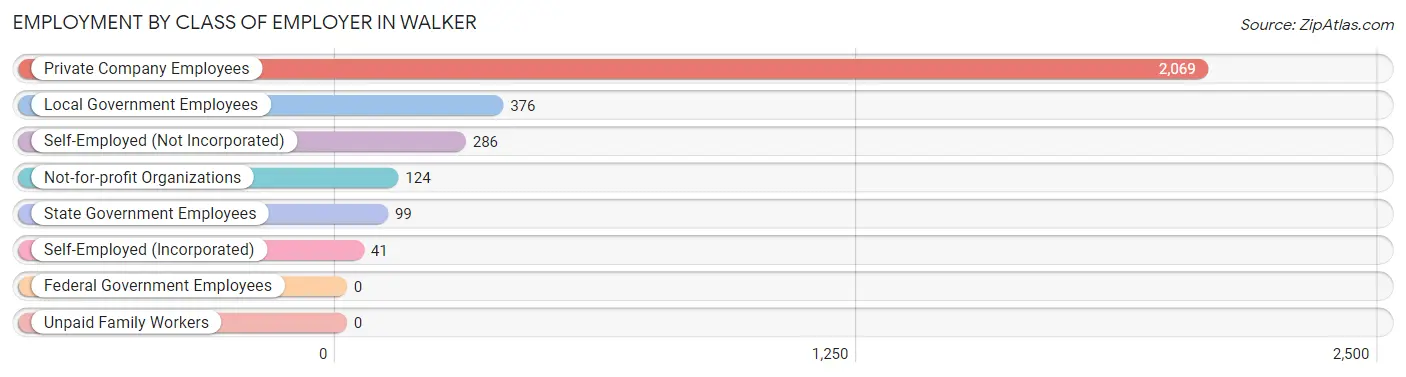
| Employer Class | # Employees | % Employees |
| Private Company Employees | 2,069 | 69.1% |
| Self-Employed (Incorporated) | 41 | 1.4% |
| Self-Employed (Not Incorporated) | 286 | 9.6% |
| Not-for-profit Organizations | 124 | 4.1% |
| Local Government Employees | 376 | 12.6% |
| State Government Employees | 99 | 3.3% |
| Federal Government Employees | 0 | 0.0% |
| Unpaid Family Workers | 0 | 0.0% |
| Total | 2,995 | 100.0% |
Employment Status by Age in Walker
According to the labor force statistics for Walker, out of the total population over 16 years of age (4,840), 64.2% or 3,107 individuals are in the labor force, with 3.3% or 103 of them unemployed. The age group with the highest labor force participation rate is 25 to 29 years, with 90.5% or 612 individuals in the labor force. Within the labor force, the 60 to 64 years age range has the highest percentage of unemployed individuals, with 37.4% or 89 of them being unemployed.
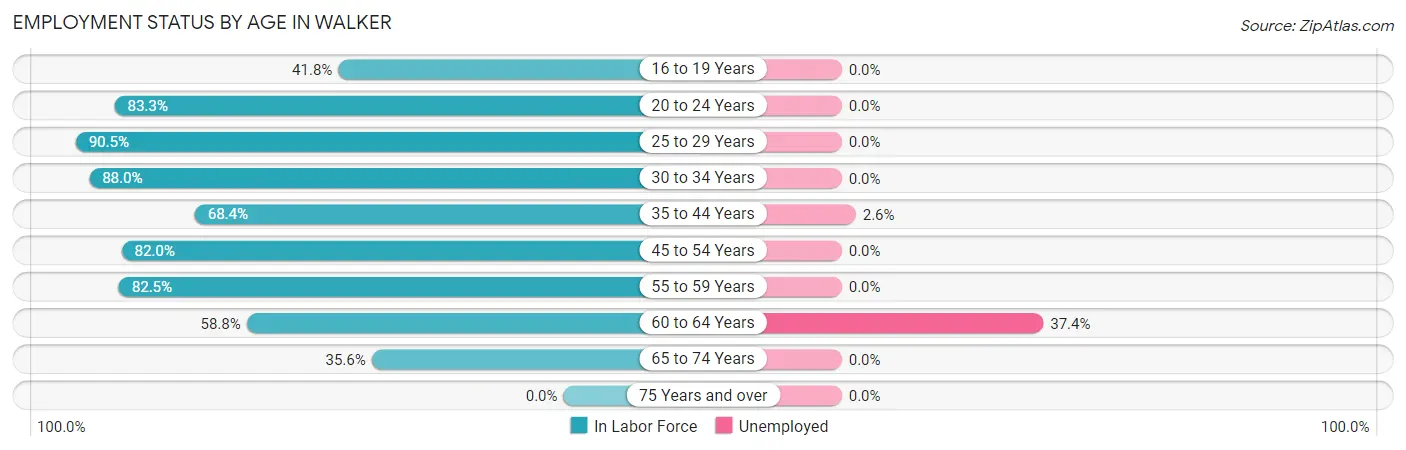
| Age Bracket | In Labor Force | Unemployed |
| 16 to 19 Years | 146 (41.8%) | 0 (0.0%) |
| 20 to 24 Years | 219 (83.3%) | 0 (0.0%) |
| 25 to 29 Years | 612 (90.5%) | 0 (0.0%) |
| 30 to 34 Years | 293 (88.0%) | 0 (0.0%) |
| 35 to 44 Years | 536 (68.4%) | 14 (2.6%) |
| 45 to 54 Years | 724 (82.0%) | 0 (0.0%) |
| 55 to 59 Years | 104 (82.5%) | 0 (0.0%) |
| 60 to 64 Years | 238 (58.8%) | 89 (37.4%) |
| 65 to 74 Years | 235 (35.6%) | 0 (0.0%) |
| 75 Years and over | 0 (0.0%) | 0 (0.0%) |
| Total | 3,107 (64.2%) | 103 (3.3%) |
Employment Status by Educational Attainment in Walker
According to labor force statistics for Walker, 78.2% of individuals (2,508) out of the total population between 25 and 64 years of age (3,207) are in the labor force, with 4.1% or 103 of them being unemployed. The group with the highest labor force participation rate are those with the educational attainment of college / associate degree, with 93.5% or 673 individuals in the labor force. Within the labor force, individuals with high school diploma education have the highest percentage of unemployment, with 8.5% or 88 of them being unemployed.
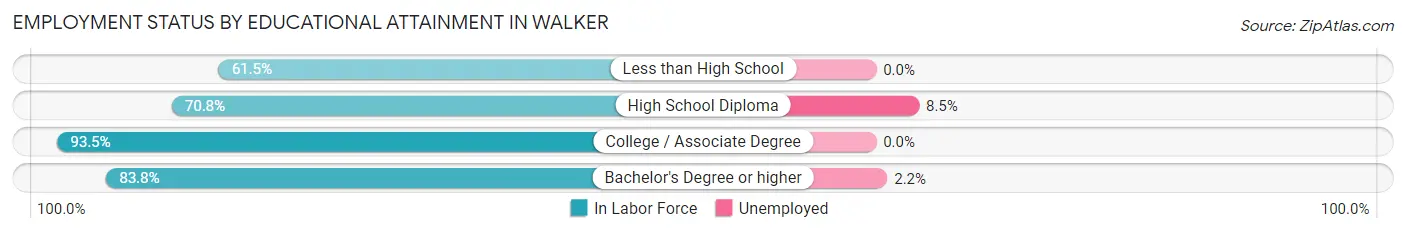
| Educational Attainment | In Labor Force | Unemployed |
| Less than High School | 161 (61.5%) | 0 (0.0%) |
| High School Diploma | 1,041 (70.8%) | 125 (8.5%) |
| College / Associate Degree | 673 (93.5%) | 0 (0.0%) |
| Bachelor's Degree or higher | 632 (83.8%) | 17 (2.2%) |
| Total | 2,508 (78.2%) | 131 (4.1%) |
Employment Occupations by Sex in Walker
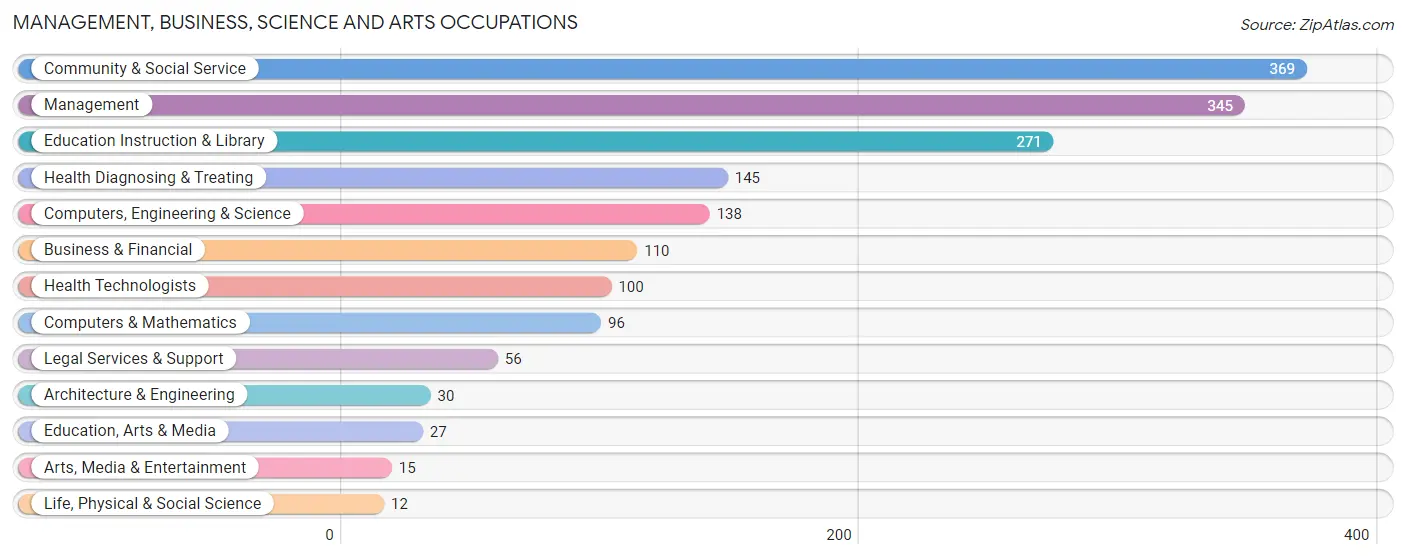
Management, Business, Science and Arts Occupations
The most common Management, Business, Science and Arts occupations in Walker are Community & Social Service (369 | 12.3%), Management (345 | 11.5%), Education Instruction & Library (271 | 9.0%), Health Diagnosing & Treating (145 | 4.8%), and Computers, Engineering & Science (138 | 4.6%).
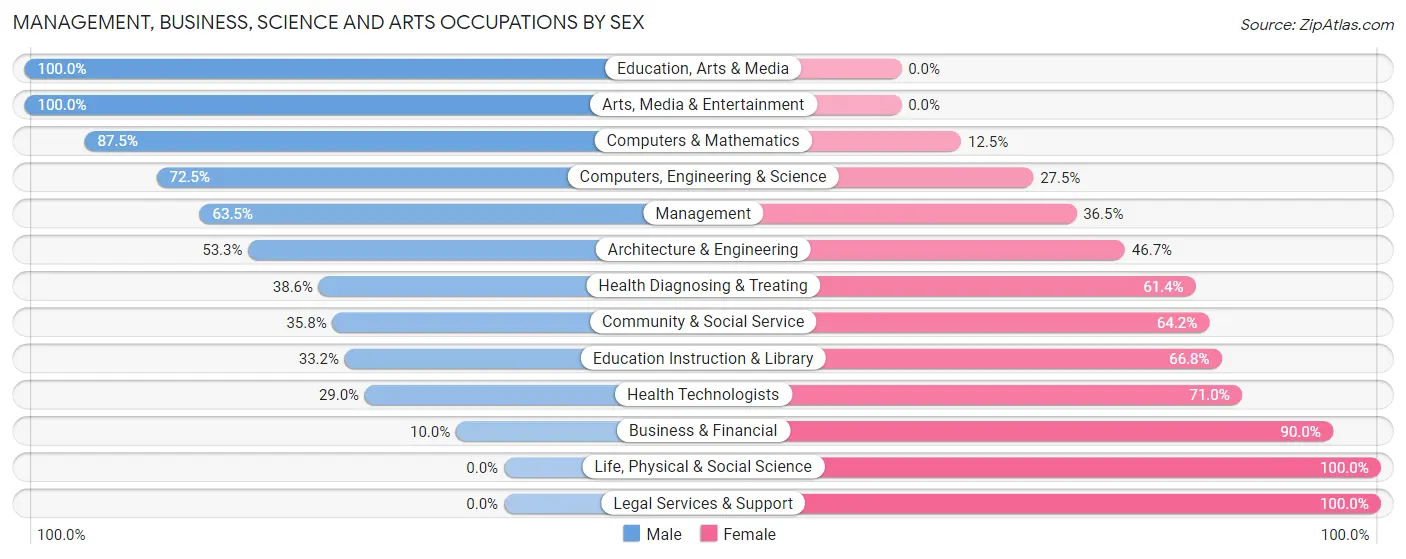
Management, Business, Science and Arts Occupations by Sex
Within the Management, Business, Science and Arts occupations in Walker, the most male-oriented occupations are Education, Arts & Media (100.0%), Arts, Media & Entertainment (100.0%), and Computers & Mathematics (87.5%), while the most female-oriented occupations are Life, Physical & Social Science (100.0%), Legal Services & Support (100.0%), and Business & Financial (90.0%).
| Occupation | Male | Female |
| Management | 219 (63.5%) | 126 (36.5%) |
| Business & Financial | 11 (10.0%) | 99 (90.0%) |
| Computers, Engineering & Science | 100 (72.5%) | 38 (27.5%) |
| Computers & Mathematics | 84 (87.5%) | 12 (12.5%) |
| Architecture & Engineering | 16 (53.3%) | 14 (46.7%) |
| Life, Physical & Social Science | 0 (0.0%) | 12 (100.0%) |
| Community & Social Service | 132 (35.8%) | 237 (64.2%) |
| Education, Arts & Media | 27 (100.0%) | 0 (0.0%) |
| Legal Services & Support | 0 (0.0%) | 56 (100.0%) |
| Education Instruction & Library | 90 (33.2%) | 181 (66.8%) |
| Arts, Media & Entertainment | 15 (100.0%) | 0 (0.0%) |
| Health Diagnosing & Treating | 56 (38.6%) | 89 (61.4%) |
| Health Technologists | 29 (29.0%) | 71 (71.0%) |
| Total (Category) | 518 (46.8%) | 589 (53.2%) |
| Total (Overall) | 1,594 (53.1%) | 1,410 (46.9%) |
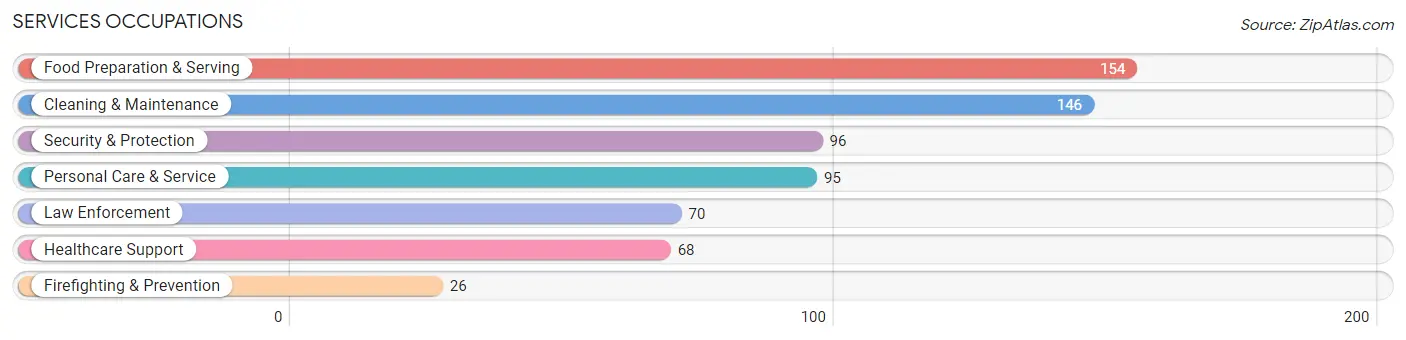
Services Occupations
The most common Services occupations in Walker are Food Preparation & Serving (154 | 5.1%), Cleaning & Maintenance (146 | 4.9%), Security & Protection (96 | 3.2%), Personal Care & Service (95 | 3.2%), and Law Enforcement (70 | 2.3%).
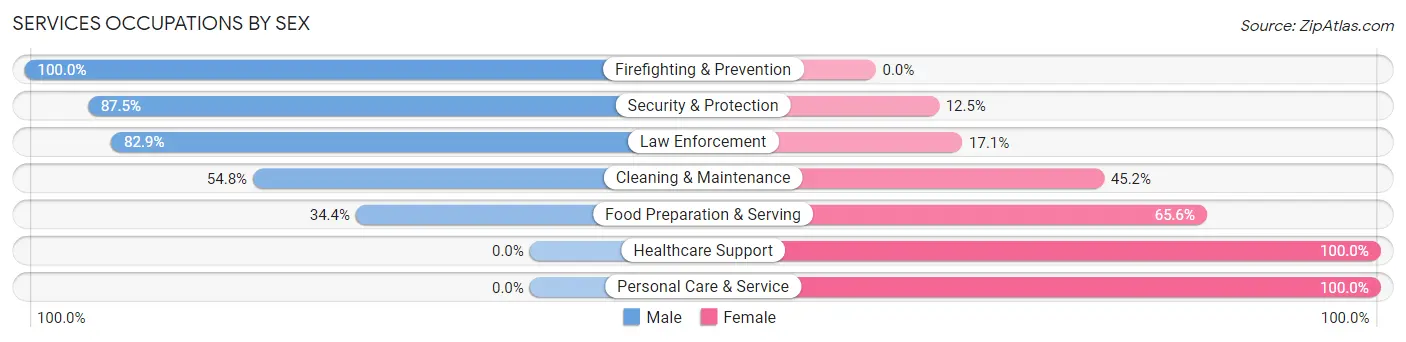
Services Occupations by Sex
Within the Services occupations in Walker, the most male-oriented occupations are Firefighting & Prevention (100.0%), Security & Protection (87.5%), and Law Enforcement (82.9%), while the most female-oriented occupations are Healthcare Support (100.0%), Personal Care & Service (100.0%), and Food Preparation & Serving (65.6%).
| Occupation | Male | Female |
| Healthcare Support | 0 (0.0%) | 68 (100.0%) |
| Security & Protection | 84 (87.5%) | 12 (12.5%) |
| Firefighting & Prevention | 26 (100.0%) | 0 (0.0%) |
| Law Enforcement | 58 (82.9%) | 12 (17.1%) |
| Food Preparation & Serving | 53 (34.4%) | 101 (65.6%) |
| Cleaning & Maintenance | 80 (54.8%) | 66 (45.2%) |
| Personal Care & Service | 0 (0.0%) | 95 (100.0%) |
| Total (Category) | 217 (38.8%) | 342 (61.2%) |
| Total (Overall) | 1,594 (53.1%) | 1,410 (46.9%) |
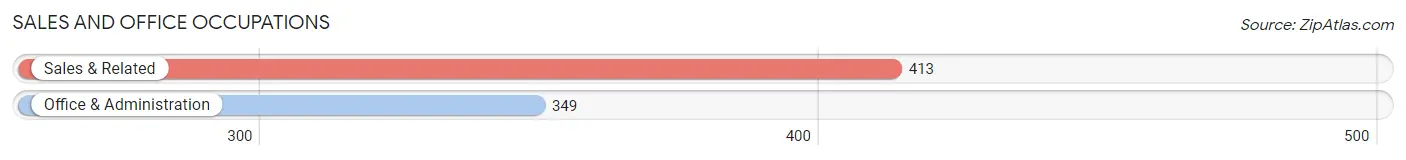
Sales and Office Occupations
The most common Sales and Office occupations in Walker are Sales & Related (413 | 13.8%), and Office & Administration (349 | 11.6%).
Sales and Office Occupations by Sex
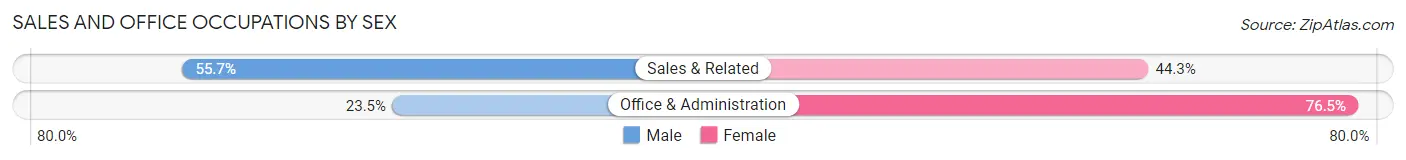
| Occupation | Male | Female |
| Sales & Related | 230 (55.7%) | 183 (44.3%) |
| Office & Administration | 82 (23.5%) | 267 (76.5%) |
| Total (Category) | 312 (40.9%) | 450 (59.1%) |
| Total (Overall) | 1,594 (53.1%) | 1,410 (46.9%) |
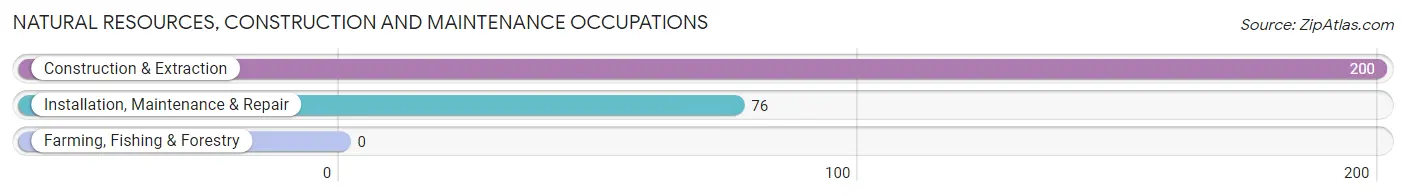
Natural Resources, Construction and Maintenance Occupations
The most common Natural Resources, Construction and Maintenance occupations in Walker are Construction & Extraction (200 | 6.7%), and Installation, Maintenance & Repair (76 | 2.5%).
Natural Resources, Construction and Maintenance Occupations by Sex
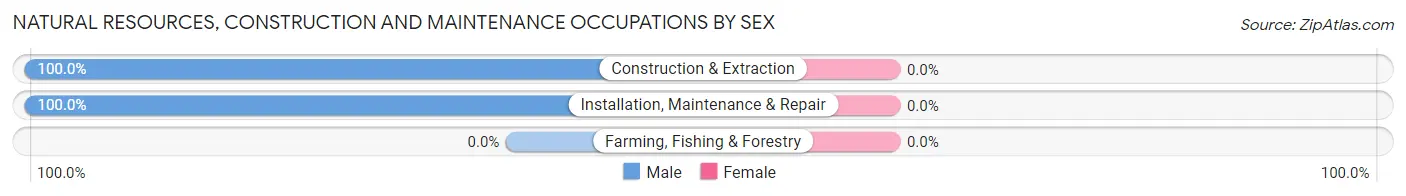
| Occupation | Male | Female |
| Farming, Fishing & Forestry | 0 (0.0%) | 0 (0.0%) |
| Construction & Extraction | 200 (100.0%) | 0 (0.0%) |
| Installation, Maintenance & Repair | 76 (100.0%) | 0 (0.0%) |
| Total (Category) | 276 (100.0%) | 0 (0.0%) |
| Total (Overall) | 1,594 (53.1%) | 1,410 (46.9%) |
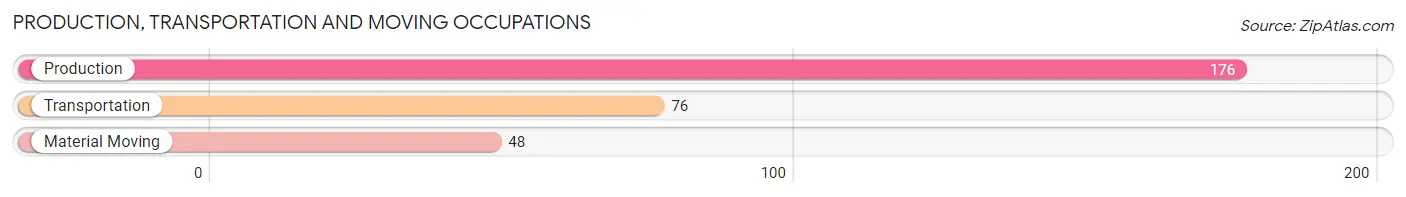
Production, Transportation and Moving Occupations
The most common Production, Transportation and Moving occupations in Walker are Production (176 | 5.9%), Transportation (76 | 2.5%), and Material Moving (48 | 1.6%).
Production, Transportation and Moving Occupations by Sex
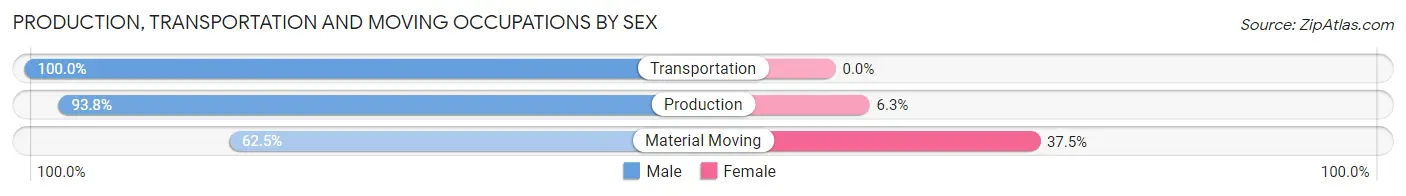
| Occupation | Male | Female |
| Production | 165 (93.8%) | 11 (6.2%) |
| Transportation | 76 (100.0%) | 0 (0.0%) |
| Material Moving | 30 (62.5%) | 18 (37.5%) |
| Total (Category) | 271 (90.3%) | 29 (9.7%) |
| Total (Overall) | 1,594 (53.1%) | 1,410 (46.9%) |
Employment Industries by Sex in Walker
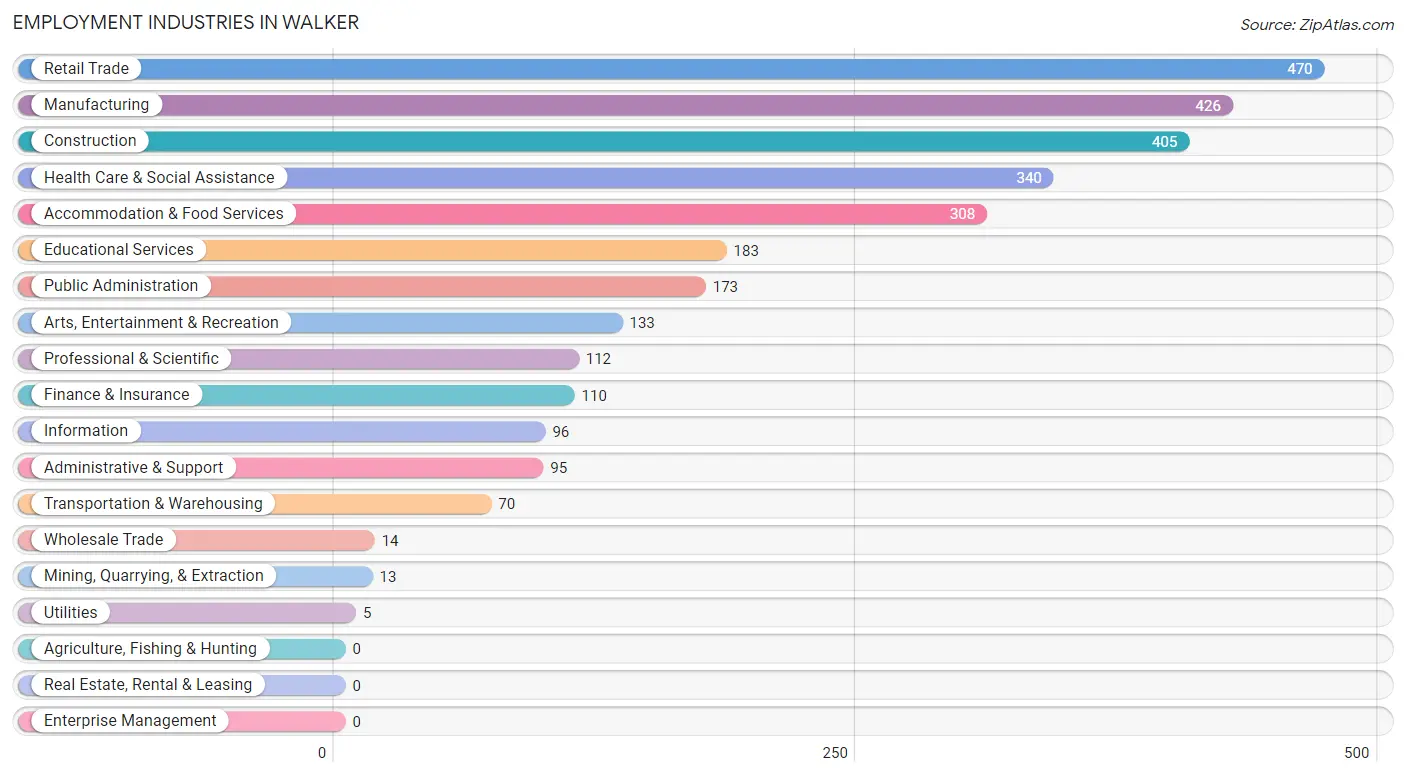
Employment Industries in Walker
The major employment industries in Walker include Retail Trade (470 | 15.7%), Manufacturing (426 | 14.2%), Construction (405 | 13.5%), Health Care & Social Assistance (340 | 11.3%), and Accommodation & Food Services (308 | 10.2%).
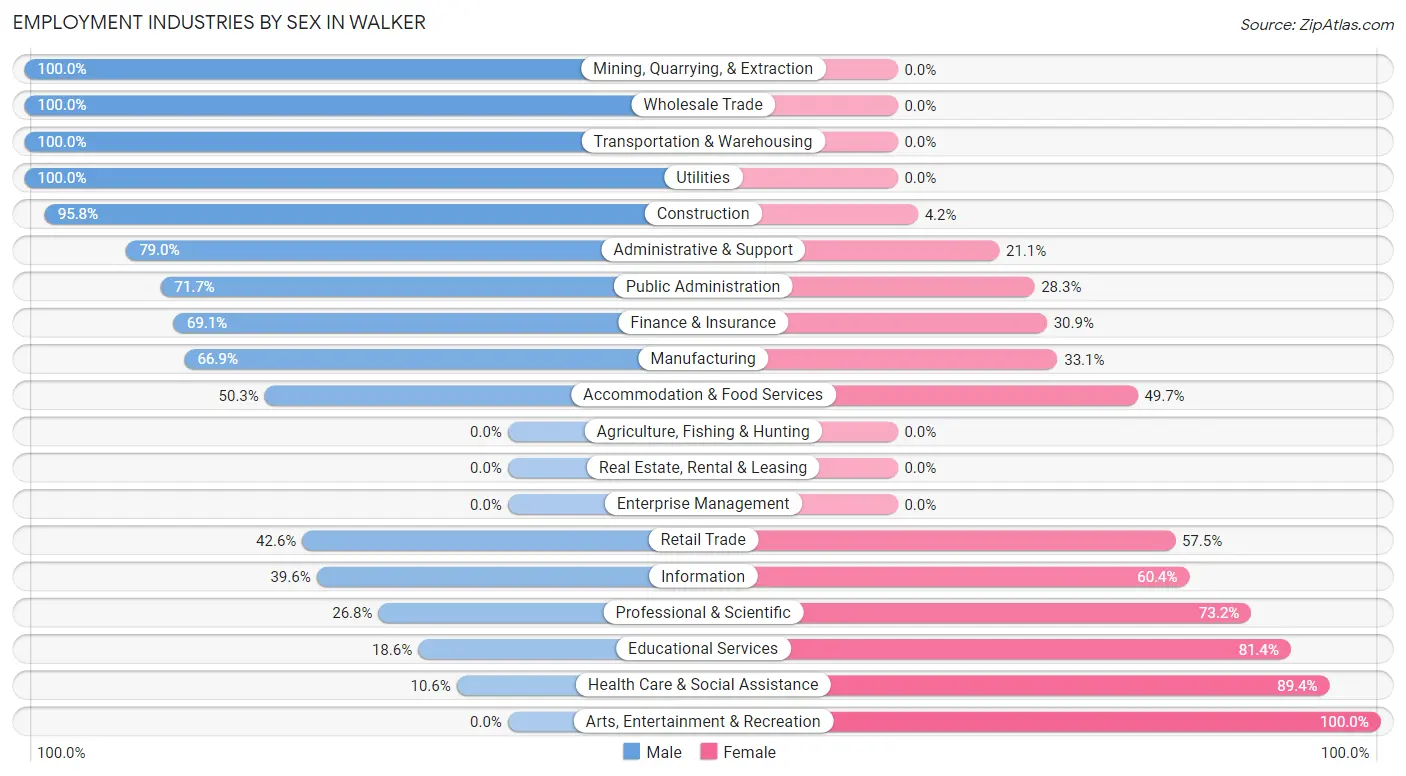
Employment Industries by Sex in Walker
The Walker industries that see more men than women are Mining, Quarrying, & Extraction (100.0%), Wholesale Trade (100.0%), and Transportation & Warehousing (100.0%), whereas the industries that tend to have a higher number of women are Arts, Entertainment & Recreation (100.0%), Health Care & Social Assistance (89.4%), and Educational Services (81.4%).
| Industry | Male | Female |
| Agriculture, Fishing & Hunting | 0 (0.0%) | 0 (0.0%) |
| Mining, Quarrying, & Extraction | 13 (100.0%) | 0 (0.0%) |
| Construction | 388 (95.8%) | 17 (4.2%) |
| Manufacturing | 285 (66.9%) | 141 (33.1%) |
| Wholesale Trade | 14 (100.0%) | 0 (0.0%) |
| Retail Trade | 200 (42.5%) | 270 (57.5%) |
| Transportation & Warehousing | 70 (100.0%) | 0 (0.0%) |
| Utilities | 5 (100.0%) | 0 (0.0%) |
| Information | 38 (39.6%) | 58 (60.4%) |
| Finance & Insurance | 76 (69.1%) | 34 (30.9%) |
| Real Estate, Rental & Leasing | 0 (0.0%) | 0 (0.0%) |
| Professional & Scientific | 30 (26.8%) | 82 (73.2%) |
| Enterprise Management | 0 (0.0%) | 0 (0.0%) |
| Administrative & Support | 75 (78.9%) | 20 (21.0%) |
| Educational Services | 34 (18.6%) | 149 (81.4%) |
| Health Care & Social Assistance | 36 (10.6%) | 304 (89.4%) |
| Arts, Entertainment & Recreation | 0 (0.0%) | 133 (100.0%) |
| Accommodation & Food Services | 155 (50.3%) | 153 (49.7%) |
| Public Administration | 124 (71.7%) | 49 (28.3%) |
| Total | 1,594 (53.1%) | 1,410 (46.9%) |
Education in Walker
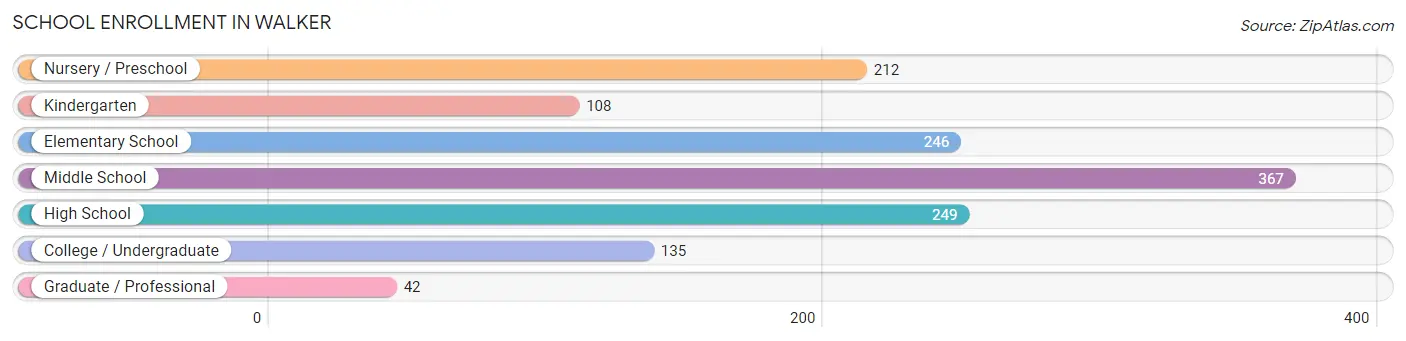
School Enrollment in Walker
The most common levels of schooling among the 1,359 students in Walker are middle school (367 | 27.0%), high school (249 | 18.3%), and elementary school (246 | 18.1%).
| School Level | # Students | % Students |
| Nursery / Preschool | 212 | 15.6% |
| Kindergarten | 108 | 8.0% |
| Elementary School | 246 | 18.1% |
| Middle School | 367 | 27.0% |
| High School | 249 | 18.3% |
| College / Undergraduate | 135 | 9.9% |
| Graduate / Professional | 42 | 3.1% |
| Total | 1,359 | 100.0% |
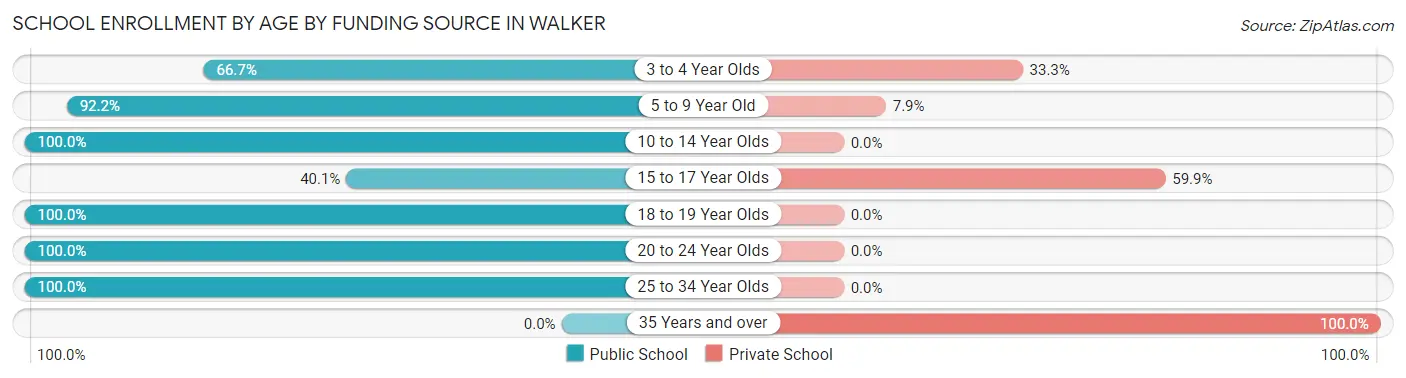
School Enrollment by Age by Funding Source in Walker
Out of a total of 1,359 students who are enrolled in schools in Walker, 213 (15.7%) attend a private institution, while the remaining 1,146 (84.3%) are enrolled in public schools. The age group of 35 years and over has the highest likelihood of being enrolled in private schools, with 27 (100.0% in the age bracket) enrolled. Conversely, the age group of 10 to 14 year olds has the lowest likelihood of being enrolled in a private school, with 409 (100.0% in the age bracket) attending a public institution.
| Age Bracket | Public School | Private School |
| 3 to 4 Year Olds | 46 (66.7%) | 23 (33.3%) |
| 5 to 9 Year Old | 458 (92.1%) | 39 (7.9%) |
| 10 to 14 Year Olds | 409 (100.0%) | 0 (0.0%) |
| 15 to 17 Year Olds | 83 (40.1%) | 124 (59.9%) |
| 18 to 19 Year Olds | 77 (100.0%) | 0 (0.0%) |
| 20 to 24 Year Olds | 58 (100.0%) | 0 (0.0%) |
| 25 to 34 Year Olds | 15 (100.0%) | 0 (0.0%) |
| 35 Years and over | 0 (0.0%) | 27 (100.0%) |
| Total | 1,146 (84.3%) | 213 (15.7%) |
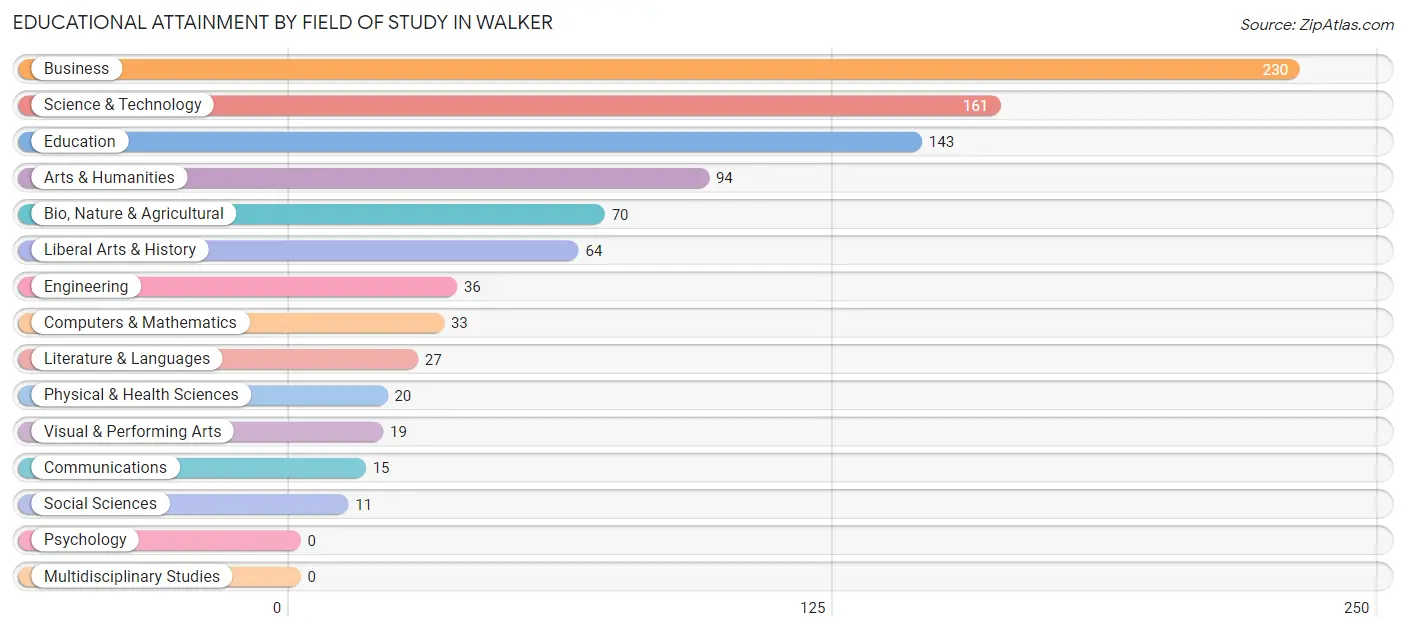
Educational Attainment by Field of Study in Walker
Business (230 | 24.9%), science & technology (161 | 17.4%), education (143 | 15.5%), arts & humanities (94 | 10.2%), and bio, nature & agricultural (70 | 7.6%) are the most common fields of study among 923 individuals in Walker who have obtained a bachelor's degree or higher.
| Field of Study | # Graduates | % Graduates |
| Computers & Mathematics | 33 | 3.6% |
| Bio, Nature & Agricultural | 70 | 7.6% |
| Physical & Health Sciences | 20 | 2.2% |
| Psychology | 0 | 0.0% |
| Social Sciences | 11 | 1.2% |
| Engineering | 36 | 3.9% |
| Multidisciplinary Studies | 0 | 0.0% |
| Science & Technology | 161 | 17.4% |
| Business | 230 | 24.9% |
| Education | 143 | 15.5% |
| Literature & Languages | 27 | 2.9% |
| Liberal Arts & History | 64 | 6.9% |
| Visual & Performing Arts | 19 | 2.1% |
| Communications | 15 | 1.6% |
| Arts & Humanities | 94 | 10.2% |
| Total | 923 | 100.0% |
Transportation & Commute in Walker
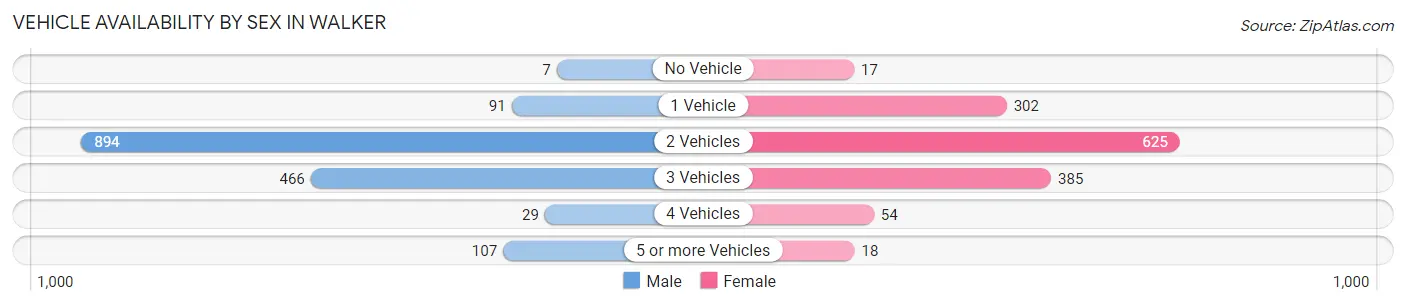
Vehicle Availability by Sex in Walker
The most prevalent vehicle ownership categories in Walker are males with 2 vehicles (894, accounting for 56.1%) and females with 2 vehicles (625, making up 63.8%).
| Vehicles Available | Male | Female |
| No Vehicle | 7 (0.4%) | 17 (1.2%) |
| 1 Vehicle | 91 (5.7%) | 302 (21.6%) |
| 2 Vehicles | 894 (56.1%) | 625 (44.6%) |
| 3 Vehicles | 466 (29.2%) | 385 (27.5%) |
| 4 Vehicles | 29 (1.8%) | 54 (3.8%) |
| 5 or more Vehicles | 107 (6.7%) | 18 (1.3%) |
| Total | 1,594 (100.0%) | 1,401 (100.0%) |
Commute Time in Walker
The most frequently occuring commute durations in Walker are 30 to 34 minutes (568 commuters, 20.2%), 10 to 14 minutes (552 commuters, 19.6%), and 45 to 59 minutes (426 commuters, 15.1%).
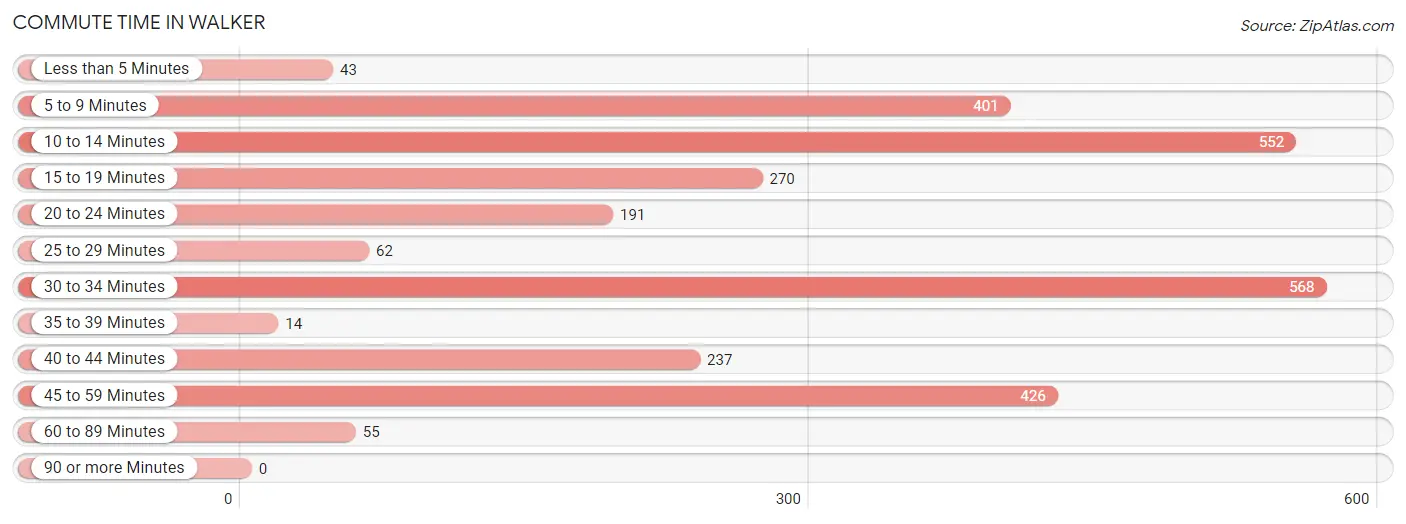
| Commute Time | # Commuters | % Commuters |
| Less than 5 Minutes | 43 | 1.5% |
| 5 to 9 Minutes | 401 | 14.2% |
| 10 to 14 Minutes | 552 | 19.6% |
| 15 to 19 Minutes | 270 | 9.6% |
| 20 to 24 Minutes | 191 | 6.8% |
| 25 to 29 Minutes | 62 | 2.2% |
| 30 to 34 Minutes | 568 | 20.2% |
| 35 to 39 Minutes | 14 | 0.5% |
| 40 to 44 Minutes | 237 | 8.4% |
| 45 to 59 Minutes | 426 | 15.1% |
| 60 to 89 Minutes | 55 | 1.9% |
| 90 or more Minutes | 0 | 0.0% |
Commute Time by Sex in Walker
The most common commute times in Walker are 30 to 34 minutes (435 commuters, 28.5%) for males and 5 to 9 minutes (267 commuters, 20.6%) for females.
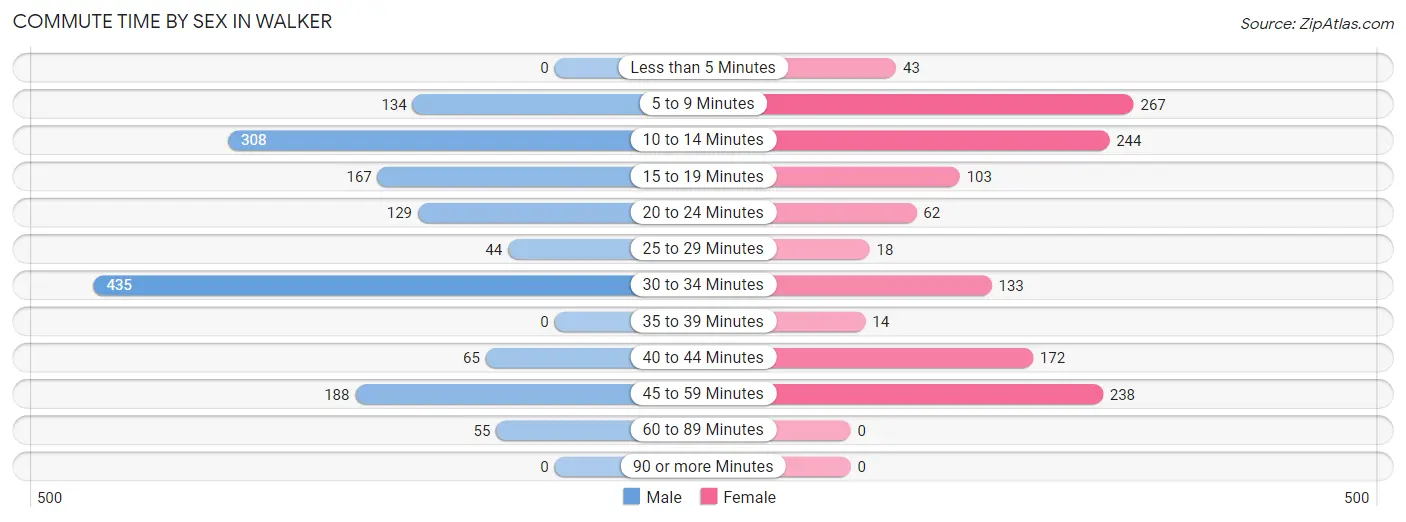
| Commute Time | Male | Female |
| Less than 5 Minutes | 0 (0.0%) | 43 (3.3%) |
| 5 to 9 Minutes | 134 (8.8%) | 267 (20.6%) |
| 10 to 14 Minutes | 308 (20.2%) | 244 (18.9%) |
| 15 to 19 Minutes | 167 (11.0%) | 103 (8.0%) |
| 20 to 24 Minutes | 129 (8.5%) | 62 (4.8%) |
| 25 to 29 Minutes | 44 (2.9%) | 18 (1.4%) |
| 30 to 34 Minutes | 435 (28.5%) | 133 (10.3%) |
| 35 to 39 Minutes | 0 (0.0%) | 14 (1.1%) |
| 40 to 44 Minutes | 65 (4.3%) | 172 (13.3%) |
| 45 to 59 Minutes | 188 (12.3%) | 238 (18.4%) |
| 60 to 89 Minutes | 55 (3.6%) | 0 (0.0%) |
| 90 or more Minutes | 0 (0.0%) | 0 (0.0%) |
Time of Departure to Work by Sex in Walker
The most frequent times of departure to work in Walker are 7:30 AM to 7:59 AM (245, 16.1%) for males and 7:30 AM to 7:59 AM (186, 14.4%) for females.
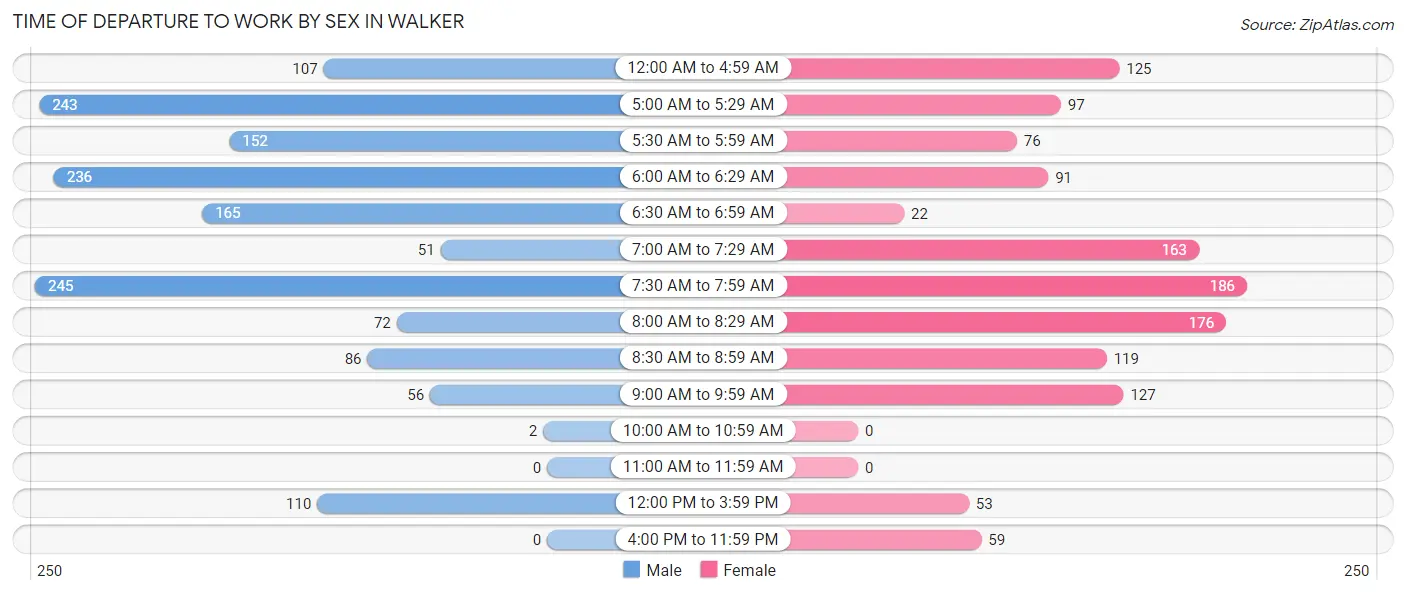
| Time of Departure | Male | Female |
| 12:00 AM to 4:59 AM | 107 (7.0%) | 125 (9.7%) |
| 5:00 AM to 5:29 AM | 243 (15.9%) | 97 (7.5%) |
| 5:30 AM to 5:59 AM | 152 (10.0%) | 76 (5.9%) |
| 6:00 AM to 6:29 AM | 236 (15.5%) | 91 (7.0%) |
| 6:30 AM to 6:59 AM | 165 (10.8%) | 22 (1.7%) |
| 7:00 AM to 7:29 AM | 51 (3.3%) | 163 (12.6%) |
| 7:30 AM to 7:59 AM | 245 (16.1%) | 186 (14.4%) |
| 8:00 AM to 8:29 AM | 72 (4.7%) | 176 (13.6%) |
| 8:30 AM to 8:59 AM | 86 (5.6%) | 119 (9.2%) |
| 9:00 AM to 9:59 AM | 56 (3.7%) | 127 (9.8%) |
| 10:00 AM to 10:59 AM | 2 (0.1%) | 0 (0.0%) |
| 11:00 AM to 11:59 AM | 0 (0.0%) | 0 (0.0%) |
| 12:00 PM to 3:59 PM | 110 (7.2%) | 53 (4.1%) |
| 4:00 PM to 11:59 PM | 0 (0.0%) | 59 (4.6%) |
| Total | 1,525 (100.0%) | 1,294 (100.0%) |
Housing Occupancy in Walker
Occupancy by Ownership in Walker
Of the total 2,403 dwellings in Walker, owner-occupied units account for 1,884 (78.4%), while renter-occupied units make up 519 (21.6%).
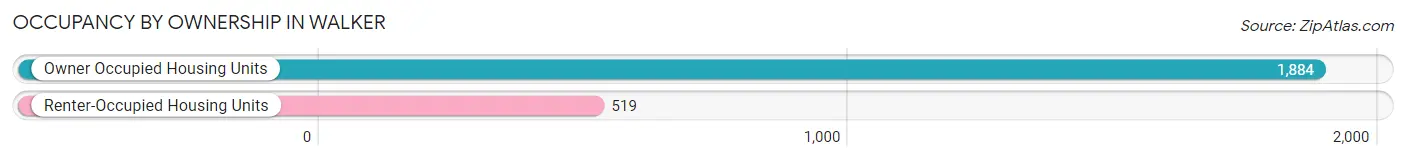
| Occupancy | # Housing Units | % Housing Units |
| Owner Occupied Housing Units | 1,884 | 78.4% |
| Renter-Occupied Housing Units | 519 | 21.6% |
| Total Occupied Housing Units | 2,403 | 100.0% |
Occupancy by Household Size in Walker
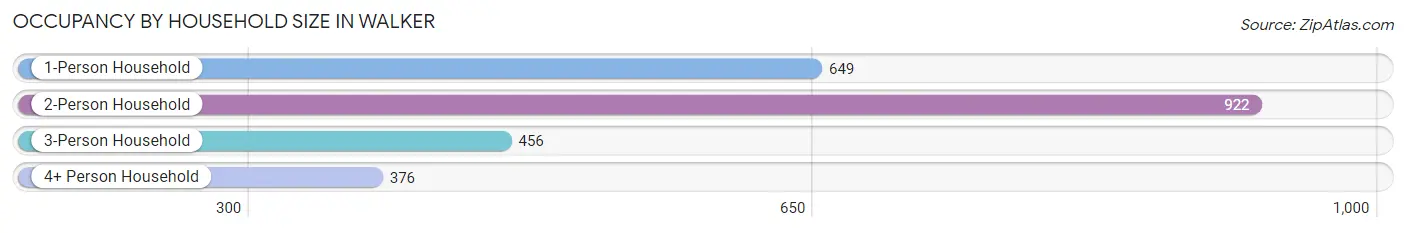
| Household Size | # Housing Units | % Housing Units |
| 1-Person Household | 649 | 27.0% |
| 2-Person Household | 922 | 38.4% |
| 3-Person Household | 456 | 19.0% |
| 4+ Person Household | 376 | 15.7% |
| Total Housing Units | 2,403 | 100.0% |
Occupancy by Ownership by Household Size in Walker
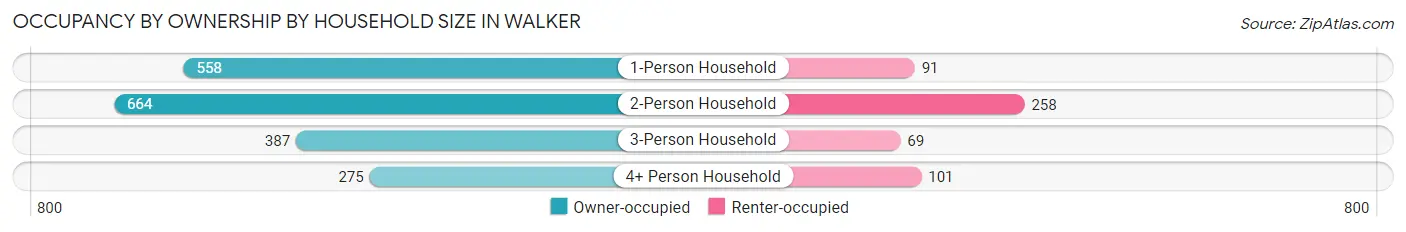
| Household Size | Owner-occupied | Renter-occupied |
| 1-Person Household | 558 (86.0%) | 91 (14.0%) |
| 2-Person Household | 664 (72.0%) | 258 (28.0%) |
| 3-Person Household | 387 (84.9%) | 69 (15.1%) |
| 4+ Person Household | 275 (73.1%) | 101 (26.9%) |
| Total Housing Units | 1,884 (78.4%) | 519 (21.6%) |
Occupancy by Educational Attainment in Walker
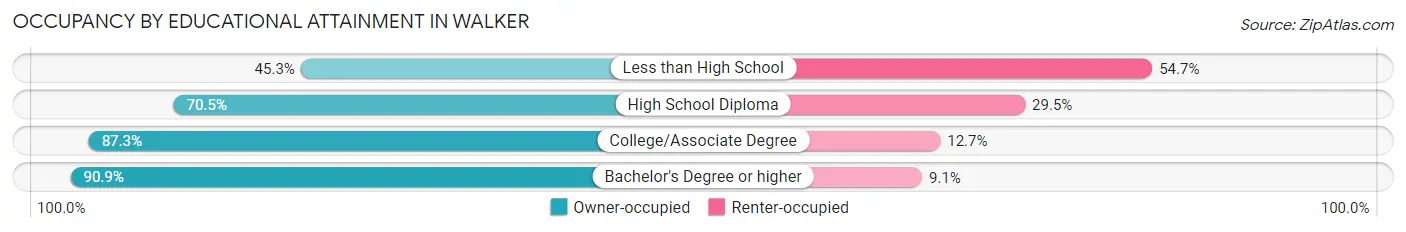
| Household Size | Owner-occupied | Renter-occupied |
| Less than High School | 91 (45.3%) | 110 (54.7%) |
| High School Diploma | 625 (70.5%) | 262 (29.5%) |
| College/Associate Degree | 659 (87.3%) | 96 (12.7%) |
| Bachelor's Degree or higher | 509 (90.9%) | 51 (9.1%) |
Occupancy by Age of Householder in Walker
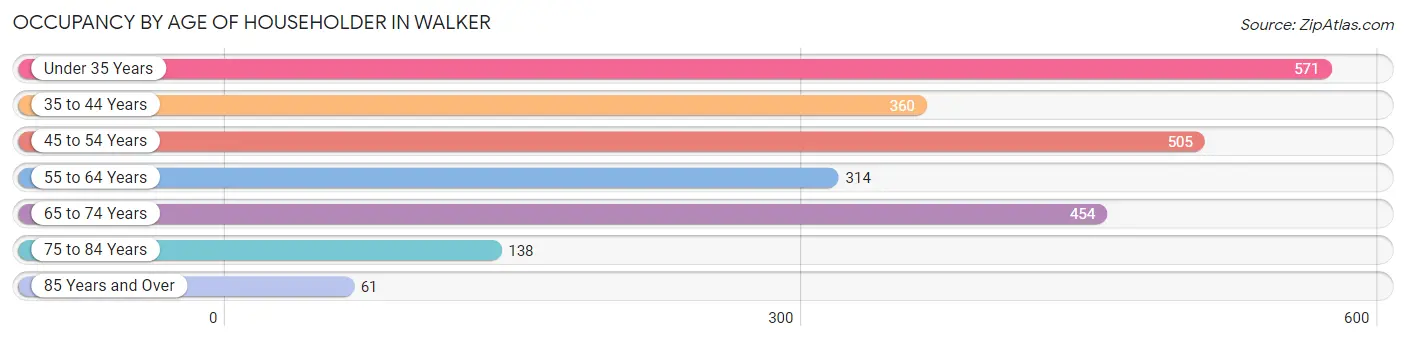
| Age Bracket | # Households | % Households |
| Under 35 Years | 571 | 23.8% |
| 35 to 44 Years | 360 | 15.0% |
| 45 to 54 Years | 505 | 21.0% |
| 55 to 64 Years | 314 | 13.1% |
| 65 to 74 Years | 454 | 18.9% |
| 75 to 84 Years | 138 | 5.7% |
| 85 Years and Over | 61 | 2.5% |
| Total | 2,403 | 100.0% |
Housing Finances in Walker
Median Income by Occupancy in Walker
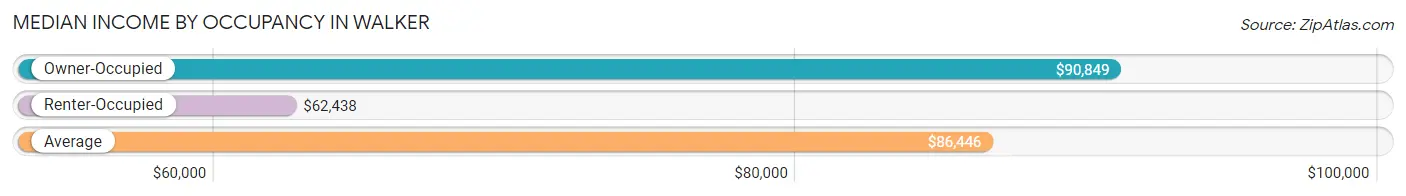
| Occupancy Type | # Households | Median Income |
| Owner-Occupied | 1,884 (78.4%) | $90,849 |
| Renter-Occupied | 519 (21.6%) | $62,438 |
| Average | 2,403 (100.0%) | $86,446 |
Occupancy by Householder Income Bracket in Walker
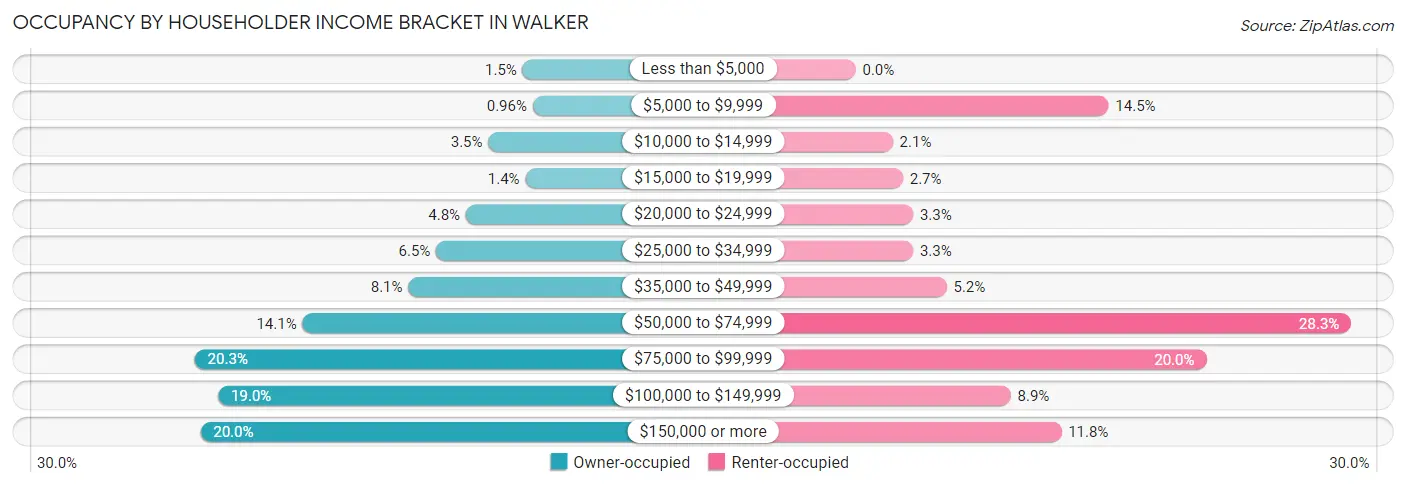
| Income Bracket | Owner-occupied | Renter-occupied |
| Less than $5,000 | 29 (1.5%) | 0 (0.0%) |
| $5,000 to $9,999 | 18 (1.0%) | 75 (14.4%) |
| $10,000 to $14,999 | 66 (3.5%) | 11 (2.1%) |
| $15,000 to $19,999 | 26 (1.4%) | 14 (2.7%) |
| $20,000 to $24,999 | 90 (4.8%) | 17 (3.3%) |
| $25,000 to $34,999 | 122 (6.5%) | 17 (3.3%) |
| $35,000 to $49,999 | 152 (8.1%) | 27 (5.2%) |
| $50,000 to $74,999 | 266 (14.1%) | 147 (28.3%) |
| $75,000 to $99,999 | 382 (20.3%) | 104 (20.0%) |
| $100,000 to $149,999 | 357 (19.0%) | 46 (8.9%) |
| $150,000 or more | 376 (20.0%) | 61 (11.7%) |
| Total | 1,884 (100.0%) | 519 (100.0%) |
Monthly Housing Cost Tiers in Walker
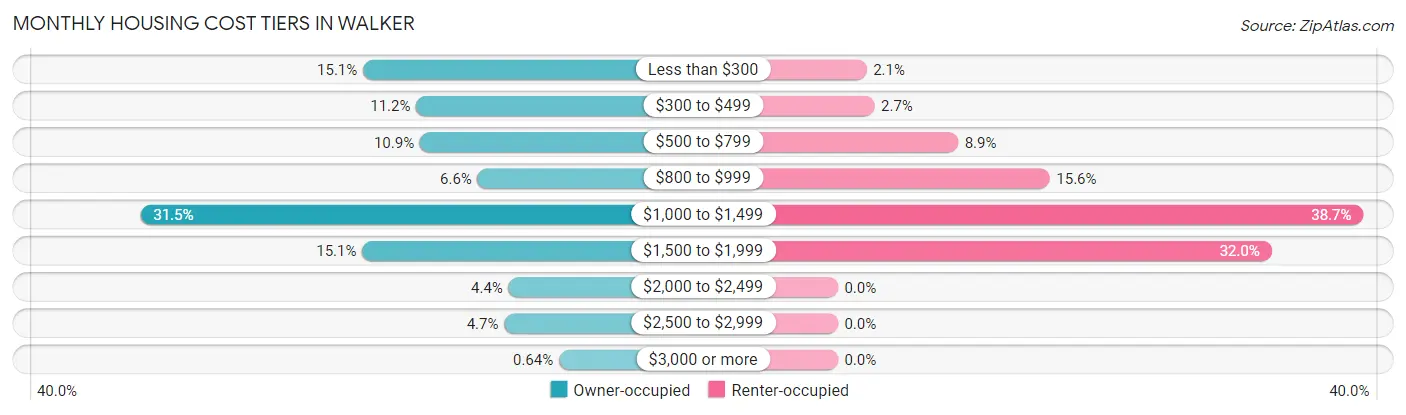
| Monthly Cost | Owner-occupied | Renter-occupied |
| Less than $300 | 284 (15.1%) | 11 (2.1%) |
| $300 to $499 | 210 (11.2%) | 14 (2.7%) |
| $500 to $799 | 205 (10.9%) | 46 (8.9%) |
| $800 to $999 | 125 (6.6%) | 81 (15.6%) |
| $1,000 to $1,499 | 593 (31.5%) | 201 (38.7%) |
| $1,500 to $1,999 | 285 (15.1%) | 166 (32.0%) |
| $2,000 to $2,499 | 82 (4.3%) | 0 (0.0%) |
| $2,500 to $2,999 | 88 (4.7%) | 0 (0.0%) |
| $3,000 or more | 12 (0.6%) | 0 (0.0%) |
| Total | 1,884 (100.0%) | 519 (100.0%) |
Physical Housing Characteristics in Walker
Housing Structures in Walker
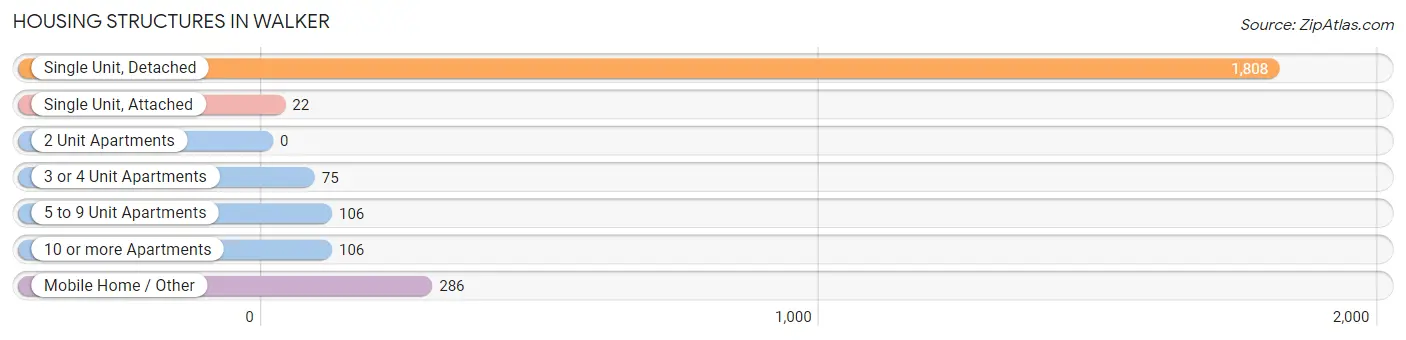
| Structure Type | # Housing Units | % Housing Units |
| Single Unit, Detached | 1,808 | 75.2% |
| Single Unit, Attached | 22 | 0.9% |
| 2 Unit Apartments | 0 | 0.0% |
| 3 or 4 Unit Apartments | 75 | 3.1% |
| 5 to 9 Unit Apartments | 106 | 4.4% |
| 10 or more Apartments | 106 | 4.4% |
| Mobile Home / Other | 286 | 11.9% |
| Total | 2,403 | 100.0% |
Housing Structures by Occupancy in Walker
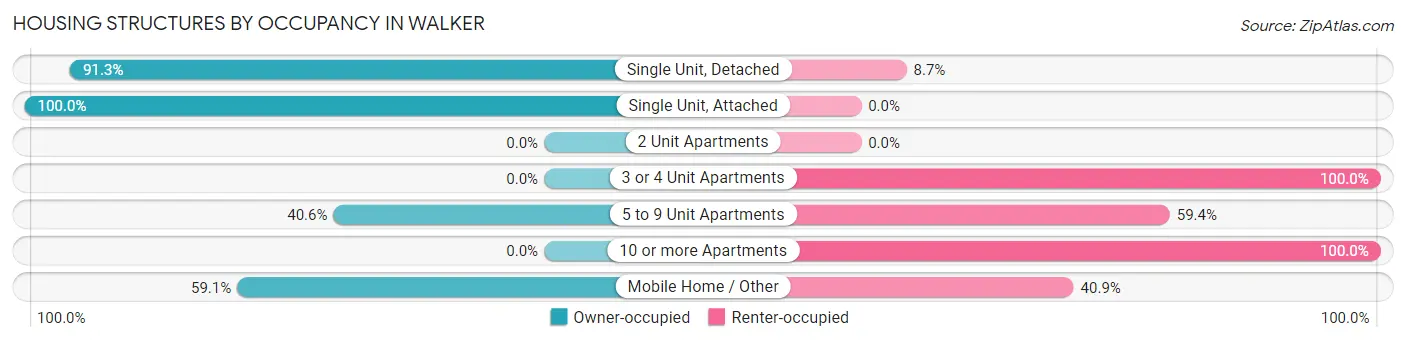
| Structure Type | Owner-occupied | Renter-occupied |
| Single Unit, Detached | 1,650 (91.3%) | 158 (8.7%) |
| Single Unit, Attached | 22 (100.0%) | 0 (0.0%) |
| 2 Unit Apartments | 0 (0.0%) | 0 (0.0%) |
| 3 or 4 Unit Apartments | 0 (0.0%) | 75 (100.0%) |
| 5 to 9 Unit Apartments | 43 (40.6%) | 63 (59.4%) |
| 10 or more Apartments | 0 (0.0%) | 106 (100.0%) |
| Mobile Home / Other | 169 (59.1%) | 117 (40.9%) |
| Total | 1,884 (78.4%) | 519 (21.6%) |
Housing Structures by Number of Rooms in Walker
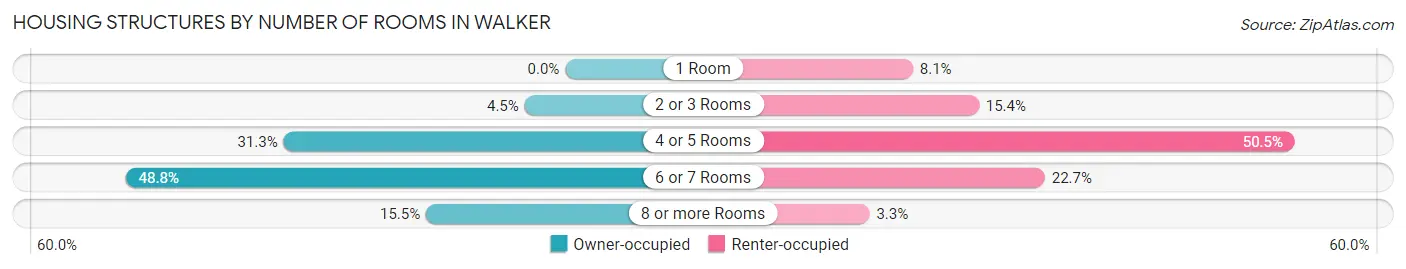
| Number of Rooms | Owner-occupied | Renter-occupied |
| 1 Room | 0 (0.0%) | 42 (8.1%) |
| 2 or 3 Rooms | 85 (4.5%) | 80 (15.4%) |
| 4 or 5 Rooms | 589 (31.3%) | 262 (50.5%) |
| 6 or 7 Rooms | 919 (48.8%) | 118 (22.7%) |
| 8 or more Rooms | 291 (15.4%) | 17 (3.3%) |
| Total | 1,884 (100.0%) | 519 (100.0%) |
Housing Structure by Heating Type in Walker
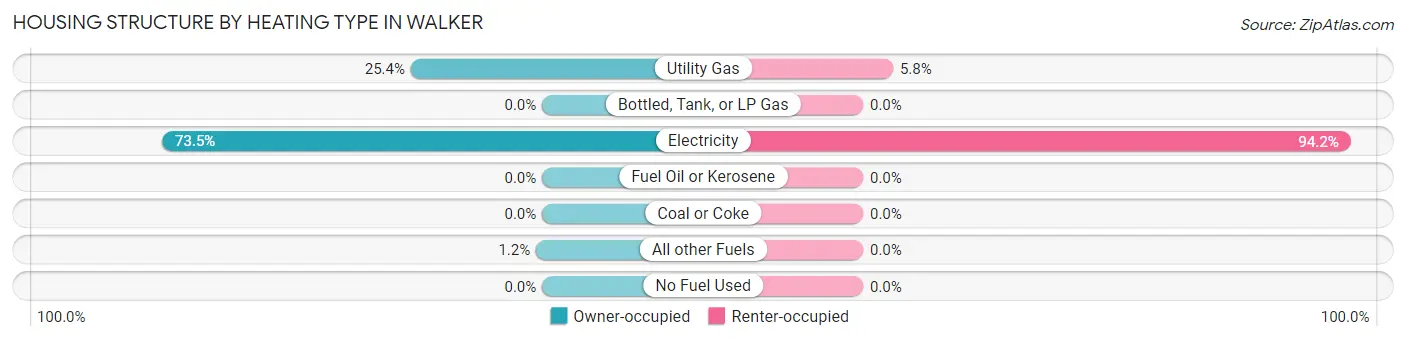
| Heating Type | Owner-occupied | Renter-occupied |
| Utility Gas | 478 (25.4%) | 30 (5.8%) |
| Bottled, Tank, or LP Gas | 0 (0.0%) | 0 (0.0%) |
| Electricity | 1,384 (73.5%) | 489 (94.2%) |
| Fuel Oil or Kerosene | 0 (0.0%) | 0 (0.0%) |
| Coal or Coke | 0 (0.0%) | 0 (0.0%) |
| All other Fuels | 22 (1.2%) | 0 (0.0%) |
| No Fuel Used | 0 (0.0%) | 0 (0.0%) |
| Total | 1,884 (100.0%) | 519 (100.0%) |
Household Vehicle Usage in Walker
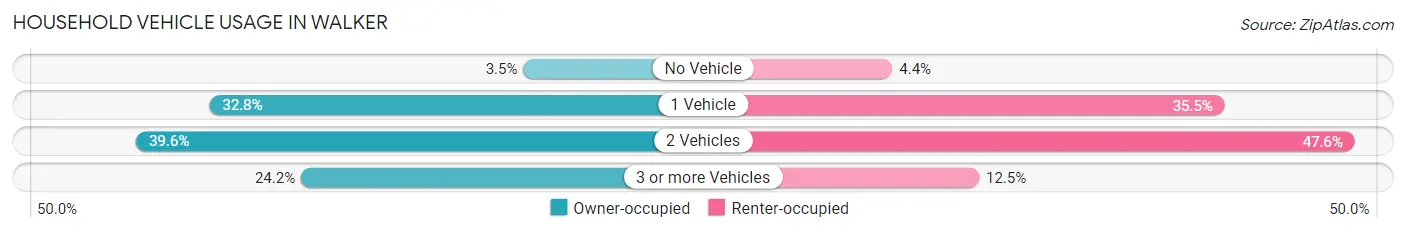
| Vehicles per Household | Owner-occupied | Renter-occupied |
| No Vehicle | 65 (3.5%) | 23 (4.4%) |
| 1 Vehicle | 617 (32.8%) | 184 (35.4%) |
| 2 Vehicles | 746 (39.6%) | 247 (47.6%) |
| 3 or more Vehicles | 456 (24.2%) | 65 (12.5%) |
| Total | 1,884 (100.0%) | 519 (100.0%) |
Real Estate & Mortgages in Walker
Real Estate and Mortgage Overview in Walker
| Characteristic | Without Mortgage | With Mortgage |
| Housing Units | 686 | 1,198 |
| Median Property Value | $210,000 | $182,500 |
| Median Household Income | $70,333 | $231 |
| Monthly Housing Costs | $336 | $12 |
| Real Estate Taxes | $743 | $61 |
Property Value by Mortgage Status in Walker
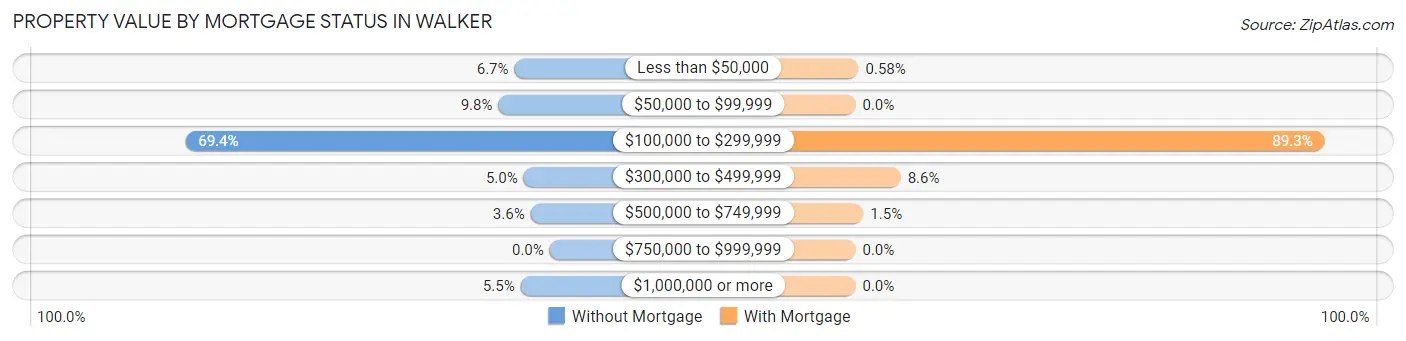
| Property Value | Without Mortgage | With Mortgage |
| Less than $50,000 | 46 (6.7%) | 7 (0.6%) |
| $50,000 to $99,999 | 67 (9.8%) | 0 (0.0%) |
| $100,000 to $299,999 | 476 (69.4%) | 1,070 (89.3%) |
| $300,000 to $499,999 | 34 (5.0%) | 103 (8.6%) |
| $500,000 to $749,999 | 25 (3.6%) | 18 (1.5%) |
| $750,000 to $999,999 | 0 (0.0%) | 0 (0.0%) |
| $1,000,000 or more | 38 (5.5%) | 0 (0.0%) |
| Total | 686 (100.0%) | 1,198 (100.0%) |
Household Income by Mortgage Status in Walker
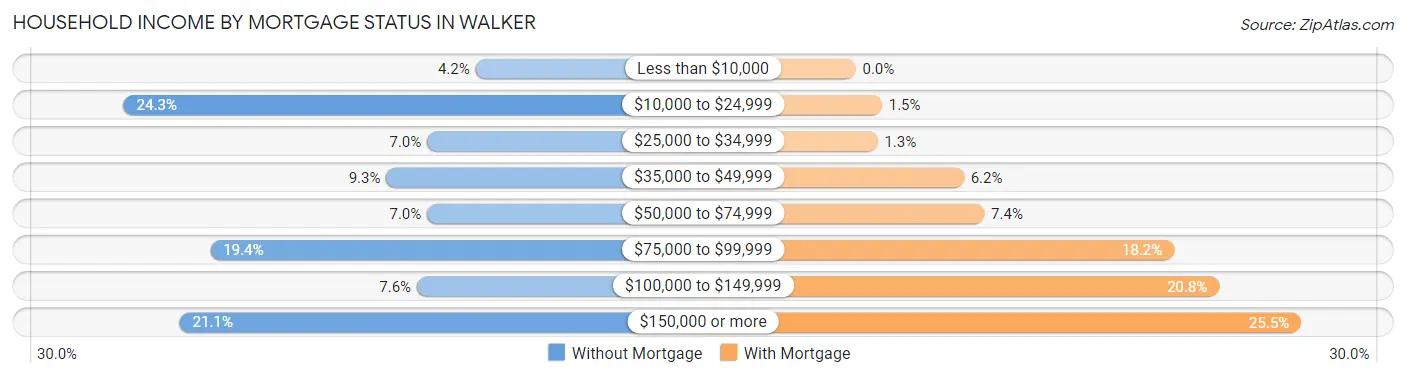
| Household Income | Without Mortgage | With Mortgage |
| Less than $10,000 | 29 (4.2%) | 0 (0.0%) |
| $10,000 to $24,999 | 167 (24.3%) | 18 (1.5%) |
| $25,000 to $34,999 | 48 (7.0%) | 15 (1.3%) |
| $35,000 to $49,999 | 64 (9.3%) | 74 (6.2%) |
| $50,000 to $74,999 | 48 (7.0%) | 88 (7.3%) |
| $75,000 to $99,999 | 133 (19.4%) | 218 (18.2%) |
| $100,000 to $149,999 | 52 (7.6%) | 249 (20.8%) |
| $150,000 or more | 145 (21.1%) | 305 (25.5%) |
| Total | 686 (100.0%) | 1,198 (100.0%) |
Property Value to Household Income Ratio in Walker
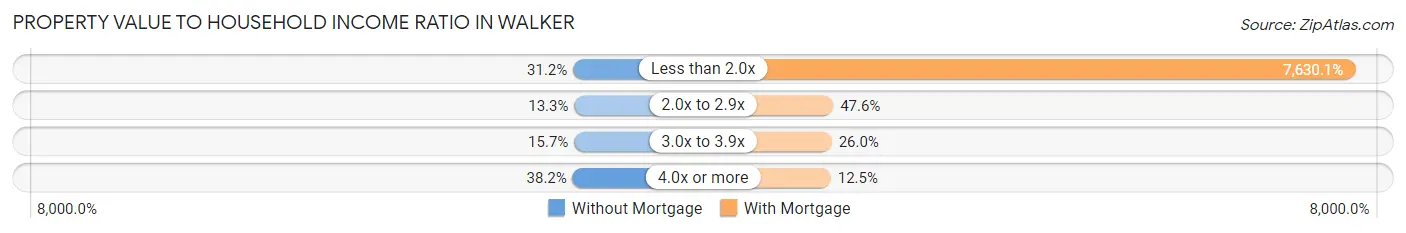
| Value-to-Income Ratio | Without Mortgage | With Mortgage |
| Less than 2.0x | 214 (31.2%) | 91,408 (7,630.0%) |
| 2.0x to 2.9x | 91 (13.3%) | 570 (47.6%) |
| 3.0x to 3.9x | 108 (15.7%) | 311 (26.0%) |
| 4.0x or more | 262 (38.2%) | 150 (12.5%) |
| Total | 686 (100.0%) | 1,198 (100.0%) |
Real Estate Taxes by Mortgage Status in Walker
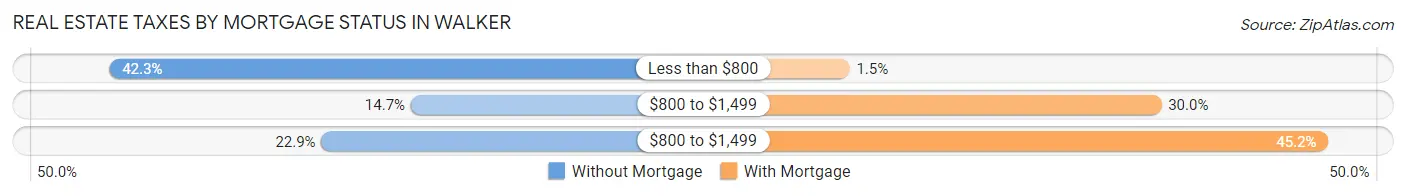
| Property Taxes | Without Mortgage | With Mortgage |
| Less than $800 | 290 (42.3%) | 18 (1.5%) |
| $800 to $1,499 | 101 (14.7%) | 359 (30.0%) |
| $800 to $1,499 | 157 (22.9%) | 542 (45.2%) |
| Total | 686 (100.0%) | 1,198 (100.0%) |
Health & Disability in Walker
Health Insurance Coverage by Age in Walker
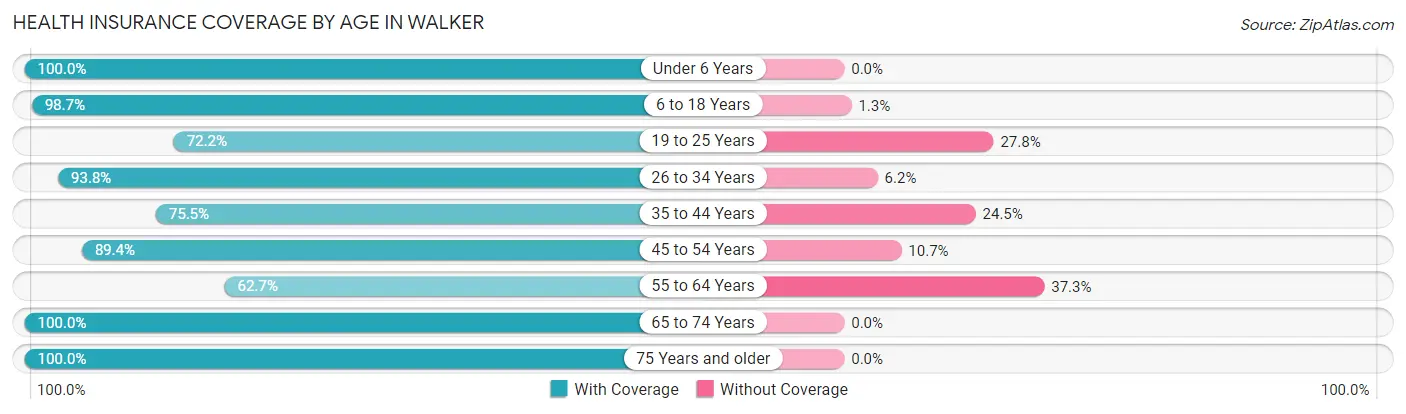
| Age Bracket | With Coverage | Without Coverage |
| Under 6 Years | 514 (100.0%) | 0 (0.0%) |
| 6 to 18 Years | 1,177 (98.7%) | 16 (1.3%) |
| 19 to 25 Years | 454 (72.2%) | 175 (27.8%) |
| 26 to 34 Years | 754 (93.8%) | 50 (6.2%) |
| 35 to 44 Years | 592 (75.5%) | 192 (24.5%) |
| 45 to 54 Years | 789 (89.3%) | 94 (10.6%) |
| 55 to 64 Years | 333 (62.7%) | 198 (37.3%) |
| 65 to 74 Years | 660 (100.0%) | 0 (0.0%) |
| 75 Years and older | 361 (100.0%) | 0 (0.0%) |
| Total | 5,634 (88.6%) | 725 (11.4%) |
Health Insurance Coverage by Citizenship Status in Walker
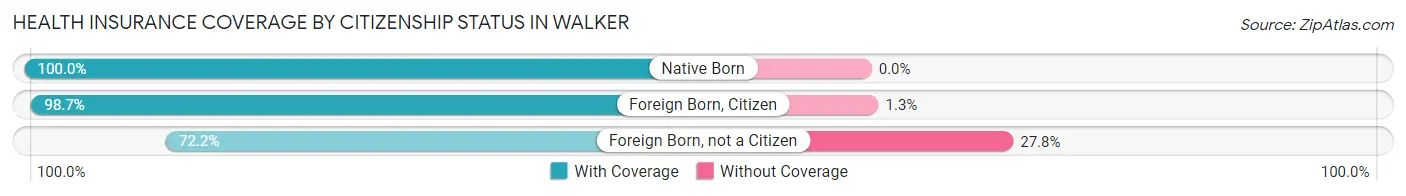
| Citizenship Status | With Coverage | Without Coverage |
| Native Born | 514 (100.0%) | 0 (0.0%) |
| Foreign Born, Citizen | 1,177 (98.7%) | 16 (1.3%) |
| Foreign Born, not a Citizen | 454 (72.2%) | 175 (27.8%) |
Health Insurance Coverage by Household Income in Walker
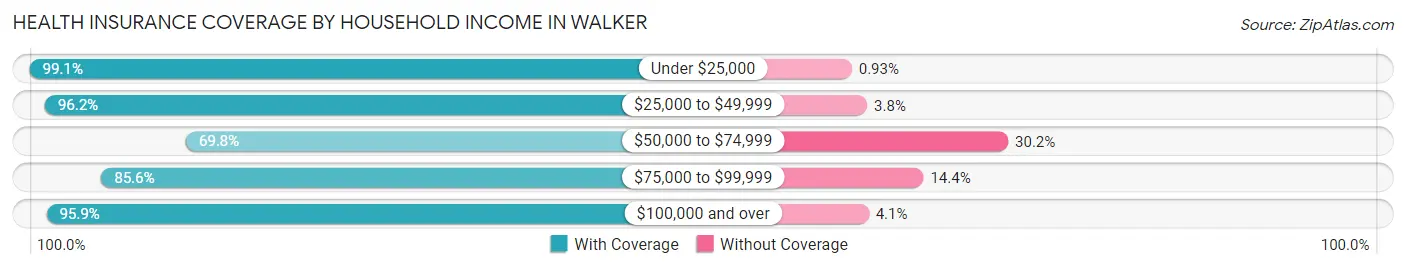
| Household Income | With Coverage | Without Coverage |
| Under $25,000 | 639 (99.1%) | 6 (0.9%) |
| $25,000 to $49,999 | 556 (96.2%) | 22 (3.8%) |
| $50,000 to $74,999 | 889 (69.8%) | 385 (30.2%) |
| $75,000 to $99,999 | 1,281 (85.6%) | 215 (14.4%) |
| $100,000 and over | 2,267 (95.9%) | 97 (4.1%) |
Public vs Private Health Insurance Coverage by Age in Walker
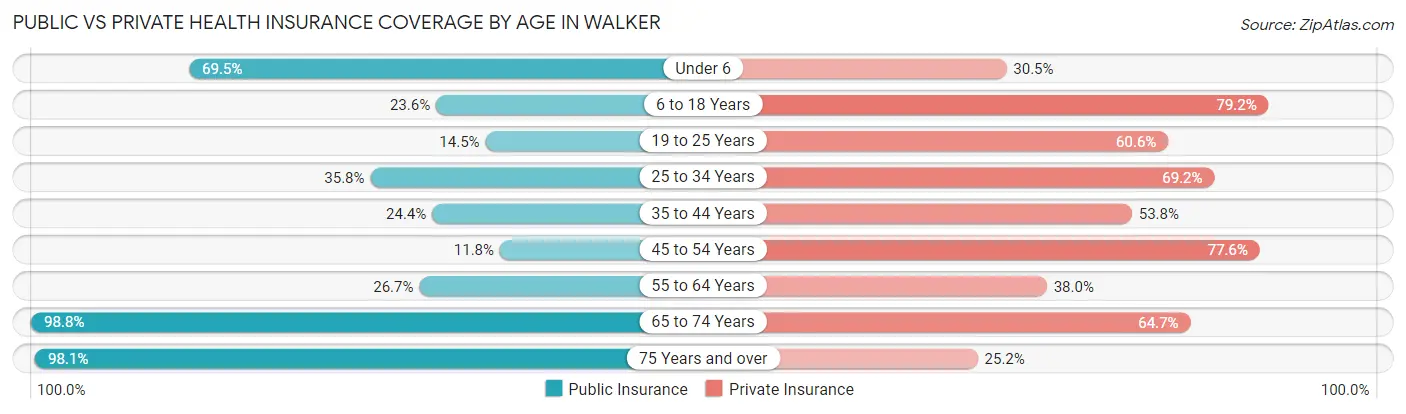
| Age Bracket | Public Insurance | Private Insurance |
| Under 6 | 357 (69.5%) | 157 (30.5%) |
| 6 to 18 Years | 282 (23.6%) | 945 (79.2%) |
| 19 to 25 Years | 91 (14.5%) | 381 (60.6%) |
| 25 to 34 Years | 288 (35.8%) | 556 (69.2%) |
| 35 to 44 Years | 191 (24.4%) | 422 (53.8%) |
| 45 to 54 Years | 104 (11.8%) | 685 (77.6%) |
| 55 to 64 Years | 142 (26.7%) | 202 (38.0%) |
| 65 to 74 Years | 652 (98.8%) | 427 (64.7%) |
| 75 Years and over | 354 (98.1%) | 91 (25.2%) |
| Total | 2,461 (38.7%) | 3,866 (60.8%) |
Disability Status by Sex by Age in Walker
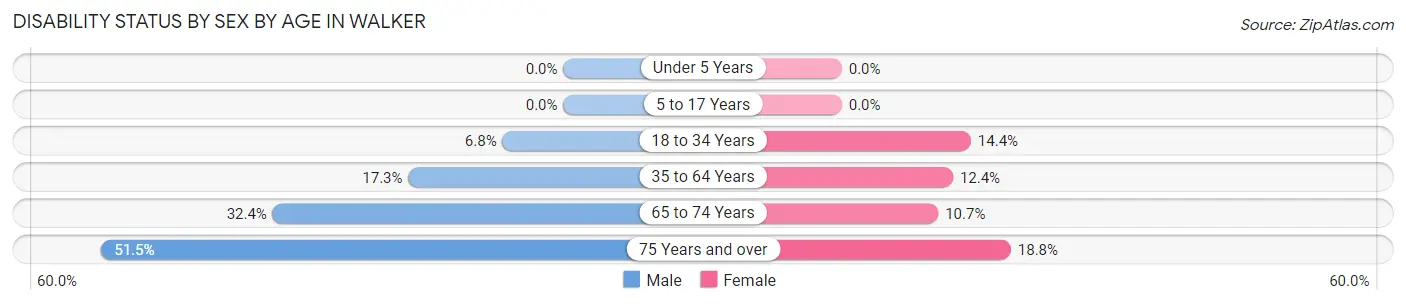
| Age Bracket | Male | Female |
| Under 5 Years | 0 (0.0%) | 0 (0.0%) |
| 5 to 17 Years | 0 (0.0%) | 0 (0.0%) |
| 18 to 34 Years | 58 (6.8%) | 83 (14.4%) |
| 35 to 64 Years | 180 (17.3%) | 143 (12.4%) |
| 65 to 74 Years | 78 (32.4%) | 45 (10.7%) |
| 75 Years and over | 71 (51.4%) | 42 (18.8%) |
Disability Class by Sex by Age in Walker
Disability Class: Hearing Difficulty
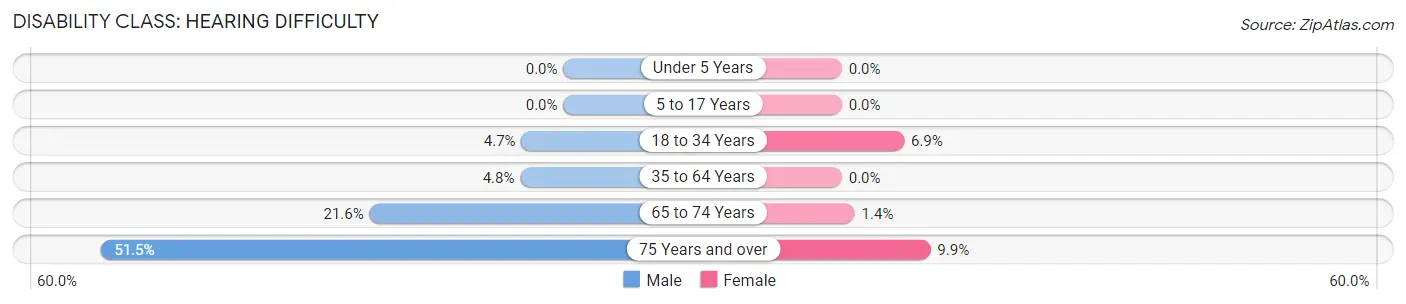
| Age Bracket | Male | Female |
| Under 5 Years | 0 (0.0%) | 0 (0.0%) |
| 5 to 17 Years | 0 (0.0%) | 0 (0.0%) |
| 18 to 34 Years | 40 (4.7%) | 40 (6.9%) |
| 35 to 64 Years | 50 (4.8%) | 0 (0.0%) |
| 65 to 74 Years | 52 (21.6%) | 6 (1.4%) |
| 75 Years and over | 71 (51.4%) | 22 (9.9%) |
Disability Class: Vision Difficulty
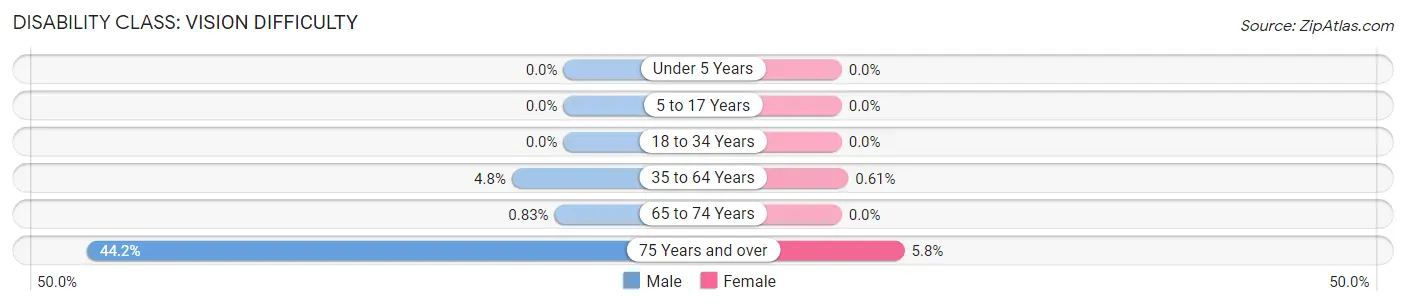
| Age Bracket | Male | Female |
| Under 5 Years | 0 (0.0%) | 0 (0.0%) |
| 5 to 17 Years | 0 (0.0%) | 0 (0.0%) |
| 18 to 34 Years | 0 (0.0%) | 0 (0.0%) |
| 35 to 64 Years | 50 (4.8%) | 7 (0.6%) |
| 65 to 74 Years | 2 (0.8%) | 0 (0.0%) |
| 75 Years and over | 61 (44.2%) | 13 (5.8%) |
Disability Class: Cognitive Difficulty
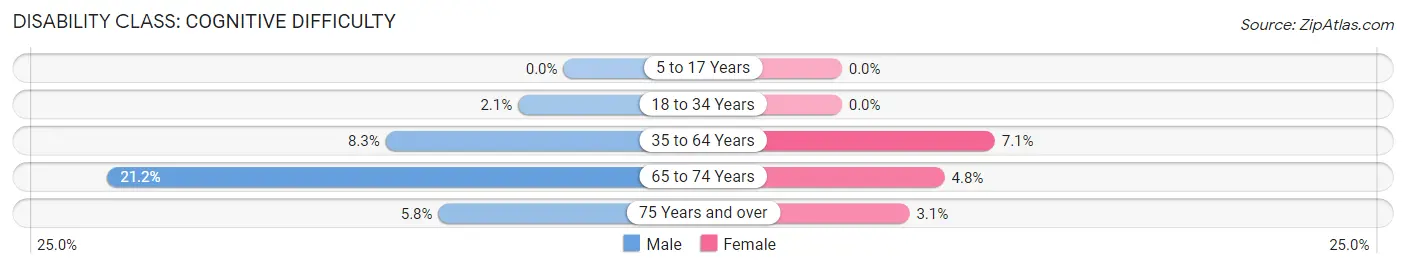
| Age Bracket | Male | Female |
| 5 to 17 Years | 0 (0.0%) | 0 (0.0%) |
| 18 to 34 Years | 18 (2.1%) | 0 (0.0%) |
| 35 to 64 Years | 86 (8.3%) | 82 (7.1%) |
| 65 to 74 Years | 51 (21.2%) | 20 (4.8%) |
| 75 Years and over | 8 (5.8%) | 7 (3.1%) |
Disability Class: Ambulatory Difficulty
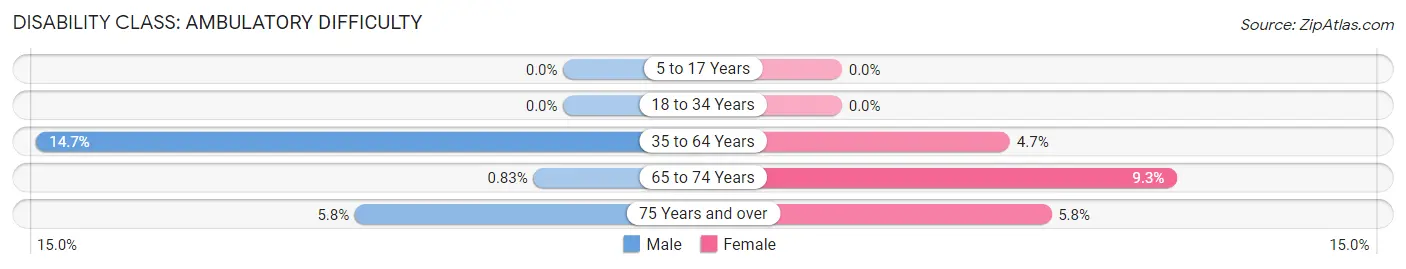
| Age Bracket | Male | Female |
| 5 to 17 Years | 0 (0.0%) | 0 (0.0%) |
| 18 to 34 Years | 0 (0.0%) | 0 (0.0%) |
| 35 to 64 Years | 153 (14.7%) | 54 (4.7%) |
| 65 to 74 Years | 2 (0.8%) | 39 (9.3%) |
| 75 Years and over | 8 (5.8%) | 13 (5.8%) |
Disability Class: Self-Care Difficulty
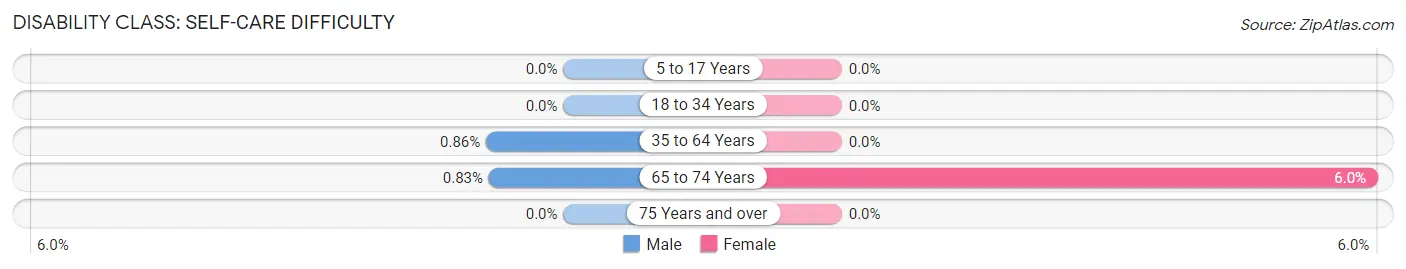
| Age Bracket | Male | Female |
| 5 to 17 Years | 0 (0.0%) | 0 (0.0%) |
| 18 to 34 Years | 0 (0.0%) | 0 (0.0%) |
| 35 to 64 Years | 9 (0.9%) | 0 (0.0%) |
| 65 to 74 Years | 2 (0.8%) | 25 (6.0%) |
| 75 Years and over | 0 (0.0%) | 0 (0.0%) |
Technology Access in Walker
Computing Device Access in Walker
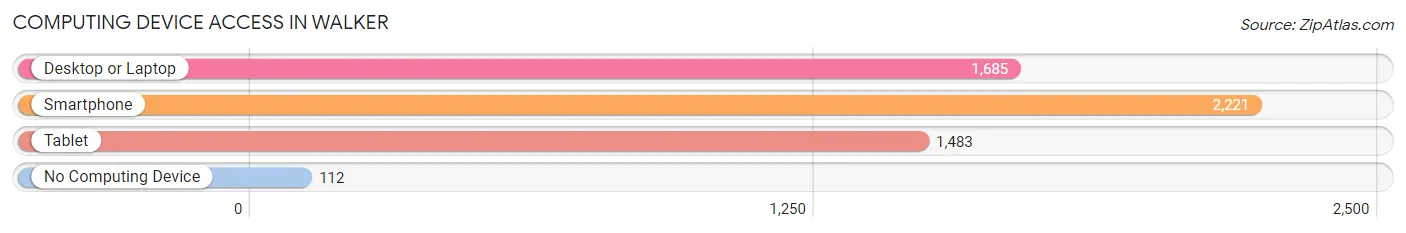
| Device Type | # Households | % Households |
| Desktop or Laptop | 1,685 | 70.1% |
| Smartphone | 2,221 | 92.4% |
| Tablet | 1,483 | 61.7% |
| No Computing Device | 112 | 4.7% |
| Total | 2,403 | 100.0% |
Internet Access in Walker
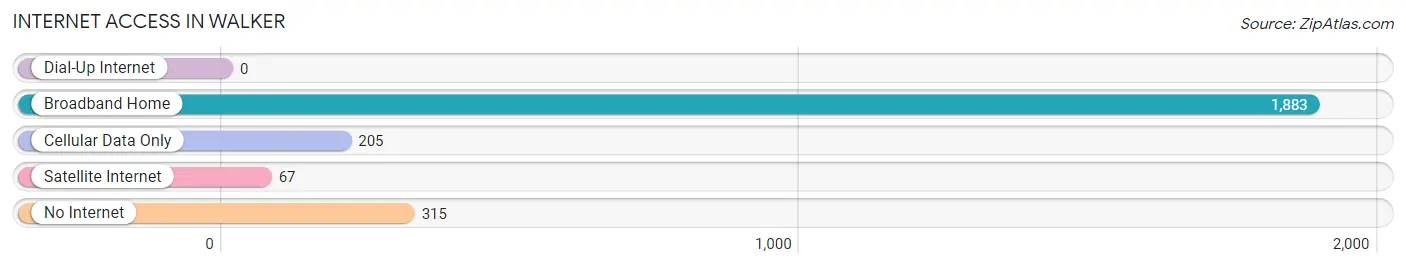
| Internet Type | # Households | % Households |
| Dial-Up Internet | 0 | 0.0% |
| Broadband Home | 1,883 | 78.4% |
| Cellular Data Only | 205 | 8.5% |
| Satellite Internet | 67 | 2.8% |
| No Internet | 315 | 13.1% |
| Total | 2,403 | 100.0% |
Walker Summary
Walker is a city located in Livingston Parish, Louisiana. It is part of the Baton Rouge Metropolitan Statistical Area and has a population of approximately 11,000 people. The city is located on the banks of the Amite River and is known for its rural charm and small-town atmosphere.
History
Walker was founded in 1855 by William Walker, a former Confederate soldier. The city was originally known as Walker’s Landing, and was a popular stop for steamboats traveling up and down the Amite River. The city was incorporated in 1877 and was named after its founder.
In the late 19th century, Walker was a thriving agricultural center, with cotton, corn, and sugar cane being the main crops. The city was also home to several sawmills and lumber companies.
In the early 20th century, Walker began to experience a period of growth and development. The city was connected to the rest of the state by the Louisiana and Mississippi Railroad in 1906, and the first bank was established in 1907. The city also saw the construction of several churches, schools, and businesses.
Geography
Walker is located in Livingston Parish, Louisiana, approximately 20 miles east of Baton Rouge. The city is situated on the banks of the Amite River and is surrounded by rolling hills and forests. The city has a total area of 8.3 square miles, with 0.1 square miles of water.
The climate in Walker is humid subtropical, with hot, humid summers and mild winters. The average annual temperature is 68 degrees Fahrenheit, with an average high of 91 degrees in the summer and an average low of 45 degrees in the winter.
Economy
Walker’s economy is largely based on agriculture and manufacturing. The city is home to several large agricultural operations, including cotton, corn, and sugar cane farms. The city is also home to several manufacturing companies, including a paper mill, a furniture factory, and a plastics plant.
The city is also home to several retail stores, restaurants, and other businesses. The city is served by the Livingston Parish School District and has several public and private schools.
Demographics
As of the 2010 census, Walker had a population of 11,000 people. The racial makeup of the city was 79.3% White, 17.2% African American, 0.7% Native American, 0.7% Asian, 0.2% Pacific Islander, and 1.9% from other races. Hispanic or Latino of any race were 2.3% of the population.
The median income for a household in Walker was $41,000, and the median income for a family was $50,000. The per capita income for the city was $20,000. About 15.3% of the population was below the poverty line.
Walker is a small city with a rural charm and a friendly atmosphere. The city is home to several businesses and industries, and is a great place to live and work. The city is also home to several schools and churches, making it a great place to raise a family.
Common Questions
What is Per Capita Income in Walker?
Per Capita income in Walker is $36,555.
What is the Median Family Income in Walker?
Median Family Income in Walker is $91,164.
What is the Median Household income in Walker?
Median Household Income in Walker is $86,446.
What is Income or Wage Gap in Walker?
Income or Wage Gap in Walker is 42.0%.
Women in Walker earn 58.0 cents for every dollar earned by a man.
What is Inequality or Gini Index in Walker?
Inequality or Gini Index in Walker is 0.39.
What is the Total Population of Walker?
Total Population of Walker is 6,359.
What is the Total Male Population of Walker?
Total Male Population of Walker is 3,249.
What is the Total Female Population of Walker?
Total Female Population of Walker is 3,110.
What is the Ratio of Males per 100 Females in Walker?
There are 104.47 Males per 100 Females in Walker.
What is the Ratio of Females per 100 Males in Walker?
There are 95.72 Females per 100 Males in Walker.
What is the Median Population Age in Walker?
Median Population Age in Walker is 35.3 Years.
What is the Average Family Size in Walker
Average Family Size in Walker is 3.5 People.
What is the Average Household Size in Walker
Average Household Size in Walker is 2.6 People.
How Large is the Labor Force in Walker?
There are 3,107 People in the Labor Forcein in Walker.
What is the Percentage of People in the Labor Force in Walker?
64.2% of People are in the Labor Force in Walker.
What is the Unemployment Rate in Walker?
Unemployment Rate in Walker is 3.3%.