Violet, LA Map & Demographics
Violet Map
Violet Overview
$23,779
PER CAPITA INCOME
$82,500
AVG FAMILY INCOME
$51,067
AVG HOUSEHOLD INCOME
46.1%
WAGE / INCOME GAP [ % ]
53.9¢/ $1
WAGE / INCOME GAP [ $ ]
0.43
INEQUALITY / GINI INDEX
4,748
TOTAL POPULATION
2,136
MALE POPULATION
2,612
FEMALE POPULATION
81.78
MALES / 100 FEMALES
122.28
FEMALES / 100 MALES
34.4
MEDIAN AGE
3.7
AVG FAMILY SIZE
2.9
AVG HOUSEHOLD SIZE
2,098
LABOR FORCE [ PEOPLE ]
60.6%
PERCENT IN LABOR FORCE
8.2%
UNEMPLOYMENT RATE
Violet Zip Codes
Violet Area Codes
Income in Violet
Income Overview in Violet
Per Capita Income in Violet is $23,779, while median incomes of families and households are $82,500 and $51,067 respectively.
| Characteristic | Number | Measure |
| Per Capita Income | 4,748 | $23,779 |
| Median Family Income | 1,090 | $82,500 |
| Mean Family Income | 1,090 | $77,598 |
| Median Household Income | 1,627 | $51,067 |
| Mean Household Income | 1,627 | $62,921 |
| Income Deficit | 1,090 | $0 |
| Wage / Income Gap (%) | 4,748 | 46.15% |
| Wage / Income Gap ($) | 4,748 | 53.85¢ per $1 |
| Gini / Inequality Index | 4,748 | 0.43 |
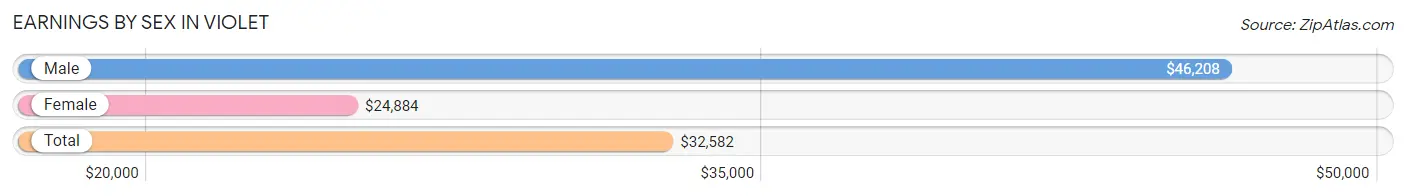
Earnings by Sex in Violet
Average Earnings in Violet are $32,582, $46,208 for men and $24,884 for women, a difference of 46.2%.
| Sex | Number | Average Earnings |
| Male | 1,023 (46.9%) | $46,208 |
| Female | 1,156 (53.0%) | $24,884 |
| Total | 2,179 (100.0%) | $32,582 |
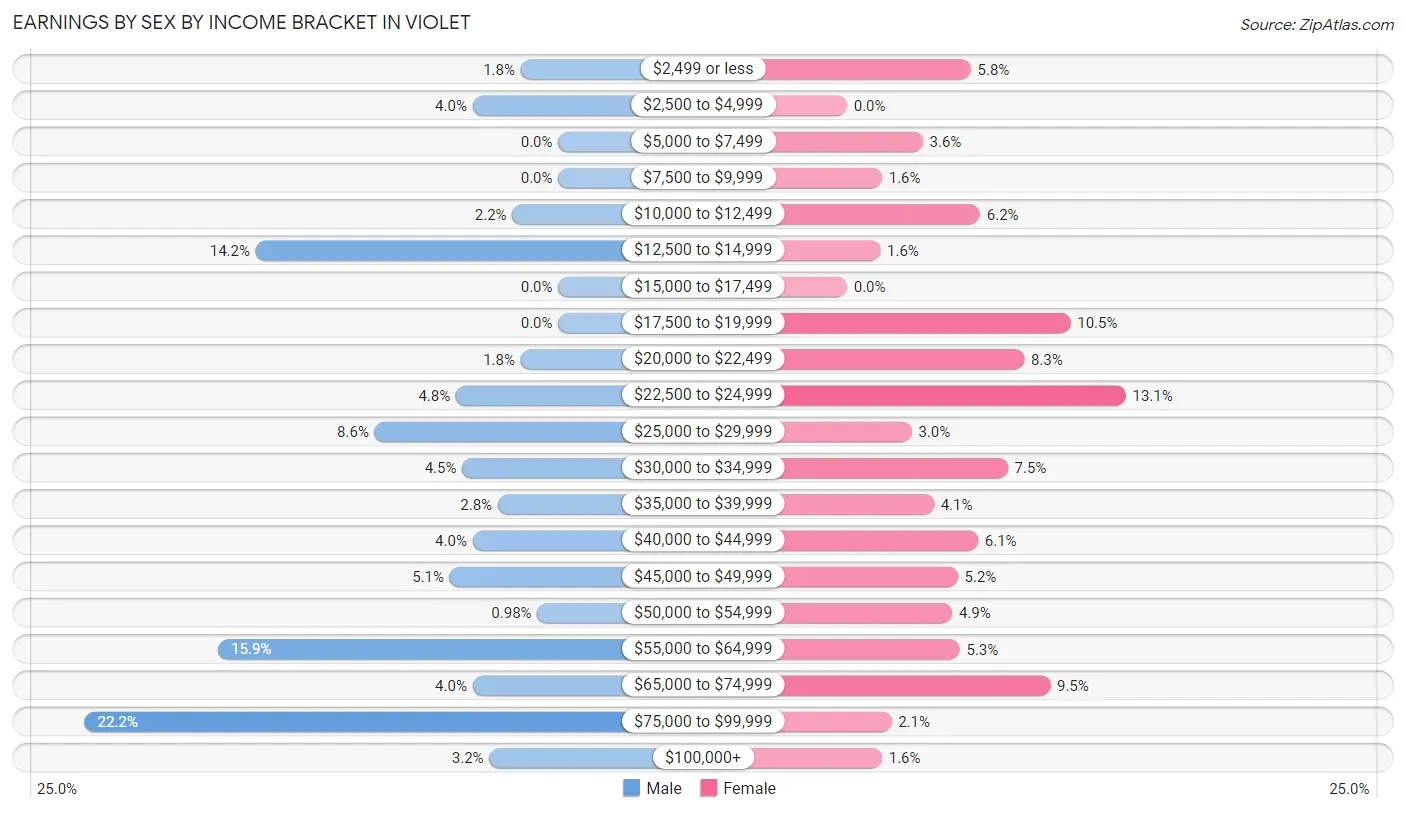
Earnings by Sex by Income Bracket in Violet
The most common earnings brackets in Violet are $75,000 to $99,999 for men (227 | 22.2%) and $22,500 to $24,999 for women (151 | 13.1%).
| Income | Male | Female |
| $2,499 or less | 18 (1.8%) | 67 (5.8%) |
| $2,500 to $4,999 | 41 (4.0%) | 0 (0.0%) |
| $5,000 to $7,499 | 0 (0.0%) | 41 (3.5%) |
| $7,500 to $9,999 | 0 (0.0%) | 19 (1.6%) |
| $10,000 to $12,499 | 22 (2.1%) | 72 (6.2%) |
| $12,500 to $14,999 | 145 (14.2%) | 18 (1.6%) |
| $15,000 to $17,499 | 0 (0.0%) | 0 (0.0%) |
| $17,500 to $19,999 | 0 (0.0%) | 121 (10.5%) |
| $20,000 to $22,499 | 18 (1.8%) | 96 (8.3%) |
| $22,500 to $24,999 | 49 (4.8%) | 151 (13.1%) |
| $25,000 to $29,999 | 88 (8.6%) | 35 (3.0%) |
| $30,000 to $34,999 | 46 (4.5%) | 87 (7.5%) |
| $35,000 to $39,999 | 29 (2.8%) | 47 (4.1%) |
| $40,000 to $44,999 | 41 (4.0%) | 71 (6.1%) |
| $45,000 to $49,999 | 52 (5.1%) | 60 (5.2%) |
| $50,000 to $54,999 | 10 (1.0%) | 57 (4.9%) |
| $55,000 to $64,999 | 163 (15.9%) | 61 (5.3%) |
| $65,000 to $74,999 | 41 (4.0%) | 110 (9.5%) |
| $75,000 to $99,999 | 227 (22.2%) | 24 (2.1%) |
| $100,000+ | 33 (3.2%) | 19 (1.6%) |
| Total | 1,023 (100.0%) | 1,156 (100.0%) |
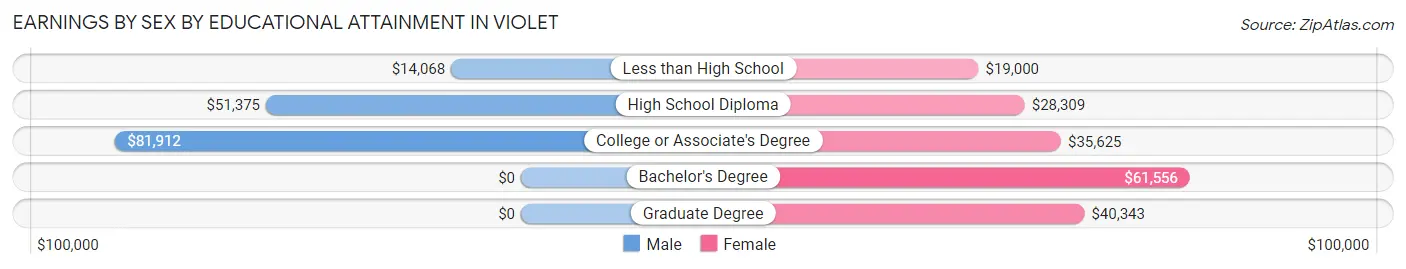
Earnings by Sex by Educational Attainment in Violet
Average earnings in Violet are $56,250 for men and $31,950 for women, a difference of 43.2%. Men with an educational attainment of college or associate's degree enjoy the highest average annual earnings of $81,912, while those with less than high school education earn the least with $14,068. Women with an educational attainment of bachelor's degree earn the most with the average annual earnings of $61,556, while those with less than high school education have the smallest earnings of $19,000.
| Educational Attainment | Male Income | Female Income |
| Less than High School | $14,068 | $19,000 |
| High School Diploma | $51,375 | $28,309 |
| College or Associate's Degree | $81,912 | $35,625 |
| Bachelor's Degree | - | - |
| Graduate Degree | - | - |
| Total | $56,250 | $31,950 |
Family Income in Violet
Family Income Brackets in Violet
According to the Violet family income data, there are 303 families falling into the $75,000 to $99,999 income range, which is the most common income bracket and makes up 27.8% of all families. Conversely, the $200,000+ income bracket is the least frequent group with only 21 families (1.9%) belonging to this category.
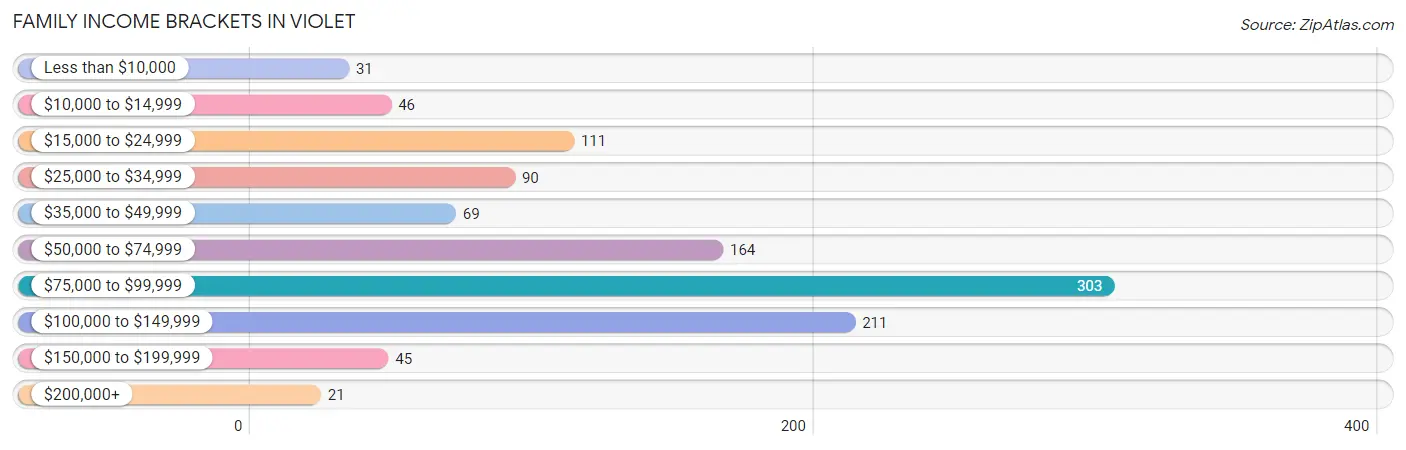
| Income Bracket | # Families | % Families |
| Less than $10,000 | 31 | 2.8% |
| $10,000 to $14,999 | 46 | 4.2% |
| $15,000 to $24,999 | 111 | 10.2% |
| $25,000 to $34,999 | 90 | 8.3% |
| $35,000 to $49,999 | 69 | 6.3% |
| $50,000 to $74,999 | 164 | 15.0% |
| $75,000 to $99,999 | 303 | 27.8% |
| $100,000 to $149,999 | 211 | 19.4% |
| $150,000 to $199,999 | 45 | 4.1% |
| $200,000+ | 21 | 1.9% |
Family Income by Famaliy Size in Violet
4-person families (162 | 14.9%) account for the highest median family income in Violet with $103,222 per family, while 2-person families (412 | 37.8%) have the highest median income of $39,532 per family member.
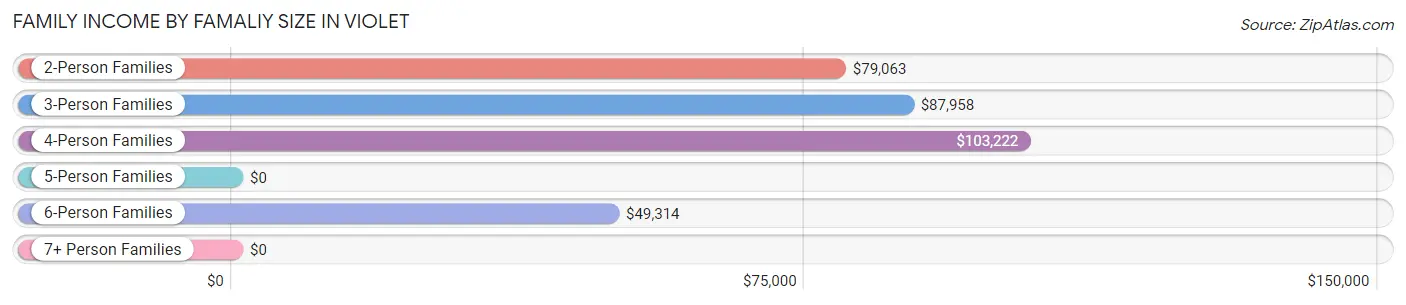
| Income Bracket | # Families | Median Income |
| 2-Person Families | 412 (37.8%) | $79,063 |
| 3-Person Families | 257 (23.6%) | $87,958 |
| 4-Person Families | 162 (14.9%) | $103,222 |
| 5-Person Families | 138 (12.7%) | $0 |
| 6-Person Families | 74 (6.8%) | $49,314 |
| 7+ Person Families | 47 (4.3%) | $0 |
| Total | 1,090 (100.0%) | $82,500 |
Family Income by Number of Earners in Violet
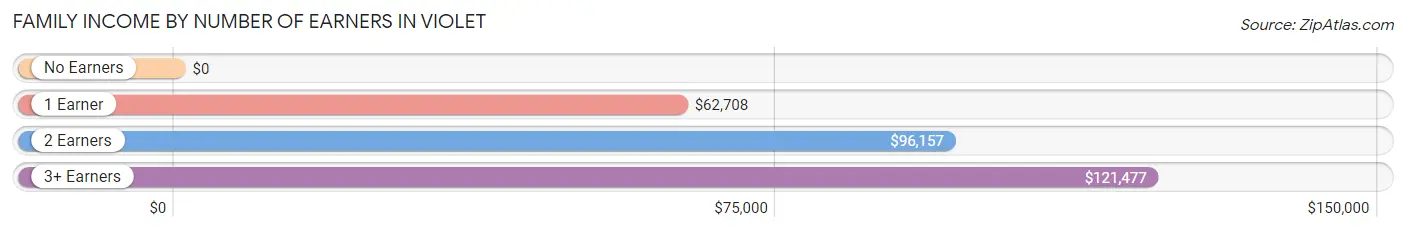
| Number of Earners | # Families | Median Income |
| No Earners | 180 (16.5%) | $0 |
| 1 Earner | 315 (28.9%) | $62,708 |
| 2 Earners | 498 (45.7%) | $96,157 |
| 3+ Earners | 97 (8.9%) | $121,477 |
| Total | 1,090 (100.0%) | $82,500 |
Household Income in Violet
Household Income Brackets in Violet
With 281 households falling in the category, the $75,000 to $99,999 income range is the most frequent in Violet, accounting for 17.3% of all households. In contrast, only 21 households (1.3%) fall into the $200,000+ income bracket, making it the least populous group.
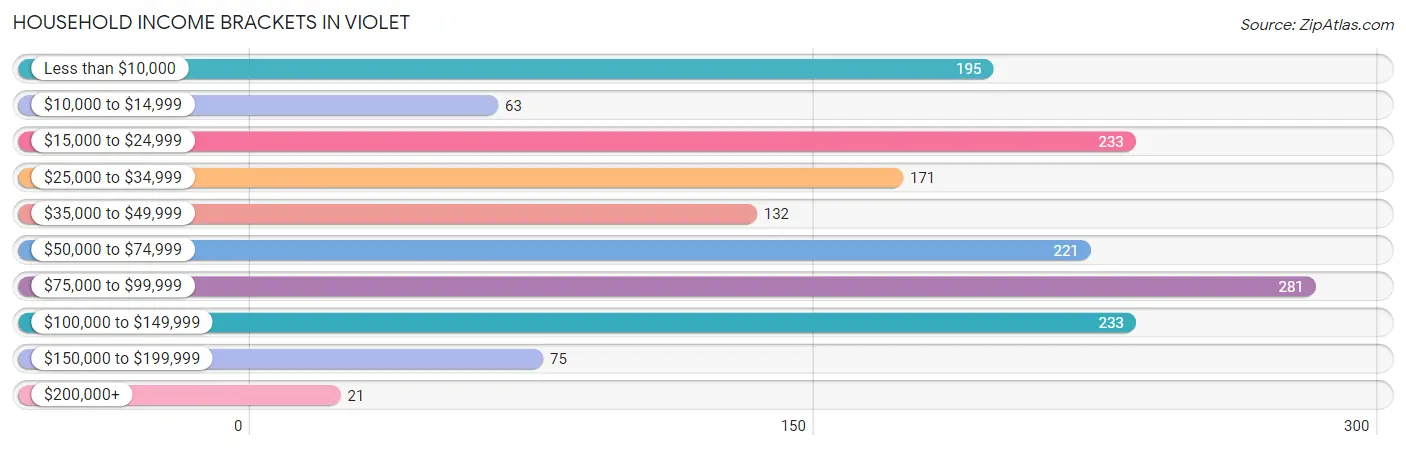
| Income Bracket | # Households | % Households |
| Less than $10,000 | 195 | 12.0% |
| $10,000 to $14,999 | 63 | 3.9% |
| $15,000 to $24,999 | 233 | 14.3% |
| $25,000 to $34,999 | 171 | 10.5% |
| $35,000 to $49,999 | 132 | 8.1% |
| $50,000 to $74,999 | 221 | 13.6% |
| $75,000 to $99,999 | 281 | 17.3% |
| $100,000 to $149,999 | 233 | 14.3% |
| $150,000 to $199,999 | 75 | 4.6% |
| $200,000+ | 21 | 1.3% |
Household Income by Householder Age in Violet
The median household income in Violet is $51,067, with the highest median household income of $68,125 found in the 45 to 64 years age bracket for the primary householder. A total of 796 households (48.9%) fall into this category.
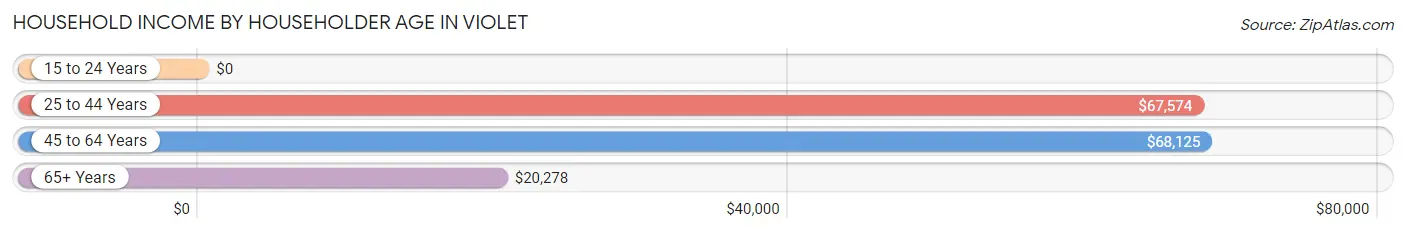
| Income Bracket | # Households | Median Income |
| 15 to 24 Years | 0 (0.0%) | $0 |
| 25 to 44 Years | 451 (27.7%) | $67,574 |
| 45 to 64 Years | 796 (48.9%) | $68,125 |
| 65+ Years | 380 (23.4%) | $20,278 |
| Total | 1,627 (100.0%) | $51,067 |
Poverty in Violet
Income Below Poverty by Sex and Age in Violet
With 21.3% poverty level for males and 18.5% for females among the residents of Violet, 12 to 14 year old males and 6 to 11 year old females are the most vulnerable to poverty, with 41 males (51.2%) and 109 females (44.0%) in their respective age groups living below the poverty level.
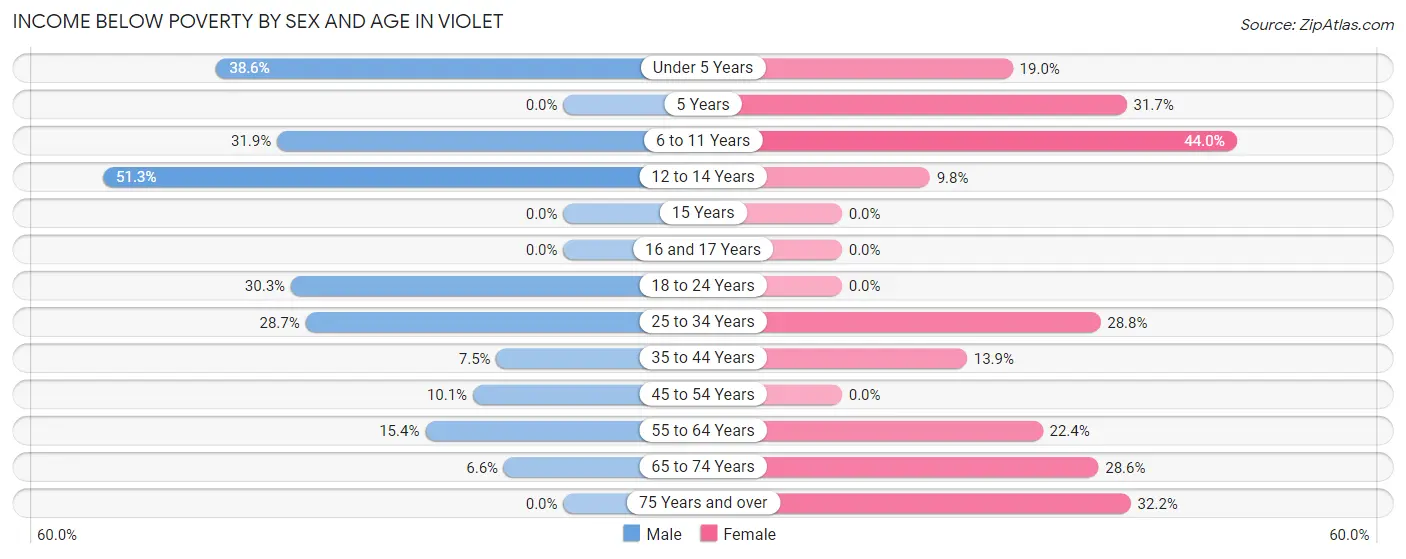
| Age Bracket | Male | Female |
| Under 5 Years | 68 (38.6%) | 43 (19.0%) |
| 5 Years | 0 (0.0%) | 13 (31.7%) |
| 6 to 11 Years | 81 (31.9%) | 109 (44.0%) |
| 12 to 14 Years | 41 (51.2%) | 19 (9.8%) |
| 15 Years | 0 (0.0%) | 0 (0.0%) |
| 16 and 17 Years | 0 (0.0%) | 0 (0.0%) |
| 18 to 24 Years | 44 (30.3%) | 0 (0.0%) |
| 25 to 34 Years | 122 (28.7%) | 76 (28.8%) |
| 35 to 44 Years | 19 (7.4%) | 44 (13.9%) |
| 45 to 54 Years | 28 (10.1%) | 0 (0.0%) |
| 55 to 64 Years | 44 (15.4%) | 53 (22.4%) |
| 65 to 74 Years | 9 (6.6%) | 80 (28.6%) |
| 75 Years and over | 0 (0.0%) | 46 (32.2%) |
| Total | 456 (21.3%) | 483 (18.5%) |
Income Above Poverty by Sex and Age in Violet
According to the poverty statistics in Violet, males aged 5 years and females aged 15 years are the age groups that are most secure financially, with 100.0% of males and 100.0% of females in these age groups living above the poverty line.
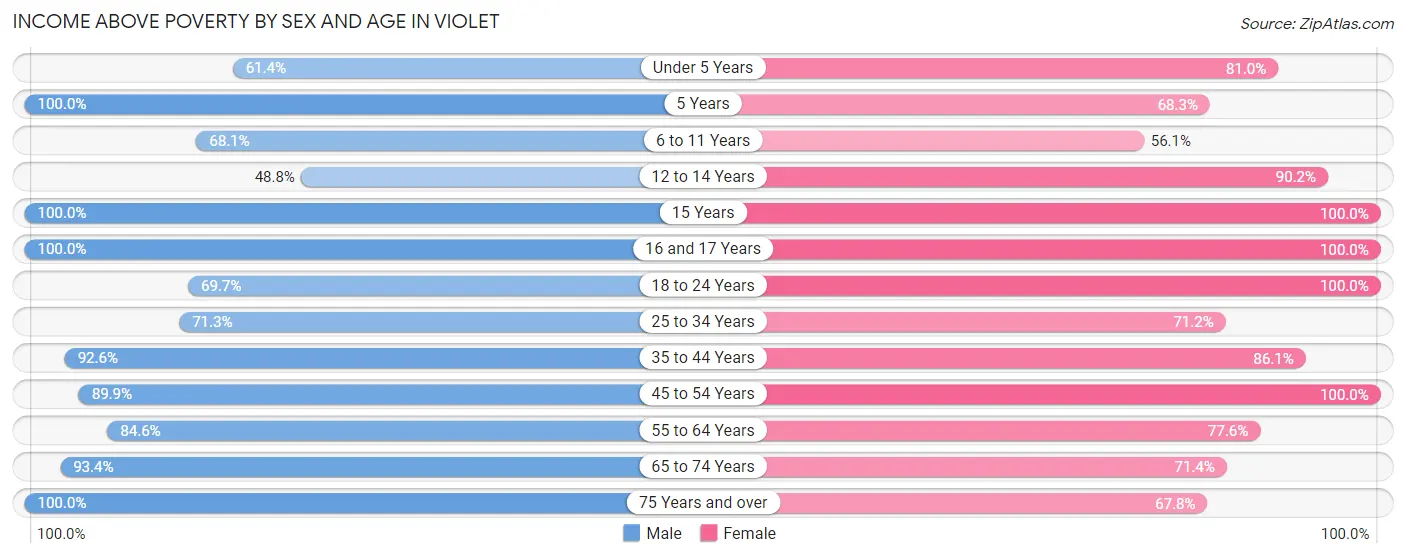
| Age Bracket | Male | Female |
| Under 5 Years | 108 (61.4%) | 183 (81.0%) |
| 5 Years | 11 (100.0%) | 28 (68.3%) |
| 6 to 11 Years | 173 (68.1%) | 139 (56.0%) |
| 12 to 14 Years | 39 (48.7%) | 175 (90.2%) |
| 15 Years | 7 (100.0%) | 49 (100.0%) |
| 16 and 17 Years | 32 (100.0%) | 104 (100.0%) |
| 18 to 24 Years | 101 (69.7%) | 156 (100.0%) |
| 25 to 34 Years | 303 (71.3%) | 188 (71.2%) |
| 35 to 44 Years | 236 (92.5%) | 272 (86.1%) |
| 45 to 54 Years | 250 (89.9%) | 354 (100.0%) |
| 55 to 64 Years | 242 (84.6%) | 184 (77.6%) |
| 65 to 74 Years | 127 (93.4%) | 200 (71.4%) |
| 75 Years and over | 51 (100.0%) | 97 (67.8%) |
| Total | 1,680 (78.6%) | 2,129 (81.5%) |
Income Below Poverty Among Married-Couple Families in Violet
The poverty statistics for married-couple families in Violet show that 4.0% or 23 of the total 572 families live below the poverty line. Families with 5 or more children have the highest poverty rate of 100.0%, comprising of 16 families. On the other hand, families with no children have the lowest poverty rate of 0.0%, which includes 0 families.
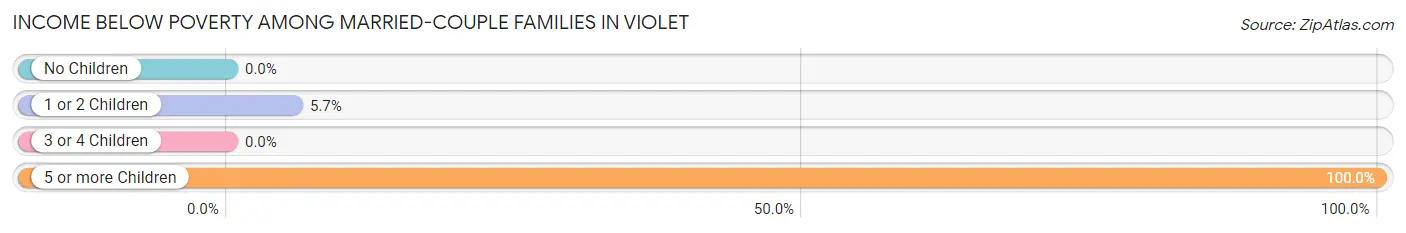
| Children | Above Poverty | Below Poverty |
| No Children | 342 (100.0%) | 0 (0.0%) |
| 1 or 2 Children | 117 (94.4%) | 7 (5.7%) |
| 3 or 4 Children | 90 (100.0%) | 0 (0.0%) |
| 5 or more Children | 0 (0.0%) | 16 (100.0%) |
| Total | 549 (96.0%) | 23 (4.0%) |
Income Below Poverty Among Single-Parent Households in Violet
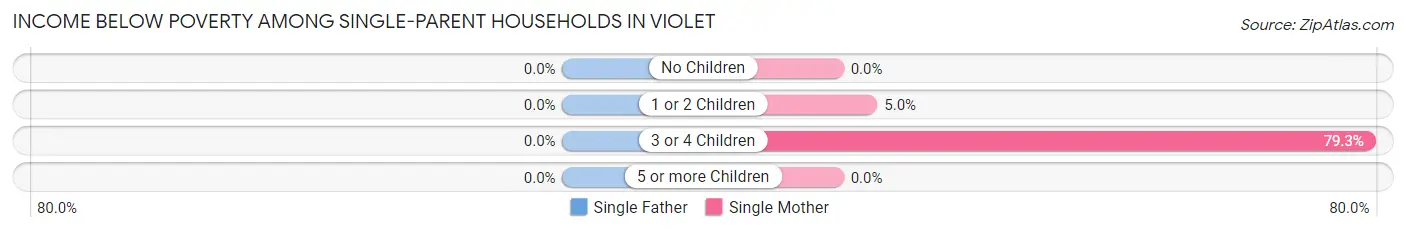
| Children | Single Father | Single Mother |
| No Children | 0 (0.0%) | 0 (0.0%) |
| 1 or 2 Children | 0 (0.0%) | 11 (5.0%) |
| 3 or 4 Children | 0 (0.0%) | 65 (79.3%) |
| 5 or more Children | 0 (0.0%) | 0 (0.0%) |
| Total | 0 (0.0%) | 76 (15.9%) |
Income Below Poverty Among Married-Couple vs Single-Parent Households in Violet
The poverty data for Violet shows that 23 of the married-couple family households (4.0%) and 76 of the single-parent households (14.7%) are living below the poverty level. Within the married-couple family households, those with 5 or more children have the highest poverty rate, with 16 households (100.0%) falling below the poverty line. Among the single-parent households, those with 3 or 4 children have the highest poverty rate, with 65 household (79.3%) living below poverty.
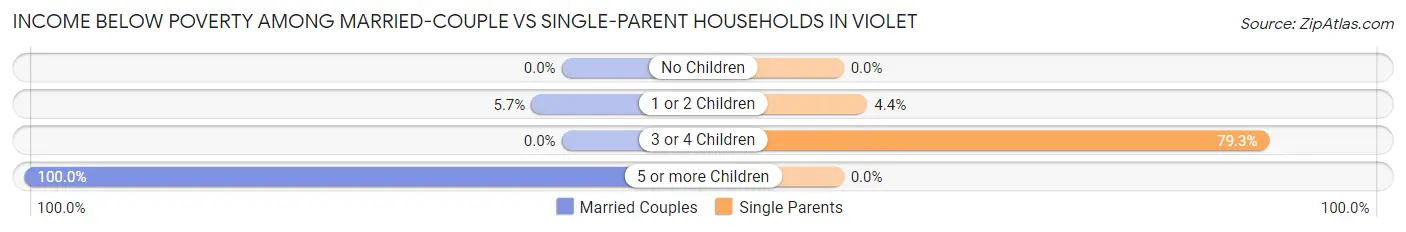
| Children | Married-Couple Families | Single-Parent Households |
| No Children | 0 (0.0%) | 0 (0.0%) |
| 1 or 2 Children | 7 (5.7%) | 11 (4.4%) |
| 3 or 4 Children | 0 (0.0%) | 65 (79.3%) |
| 5 or more Children | 16 (100.0%) | 0 (0.0%) |
| Total | 23 (4.0%) | 76 (14.7%) |
Race in Violet
The most populous races in Violet are Black / African American (3,095 | 65.2%), White / Caucasian (1,415 | 29.8%), and Hispanic or Latino (388 | 8.2%).
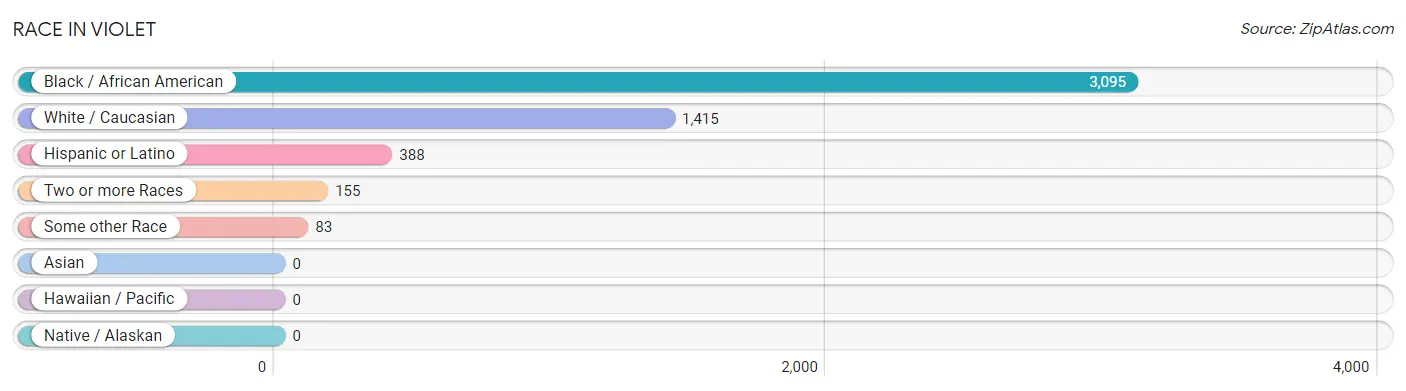
| Race | # Population | % Population |
| Asian | 0 | 0.0% |
| Black / African American | 3,095 | 65.2% |
| Hawaiian / Pacific | 0 | 0.0% |
| Hispanic or Latino | 388 | 8.2% |
| Native / Alaskan | 0 | 0.0% |
| White / Caucasian | 1,415 | 29.8% |
| Two or more Races | 155 | 3.3% |
| Some other Race | 83 | 1.8% |
| Total | 4,748 | 100.0% |
Ancestry in Violet
The most populous ancestries reported in Violet are French (364 | 7.7%), Italian (357 | 7.5%), German (339 | 7.1%), Irish (230 | 4.8%), and African (223 | 4.7%), together accounting for 31.9% of all Violet residents.
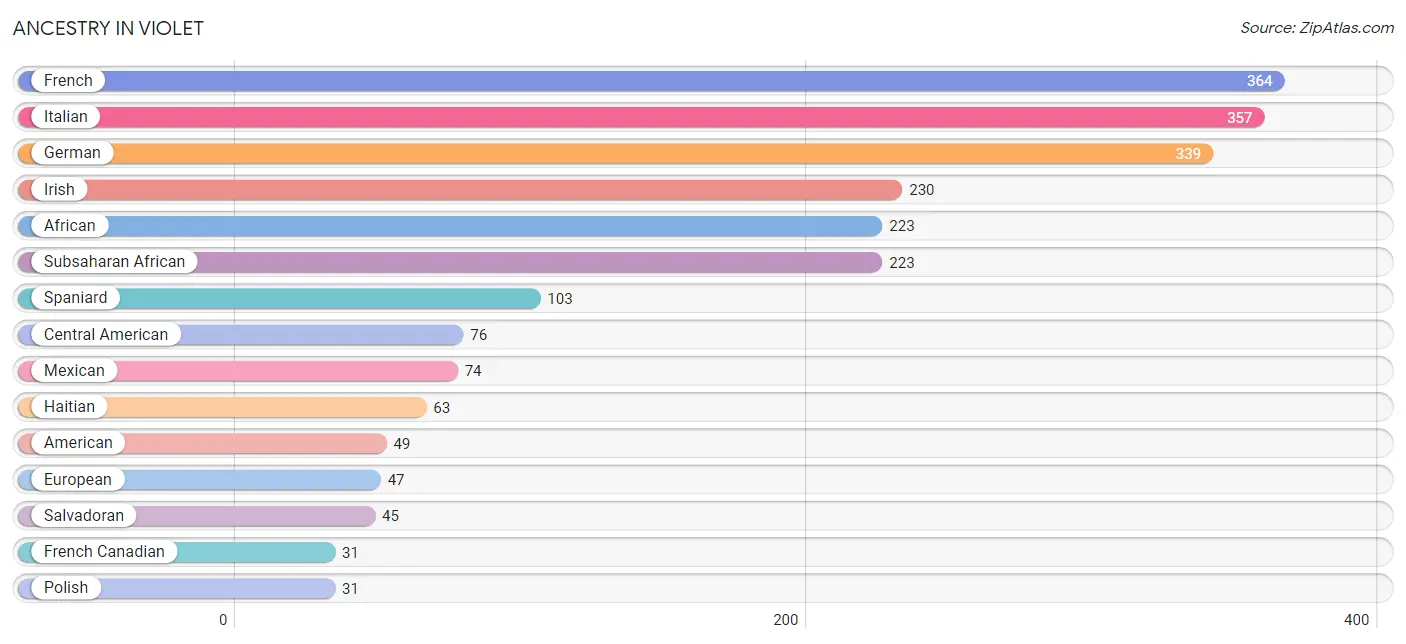
| Ancestry | # Population | % Population |
| African | 223 | 4.7% |
| American | 49 | 1.0% |
| Arab | 23 | 0.5% |
| British | 25 | 0.5% |
| Central American | 76 | 1.6% |
| Cherokee | 14 | 0.3% |
| Cuban | 9 | 0.2% |
| Egyptian | 23 | 0.5% |
| English | 25 | 0.5% |
| European | 47 | 1.0% |
| French | 364 | 7.7% |
| French Canadian | 31 | 0.6% |
| German | 339 | 7.1% |
| Haitian | 63 | 1.3% |
| Honduran | 26 | 0.5% |
| Houma | 14 | 0.3% |
| Irish | 230 | 4.8% |
| Italian | 357 | 7.5% |
| Mexican | 74 | 1.6% |
| Nicaraguan | 5 | 0.1% |
| Polish | 31 | 0.6% |
| Portuguese | 8 | 0.2% |
| Salvadoran | 45 | 0.9% |
| Scottish | 8 | 0.2% |
| Spaniard | 103 | 2.2% |
| Subsaharan African | 223 | 4.7% |
| Swedish | 7 | 0.2% | View All 27 Rows |
Immigrants in Violet
The most numerous immigrant groups reported in Violet came from Central America (67 | 1.4%), Latin America (67 | 1.4%), El Salvador (30 | 0.6%), Honduras (26 | 0.5%), and Africa (23 | 0.5%), together accounting for 4.5% of all Violet residents.
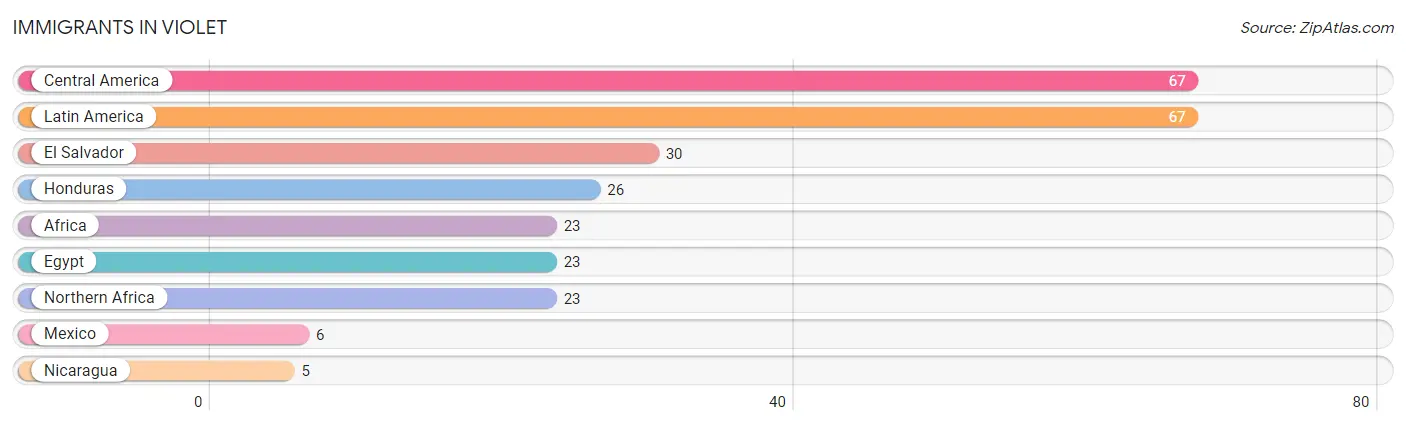
| Immigration Origin | # Population | % Population |
| Africa | 23 | 0.5% |
| Central America | 67 | 1.4% |
| Egypt | 23 | 0.5% |
| El Salvador | 30 | 0.6% |
| Honduras | 26 | 0.5% |
| Latin America | 67 | 1.4% |
| Mexico | 6 | 0.1% |
| Nicaragua | 5 | 0.1% |
| Northern Africa | 23 | 0.5% | View All 9 Rows |
Sex and Age in Violet
Sex and Age in Violet
The most populous age groups in Violet are 25 to 29 Years (244 | 11.4%) for men and 10 to 14 Years (295 | 11.3%) for women.
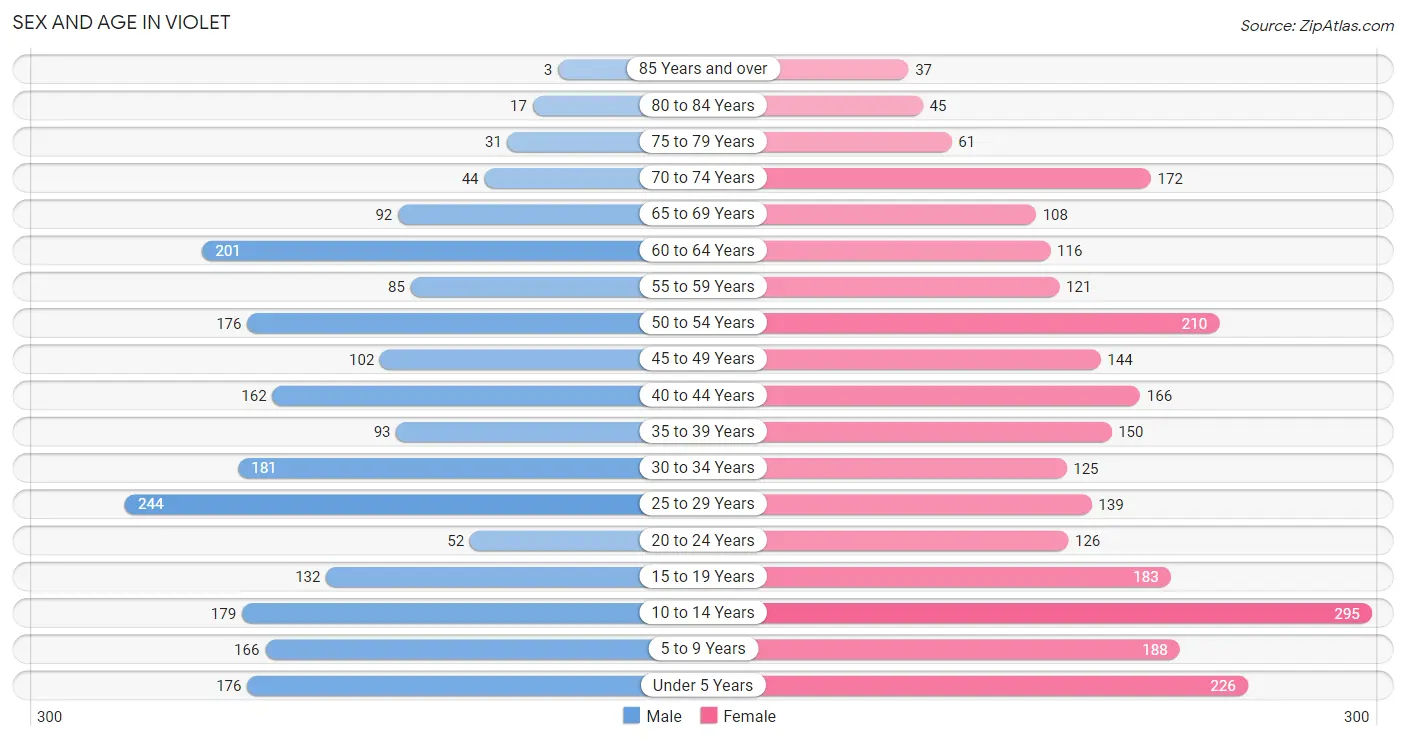
| Age Bracket | Male | Female |
| Under 5 Years | 176 (8.2%) | 226 (8.6%) |
| 5 to 9 Years | 166 (7.8%) | 188 (7.2%) |
| 10 to 14 Years | 179 (8.4%) | 295 (11.3%) |
| 15 to 19 Years | 132 (6.2%) | 183 (7.0%) |
| 20 to 24 Years | 52 (2.4%) | 126 (4.8%) |
| 25 to 29 Years | 244 (11.4%) | 139 (5.3%) |
| 30 to 34 Years | 181 (8.5%) | 125 (4.8%) |
| 35 to 39 Years | 93 (4.3%) | 150 (5.7%) |
| 40 to 44 Years | 162 (7.6%) | 166 (6.4%) |
| 45 to 49 Years | 102 (4.8%) | 144 (5.5%) |
| 50 to 54 Years | 176 (8.2%) | 210 (8.0%) |
| 55 to 59 Years | 85 (4.0%) | 121 (4.6%) |
| 60 to 64 Years | 201 (9.4%) | 116 (4.4%) |
| 65 to 69 Years | 92 (4.3%) | 108 (4.1%) |
| 70 to 74 Years | 44 (2.1%) | 172 (6.6%) |
| 75 to 79 Years | 31 (1.5%) | 61 (2.3%) |
| 80 to 84 Years | 17 (0.8%) | 45 (1.7%) |
| 85 Years and over | 3 (0.1%) | 37 (1.4%) |
| Total | 2,136 (100.0%) | 2,612 (100.0%) |
Families and Households in Violet
Median Family Size in Violet
The median family size in Violet is 3.71 persons per family, with single male/father families (40 | 3.7%) accounting for the largest median family size of 3.9 persons per family. On the other hand, married-couple families (572 | 52.5%) represent the smallest median family size with 3.69 persons per family.
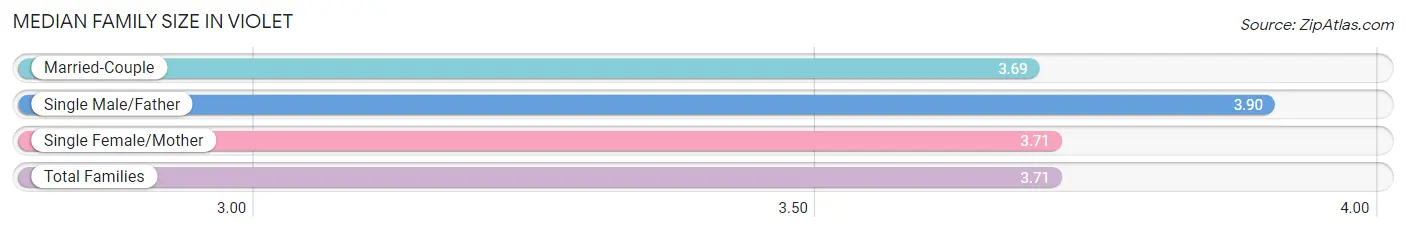
| Family Type | # Families | Family Size |
| Married-Couple | 572 (52.5%) | 3.69 |
| Single Male/Father | 40 (3.7%) | 3.90 |
| Single Female/Mother | 478 (43.9%) | 3.71 |
| Total Families | 1,090 (100.0%) | 3.71 |
Median Household Size in Violet
The median household size in Violet is 2.91 persons per household, with single male/father households (40 | 2.5%) accounting for the largest median household size of 4.68 persons per household. non-family households (537 | 33.0%) represent the smallest median household size with 1.01 persons per household.
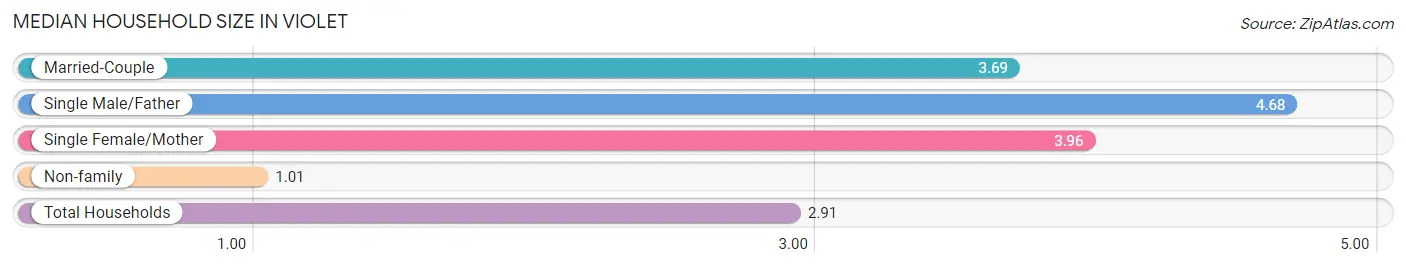
| Household Type | # Households | Household Size |
| Married-Couple | 572 (35.2%) | 3.69 |
| Single Male/Father | 40 (2.5%) | 4.68 |
| Single Female/Mother | 478 (29.4%) | 3.96 |
| Non-family | 537 (33.0%) | 1.01 |
| Total Households | 1,627 (100.0%) | 2.91 |
Household Size by Marriage Status in Violet
Out of a total of 1,627 households in Violet, 1,090 (67.0%) are family households, while 537 (33.0%) are nonfamily households. The most numerous type of family households are 2-person households, comprising 412, and the most common type of nonfamily households are 1-person households, comprising 527.
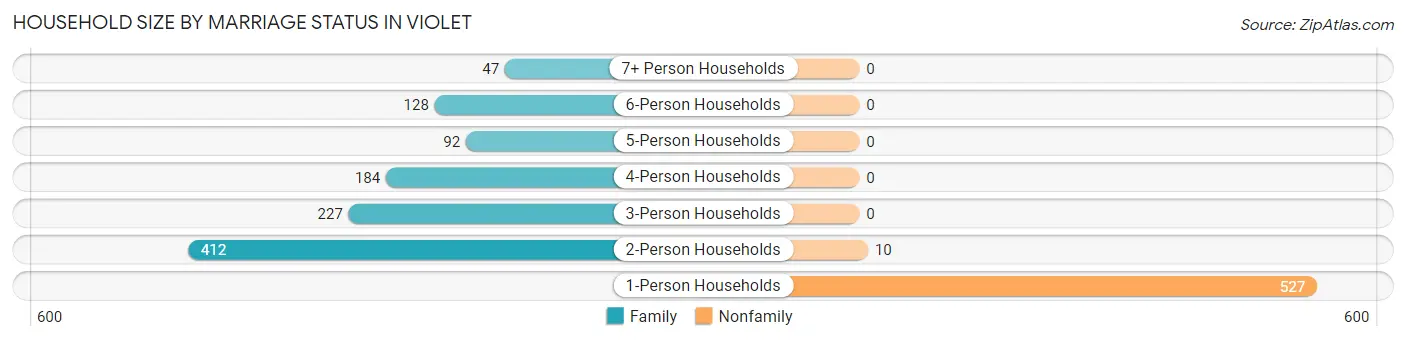
| Household Size | Family Households | Nonfamily Households |
| 1-Person Households | - | 527 (32.4%) |
| 2-Person Households | 412 (25.3%) | 10 (0.6%) |
| 3-Person Households | 227 (14.0%) | 0 (0.0%) |
| 4-Person Households | 184 (11.3%) | 0 (0.0%) |
| 5-Person Households | 92 (5.7%) | 0 (0.0%) |
| 6-Person Households | 128 (7.9%) | 0 (0.0%) |
| 7+ Person Households | 47 (2.9%) | 0 (0.0%) |
| Total | 1,090 (67.0%) | 537 (33.0%) |
Female Fertility in Violet
Fertility by Age in Violet
| Age Bracket | Women with Births | Births / 1,000 Women |
| 15 to 19 years | 0 (0.0%) | 0.0 |
| 20 to 34 years | 0 (0.0%) | 0.0 |
| 35 to 50 years | 0 (0.0%) | 0.0 |
| Total | 0 (0.0%) | 0.0 |
Fertility by Age by Marriage Status in Violet
| Age Bracket | Married | Unmarried |
| 15 to 19 years | 0 (0.0%) | 0 (0.0%) |
| 20 to 34 years | 0 (0.0%) | 0 (0.0%) |
| 35 to 50 years | 0 (0.0%) | 0 (0.0%) |
| Total | 0 (0.0%) | 0 (0.0%) |
Fertility by Education in Violet
| Educational Attainment | Women with Births | Births / 1,000 Women |
| Less than High School | 0 (0.0%) | 0.0 |
| High School Diploma | 0 (0.0%) | 0.0 |
| College or Associate's Degree | 0 (0.0%) | 0.0 |
| Bachelor's Degree | 0 (0.0%) | 0.0 |
| Graduate Degree | 0 (0.0%) | 0.0 |
| Total | 0 (0.0%) | 0.0 |
Fertility by Education by Marriage Status in Violet
| Educational Attainment | Married | Unmarried |
| Less than High School | 0 (0.0%) | 0 (0.0%) |
| High School Diploma | 0 (0.0%) | 0 (0.0%) |
| College or Associate's Degree | 0 (0.0%) | 0 (0.0%) |
| Bachelor's Degree | 0 (0.0%) | 0 (0.0%) |
| Graduate Degree | 0 (0.0%) | 0 (0.0%) |
| Total | 0 (0.0%) | 0 (0.0%) |
Employment Characteristics in Violet
Employment by Class of Employer in Violet
Among the 1,927 employed individuals in Violet, private company employees (1,190 | 61.8%), federal government employees (175 | 9.1%), and local government employees (173 | 9.0%) make up the most common classes of employment.
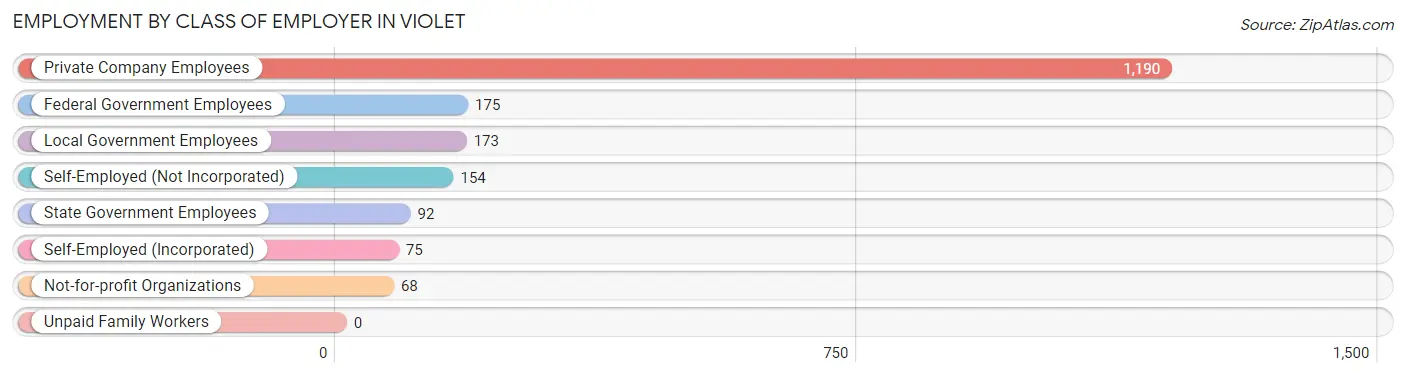
| Employer Class | # Employees | % Employees |
| Private Company Employees | 1,190 | 61.8% |
| Self-Employed (Incorporated) | 75 | 3.9% |
| Self-Employed (Not Incorporated) | 154 | 8.0% |
| Not-for-profit Organizations | 68 | 3.5% |
| Local Government Employees | 173 | 9.0% |
| State Government Employees | 92 | 4.8% |
| Federal Government Employees | 175 | 9.1% |
| Unpaid Family Workers | 0 | 0.0% |
| Total | 1,927 | 100.0% |
Employment Status by Age in Violet
According to the labor force statistics for Violet, out of the total population over 16 years of age (3,462), 60.6% or 2,098 individuals are in the labor force, with 8.2% or 172 of them unemployed. The age group with the highest labor force participation rate is 20 to 24 years, with 92.7% or 165 individuals in the labor force. Within the labor force, the 16 to 19 years age range has the highest percentage of unemployed individuals, with 62.0% or 49 of them being unemployed.
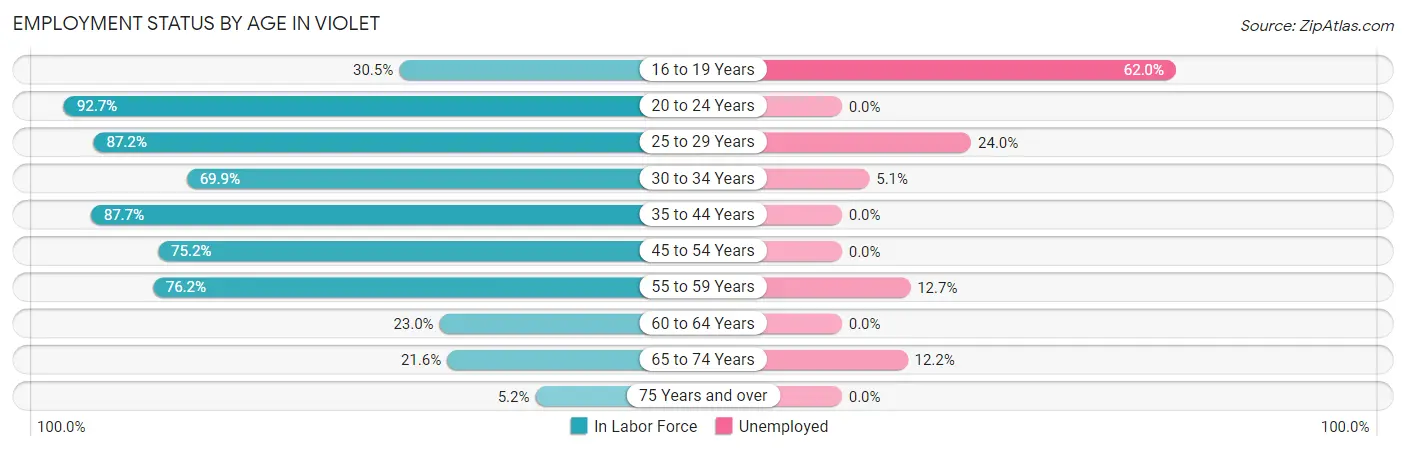
| Age Bracket | In Labor Force | Unemployed |
| 16 to 19 Years | 79 (30.5%) | 49 (62.0%) |
| 20 to 24 Years | 165 (92.7%) | 0 (0.0%) |
| 25 to 29 Years | 334 (87.2%) | 80 (24.0%) |
| 30 to 34 Years | 214 (69.9%) | 11 (5.1%) |
| 35 to 44 Years | 501 (87.7%) | 0 (0.0%) |
| 45 to 54 Years | 475 (75.2%) | 0 (0.0%) |
| 55 to 59 Years | 157 (76.2%) | 20 (12.7%) |
| 60 to 64 Years | 73 (23.0%) | 0 (0.0%) |
| 65 to 74 Years | 90 (21.6%) | 11 (12.2%) |
| 75 Years and over | 10 (5.2%) | 0 (0.0%) |
| Total | 2,098 (60.6%) | 172 (8.2%) |
Employment Status by Educational Attainment in Violet
According to labor force statistics for Violet, 72.6% of individuals (1,753) out of the total population between 25 and 64 years of age (2,415) are in the labor force, with 6.3% or 110 of them being unemployed. The group with the highest labor force participation rate are those with the educational attainment of bachelor's degree or higher, with 82.0% or 259 individuals in the labor force. Within the labor force, individuals with high school diploma education have the highest percentage of unemployment, with 10.9% or 61 of them being unemployed.
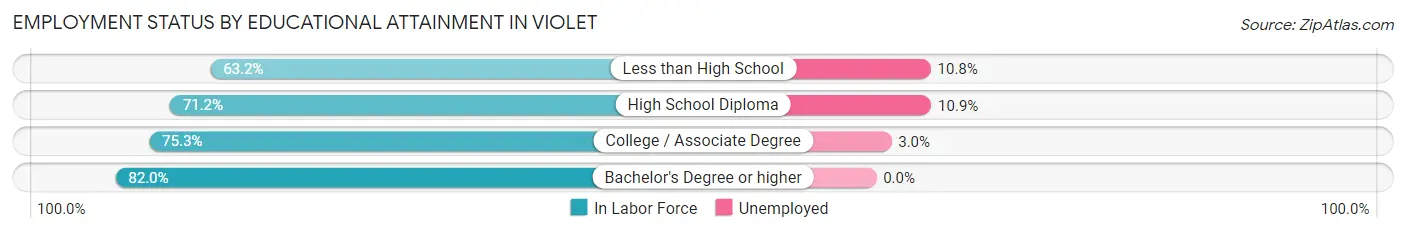
| Educational Attainment | In Labor Force | Unemployed |
| Less than High School | 277 (63.2%) | 47 (10.8%) |
| High School Diploma | 561 (71.2%) | 86 (10.9%) |
| College / Associate Degree | 657 (75.3%) | 26 (3.0%) |
| Bachelor's Degree or higher | 259 (82.0%) | 0 (0.0%) |
| Total | 1,753 (72.6%) | 152 (6.3%) |
Employment Occupations by Sex in Violet
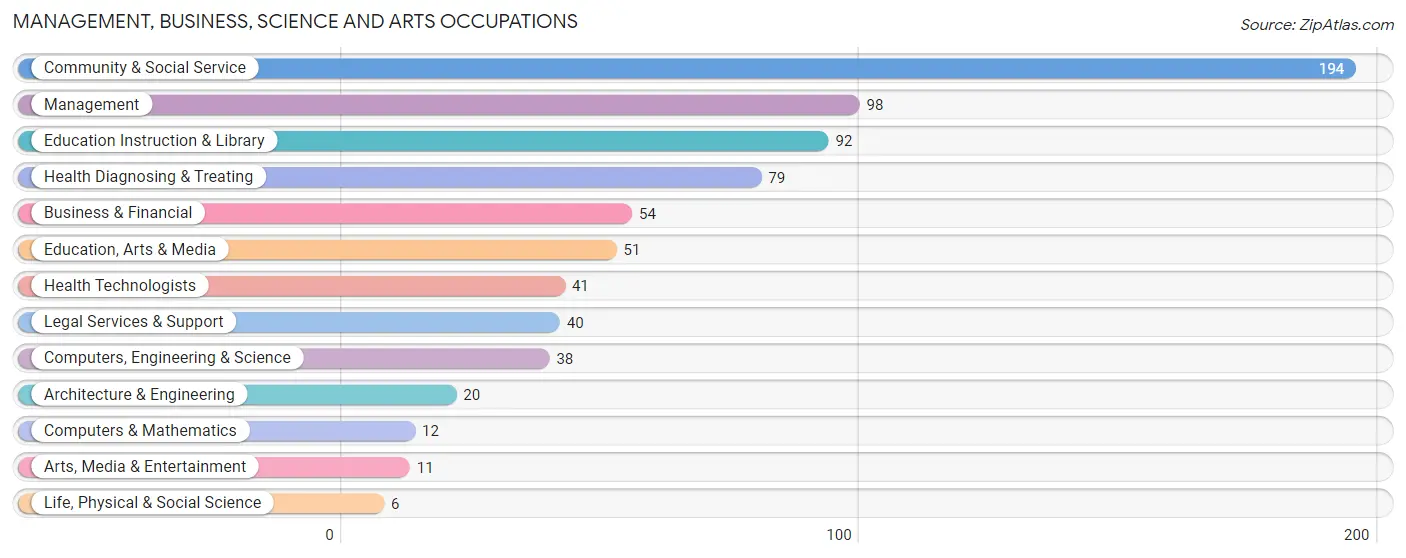
Management, Business, Science and Arts Occupations
The most common Management, Business, Science and Arts occupations in Violet are Community & Social Service (194 | 10.1%), Management (98 | 5.1%), Education Instruction & Library (92 | 4.8%), Health Diagnosing & Treating (79 | 4.1%), and Business & Financial (54 | 2.8%).
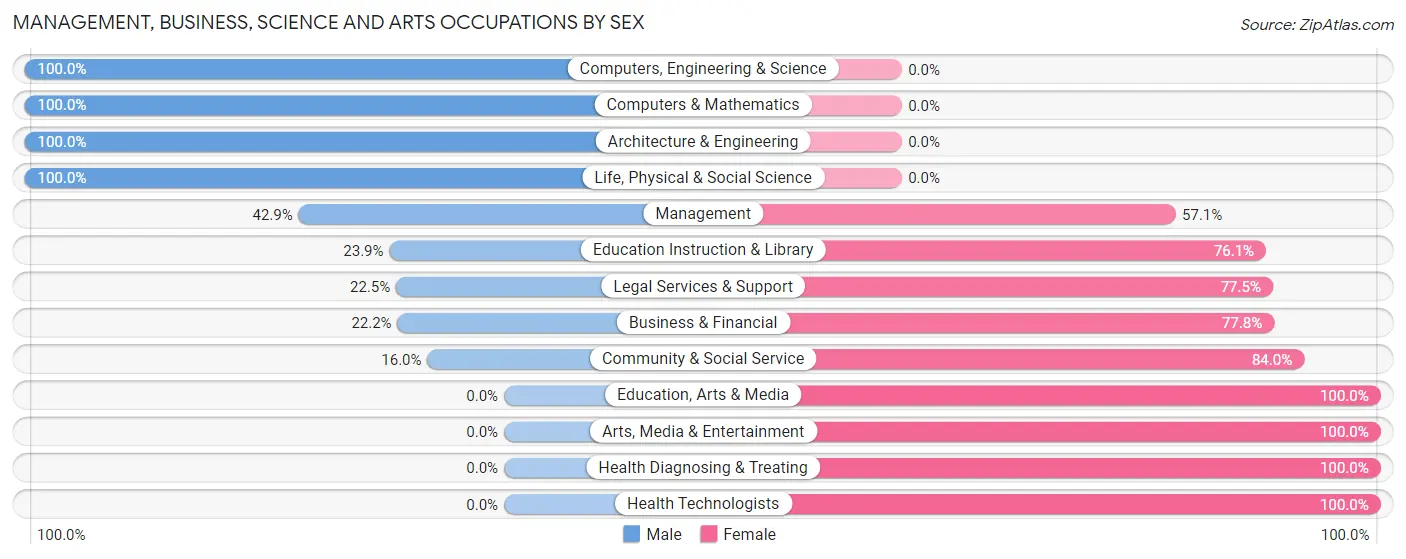
Management, Business, Science and Arts Occupations by Sex
Within the Management, Business, Science and Arts occupations in Violet, the most male-oriented occupations are Computers, Engineering & Science (100.0%), Computers & Mathematics (100.0%), and Architecture & Engineering (100.0%), while the most female-oriented occupations are Education, Arts & Media (100.0%), Arts, Media & Entertainment (100.0%), and Health Diagnosing & Treating (100.0%).
| Occupation | Male | Female |
| Management | 42 (42.9%) | 56 (57.1%) |
| Business & Financial | 12 (22.2%) | 42 (77.8%) |
| Computers, Engineering & Science | 38 (100.0%) | 0 (0.0%) |
| Computers & Mathematics | 12 (100.0%) | 0 (0.0%) |
| Architecture & Engineering | 20 (100.0%) | 0 (0.0%) |
| Life, Physical & Social Science | 6 (100.0%) | 0 (0.0%) |
| Community & Social Service | 31 (16.0%) | 163 (84.0%) |
| Education, Arts & Media | 0 (0.0%) | 51 (100.0%) |
| Legal Services & Support | 9 (22.5%) | 31 (77.5%) |
| Education Instruction & Library | 22 (23.9%) | 70 (76.1%) |
| Arts, Media & Entertainment | 0 (0.0%) | 11 (100.0%) |
| Health Diagnosing & Treating | 0 (0.0%) | 79 (100.0%) |
| Health Technologists | 0 (0.0%) | 41 (100.0%) |
| Total (Category) | 123 (26.6%) | 340 (73.4%) |
| Total (Overall) | 920 (47.7%) | 1,007 (52.3%) |
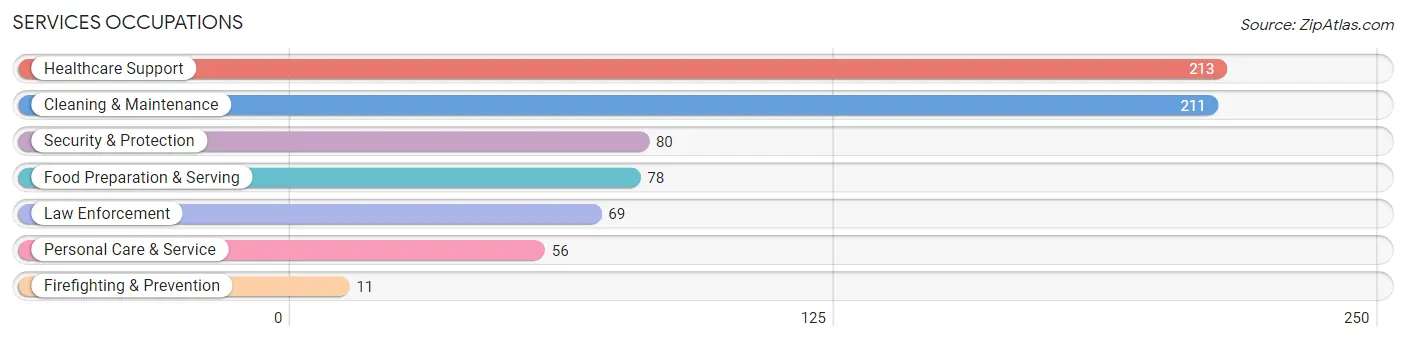
Services Occupations
The most common Services occupations in Violet are Healthcare Support (213 | 11.1%), Cleaning & Maintenance (211 | 11.0%), Security & Protection (80 | 4.2%), Food Preparation & Serving (78 | 4.1%), and Law Enforcement (69 | 3.6%).
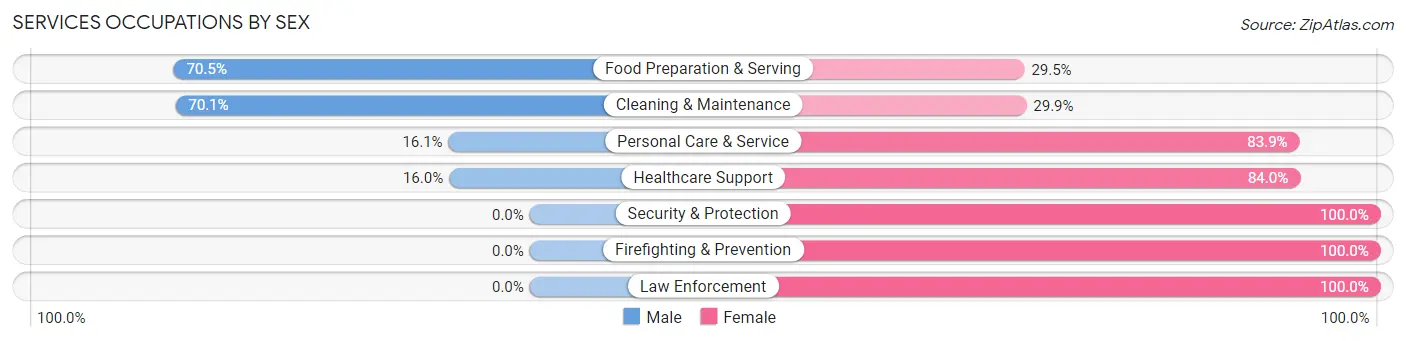
Services Occupations by Sex
Within the Services occupations in Violet, the most male-oriented occupations are Food Preparation & Serving (70.5%), Cleaning & Maintenance (70.1%), and Personal Care & Service (16.1%), while the most female-oriented occupations are Security & Protection (100.0%), Firefighting & Prevention (100.0%), and Law Enforcement (100.0%).
| Occupation | Male | Female |
| Healthcare Support | 34 (16.0%) | 179 (84.0%) |
| Security & Protection | 0 (0.0%) | 80 (100.0%) |
| Firefighting & Prevention | 0 (0.0%) | 11 (100.0%) |
| Law Enforcement | 0 (0.0%) | 69 (100.0%) |
| Food Preparation & Serving | 55 (70.5%) | 23 (29.5%) |
| Cleaning & Maintenance | 148 (70.1%) | 63 (29.9%) |
| Personal Care & Service | 9 (16.1%) | 47 (83.9%) |
| Total (Category) | 246 (38.6%) | 392 (61.4%) |
| Total (Overall) | 920 (47.7%) | 1,007 (52.3%) |
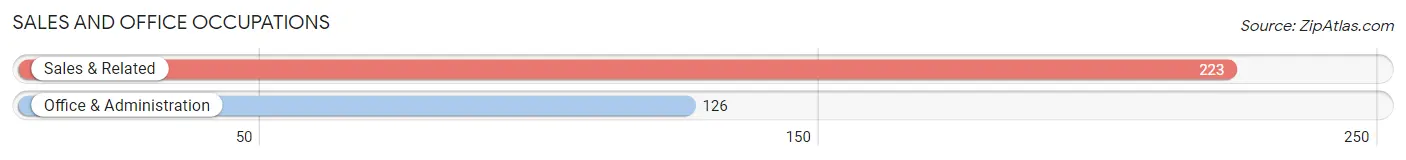
Sales and Office Occupations
The most common Sales and Office occupations in Violet are Sales & Related (223 | 11.6%), and Office & Administration (126 | 6.5%).
Sales and Office Occupations by Sex
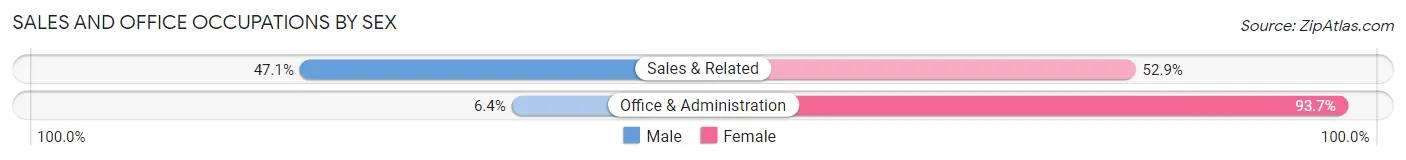
| Occupation | Male | Female |
| Sales & Related | 105 (47.1%) | 118 (52.9%) |
| Office & Administration | 8 (6.4%) | 118 (93.6%) |
| Total (Category) | 113 (32.4%) | 236 (67.6%) |
| Total (Overall) | 920 (47.7%) | 1,007 (52.3%) |
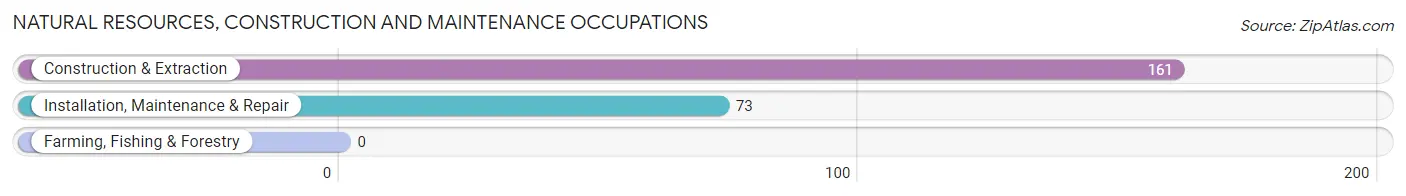
Natural Resources, Construction and Maintenance Occupations
The most common Natural Resources, Construction and Maintenance occupations in Violet are Construction & Extraction (161 | 8.4%), and Installation, Maintenance & Repair (73 | 3.8%).
Natural Resources, Construction and Maintenance Occupations by Sex
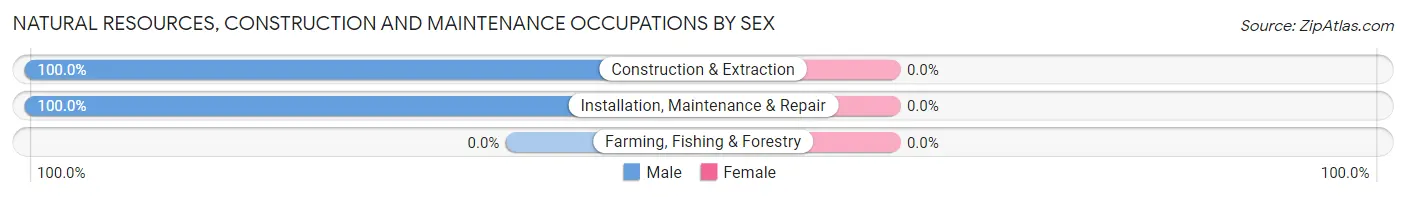
| Occupation | Male | Female |
| Farming, Fishing & Forestry | 0 (0.0%) | 0 (0.0%) |
| Construction & Extraction | 161 (100.0%) | 0 (0.0%) |
| Installation, Maintenance & Repair | 73 (100.0%) | 0 (0.0%) |
| Total (Category) | 234 (100.0%) | 0 (0.0%) |
| Total (Overall) | 920 (47.7%) | 1,007 (52.3%) |
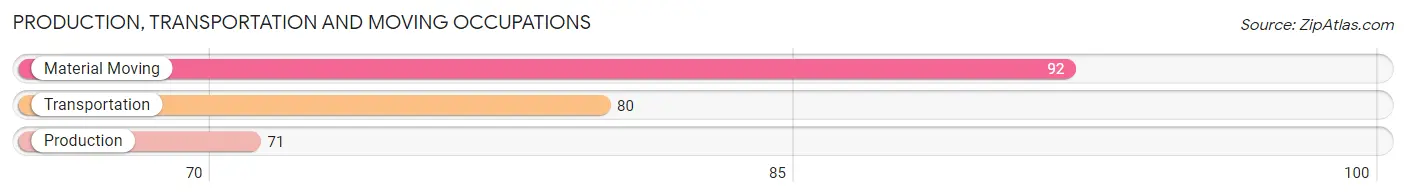
Production, Transportation and Moving Occupations
The most common Production, Transportation and Moving occupations in Violet are Material Moving (92 | 4.8%), Transportation (80 | 4.2%), and Production (71 | 3.7%).
Production, Transportation and Moving Occupations by Sex
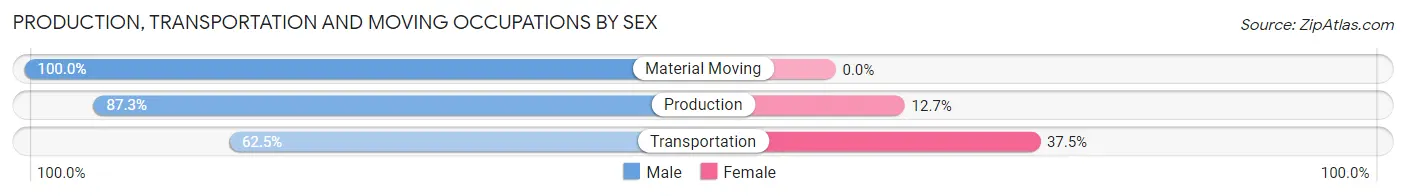
| Occupation | Male | Female |
| Production | 62 (87.3%) | 9 (12.7%) |
| Transportation | 50 (62.5%) | 30 (37.5%) |
| Material Moving | 92 (100.0%) | 0 (0.0%) |
| Total (Category) | 204 (84.0%) | 39 (16.1%) |
| Total (Overall) | 920 (47.7%) | 1,007 (52.3%) |
Employment Industries by Sex in Violet
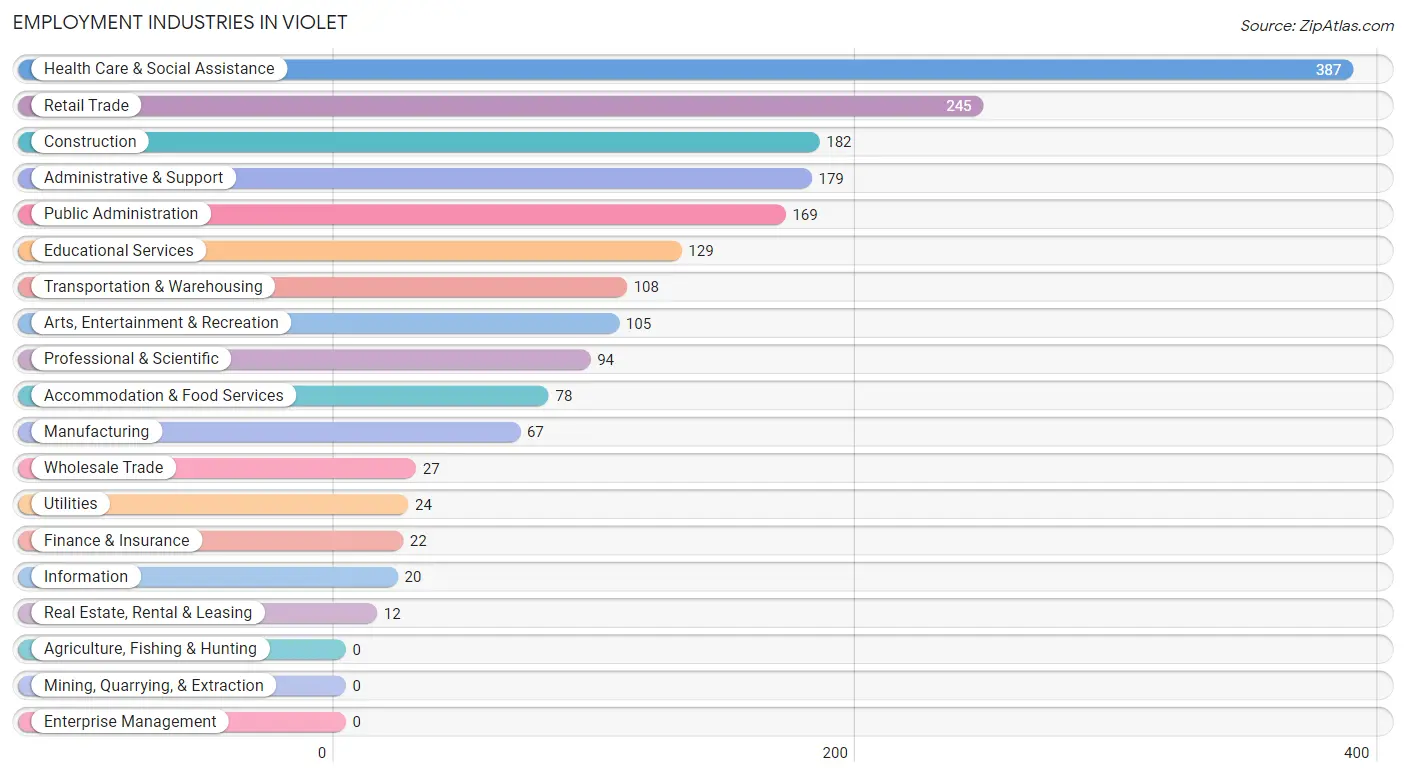
Employment Industries in Violet
The major employment industries in Violet include Health Care & Social Assistance (387 | 20.1%), Retail Trade (245 | 12.7%), Construction (182 | 9.4%), Administrative & Support (179 | 9.3%), and Public Administration (169 | 8.8%).
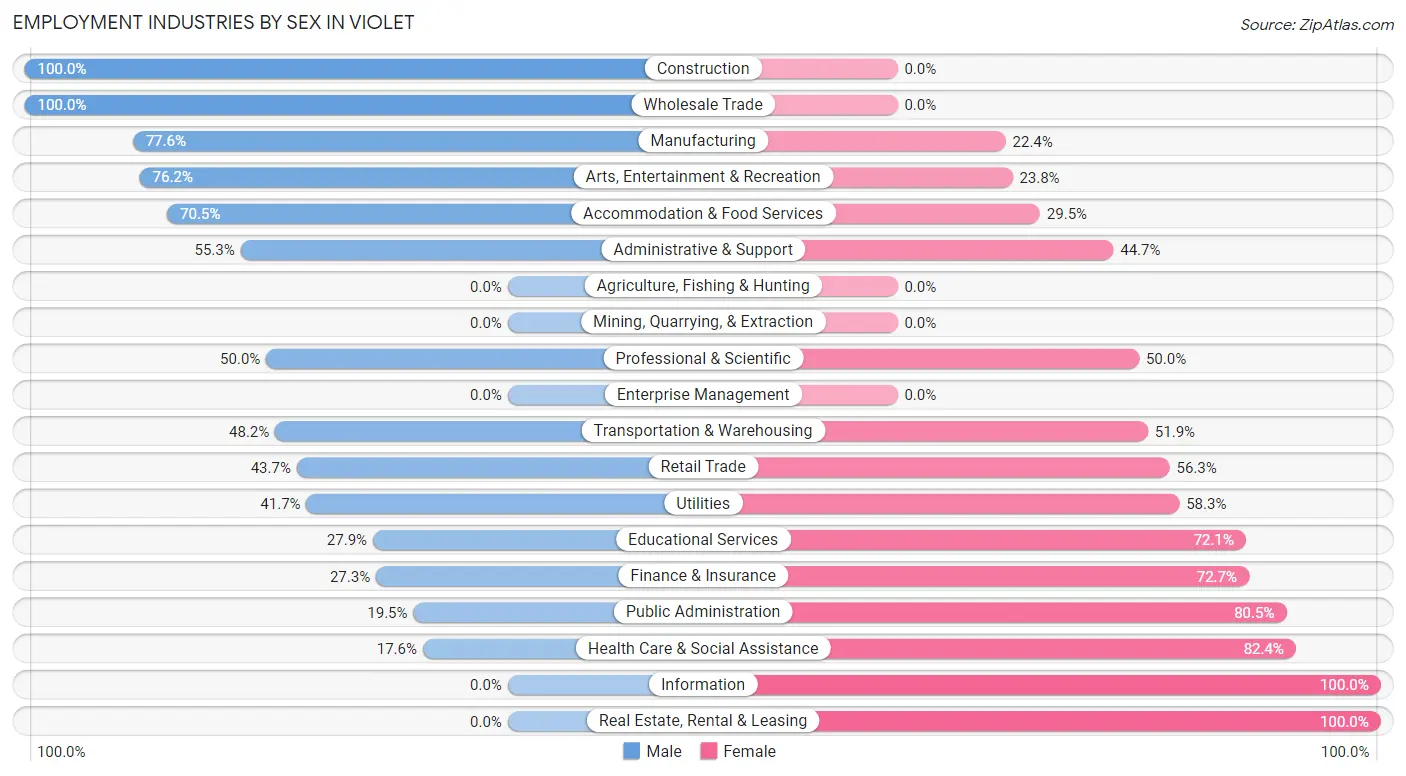
Employment Industries by Sex in Violet
The Violet industries that see more men than women are Construction (100.0%), Wholesale Trade (100.0%), and Manufacturing (77.6%), whereas the industries that tend to have a higher number of women are Information (100.0%), Real Estate, Rental & Leasing (100.0%), and Health Care & Social Assistance (82.4%).
| Industry | Male | Female |
| Agriculture, Fishing & Hunting | 0 (0.0%) | 0 (0.0%) |
| Mining, Quarrying, & Extraction | 0 (0.0%) | 0 (0.0%) |
| Construction | 182 (100.0%) | 0 (0.0%) |
| Manufacturing | 52 (77.6%) | 15 (22.4%) |
| Wholesale Trade | 27 (100.0%) | 0 (0.0%) |
| Retail Trade | 107 (43.7%) | 138 (56.3%) |
| Transportation & Warehousing | 52 (48.1%) | 56 (51.8%) |
| Utilities | 10 (41.7%) | 14 (58.3%) |
| Information | 0 (0.0%) | 20 (100.0%) |
| Finance & Insurance | 6 (27.3%) | 16 (72.7%) |
| Real Estate, Rental & Leasing | 0 (0.0%) | 12 (100.0%) |
| Professional & Scientific | 47 (50.0%) | 47 (50.0%) |
| Enterprise Management | 0 (0.0%) | 0 (0.0%) |
| Administrative & Support | 99 (55.3%) | 80 (44.7%) |
| Educational Services | 36 (27.9%) | 93 (72.1%) |
| Health Care & Social Assistance | 68 (17.6%) | 319 (82.4%) |
| Arts, Entertainment & Recreation | 80 (76.2%) | 25 (23.8%) |
| Accommodation & Food Services | 55 (70.5%) | 23 (29.5%) |
| Public Administration | 33 (19.5%) | 136 (80.5%) |
| Total | 920 (47.7%) | 1,007 (52.3%) |
Education in Violet
School Enrollment in Violet
The most common levels of schooling among the 1,406 students in Violet are middle school (389 | 27.7%), college / undergraduate (295 | 21.0%), and elementary school (290 | 20.6%).
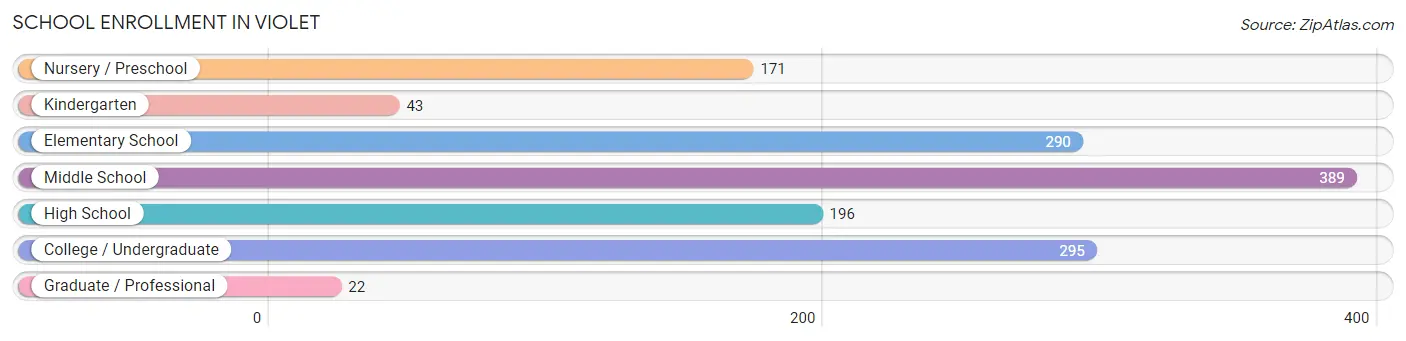
| School Level | # Students | % Students |
| Nursery / Preschool | 171 | 12.2% |
| Kindergarten | 43 | 3.1% |
| Elementary School | 290 | 20.6% |
| Middle School | 389 | 27.7% |
| High School | 196 | 13.9% |
| College / Undergraduate | 295 | 21.0% |
| Graduate / Professional | 22 | 1.6% |
| Total | 1,406 | 100.0% |
School Enrollment by Age by Funding Source in Violet
Out of a total of 1,406 students who are enrolled in schools in Violet, 150 (10.7%) attend a private institution, while the remaining 1,256 (89.3%) are enrolled in public schools. The age group of 35 years and over has the highest likelihood of being enrolled in private schools, with 22 (26.5% in the age bracket) enrolled. Conversely, the age group of 20 to 24 year olds has the lowest likelihood of being enrolled in a private school, with 63 (100.0% in the age bracket) attending a public institution.
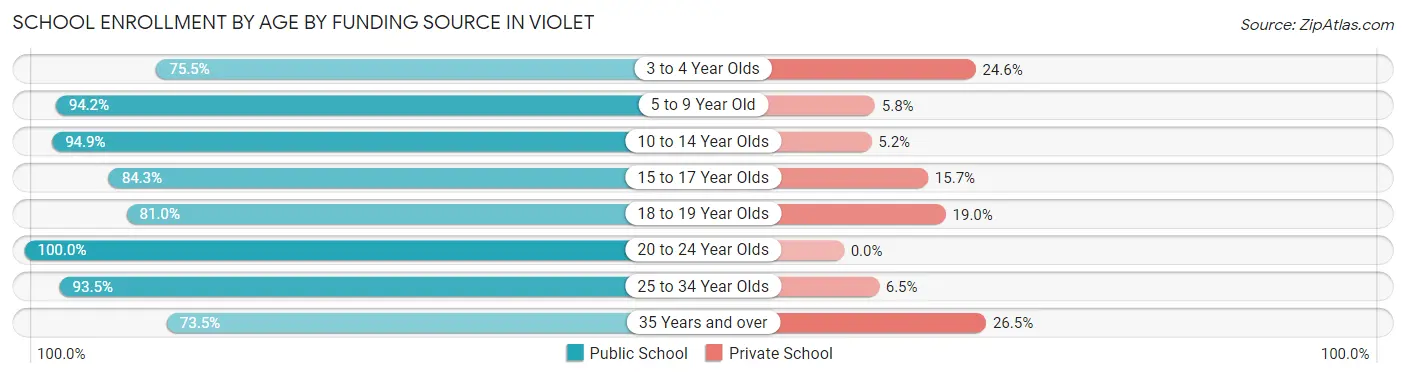
| Age Bracket | Public School | Private School |
| 3 to 4 Year Olds | 126 (75.4%) | 41 (24.5%) |
| 5 to 9 Year Old | 308 (94.2%) | 19 (5.8%) |
| 10 to 14 Year Olds | 405 (94.9%) | 22 (5.1%) |
| 15 to 17 Year Olds | 129 (84.3%) | 24 (15.7%) |
| 18 to 19 Year Olds | 64 (81.0%) | 15 (19.0%) |
| 20 to 24 Year Olds | 63 (100.0%) | 0 (0.0%) |
| 25 to 34 Year Olds | 100 (93.5%) | 7 (6.5%) |
| 35 Years and over | 61 (73.5%) | 22 (26.5%) |
| Total | 1,256 (89.3%) | 150 (10.7%) |
Educational Attainment by Field of Study in Violet
Business (142 | 36.4%), visual & performing arts (57 | 14.6%), arts & humanities (51 | 13.1%), education (43 | 11.0%), and physical & health sciences (34 | 8.7%) are the most common fields of study among 390 individuals in Violet who have obtained a bachelor's degree or higher.
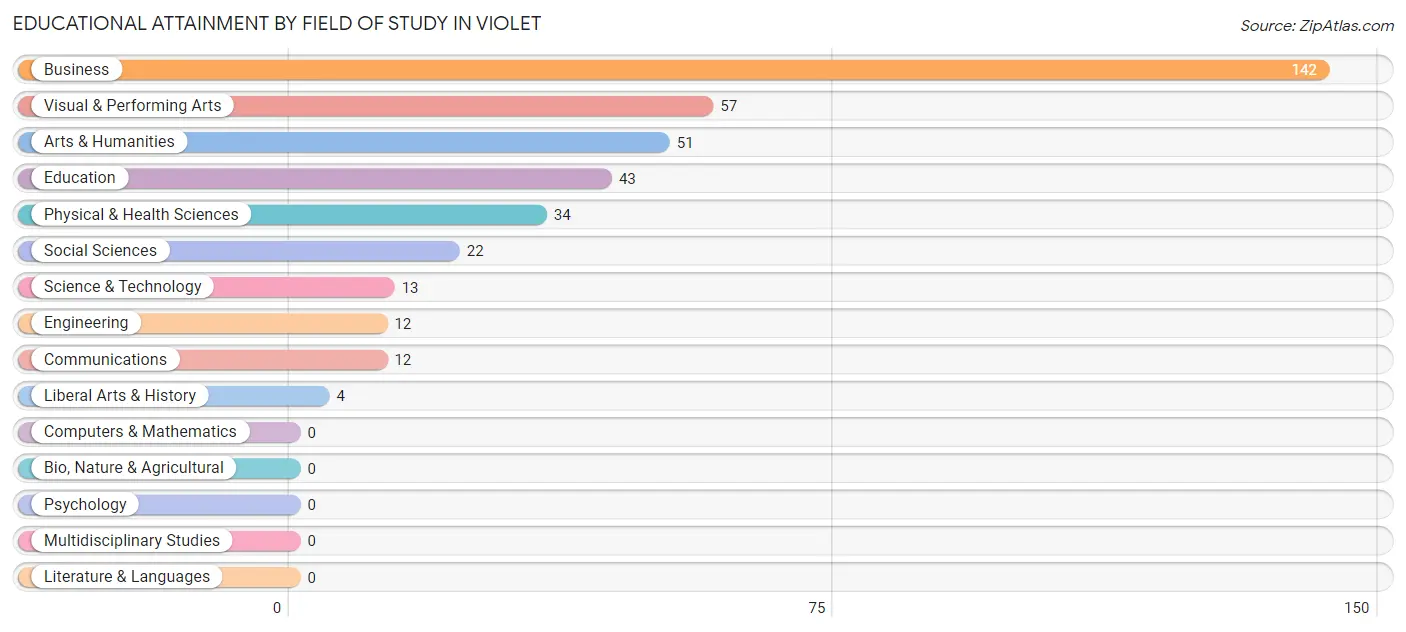
| Field of Study | # Graduates | % Graduates |
| Computers & Mathematics | 0 | 0.0% |
| Bio, Nature & Agricultural | 0 | 0.0% |
| Physical & Health Sciences | 34 | 8.7% |
| Psychology | 0 | 0.0% |
| Social Sciences | 22 | 5.6% |
| Engineering | 12 | 3.1% |
| Multidisciplinary Studies | 0 | 0.0% |
| Science & Technology | 13 | 3.3% |
| Business | 142 | 36.4% |
| Education | 43 | 11.0% |
| Literature & Languages | 0 | 0.0% |
| Liberal Arts & History | 4 | 1.0% |
| Visual & Performing Arts | 57 | 14.6% |
| Communications | 12 | 3.1% |
| Arts & Humanities | 51 | 13.1% |
| Total | 390 | 100.0% |
Transportation & Commute in Violet
Vehicle Availability by Sex in Violet
The most prevalent vehicle ownership categories in Violet are males with 2 vehicles (326, accounting for 35.4%) and females with 2 vehicles (456, making up 32.4%).
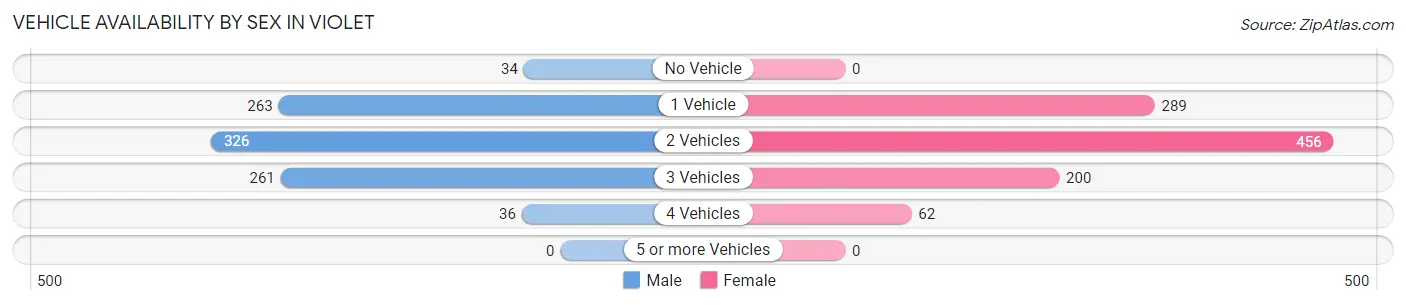
| Vehicles Available | Male | Female |
| No Vehicle | 34 (3.7%) | 0 (0.0%) |
| 1 Vehicle | 263 (28.6%) | 289 (28.7%) |
| 2 Vehicles | 326 (35.4%) | 456 (45.3%) |
| 3 Vehicles | 261 (28.4%) | 200 (19.9%) |
| 4 Vehicles | 36 (3.9%) | 62 (6.2%) |
| 5 or more Vehicles | 0 (0.0%) | 0 (0.0%) |
| Total | 920 (100.0%) | 1,007 (100.0%) |
Commute Time in Violet
The most frequently occuring commute durations in Violet are 45 to 59 minutes (388 commuters, 22.9%), 10 to 14 minutes (237 commuters, 14.0%), and 15 to 19 minutes (214 commuters, 12.7%).
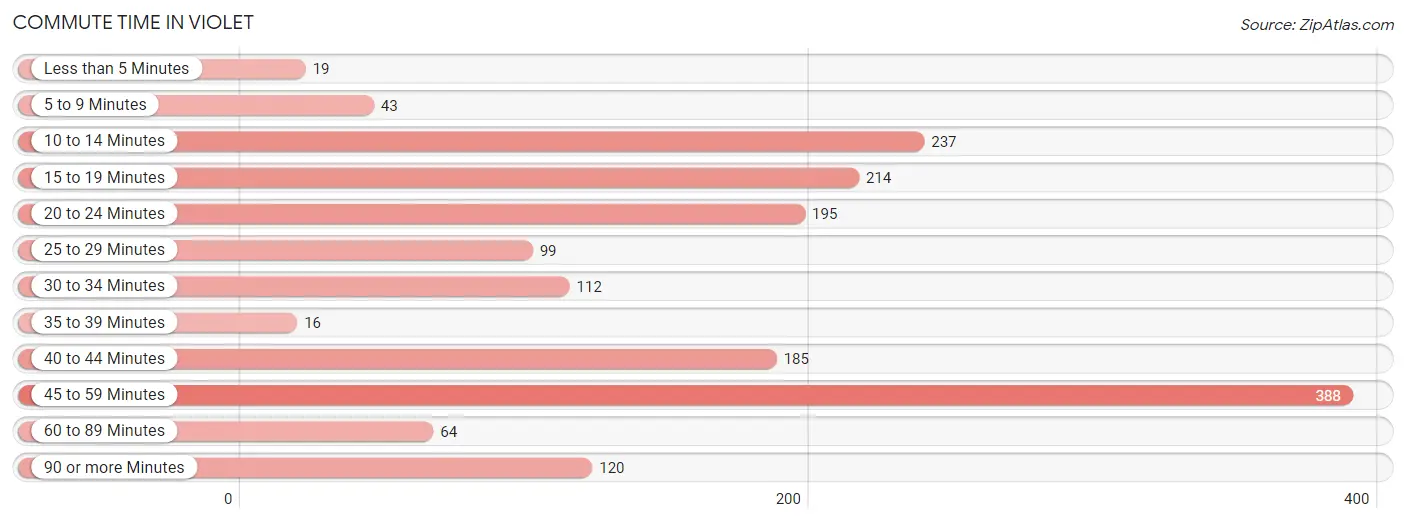
| Commute Time | # Commuters | % Commuters |
| Less than 5 Minutes | 19 | 1.1% |
| 5 to 9 Minutes | 43 | 2.5% |
| 10 to 14 Minutes | 237 | 14.0% |
| 15 to 19 Minutes | 214 | 12.7% |
| 20 to 24 Minutes | 195 | 11.5% |
| 25 to 29 Minutes | 99 | 5.9% |
| 30 to 34 Minutes | 112 | 6.6% |
| 35 to 39 Minutes | 16 | 0.9% |
| 40 to 44 Minutes | 185 | 10.9% |
| 45 to 59 Minutes | 388 | 22.9% |
| 60 to 89 Minutes | 64 | 3.8% |
| 90 or more Minutes | 120 | 7.1% |
Commute Time by Sex in Violet
The most common commute times in Violet are 45 to 59 minutes (151 commuters, 19.7%) for males and 45 to 59 minutes (237 commuters, 25.6%) for females.
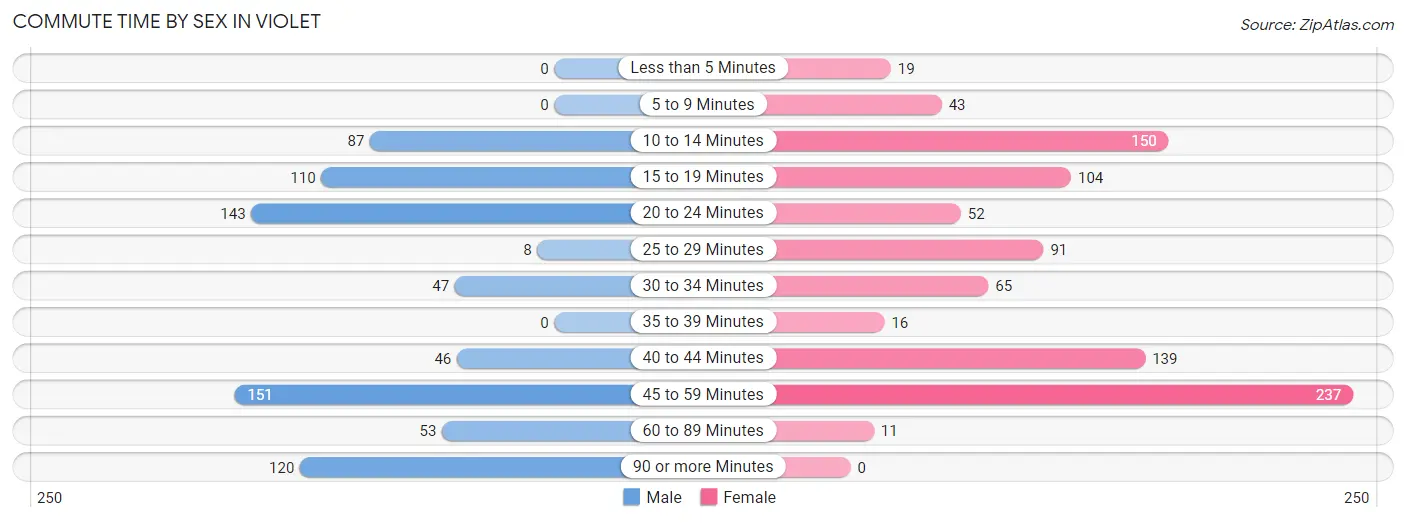
| Commute Time | Male | Female |
| Less than 5 Minutes | 0 (0.0%) | 19 (2.1%) |
| 5 to 9 Minutes | 0 (0.0%) | 43 (4.6%) |
| 10 to 14 Minutes | 87 (11.4%) | 150 (16.2%) |
| 15 to 19 Minutes | 110 (14.4%) | 104 (11.2%) |
| 20 to 24 Minutes | 143 (18.7%) | 52 (5.6%) |
| 25 to 29 Minutes | 8 (1.1%) | 91 (9.8%) |
| 30 to 34 Minutes | 47 (6.1%) | 65 (7.0%) |
| 35 to 39 Minutes | 0 (0.0%) | 16 (1.7%) |
| 40 to 44 Minutes | 46 (6.0%) | 139 (15.0%) |
| 45 to 59 Minutes | 151 (19.7%) | 237 (25.6%) |
| 60 to 89 Minutes | 53 (6.9%) | 11 (1.2%) |
| 90 or more Minutes | 120 (15.7%) | 0 (0.0%) |
Time of Departure to Work by Sex in Violet
The most frequent times of departure to work in Violet are 12:00 AM to 4:59 AM (139, 18.2%) for males and 7:00 AM to 7:29 AM (217, 23.4%) for females.
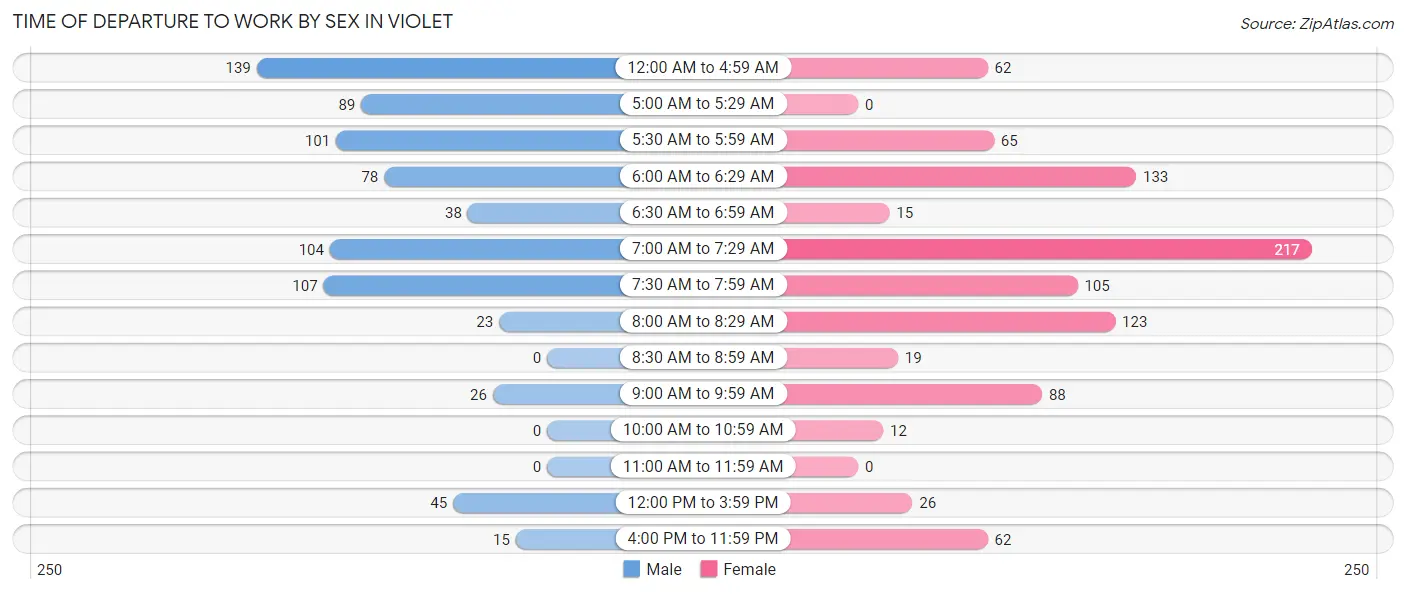
| Time of Departure | Male | Female |
| 12:00 AM to 4:59 AM | 139 (18.2%) | 62 (6.7%) |
| 5:00 AM to 5:29 AM | 89 (11.6%) | 0 (0.0%) |
| 5:30 AM to 5:59 AM | 101 (13.2%) | 65 (7.0%) |
| 6:00 AM to 6:29 AM | 78 (10.2%) | 133 (14.3%) |
| 6:30 AM to 6:59 AM | 38 (5.0%) | 15 (1.6%) |
| 7:00 AM to 7:29 AM | 104 (13.6%) | 217 (23.4%) |
| 7:30 AM to 7:59 AM | 107 (14.0%) | 105 (11.3%) |
| 8:00 AM to 8:29 AM | 23 (3.0%) | 123 (13.3%) |
| 8:30 AM to 8:59 AM | 0 (0.0%) | 19 (2.1%) |
| 9:00 AM to 9:59 AM | 26 (3.4%) | 88 (9.5%) |
| 10:00 AM to 10:59 AM | 0 (0.0%) | 12 (1.3%) |
| 11:00 AM to 11:59 AM | 0 (0.0%) | 0 (0.0%) |
| 12:00 PM to 3:59 PM | 45 (5.9%) | 26 (2.8%) |
| 4:00 PM to 11:59 PM | 15 (2.0%) | 62 (6.7%) |
| Total | 765 (100.0%) | 927 (100.0%) |
Housing Occupancy in Violet
Occupancy by Ownership in Violet
Of the total 1,627 dwellings in Violet, owner-occupied units account for 1,266 (77.8%), while renter-occupied units make up 361 (22.2%).
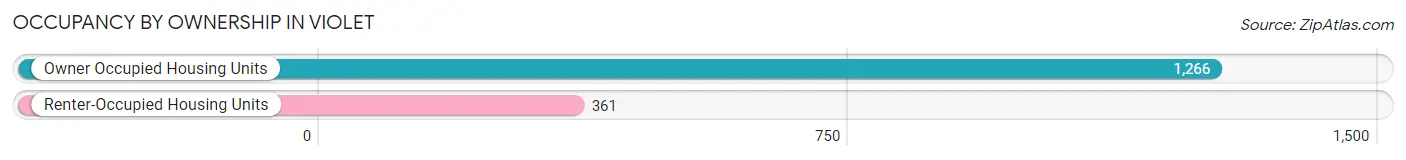
| Occupancy | # Housing Units | % Housing Units |
| Owner Occupied Housing Units | 1,266 | 77.8% |
| Renter-Occupied Housing Units | 361 | 22.2% |
| Total Occupied Housing Units | 1,627 | 100.0% |
Occupancy by Household Size in Violet
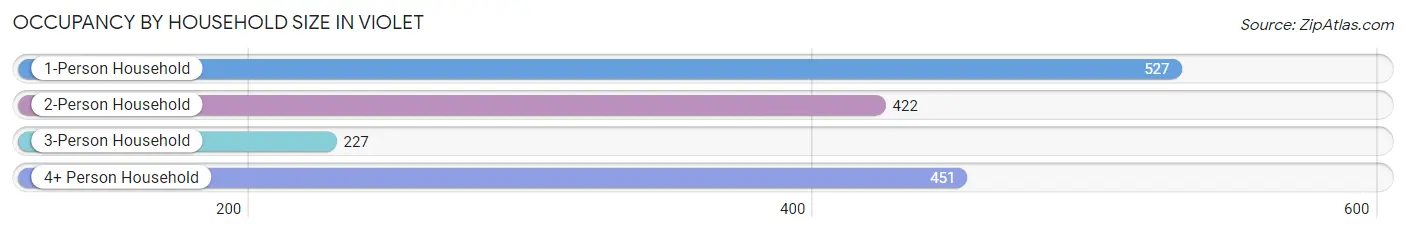
| Household Size | # Housing Units | % Housing Units |
| 1-Person Household | 527 | 32.4% |
| 2-Person Household | 422 | 25.9% |
| 3-Person Household | 227 | 14.0% |
| 4+ Person Household | 451 | 27.7% |
| Total Housing Units | 1,627 | 100.0% |
Occupancy by Ownership by Household Size in Violet
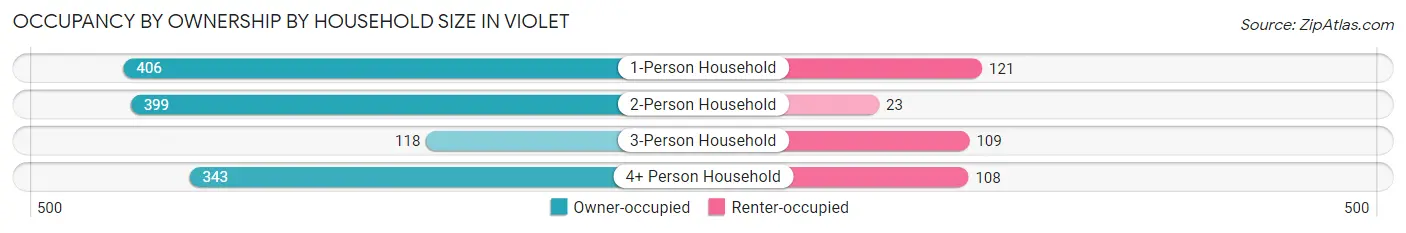
| Household Size | Owner-occupied | Renter-occupied |
| 1-Person Household | 406 (77.0%) | 121 (23.0%) |
| 2-Person Household | 399 (94.6%) | 23 (5.4%) |
| 3-Person Household | 118 (52.0%) | 109 (48.0%) |
| 4+ Person Household | 343 (76.0%) | 108 (23.9%) |
| Total Housing Units | 1,266 (77.8%) | 361 (22.2%) |
Occupancy by Educational Attainment in Violet
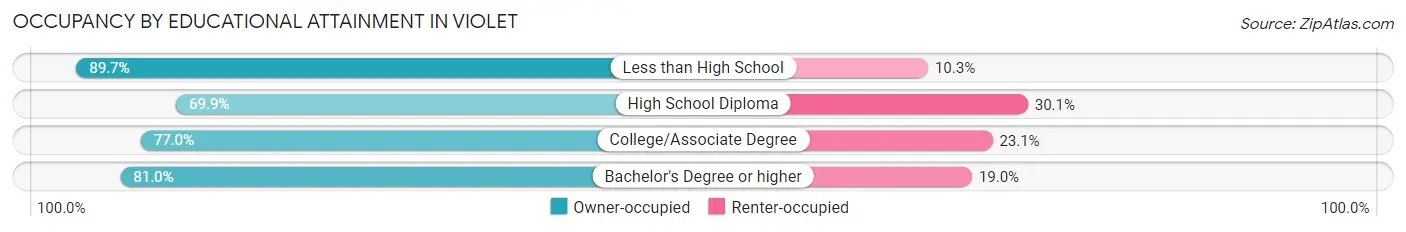
| Household Size | Owner-occupied | Renter-occupied |
| Less than High School | 262 (89.7%) | 30 (10.3%) |
| High School Diploma | 328 (69.9%) | 141 (30.1%) |
| College/Associate Degree | 484 (76.9%) | 145 (23.1%) |
| Bachelor's Degree or higher | 192 (81.0%) | 45 (19.0%) |
Occupancy by Age of Householder in Violet
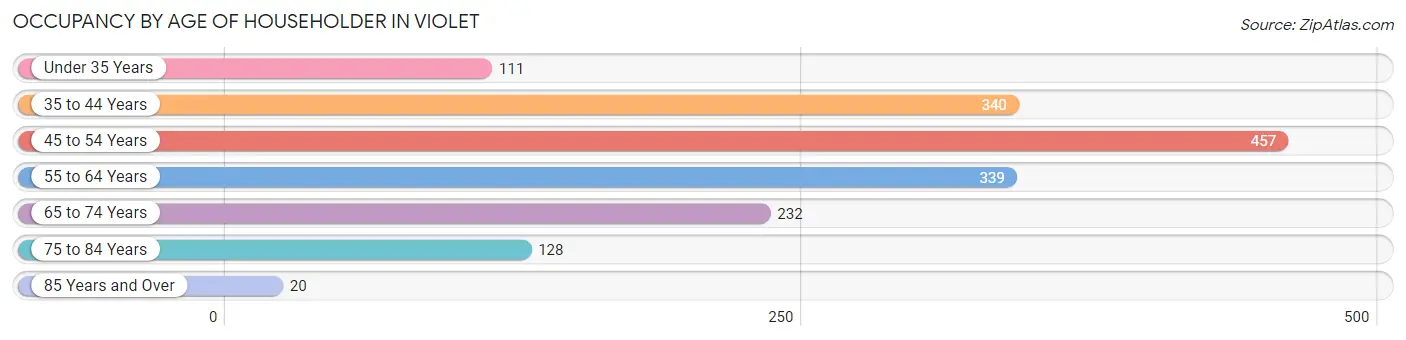
| Age Bracket | # Households | % Households |
| Under 35 Years | 111 | 6.8% |
| 35 to 44 Years | 340 | 20.9% |
| 45 to 54 Years | 457 | 28.1% |
| 55 to 64 Years | 339 | 20.8% |
| 65 to 74 Years | 232 | 14.3% |
| 75 to 84 Years | 128 | 7.9% |
| 85 Years and Over | 20 | 1.2% |
| Total | 1,627 | 100.0% |
Housing Finances in Violet
Median Income by Occupancy in Violet
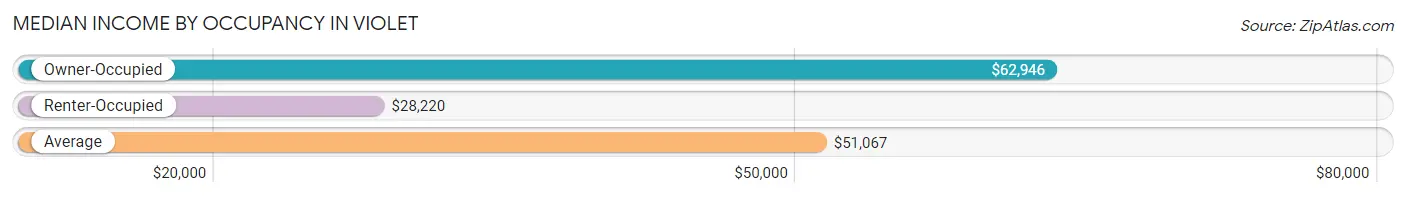
| Occupancy Type | # Households | Median Income |
| Owner-Occupied | 1,266 (77.8%) | $62,946 |
| Renter-Occupied | 361 (22.2%) | $28,220 |
| Average | 1,627 (100.0%) | $51,067 |
Occupancy by Householder Income Bracket in Violet
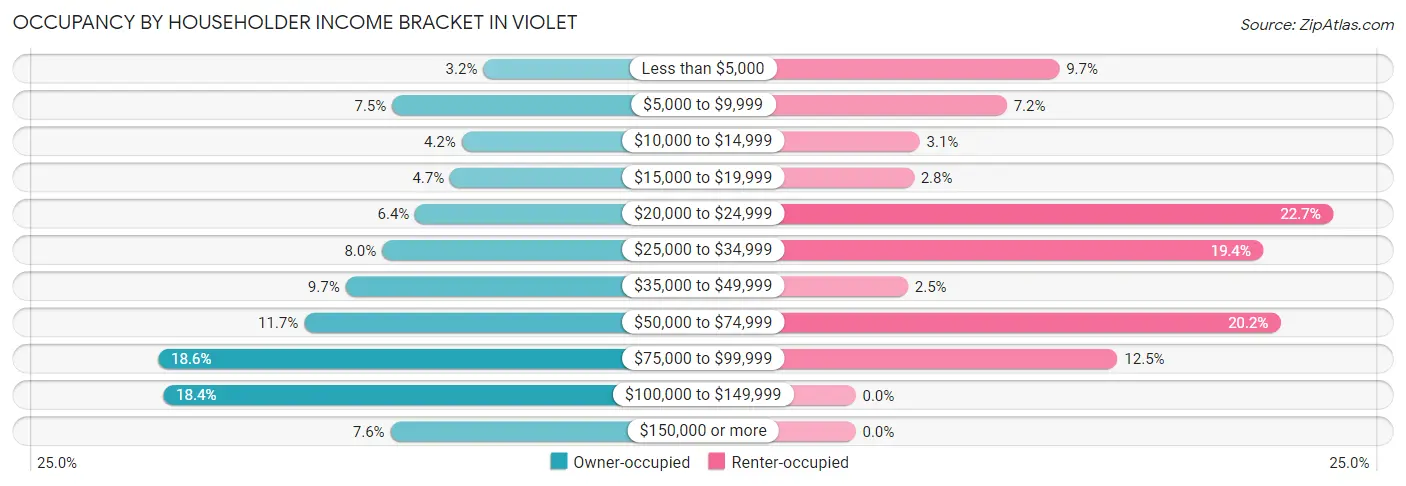
| Income Bracket | Owner-occupied | Renter-occupied |
| Less than $5,000 | 40 (3.2%) | 35 (9.7%) |
| $5,000 to $9,999 | 95 (7.5%) | 26 (7.2%) |
| $10,000 to $14,999 | 53 (4.2%) | 11 (3.0%) |
| $15,000 to $19,999 | 60 (4.7%) | 10 (2.8%) |
| $20,000 to $24,999 | 81 (6.4%) | 82 (22.7%) |
| $25,000 to $34,999 | 101 (8.0%) | 70 (19.4%) |
| $35,000 to $49,999 | 123 (9.7%) | 9 (2.5%) |
| $50,000 to $74,999 | 148 (11.7%) | 73 (20.2%) |
| $75,000 to $99,999 | 236 (18.6%) | 45 (12.5%) |
| $100,000 to $149,999 | 233 (18.4%) | 0 (0.0%) |
| $150,000 or more | 96 (7.6%) | 0 (0.0%) |
| Total | 1,266 (100.0%) | 361 (100.0%) |
Monthly Housing Cost Tiers in Violet
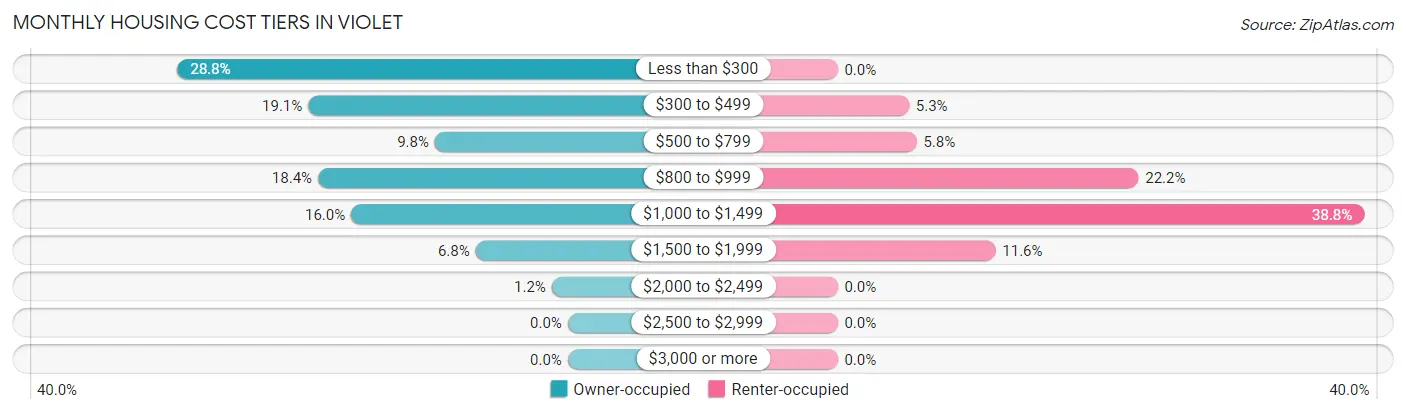
| Monthly Cost | Owner-occupied | Renter-occupied |
| Less than $300 | 364 (28.7%) | 0 (0.0%) |
| $300 to $499 | 242 (19.1%) | 19 (5.3%) |
| $500 to $799 | 124 (9.8%) | 21 (5.8%) |
| $800 to $999 | 233 (18.4%) | 80 (22.2%) |
| $1,000 to $1,499 | 202 (16.0%) | 140 (38.8%) |
| $1,500 to $1,999 | 86 (6.8%) | 42 (11.6%) |
| $2,000 to $2,499 | 15 (1.2%) | 0 (0.0%) |
| $2,500 to $2,999 | 0 (0.0%) | 0 (0.0%) |
| $3,000 or more | 0 (0.0%) | 0 (0.0%) |
| Total | 1,266 (100.0%) | 361 (100.0%) |
Physical Housing Characteristics in Violet
Housing Structures in Violet
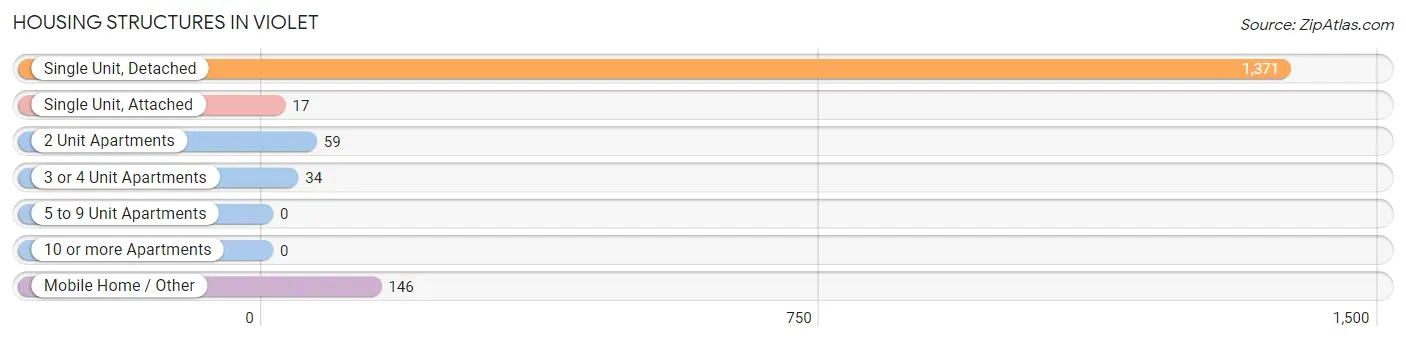
| Structure Type | # Housing Units | % Housing Units |
| Single Unit, Detached | 1,371 | 84.3% |
| Single Unit, Attached | 17 | 1.0% |
| 2 Unit Apartments | 59 | 3.6% |
| 3 or 4 Unit Apartments | 34 | 2.1% |
| 5 to 9 Unit Apartments | 0 | 0.0% |
| 10 or more Apartments | 0 | 0.0% |
| Mobile Home / Other | 146 | 9.0% |
| Total | 1,627 | 100.0% |
Housing Structures by Occupancy in Violet
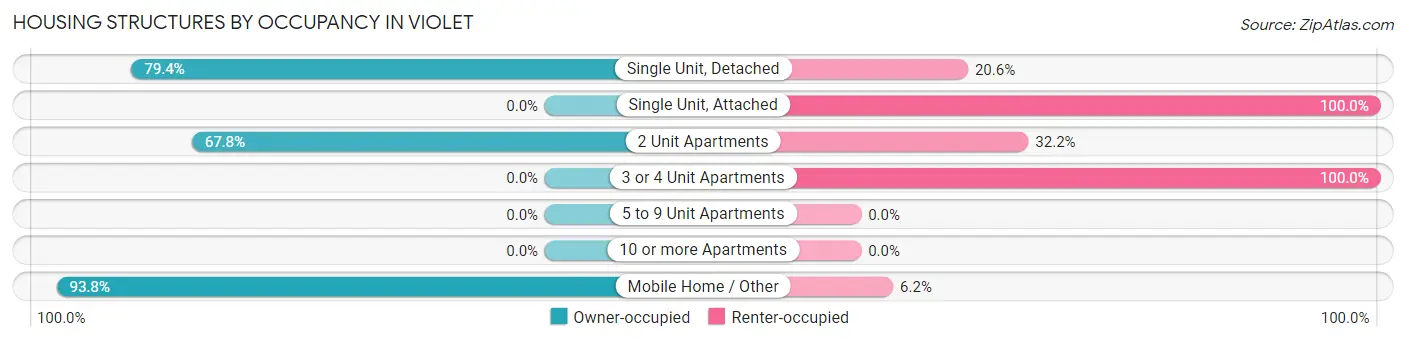
| Structure Type | Owner-occupied | Renter-occupied |
| Single Unit, Detached | 1,089 (79.4%) | 282 (20.6%) |
| Single Unit, Attached | 0 (0.0%) | 17 (100.0%) |
| 2 Unit Apartments | 40 (67.8%) | 19 (32.2%) |
| 3 or 4 Unit Apartments | 0 (0.0%) | 34 (100.0%) |
| 5 to 9 Unit Apartments | 0 (0.0%) | 0 (0.0%) |
| 10 or more Apartments | 0 (0.0%) | 0 (0.0%) |
| Mobile Home / Other | 137 (93.8%) | 9 (6.2%) |
| Total | 1,266 (77.8%) | 361 (22.2%) |
Housing Structures by Number of Rooms in Violet
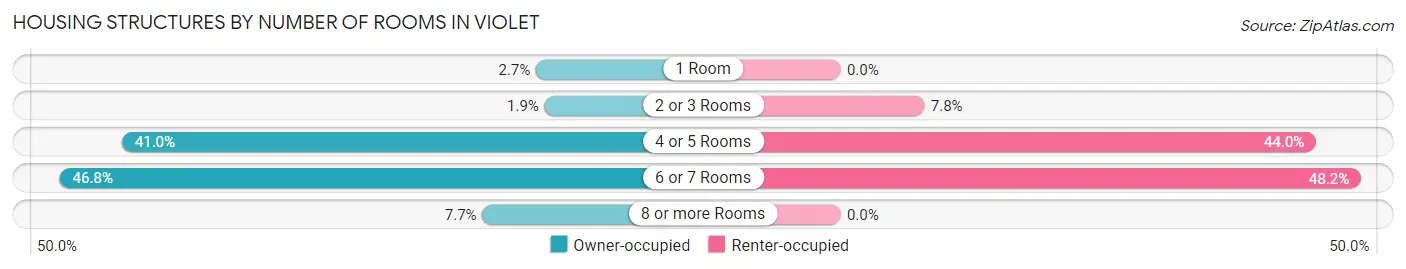
| Number of Rooms | Owner-occupied | Renter-occupied |
| 1 Room | 34 (2.7%) | 0 (0.0%) |
| 2 or 3 Rooms | 24 (1.9%) | 28 (7.8%) |
| 4 or 5 Rooms | 519 (41.0%) | 159 (44.0%) |
| 6 or 7 Rooms | 592 (46.8%) | 174 (48.2%) |
| 8 or more Rooms | 97 (7.7%) | 0 (0.0%) |
| Total | 1,266 (100.0%) | 361 (100.0%) |
Housing Structure by Heating Type in Violet
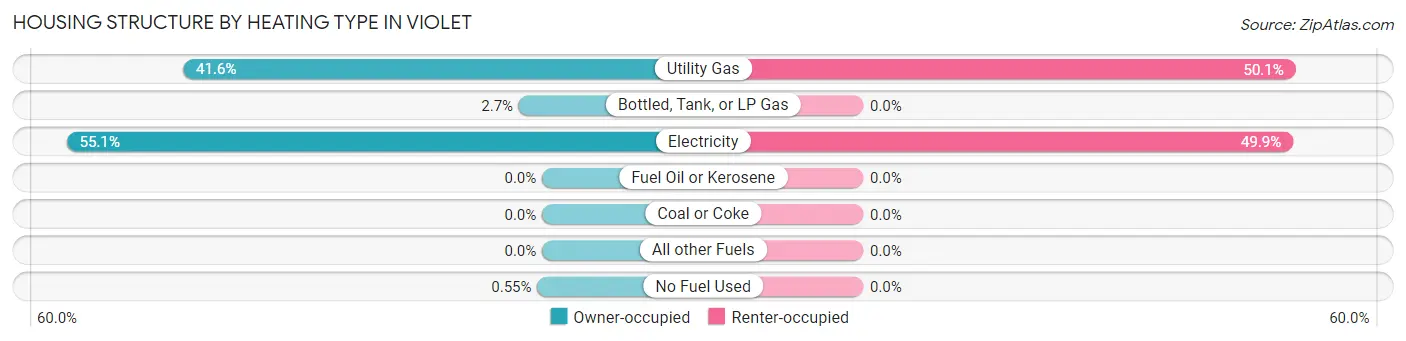
| Heating Type | Owner-occupied | Renter-occupied |
| Utility Gas | 527 (41.6%) | 181 (50.1%) |
| Bottled, Tank, or LP Gas | 34 (2.7%) | 0 (0.0%) |
| Electricity | 698 (55.1%) | 180 (49.9%) |
| Fuel Oil or Kerosene | 0 (0.0%) | 0 (0.0%) |
| Coal or Coke | 0 (0.0%) | 0 (0.0%) |
| All other Fuels | 0 (0.0%) | 0 (0.0%) |
| No Fuel Used | 7 (0.5%) | 0 (0.0%) |
| Total | 1,266 (100.0%) | 361 (100.0%) |
Household Vehicle Usage in Violet
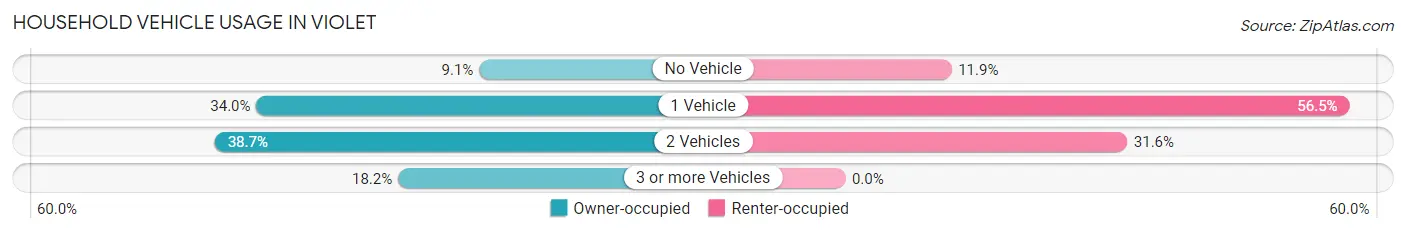
| Vehicles per Household | Owner-occupied | Renter-occupied |
| No Vehicle | 115 (9.1%) | 43 (11.9%) |
| 1 Vehicle | 431 (34.0%) | 204 (56.5%) |
| 2 Vehicles | 490 (38.7%) | 114 (31.6%) |
| 3 or more Vehicles | 230 (18.2%) | 0 (0.0%) |
| Total | 1,266 (100.0%) | 361 (100.0%) |
Real Estate & Mortgages in Violet
Real Estate and Mortgage Overview in Violet
| Characteristic | Without Mortgage | With Mortgage |
| Housing Units | 701 | 565 |
| Median Property Value | $172,000 | $158,300 |
| Median Household Income | $45,982 | $37 |
| Monthly Housing Costs | $293 | $0 |
| Real Estate Taxes | $841 | $334 |
Property Value by Mortgage Status in Violet
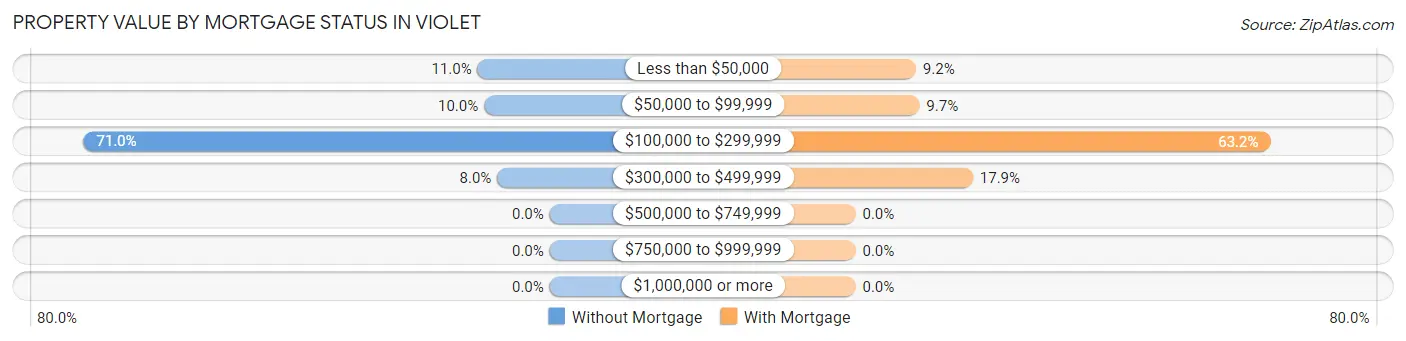
| Property Value | Without Mortgage | With Mortgage |
| Less than $50,000 | 77 (11.0%) | 52 (9.2%) |
| $50,000 to $99,999 | 70 (10.0%) | 55 (9.7%) |
| $100,000 to $299,999 | 498 (71.0%) | 357 (63.2%) |
| $300,000 to $499,999 | 56 (8.0%) | 101 (17.9%) |
| $500,000 to $749,999 | 0 (0.0%) | 0 (0.0%) |
| $750,000 to $999,999 | 0 (0.0%) | 0 (0.0%) |
| $1,000,000 or more | 0 (0.0%) | 0 (0.0%) |
| Total | 701 (100.0%) | 565 (100.0%) |
Household Income by Mortgage Status in Violet
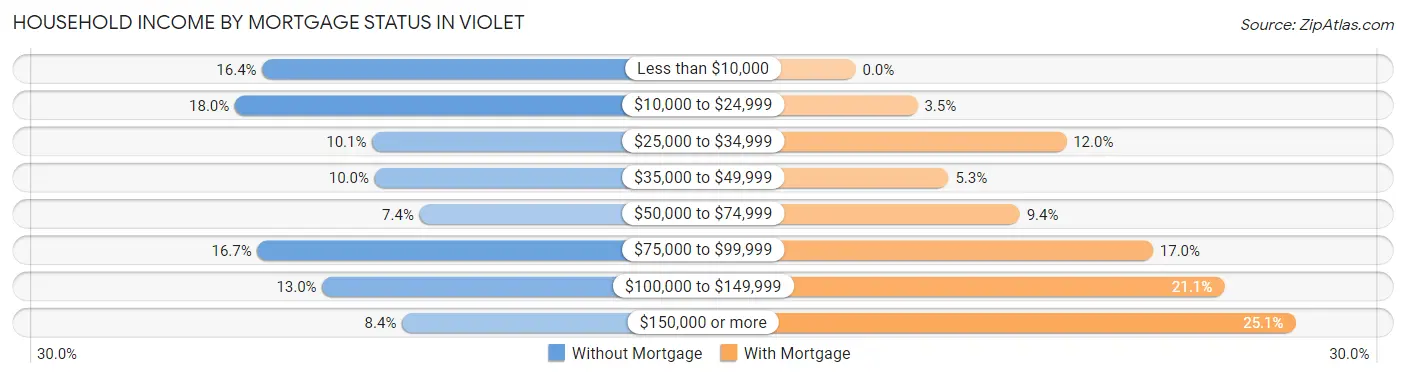
| Household Income | Without Mortgage | With Mortgage |
| Less than $10,000 | 115 (16.4%) | 0 (0.0%) |
| $10,000 to $24,999 | 126 (18.0%) | 20 (3.5%) |
| $25,000 to $34,999 | 71 (10.1%) | 68 (12.0%) |
| $35,000 to $49,999 | 70 (10.0%) | 30 (5.3%) |
| $50,000 to $74,999 | 52 (7.4%) | 53 (9.4%) |
| $75,000 to $99,999 | 117 (16.7%) | 96 (17.0%) |
| $100,000 to $149,999 | 91 (13.0%) | 119 (21.1%) |
| $150,000 or more | 59 (8.4%) | 142 (25.1%) |
| Total | 701 (100.0%) | 565 (100.0%) |
Property Value to Household Income Ratio in Violet
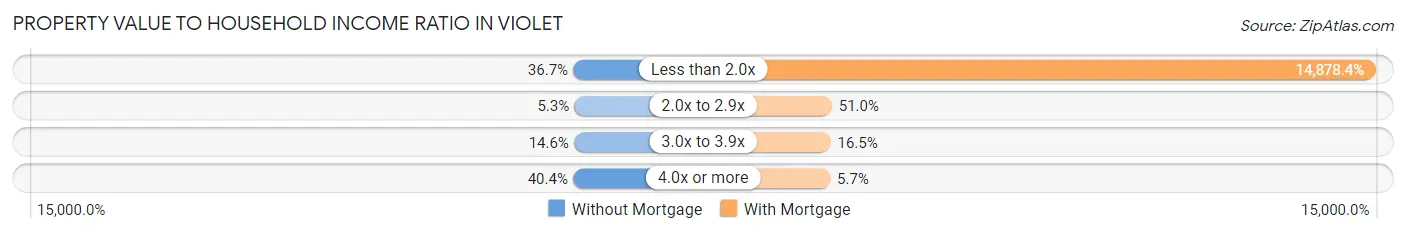
| Value-to-Income Ratio | Without Mortgage | With Mortgage |
| Less than 2.0x | 257 (36.7%) | 84,063 (14,878.4%) |
| 2.0x to 2.9x | 37 (5.3%) | 288 (51.0%) |
| 3.0x to 3.9x | 102 (14.5%) | 93 (16.5%) |
| 4.0x or more | 283 (40.4%) | 32 (5.7%) |
| Total | 701 (100.0%) | 565 (100.0%) |
Real Estate Taxes by Mortgage Status in Violet
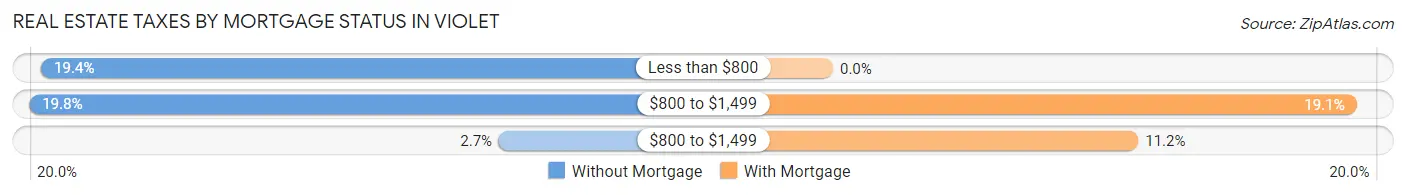
| Property Taxes | Without Mortgage | With Mortgage |
| Less than $800 | 136 (19.4%) | 0 (0.0%) |
| $800 to $1,499 | 139 (19.8%) | 108 (19.1%) |
| $800 to $1,499 | 19 (2.7%) | 63 (11.2%) |
| Total | 701 (100.0%) | 565 (100.0%) |
Health & Disability in Violet
Health Insurance Coverage by Age in Violet
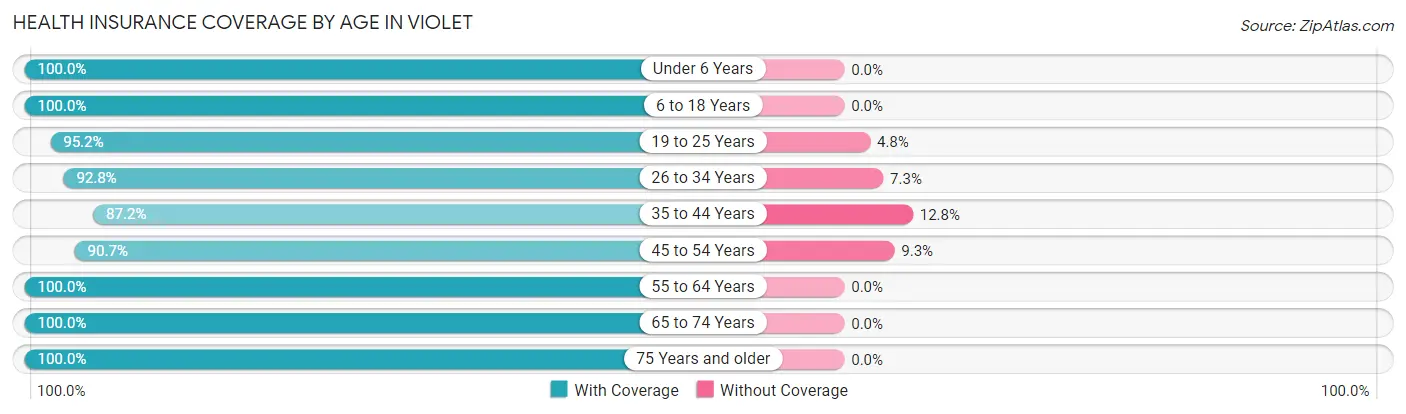
| Age Bracket | With Coverage | Without Coverage |
| Under 6 Years | 454 (100.0%) | 0 (0.0%) |
| 6 to 18 Years | 983 (100.0%) | 0 (0.0%) |
| 19 to 25 Years | 377 (95.2%) | 19 (4.8%) |
| 26 to 34 Years | 537 (92.7%) | 42 (7.2%) |
| 35 to 44 Years | 498 (87.2%) | 73 (12.8%) |
| 45 to 54 Years | 573 (90.7%) | 59 (9.3%) |
| 55 to 64 Years | 523 (100.0%) | 0 (0.0%) |
| 65 to 74 Years | 416 (100.0%) | 0 (0.0%) |
| 75 Years and older | 194 (100.0%) | 0 (0.0%) |
| Total | 4,555 (95.9%) | 193 (4.1%) |
Health Insurance Coverage by Citizenship Status in Violet
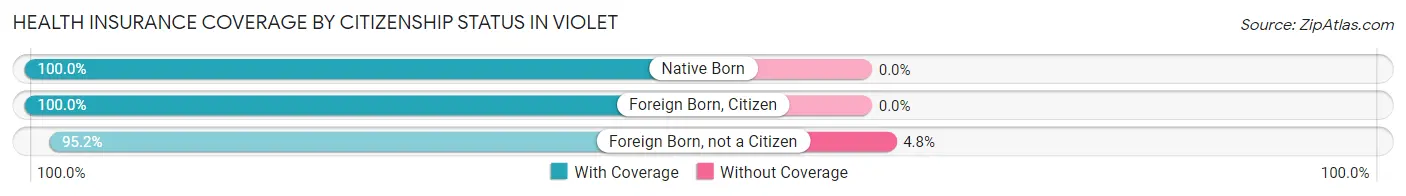
| Citizenship Status | With Coverage | Without Coverage |
| Native Born | 454 (100.0%) | 0 (0.0%) |
| Foreign Born, Citizen | 983 (100.0%) | 0 (0.0%) |
| Foreign Born, not a Citizen | 377 (95.2%) | 19 (4.8%) |
Health Insurance Coverage by Household Income in Violet
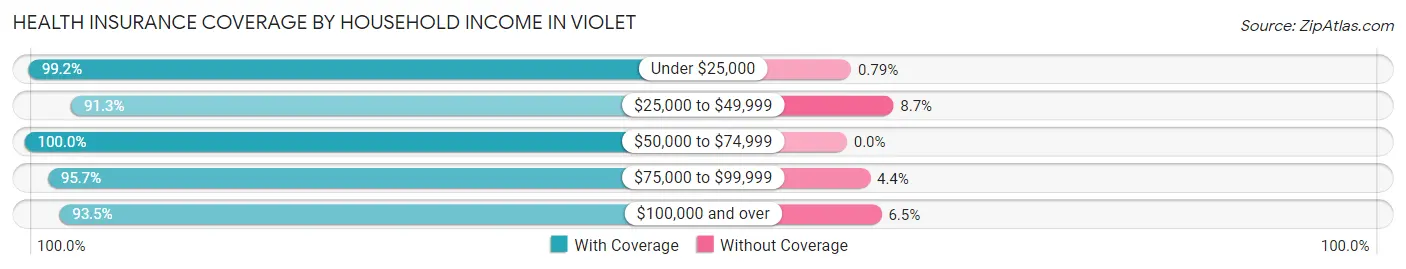
| Household Income | With Coverage | Without Coverage |
| Under $25,000 | 1,137 (99.2%) | 9 (0.8%) |
| $25,000 to $49,999 | 597 (91.3%) | 57 (8.7%) |
| $50,000 to $74,999 | 691 (100.0%) | 0 (0.0%) |
| $75,000 to $99,999 | 880 (95.7%) | 40 (4.3%) |
| $100,000 and over | 1,237 (93.5%) | 86 (6.5%) |
Public vs Private Health Insurance Coverage by Age in Violet
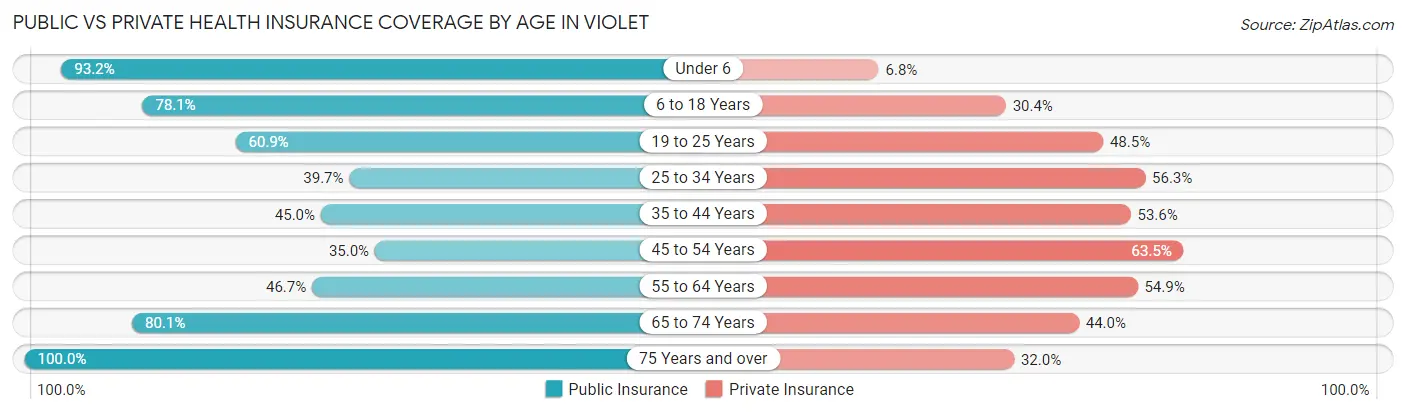
| Age Bracket | Public Insurance | Private Insurance |
| Under 6 | 423 (93.2%) | 31 (6.8%) |
| 6 to 18 Years | 768 (78.1%) | 299 (30.4%) |
| 19 to 25 Years | 241 (60.9%) | 192 (48.5%) |
| 25 to 34 Years | 230 (39.7%) | 326 (56.3%) |
| 35 to 44 Years | 257 (45.0%) | 306 (53.6%) |
| 45 to 54 Years | 221 (35.0%) | 401 (63.4%) |
| 55 to 64 Years | 244 (46.7%) | 287 (54.9%) |
| 65 to 74 Years | 333 (80.0%) | 183 (44.0%) |
| 75 Years and over | 194 (100.0%) | 62 (32.0%) |
| Total | 2,911 (61.3%) | 2,087 (44.0%) |
Disability Status by Sex by Age in Violet
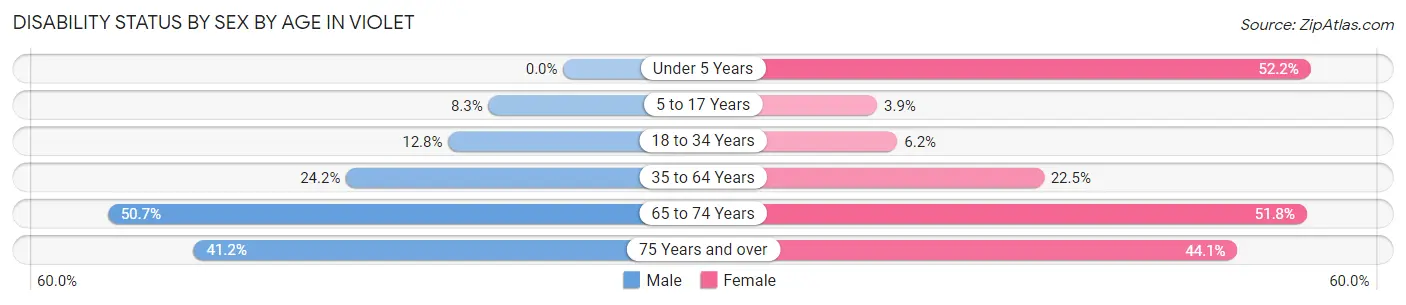
| Age Bracket | Male | Female |
| Under 5 Years | 0 (0.0%) | 118 (52.2%) |
| 5 to 17 Years | 32 (8.3%) | 25 (3.9%) |
| 18 to 34 Years | 73 (12.8%) | 26 (6.2%) |
| 35 to 64 Years | 198 (24.2%) | 204 (22.5%) |
| 65 to 74 Years | 69 (50.7%) | 145 (51.8%) |
| 75 Years and over | 21 (41.2%) | 63 (44.1%) |
Disability Class by Sex by Age in Violet
Disability Class: Hearing Difficulty
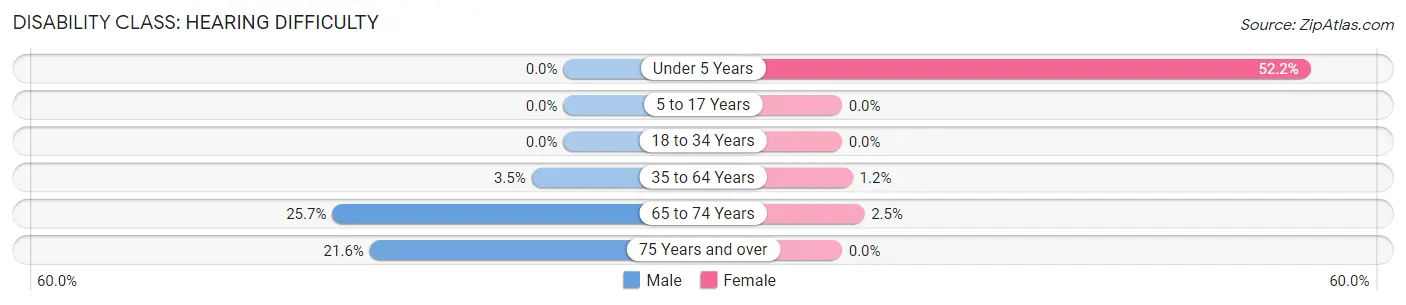
| Age Bracket | Male | Female |
| Under 5 Years | 0 (0.0%) | 118 (52.2%) |
| 5 to 17 Years | 0 (0.0%) | 0 (0.0%) |
| 18 to 34 Years | 0 (0.0%) | 0 (0.0%) |
| 35 to 64 Years | 29 (3.5%) | 11 (1.2%) |
| 65 to 74 Years | 35 (25.7%) | 7 (2.5%) |
| 75 Years and over | 11 (21.6%) | 0 (0.0%) |
Disability Class: Vision Difficulty
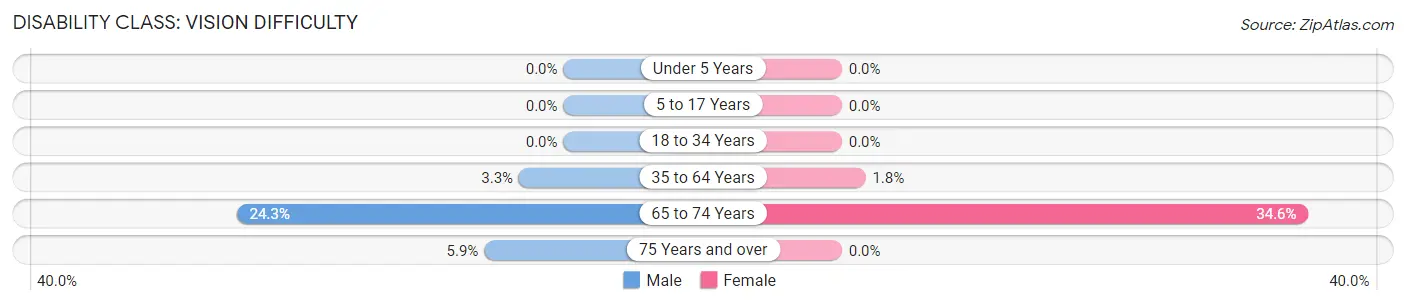
| Age Bracket | Male | Female |
| Under 5 Years | 0 (0.0%) | 0 (0.0%) |
| 5 to 17 Years | 0 (0.0%) | 0 (0.0%) |
| 18 to 34 Years | 0 (0.0%) | 0 (0.0%) |
| 35 to 64 Years | 27 (3.3%) | 16 (1.8%) |
| 65 to 74 Years | 33 (24.3%) | 97 (34.6%) |
| 75 Years and over | 3 (5.9%) | 0 (0.0%) |
Disability Class: Cognitive Difficulty
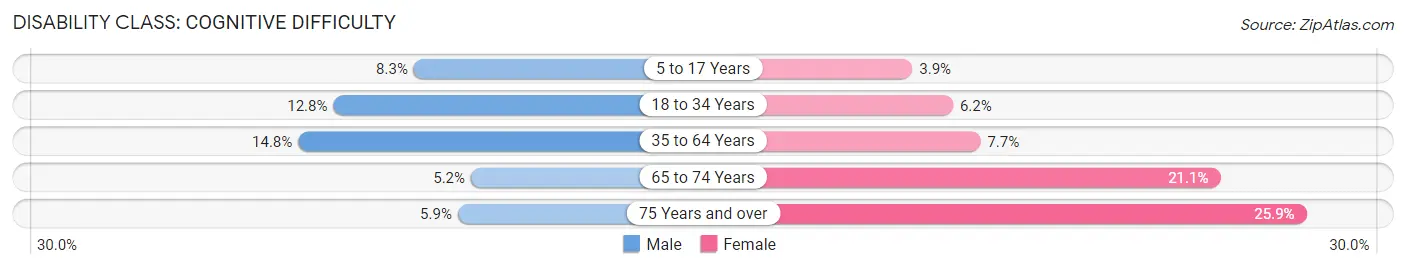
| Age Bracket | Male | Female |
| 5 to 17 Years | 32 (8.3%) | 25 (3.9%) |
| 18 to 34 Years | 73 (12.8%) | 26 (6.2%) |
| 35 to 64 Years | 121 (14.8%) | 70 (7.7%) |
| 65 to 74 Years | 7 (5.1%) | 59 (21.1%) |
| 75 Years and over | 3 (5.9%) | 37 (25.9%) |
Disability Class: Ambulatory Difficulty
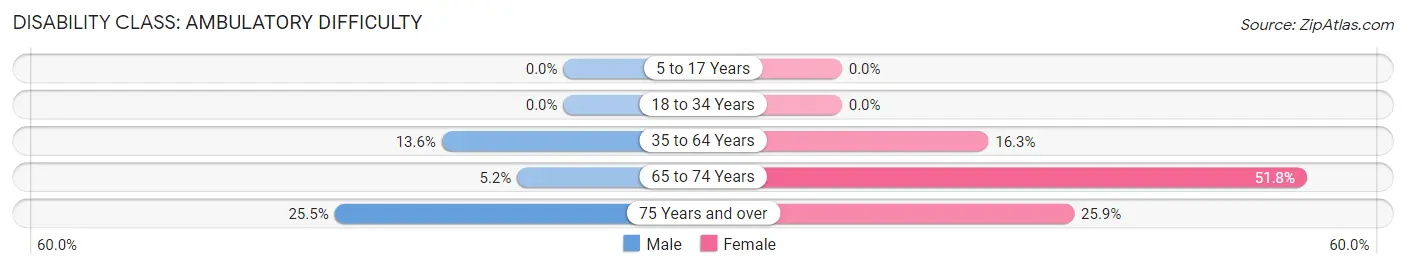
| Age Bracket | Male | Female |
| 5 to 17 Years | 0 (0.0%) | 0 (0.0%) |
| 18 to 34 Years | 0 (0.0%) | 0 (0.0%) |
| 35 to 64 Years | 111 (13.6%) | 148 (16.3%) |
| 65 to 74 Years | 7 (5.1%) | 145 (51.8%) |
| 75 Years and over | 13 (25.5%) | 37 (25.9%) |
Disability Class: Self-Care Difficulty
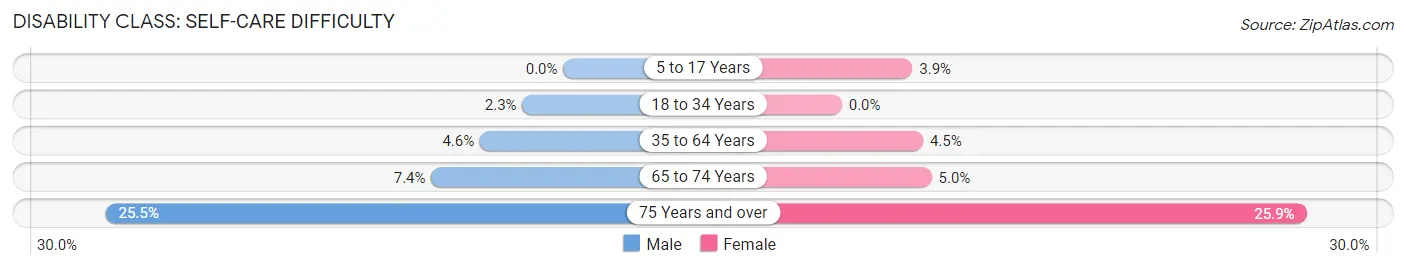
| Age Bracket | Male | Female |
| 5 to 17 Years | 0 (0.0%) | 25 (3.9%) |
| 18 to 34 Years | 13 (2.3%) | 0 (0.0%) |
| 35 to 64 Years | 38 (4.6%) | 41 (4.5%) |
| 65 to 74 Years | 10 (7.3%) | 14 (5.0%) |
| 75 Years and over | 13 (25.5%) | 37 (25.9%) |
Technology Access in Violet
Computing Device Access in Violet
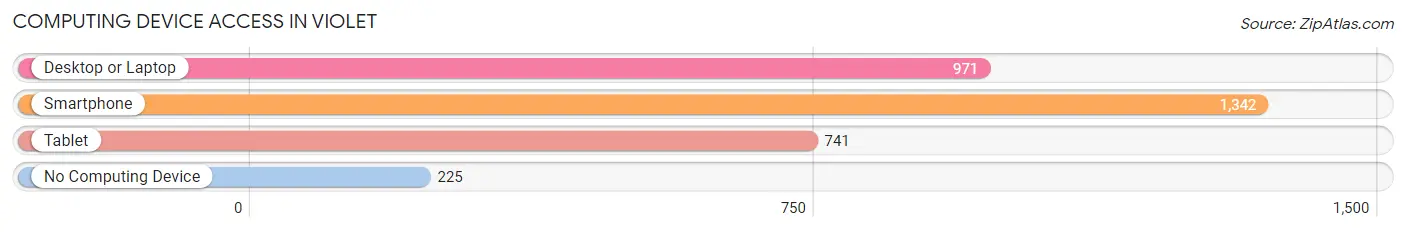
| Device Type | # Households | % Households |
| Desktop or Laptop | 971 | 59.7% |
| Smartphone | 1,342 | 82.5% |
| Tablet | 741 | 45.5% |
| No Computing Device | 225 | 13.8% |
| Total | 1,627 | 100.0% |
Internet Access in Violet
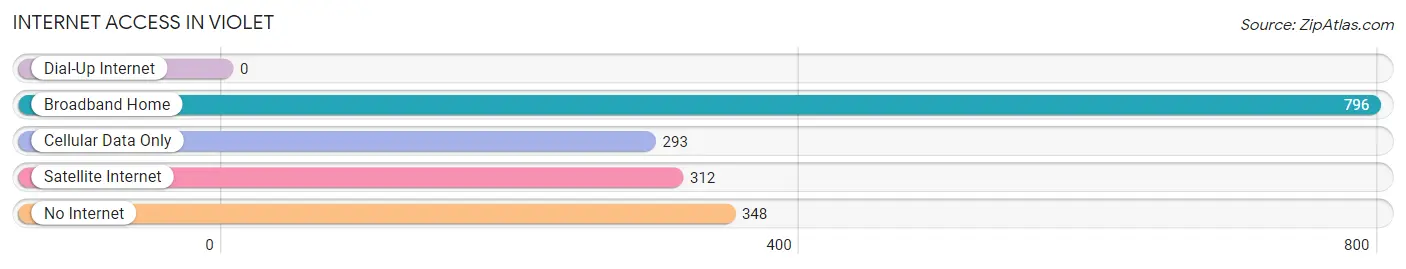
| Internet Type | # Households | % Households |
| Dial-Up Internet | 0 | 0.0% |
| Broadband Home | 796 | 48.9% |
| Cellular Data Only | 293 | 18.0% |
| Satellite Internet | 312 | 19.2% |
| No Internet | 348 | 21.4% |
| Total | 1,627 | 100.0% |
Violet Summary
Violet is a small unincorporated community located in St. Bernard Parish, Louisiana. It is situated along the banks of the Mississippi River, approximately 15 miles southeast of New Orleans. The population of Violet was estimated to be around 4,000 in 2000.
History
Violet was first settled in the early 1800s by French and Spanish settlers. The area was originally known as “Violette”, named after the violet flowers that grew in abundance in the area. The town was officially incorporated in 1845 and was named after the flowers.
In the late 1800s, Violet became a popular destination for wealthy New Orleanians who wanted to escape the hustle and bustle of the city. The town was known for its beautiful scenery and peaceful atmosphere.
In the early 1900s, Violet began to experience a population boom as more and more people moved to the area. The town was home to a variety of businesses, including a sawmill, a brickyard, and a sugar refinery.
Geography
Violet is located in St. Bernard Parish, Louisiana, approximately 15 miles southeast of New Orleans. The town is situated along the banks of the Mississippi River and is surrounded by marshland and swampland.
The climate in Violet is humid subtropical, with hot, humid summers and mild winters. The average annual temperature is around 70 degrees Fahrenheit.
Economy
The economy of Violet is largely based on the oil and gas industry. The town is home to several oil refineries and natural gas processing plants.
In addition to the oil and gas industry, Violet is also home to a variety of other businesses, including a sawmill, a brickyard, and a sugar refinery. The town is also home to a number of small businesses, such as restaurants, shops, and other services.
Demographics
As of the 2000 census, the population of Violet was estimated to be around 4,000. The racial makeup of the town was 79.3% White, 17.2% African American, 0.7% Native American, 0.3% Asian, 0.1% Pacific Islander, and 2.4% from other races.
The median household income in Violet was $30,000, and the median family income was $35,000. The per capita income was $14,000. Approximately 17.2% of the population was below the poverty line.
Conclusion
Violet is a small unincorporated community located in St. Bernard Parish, Louisiana. It is situated along the banks of the Mississippi River, approximately 15 miles southeast of New Orleans. The population of Violet was estimated to be around 4,000 in 2000. The economy of Violet is largely based on the oil and gas industry, and the town is also home to a variety of other businesses. The racial makeup of the town was 79.3% White, 17.2% African American, 0.7% Native American, 0.3% Asian, 0.1% Pacific Islander, and 2.4% from other races. The median household income in Violet was $30,000, and the median family income was $35,000. Approximately 17.2% of the population was below the poverty line.
Common Questions
What is Per Capita Income in Violet?
Per Capita income in Violet is $23,779.
What is the Median Family Income in Violet?
Median Family Income in Violet is $82,500.
What is the Median Household income in Violet?
Median Household Income in Violet is $51,067.
What is Income or Wage Gap in Violet?
Income or Wage Gap in Violet is 46.1%.
Women in Violet earn 53.9 cents for every dollar earned by a man.
What is Inequality or Gini Index in Violet?
Inequality or Gini Index in Violet is 0.43.
What is the Total Population of Violet?
Total Population of Violet is 4,748.
What is the Total Male Population of Violet?
Total Male Population of Violet is 2,136.
What is the Total Female Population of Violet?
Total Female Population of Violet is 2,612.
What is the Ratio of Males per 100 Females in Violet?
There are 81.78 Males per 100 Females in Violet.
What is the Ratio of Females per 100 Males in Violet?
There are 122.28 Females per 100 Males in Violet.
What is the Median Population Age in Violet?
Median Population Age in Violet is 34.4 Years.
What is the Average Family Size in Violet
Average Family Size in Violet is 3.7 People.
What is the Average Household Size in Violet
Average Household Size in Violet is 2.9 People.
How Large is the Labor Force in Violet?
There are 2,098 People in the Labor Forcein in Violet.
What is the Percentage of People in the Labor Force in Violet?
60.6% of People are in the Labor Force in Violet.
What is the Unemployment Rate in Violet?
Unemployment Rate in Violet is 8.2%.