Ventress, LA Map & Demographics
Ventress Map
Ventress Overview
$34,793
PER CAPITA INCOME
$98,750
AVG FAMILY INCOME
$75,500
AVG HOUSEHOLD INCOME
0.41
INEQUALITY / GINI INDEX
1,230
TOTAL POPULATION
541
MALE POPULATION
689
FEMALE POPULATION
78.52
MALES / 100 FEMALES
127.36
FEMALES / 100 MALES
50.3
MEDIAN AGE
3.4
AVG FAMILY SIZE
3.0
AVG HOUSEHOLD SIZE
487
LABOR FORCE [ PEOPLE ]
43.9%
PERCENT IN LABOR FORCE
Ventress Zip Codes
Ventress Area Codes
Income in Ventress
Income Overview in Ventress
Per Capita Income in Ventress is $34,793, while median incomes of families and households are $98,750 and $75,500 respectively.
| Characteristic | Number | Measure |
| Per Capita Income | 1,230 | $34,793 |
| Median Family Income | 324 | $98,750 |
| Mean Family Income | 324 | $125,401 |
| Median Household Income | 412 | $75,500 |
| Mean Household Income | 412 | $103,730 |
| Income Deficit | 324 | $0 |
| Wage / Income Gap (%) | 1,230 | 0.00% |
| Wage / Income Gap ($) | 1,230 | 100.00¢ per $1 |
| Gini / Inequality Index | 1,230 | 0.41 |
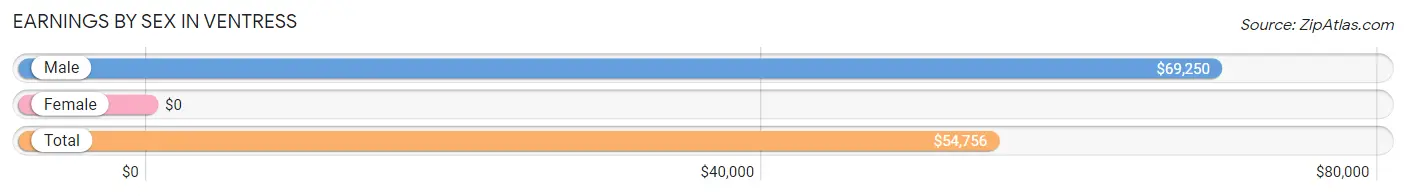
Earnings by Sex in Ventress
| Sex | Number | Average Earnings |
| Male | 284 (55.4%) | $69,250 |
| Female | 229 (44.6%) | $0 |
| Total | 513 (100.0%) | $54,756 |
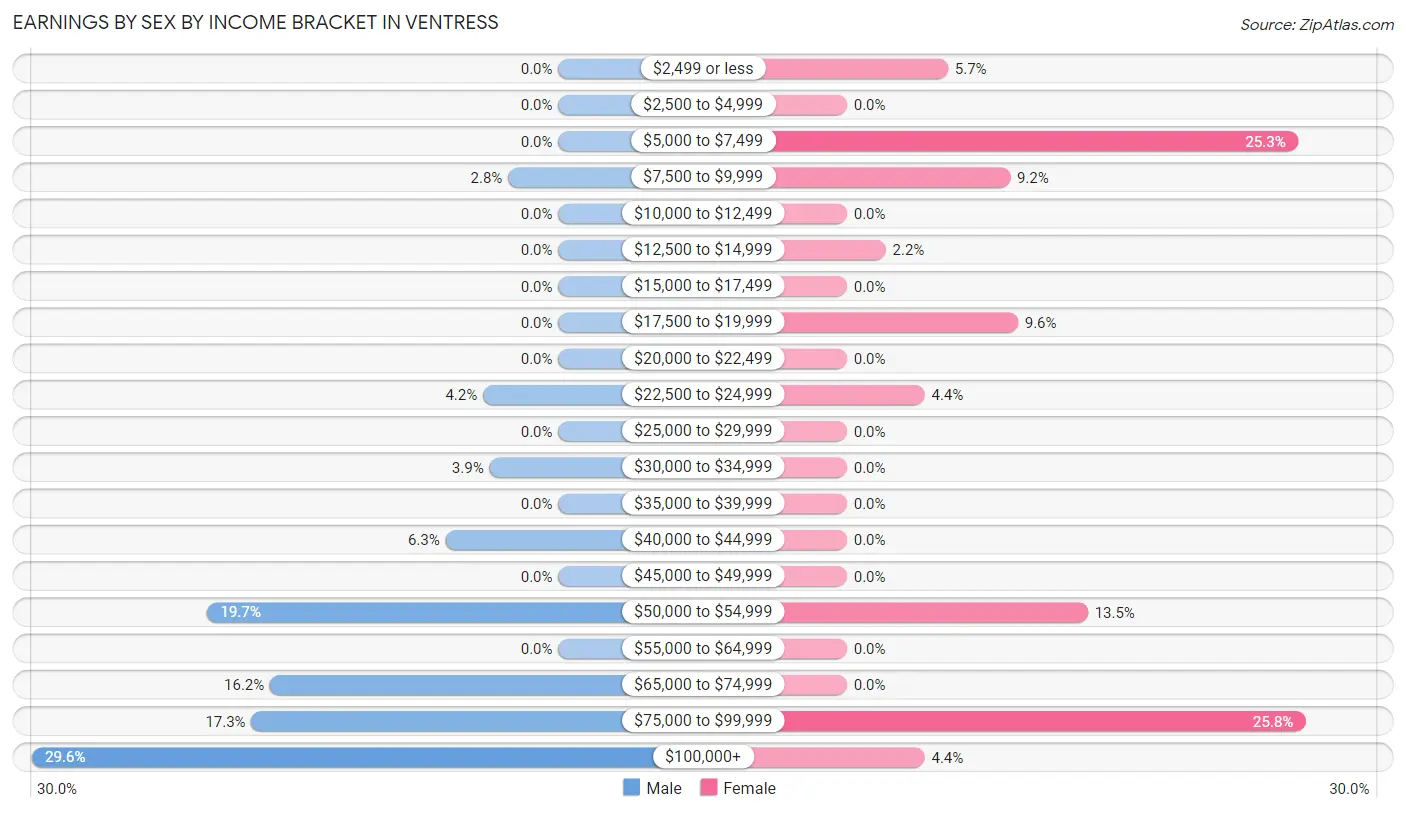
Earnings by Sex by Income Bracket in Ventress
The most common earnings brackets in Ventress are $100,000+ for men (84 | 29.6%) and $75,000 to $99,999 for women (59 | 25.8%).
| Income | Male | Female |
| $2,499 or less | 0 (0.0%) | 13 (5.7%) |
| $2,500 to $4,999 | 0 (0.0%) | 0 (0.0%) |
| $5,000 to $7,499 | 0 (0.0%) | 58 (25.3%) |
| $7,500 to $9,999 | 8 (2.8%) | 21 (9.2%) |
| $10,000 to $12,499 | 0 (0.0%) | 0 (0.0%) |
| $12,500 to $14,999 | 0 (0.0%) | 5 (2.2%) |
| $15,000 to $17,499 | 0 (0.0%) | 0 (0.0%) |
| $17,500 to $19,999 | 0 (0.0%) | 22 (9.6%) |
| $20,000 to $22,499 | 0 (0.0%) | 0 (0.0%) |
| $22,500 to $24,999 | 12 (4.2%) | 10 (4.4%) |
| $25,000 to $29,999 | 0 (0.0%) | 0 (0.0%) |
| $30,000 to $34,999 | 11 (3.9%) | 0 (0.0%) |
| $35,000 to $39,999 | 0 (0.0%) | 0 (0.0%) |
| $40,000 to $44,999 | 18 (6.3%) | 0 (0.0%) |
| $45,000 to $49,999 | 0 (0.0%) | 0 (0.0%) |
| $50,000 to $54,999 | 56 (19.7%) | 31 (13.5%) |
| $55,000 to $64,999 | 0 (0.0%) | 0 (0.0%) |
| $65,000 to $74,999 | 46 (16.2%) | 0 (0.0%) |
| $75,000 to $99,999 | 49 (17.2%) | 59 (25.8%) |
| $100,000+ | 84 (29.6%) | 10 (4.4%) |
| Total | 284 (100.0%) | 229 (100.0%) |
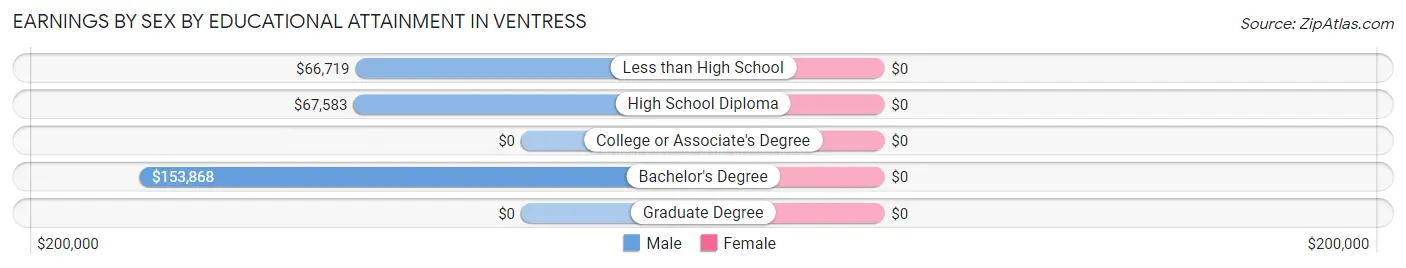
Earnings by Sex by Educational Attainment in Ventress
| Educational Attainment | Male Income | Female Income |
| Less than High School | $66,719 | $0 |
| High School Diploma | $67,583 | $0 |
| College or Associate's Degree | - | - |
| Bachelor's Degree | $153,868 | $0 |
| Graduate Degree | - | - |
| Total | $68,833 | $0 |
Family Income in Ventress
Family Income Brackets in Ventress
According to the Ventress family income data, there are 83 families falling into the $50,000 to $74,999 income range, which is the most common income bracket and makes up 25.6% of all families.
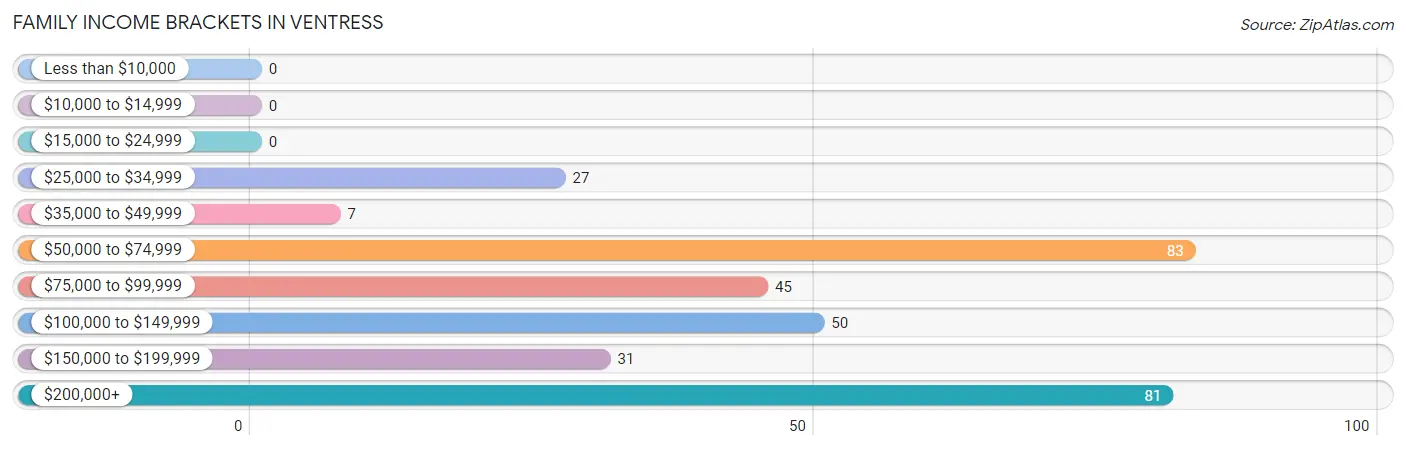
| Income Bracket | # Families | % Families |
| Less than $10,000 | 0 | 0.0% |
| $10,000 to $14,999 | 0 | 0.0% |
| $15,000 to $24,999 | 0 | 0.0% |
| $25,000 to $34,999 | 27 | 8.3% |
| $35,000 to $49,999 | 7 | 2.2% |
| $50,000 to $74,999 | 83 | 25.6% |
| $75,000 to $99,999 | 45 | 13.9% |
| $100,000 to $149,999 | 50 | 15.4% |
| $150,000 to $199,999 | 31 | 9.6% |
| $200,000+ | 81 | 25.0% |
Family Income by Famaliy Size in Ventress
4-person families (85 | 26.2%) account for the highest median family income in Ventress with $230,967 per family, while 4-person families (85 | 26.2%) have the highest median income of $57,742 per family member.
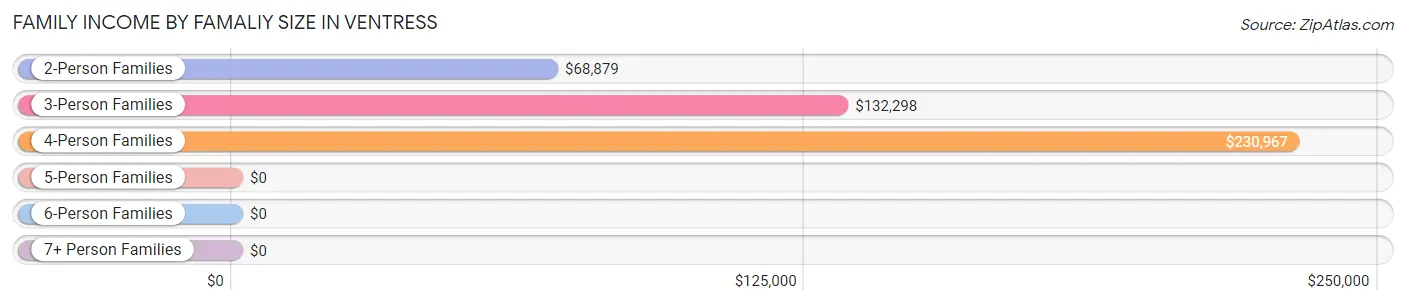
| Income Bracket | # Families | Median Income |
| 2-Person Families | 164 (50.6%) | $68,879 |
| 3-Person Families | 67 (20.7%) | $132,298 |
| 4-Person Families | 85 (26.2%) | $230,967 |
| 5-Person Families | 8 (2.5%) | $0 |
| 6-Person Families | 0 (0.0%) | $0 |
| 7+ Person Families | 0 (0.0%) | $0 |
| Total | 324 (100.0%) | $98,750 |
Family Income by Number of Earners in Ventress
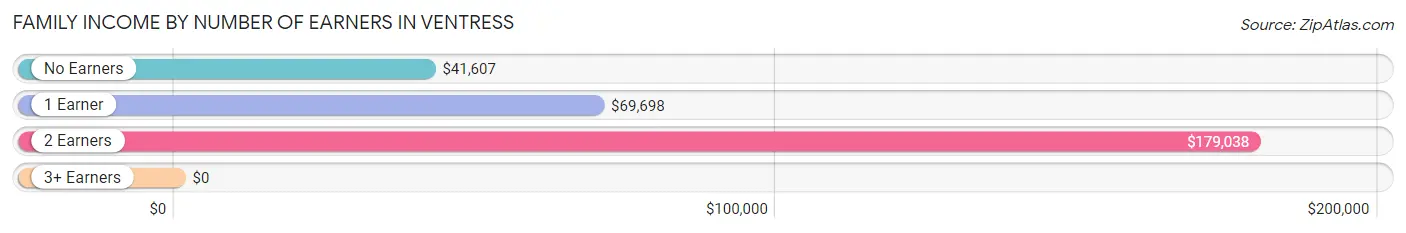
| Number of Earners | # Families | Median Income |
| No Earners | 19 (5.9%) | $41,607 |
| 1 Earner | 153 (47.2%) | $69,698 |
| 2 Earners | 152 (46.9%) | $179,038 |
| 3+ Earners | 0 (0.0%) | $0 |
| Total | 324 (100.0%) | $98,750 |
Household Income in Ventress
Household Income Brackets in Ventress
With 105 households falling in the category, the $50,000 to $74,999 income range is the most frequent in Ventress, accounting for 25.5% of all households.
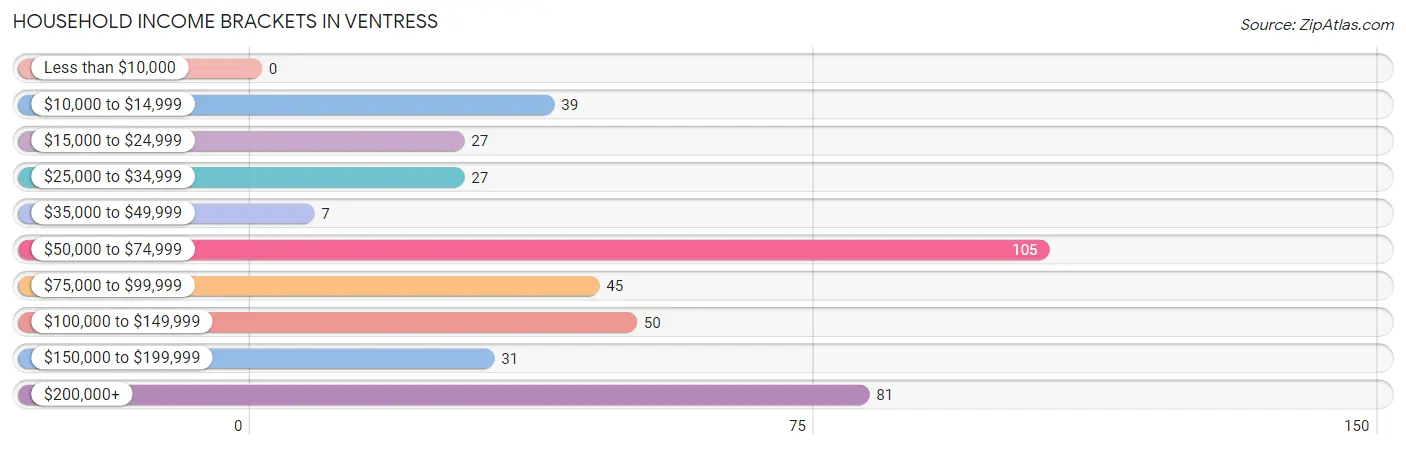
| Income Bracket | # Households | % Households |
| Less than $10,000 | 0 | 0.0% |
| $10,000 to $14,999 | 39 | 9.5% |
| $15,000 to $24,999 | 27 | 6.6% |
| $25,000 to $34,999 | 27 | 6.6% |
| $35,000 to $49,999 | 7 | 1.7% |
| $50,000 to $74,999 | 105 | 25.5% |
| $75,000 to $99,999 | 45 | 10.9% |
| $100,000 to $149,999 | 50 | 12.1% |
| $150,000 to $199,999 | 31 | 7.5% |
| $200,000+ | 81 | 19.7% |
Household Income by Householder Age in Ventress
The median household income in Ventress is $75,500, with the highest median household income of $87,406 found in the 45 to 64 years age bracket for the primary householder. A total of 235 households (57.0%) fall into this category. Meanwhile, the 15 to 24 years age bracket for the primary householder has the lowest median household income of $0, with 10 households (2.4%) in this group.
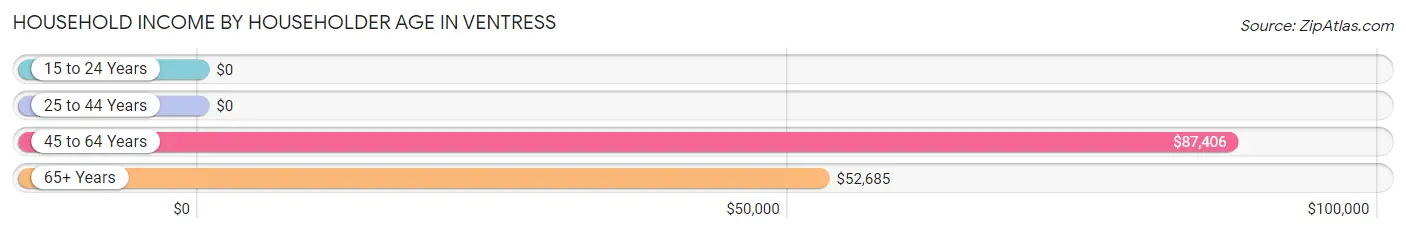
| Income Bracket | # Households | Median Income |
| 15 to 24 Years | 10 (2.4%) | $0 |
| 25 to 44 Years | 45 (10.9%) | $0 |
| 45 to 64 Years | 235 (57.0%) | $87,406 |
| 65+ Years | 122 (29.6%) | $52,685 |
| Total | 412 (100.0%) | $75,500 |
Poverty in Ventress
Income Below Poverty by Sex and Age in Ventress
With 13.9% poverty level for males and 10.3% for females among the residents of Ventress, 35 to 44 year old males and under 5 year old females are the most vulnerable to poverty, with 54 males (53.5%) and 12 females (100.0%) in their respective age groups living below the poverty level.
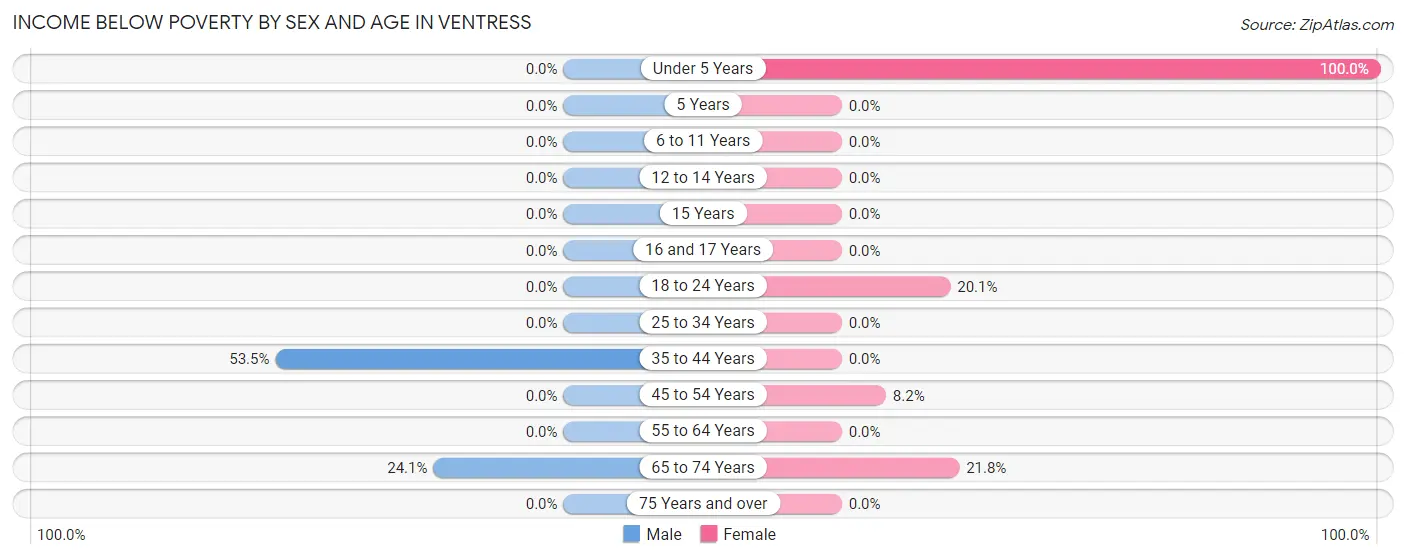
| Age Bracket | Male | Female |
| Under 5 Years | 0 (0.0%) | 12 (100.0%) |
| 5 Years | 0 (0.0%) | 0 (0.0%) |
| 6 to 11 Years | 0 (0.0%) | 0 (0.0%) |
| 12 to 14 Years | 0 (0.0%) | 0 (0.0%) |
| 15 Years | 0 (0.0%) | 0 (0.0%) |
| 16 and 17 Years | 0 (0.0%) | 0 (0.0%) |
| 18 to 24 Years | 0 (0.0%) | 28 (20.1%) |
| 25 to 34 Years | 0 (0.0%) | 0 (0.0%) |
| 35 to 44 Years | 54 (53.5%) | 0 (0.0%) |
| 45 to 54 Years | 0 (0.0%) | 14 (8.2%) |
| 55 to 64 Years | 0 (0.0%) | 0 (0.0%) |
| 65 to 74 Years | 21 (24.1%) | 17 (21.8%) |
| 75 Years and over | 0 (0.0%) | 0 (0.0%) |
| Total | 75 (13.9%) | 71 (10.3%) |
Income Above Poverty by Sex and Age in Ventress
According to the poverty statistics in Ventress, males aged under 5 years and females aged 6 to 11 years are the age groups that are most secure financially, with 100.0% of males and 100.0% of females in these age groups living above the poverty line.
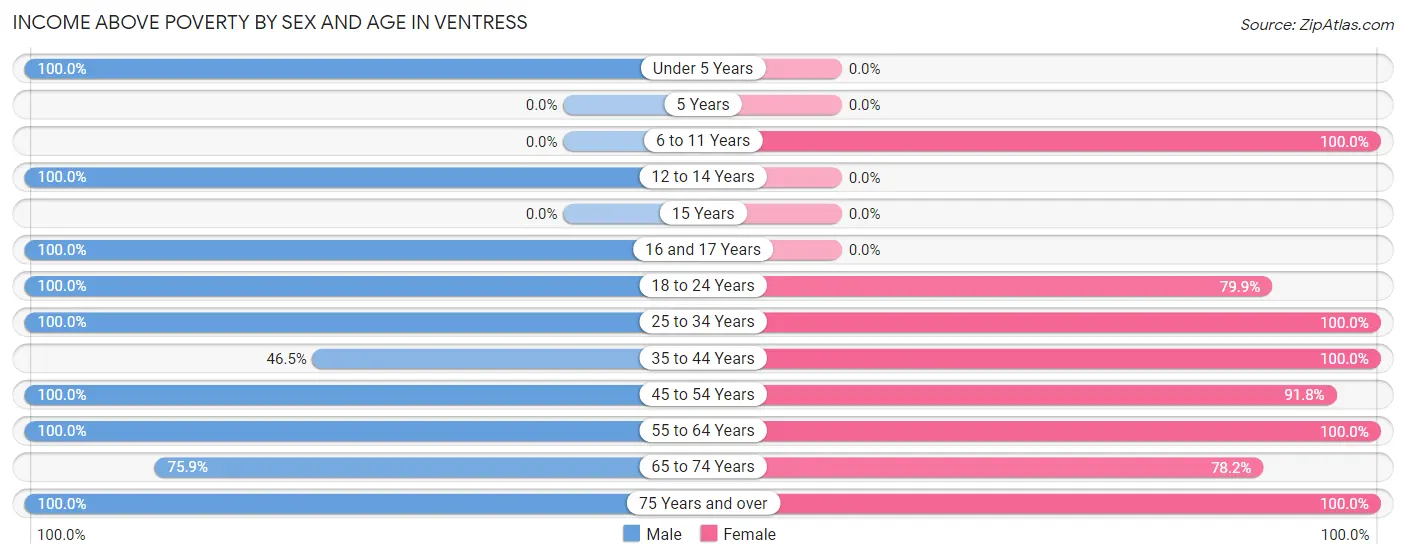
| Age Bracket | Male | Female |
| Under 5 Years | 38 (100.0%) | 0 (0.0%) |
| 5 Years | 0 (0.0%) | 0 (0.0%) |
| 6 to 11 Years | 0 (0.0%) | 29 (100.0%) |
| 12 to 14 Years | 41 (100.0%) | 0 (0.0%) |
| 15 Years | 0 (0.0%) | 0 (0.0%) |
| 16 and 17 Years | 12 (100.0%) | 0 (0.0%) |
| 18 to 24 Years | 10 (100.0%) | 111 (79.9%) |
| 25 to 34 Years | 11 (100.0%) | 7 (100.0%) |
| 35 to 44 Years | 47 (46.5%) | 183 (100.0%) |
| 45 to 54 Years | 115 (100.0%) | 157 (91.8%) |
| 55 to 64 Years | 97 (100.0%) | 65 (100.0%) |
| 65 to 74 Years | 66 (75.9%) | 61 (78.2%) |
| 75 Years and over | 29 (100.0%) | 5 (100.0%) |
| Total | 466 (86.1%) | 618 (89.7%) |
Income Below Poverty Among Married-Couple Families in Ventress
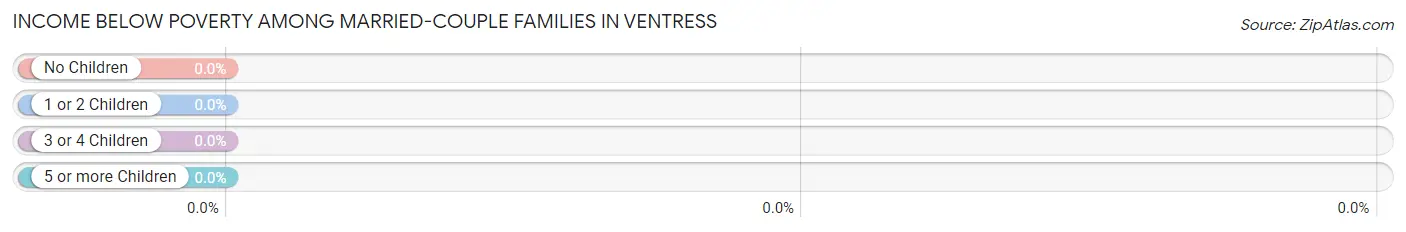
| Children | Above Poverty | Below Poverty |
| No Children | 205 (100.0%) | 0 (0.0%) |
| 1 or 2 Children | 84 (100.0%) | 0 (0.0%) |
| 3 or 4 Children | 8 (100.0%) | 0 (0.0%) |
| 5 or more Children | 0 (0.0%) | 0 (0.0%) |
| Total | 297 (100.0%) | 0 (0.0%) |
Income Below Poverty Among Single-Parent Households in Ventress
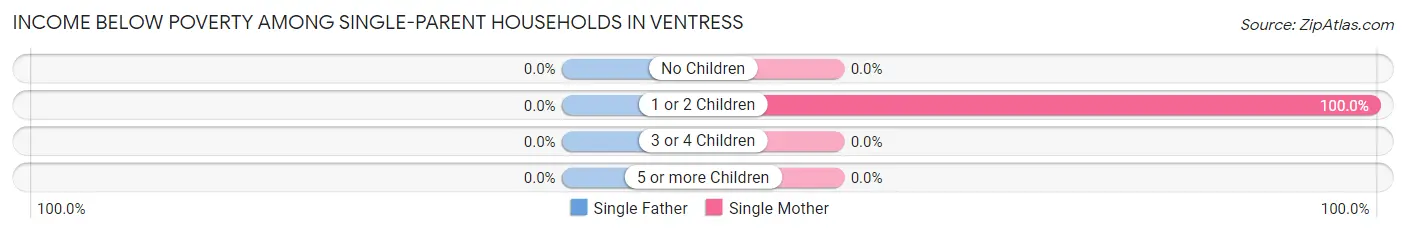
| Children | Single Father | Single Mother |
| No Children | 0 (0.0%) | 0 (0.0%) |
| 1 or 2 Children | 0 (0.0%) | 14 (100.0%) |
| 3 or 4 Children | 0 (0.0%) | 0 (0.0%) |
| 5 or more Children | 0 (0.0%) | 0 (0.0%) |
| Total | 0 (0.0%) | 14 (51.8%) |
Income Below Poverty Among Married-Couple vs Single-Parent Households in Ventress
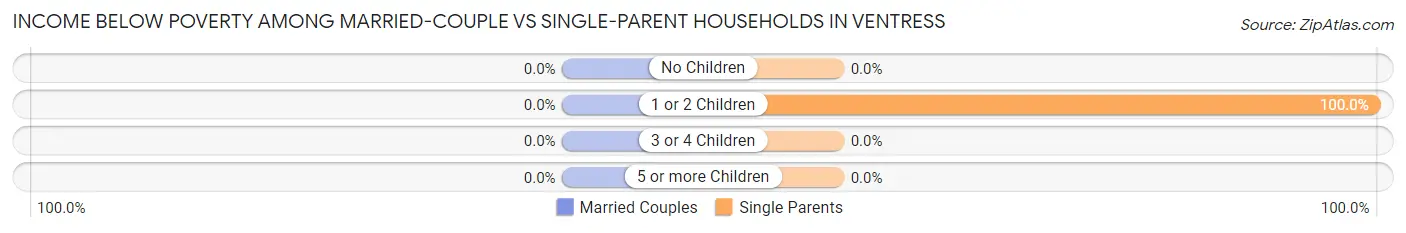
| Children | Married-Couple Families | Single-Parent Households |
| No Children | 0 (0.0%) | 0 (0.0%) |
| 1 or 2 Children | 0 (0.0%) | 14 (100.0%) |
| 3 or 4 Children | 0 (0.0%) | 0 (0.0%) |
| 5 or more Children | 0 (0.0%) | 0 (0.0%) |
| Total | 0 (0.0%) | 14 (51.8%) |
Race in Ventress
The most populous races in Ventress are White / Caucasian (1,167 | 94.9%), Hispanic or Latino (57 | 4.6%), and Black / African American (34 | 2.8%).
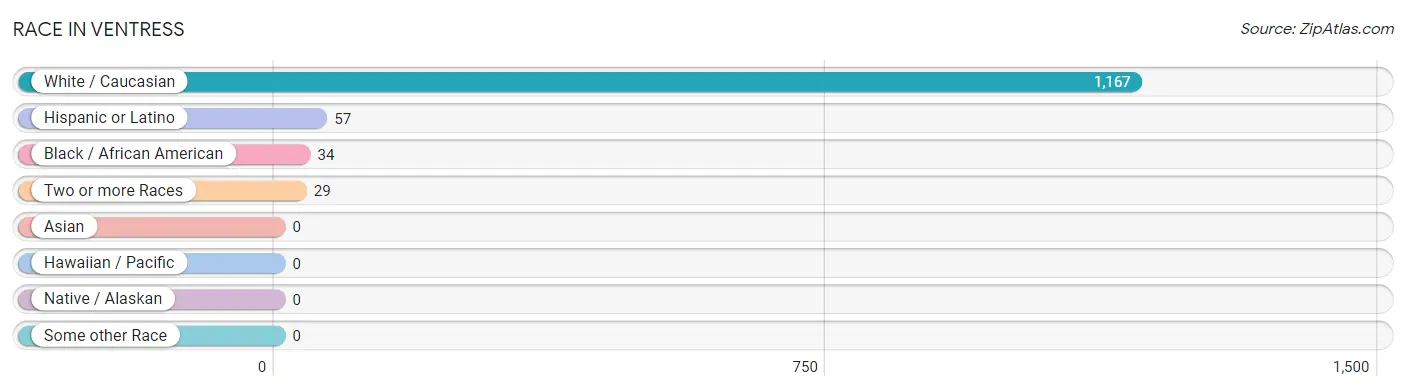
| Race | # Population | % Population |
| Asian | 0 | 0.0% |
| Black / African American | 34 | 2.8% |
| Hawaiian / Pacific | 0 | 0.0% |
| Hispanic or Latino | 57 | 4.6% |
| Native / Alaskan | 0 | 0.0% |
| White / Caucasian | 1,167 | 94.9% |
| Two or more Races | 29 | 2.4% |
| Some other Race | 0 | 0.0% |
| Total | 1,230 | 100.0% |
Ancestry in Ventress
The most populous ancestries reported in Ventress are French (477 | 38.8%), Italian (245 | 19.9%), American (163 | 13.3%), African (53 | 4.3%), and Subsaharan African (53 | 4.3%), together accounting for 80.6% of all Ventress residents.
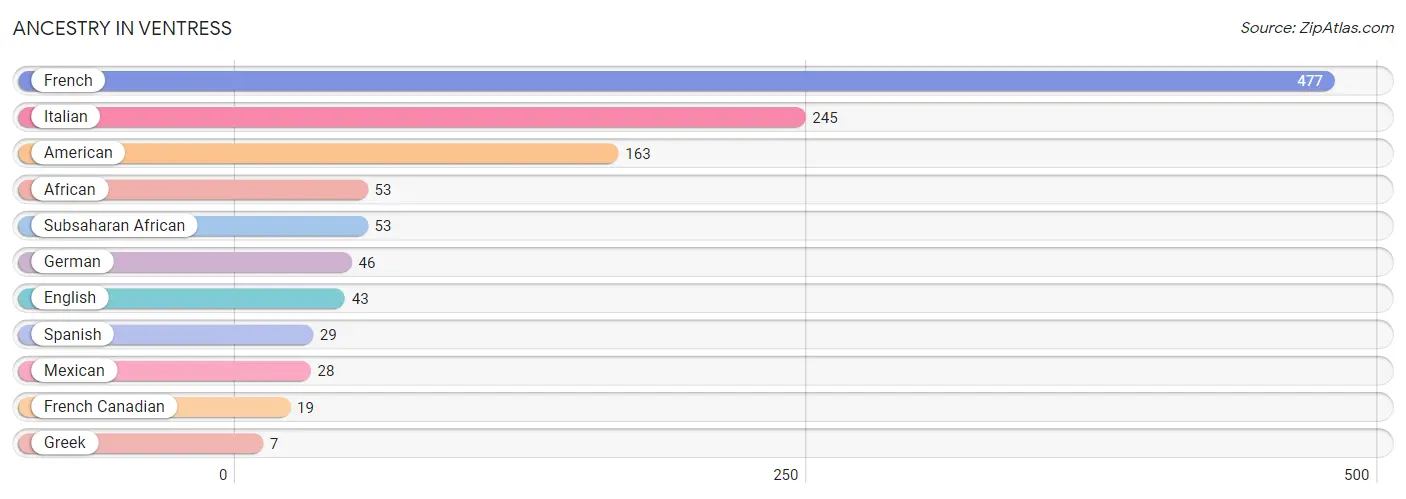
| Ancestry | # Population | % Population |
| African | 53 | 4.3% |
| American | 163 | 13.3% |
| English | 43 | 3.5% |
| French | 477 | 38.8% |
| French Canadian | 19 | 1.5% |
| German | 46 | 3.7% |
| Greek | 7 | 0.6% |
| Italian | 245 | 19.9% |
| Mexican | 28 | 2.3% |
| Spanish | 29 | 2.4% |
| Subsaharan African | 53 | 4.3% | View All 11 Rows |
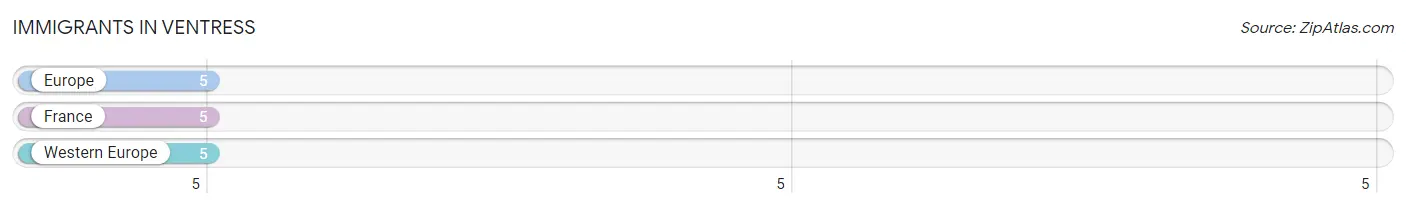
Immigrants in Ventress
The most numerous immigrant groups reported in Ventress came from Europe (5 | 0.4%), France (5 | 0.4%), and Western Europe (5 | 0.4%), together accounting for 1.2% of all Ventress residents.
| Immigration Origin | # Population | % Population |
| Europe | 5 | 0.4% |
| France | 5 | 0.4% |
| Western Europe | 5 | 0.4% | View All 3 Rows |
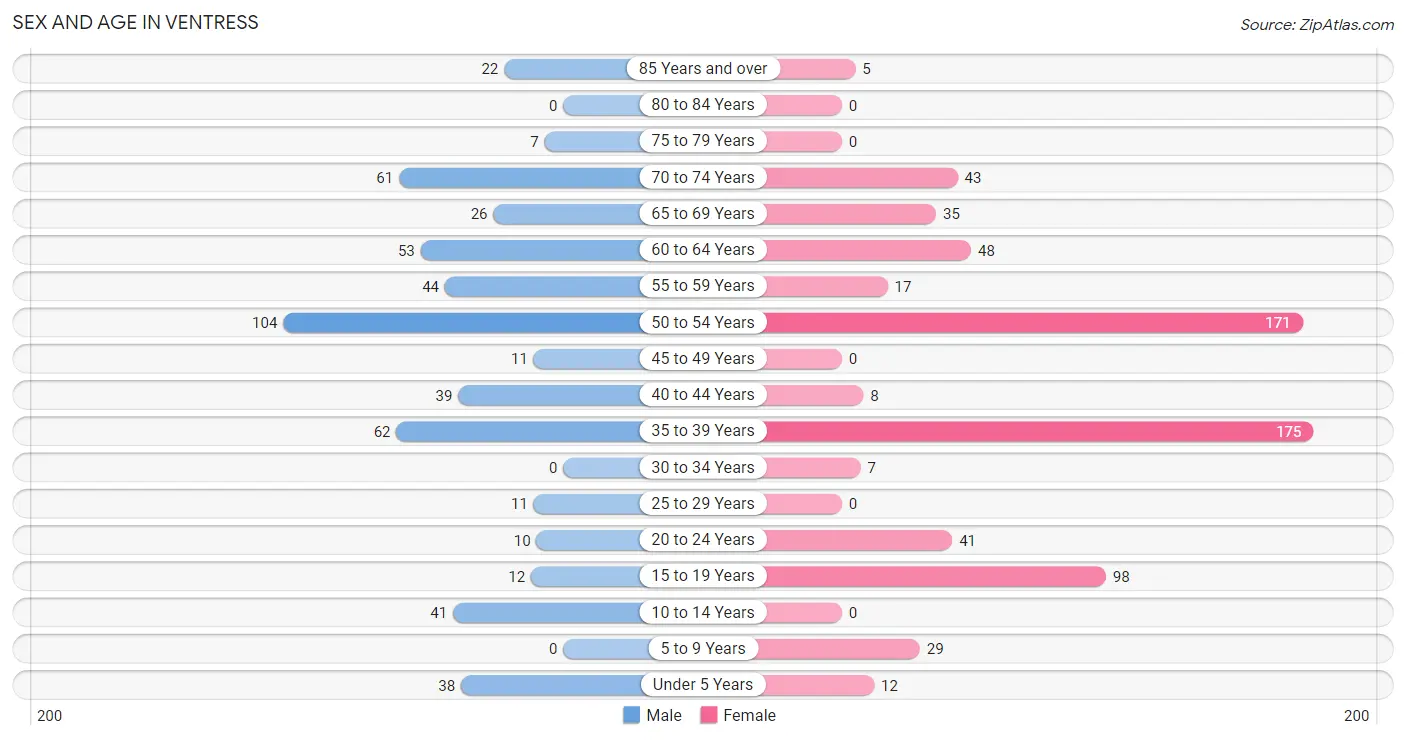
Sex and Age in Ventress
Sex and Age in Ventress
The most populous age groups in Ventress are 50 to 54 Years (104 | 19.2%) for men and 35 to 39 Years (175 | 25.4%) for women.
| Age Bracket | Male | Female |
| Under 5 Years | 38 (7.0%) | 12 (1.7%) |
| 5 to 9 Years | 0 (0.0%) | 29 (4.2%) |
| 10 to 14 Years | 41 (7.6%) | 0 (0.0%) |
| 15 to 19 Years | 12 (2.2%) | 98 (14.2%) |
| 20 to 24 Years | 10 (1.8%) | 41 (5.9%) |
| 25 to 29 Years | 11 (2.0%) | 0 (0.0%) |
| 30 to 34 Years | 0 (0.0%) | 7 (1.0%) |
| 35 to 39 Years | 62 (11.5%) | 175 (25.4%) |
| 40 to 44 Years | 39 (7.2%) | 8 (1.2%) |
| 45 to 49 Years | 11 (2.0%) | 0 (0.0%) |
| 50 to 54 Years | 104 (19.2%) | 171 (24.8%) |
| 55 to 59 Years | 44 (8.1%) | 17 (2.5%) |
| 60 to 64 Years | 53 (9.8%) | 48 (7.0%) |
| 65 to 69 Years | 26 (4.8%) | 35 (5.1%) |
| 70 to 74 Years | 61 (11.3%) | 43 (6.2%) |
| 75 to 79 Years | 7 (1.3%) | 0 (0.0%) |
| 80 to 84 Years | 0 (0.0%) | 0 (0.0%) |
| 85 Years and over | 22 (4.1%) | 5 (0.7%) |
| Total | 541 (100.0%) | 689 (100.0%) |
Families and Households in Ventress
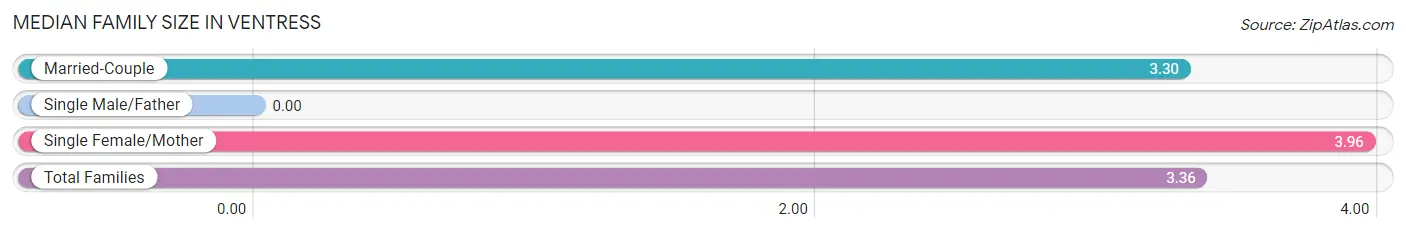
Median Family Size in Ventress
| Family Type | # Families | Family Size |
| Married-Couple | 297 (91.7%) | 3.30 |
| Single Male/Father | 0 (0.0%) | - |
| Single Female/Mother | 27 (8.3%) | 3.96 |
| Total Families | 324 (100.0%) | 3.36 |
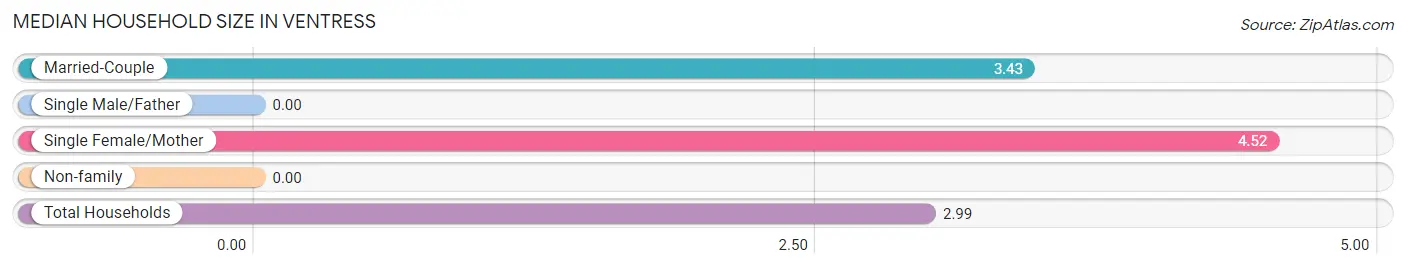
Median Household Size in Ventress
| Household Type | # Households | Household Size |
| Married-Couple | 297 (72.1%) | 3.43 |
| Single Male/Father | 0 (0.0%) | - |
| Single Female/Mother | 27 (6.6%) | 4.52 |
| Non-family | 88 (21.4%) | - |
| Total Households | 412 (100.0%) | 2.99 |
Household Size by Marriage Status in Ventress
Out of a total of 412 households in Ventress, 324 (78.6%) are family households, while 88 (21.4%) are nonfamily households. The most numerous type of family households are 2-person households, comprising 164, and the most common type of nonfamily households are 1-person households, comprising 88.
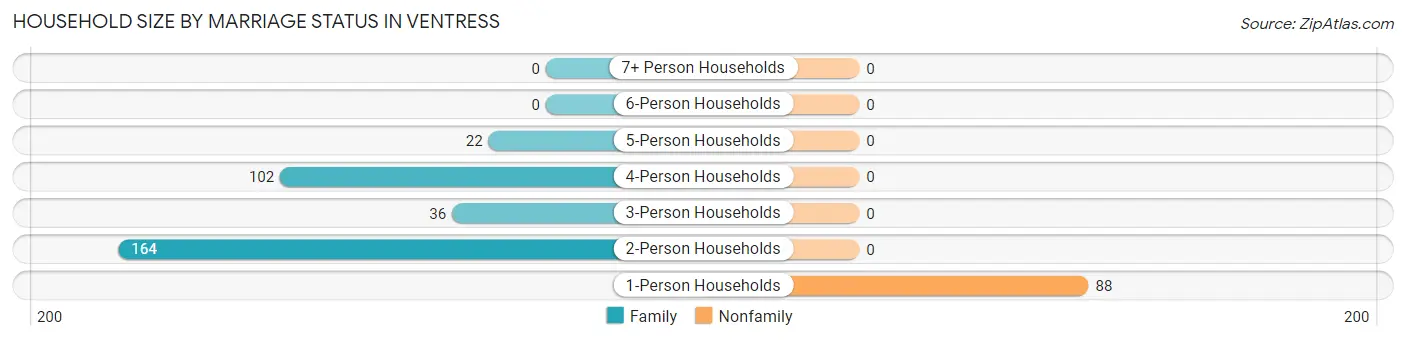
| Household Size | Family Households | Nonfamily Households |
| 1-Person Households | - | 88 (21.4%) |
| 2-Person Households | 164 (39.8%) | 0 (0.0%) |
| 3-Person Households | 36 (8.7%) | 0 (0.0%) |
| 4-Person Households | 102 (24.8%) | 0 (0.0%) |
| 5-Person Households | 22 (5.3%) | 0 (0.0%) |
| 6-Person Households | 0 (0.0%) | 0 (0.0%) |
| 7+ Person Households | 0 (0.0%) | 0 (0.0%) |
| Total | 324 (78.6%) | 88 (21.4%) |
Female Fertility in Ventress
Fertility by Age in Ventress
Average fertility rate in Ventress is 117.0 births per 1,000 women. Women in the age bracket of 35 to 50 years have the highest fertility rate with 185.0 births per 1,000 women. Women in the age bracket of 35 to 50 years acount for 100.0% of all women with births.
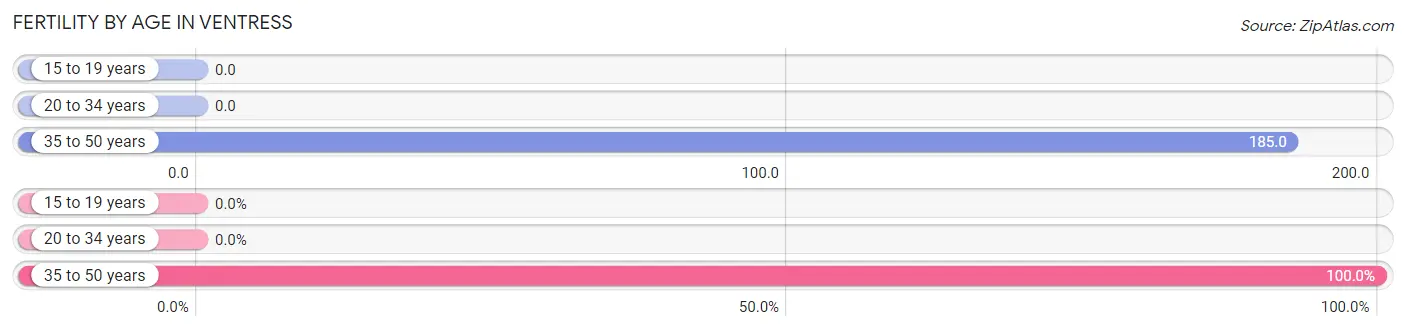
| Age Bracket | Women with Births | Births / 1,000 Women |
| 15 to 19 years | 0 (0.0%) | 0.0 |
| 20 to 34 years | 0 (0.0%) | 0.0 |
| 35 to 50 years | 46 (100.0%) | 185.0 |
| Total | 46 (100.0%) | 117.0 |
Fertility by Age by Marriage Status in Ventress
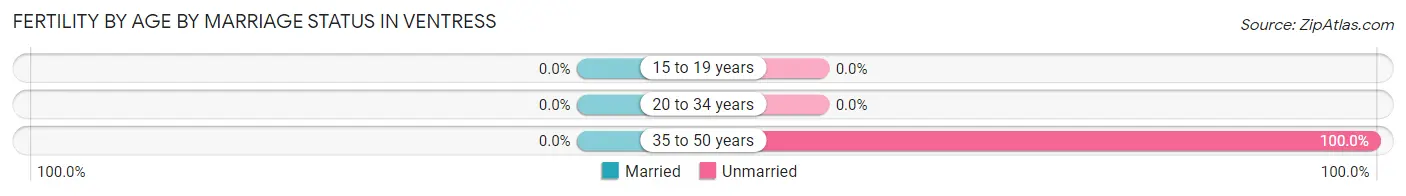
| Age Bracket | Married | Unmarried |
| 15 to 19 years | 0 (0.0%) | 0 (0.0%) |
| 20 to 34 years | 0 (0.0%) | 0 (0.0%) |
| 35 to 50 years | 0 (0.0%) | 46 (100.0%) |
| Total | 0 (0.0%) | 46 (100.0%) |
Fertility by Education in Ventress
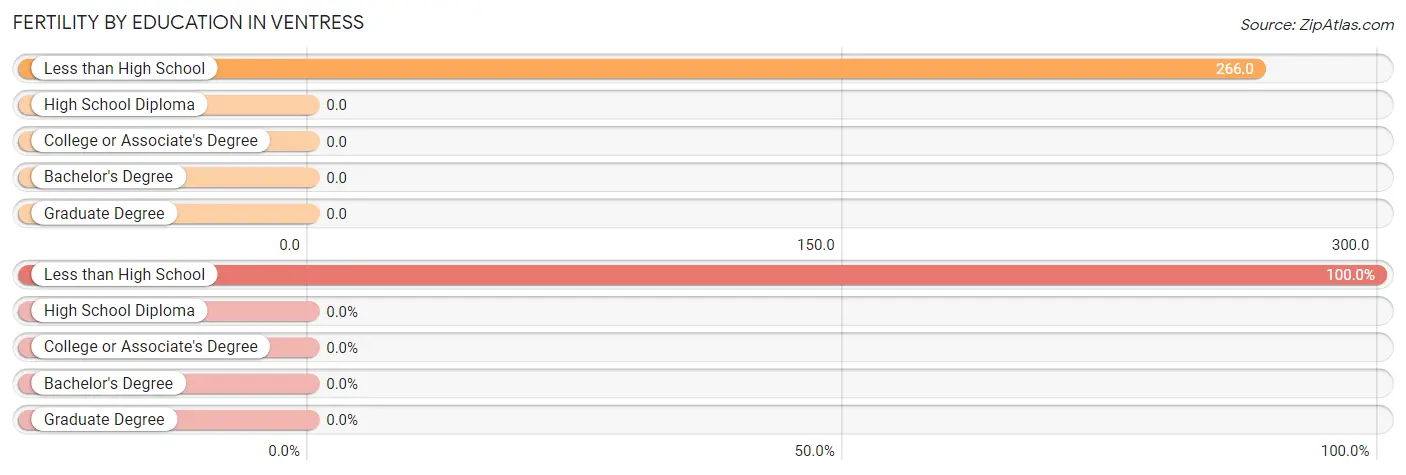
| Educational Attainment | Women with Births | Births / 1,000 Women |
| Less than High School | 46 (100.0%) | 266.0 |
| High School Diploma | 0 (0.0%) | 0.0 |
| College or Associate's Degree | 0 (0.0%) | 0.0 |
| Bachelor's Degree | 0 (0.0%) | 0.0 |
| Graduate Degree | 0 (0.0%) | 0.0 |
| Total | 46 (100.0%) | 117.0 |
Fertility by Education by Marriage Status in Ventress
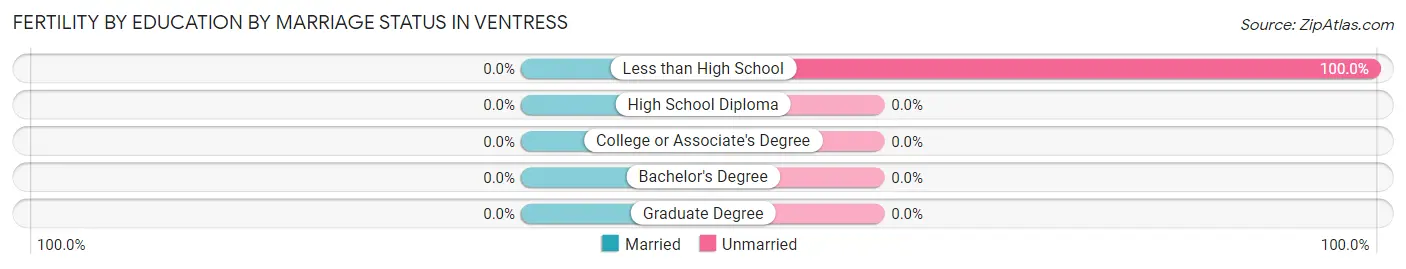
| Educational Attainment | Married | Unmarried |
| Less than High School | 0 (0.0%) | 46 (100.0%) |
| High School Diploma | 0 (0.0%) | 0 (0.0%) |
| College or Associate's Degree | 0 (0.0%) | 0 (0.0%) |
| Bachelor's Degree | 0 (0.0%) | 0 (0.0%) |
| Graduate Degree | 0 (0.0%) | 0 (0.0%) |
| Total | 0 (0.0%) | 46 (100.0%) |
Employment Characteristics in Ventress
Employment by Class of Employer in Ventress
Among the 466 employed individuals in Ventress, private company employees (381 | 81.8%), state government employees (52 | 11.2%), and not-for-profit organizations (13 | 2.8%) make up the most common classes of employment.
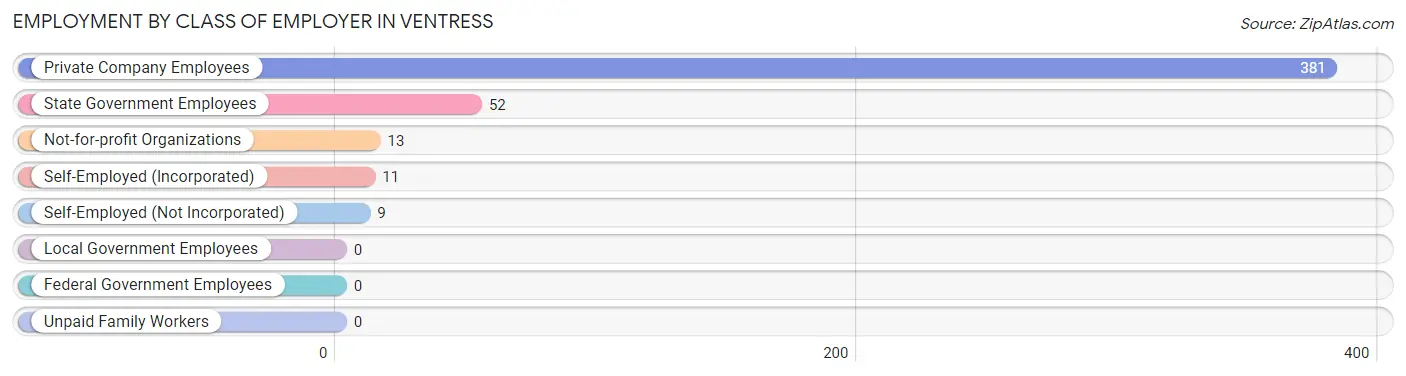
| Employer Class | # Employees | % Employees |
| Private Company Employees | 381 | 81.8% |
| Self-Employed (Incorporated) | 11 | 2.4% |
| Self-Employed (Not Incorporated) | 9 | 1.9% |
| Not-for-profit Organizations | 13 | 2.8% |
| Local Government Employees | 0 | 0.0% |
| State Government Employees | 52 | 11.2% |
| Federal Government Employees | 0 | 0.0% |
| Unpaid Family Workers | 0 | 0.0% |
| Total | 466 | 100.0% |
Employment Status by Age in Ventress
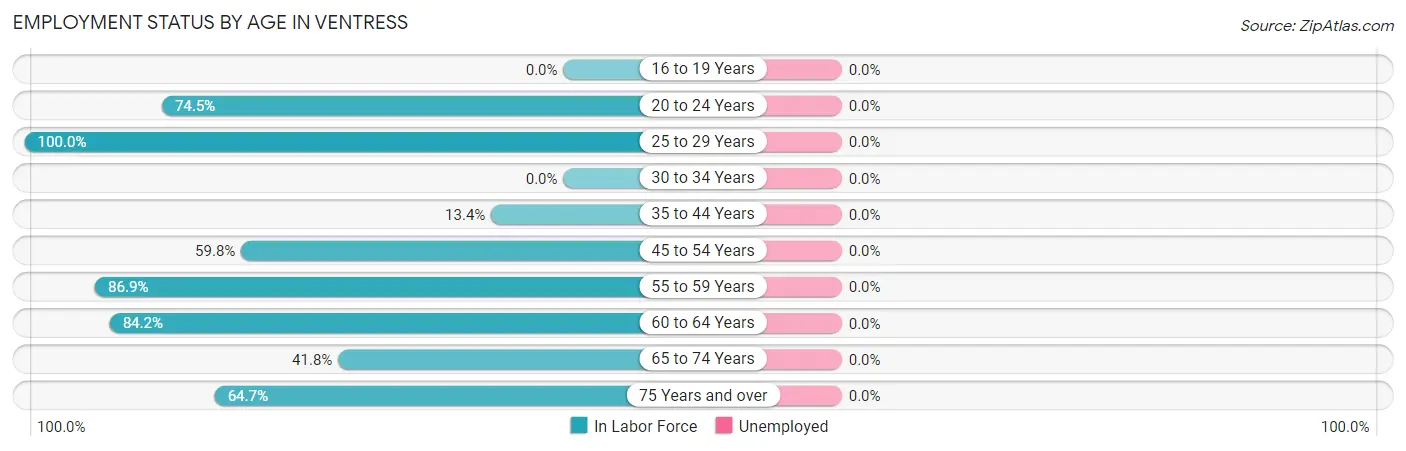
| Age Bracket | In Labor Force | Unemployed |
| 16 to 19 Years | 0 (0.0%) | 0 (0.0%) |
| 20 to 24 Years | 38 (74.5%) | 0 (0.0%) |
| 25 to 29 Years | 11 (100.0%) | 0 (0.0%) |
| 30 to 34 Years | 0 (0.0%) | 0 (0.0%) |
| 35 to 44 Years | 38 (13.4%) | 0 (0.0%) |
| 45 to 54 Years | 171 (59.8%) | 0 (0.0%) |
| 55 to 59 Years | 53 (86.9%) | 0 (0.0%) |
| 60 to 64 Years | 85 (84.2%) | 0 (0.0%) |
| 65 to 74 Years | 69 (41.8%) | 0 (0.0%) |
| 75 Years and over | 22 (64.7%) | 0 (0.0%) |
| Total | 487 (43.9%) | 0 (0.0%) |
Employment Status by Educational Attainment in Ventress
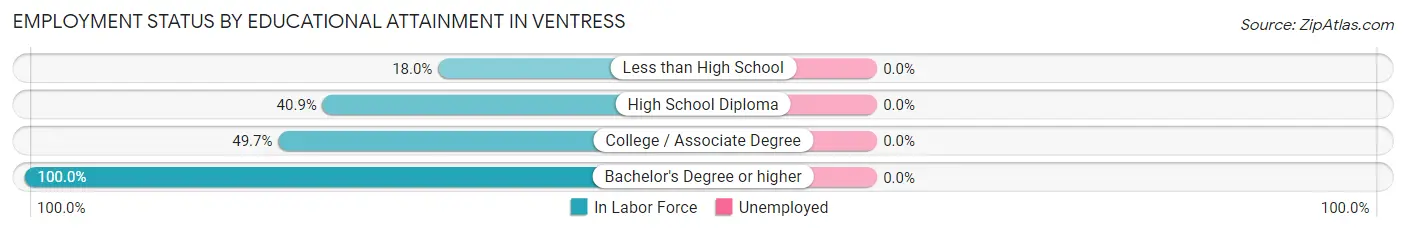
| Educational Attainment | In Labor Force | Unemployed |
| Less than High School | 44 (18.0%) | 0 (0.0%) |
| High School Diploma | 83 (40.9%) | 0 (0.0%) |
| College / Associate Degree | 71 (49.7%) | 0 (0.0%) |
| Bachelor's Degree or higher | 160 (100.0%) | 0 (0.0%) |
| Total | 358 (47.7%) | 0 (0.0%) |
Employment Occupations by Sex in Ventress
Management, Business, Science and Arts Occupations
The most common Management, Business, Science and Arts occupations in Ventress are Management (90 | 18.5%), Community & Social Service (72 | 14.8%), Arts, Media & Entertainment (51 | 10.5%), Health Diagnosing & Treating (32 | 6.6%), and Business & Financial (31 | 6.4%).
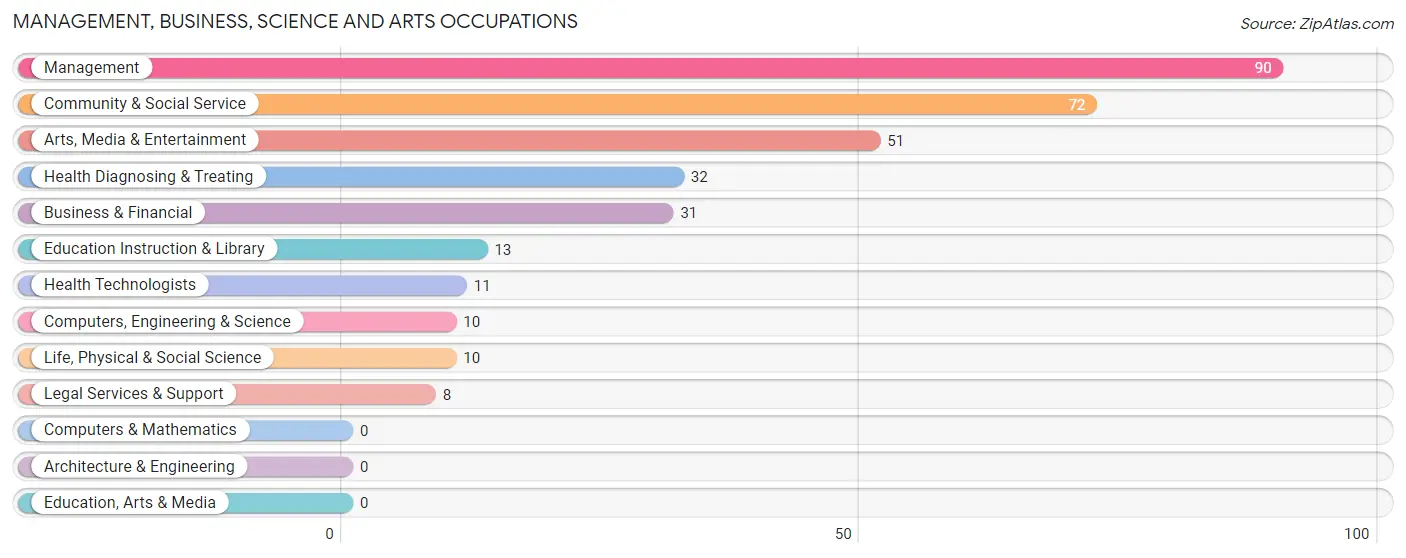
Management, Business, Science and Arts Occupations by Sex
Within the Management, Business, Science and Arts occupations in Ventress, the most male-oriented occupations are Management (100.0%), Computers, Engineering & Science (100.0%), and Life, Physical & Social Science (100.0%), while the most female-oriented occupations are Business & Financial (100.0%), Community & Social Service (100.0%), and Legal Services & Support (100.0%).
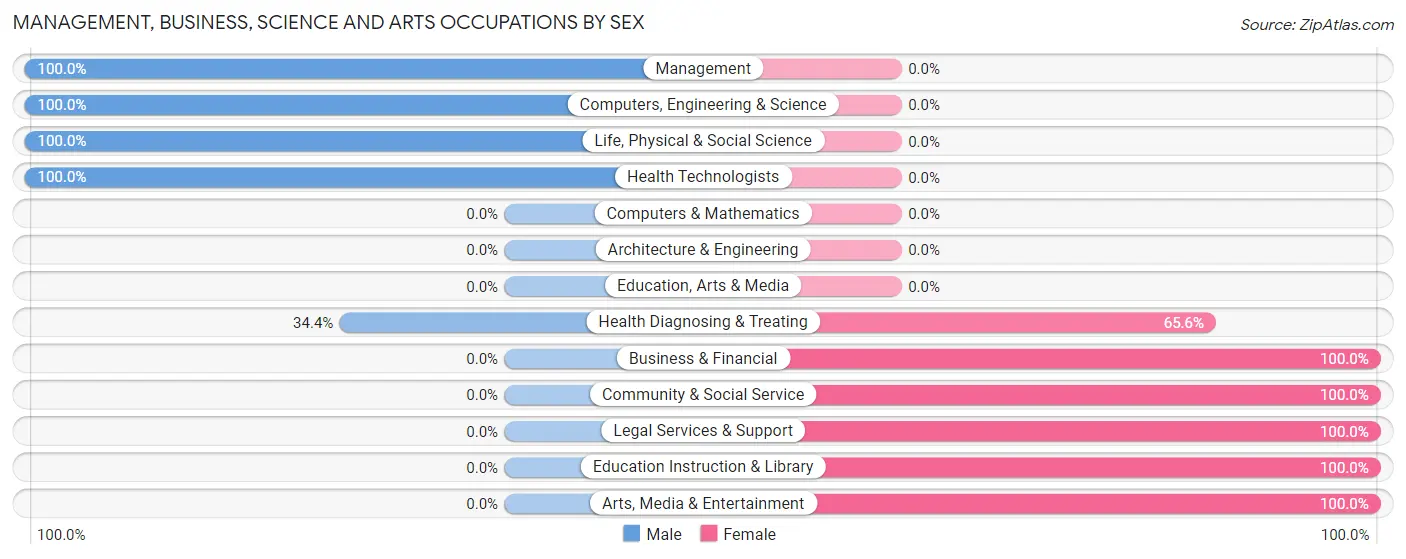
| Occupation | Male | Female |
| Management | 90 (100.0%) | 0 (0.0%) |
| Business & Financial | 0 (0.0%) | 31 (100.0%) |
| Computers, Engineering & Science | 10 (100.0%) | 0 (0.0%) |
| Computers & Mathematics | 0 (0.0%) | 0 (0.0%) |
| Architecture & Engineering | 0 (0.0%) | 0 (0.0%) |
| Life, Physical & Social Science | 10 (100.0%) | 0 (0.0%) |
| Community & Social Service | 0 (0.0%) | 72 (100.0%) |
| Education, Arts & Media | 0 (0.0%) | 0 (0.0%) |
| Legal Services & Support | 0 (0.0%) | 8 (100.0%) |
| Education Instruction & Library | 0 (0.0%) | 13 (100.0%) |
| Arts, Media & Entertainment | 0 (0.0%) | 51 (100.0%) |
| Health Diagnosing & Treating | 11 (34.4%) | 21 (65.6%) |
| Health Technologists | 11 (100.0%) | 0 (0.0%) |
| Total (Category) | 111 (47.2%) | 124 (52.8%) |
| Total (Overall) | 276 (56.7%) | 211 (43.3%) |
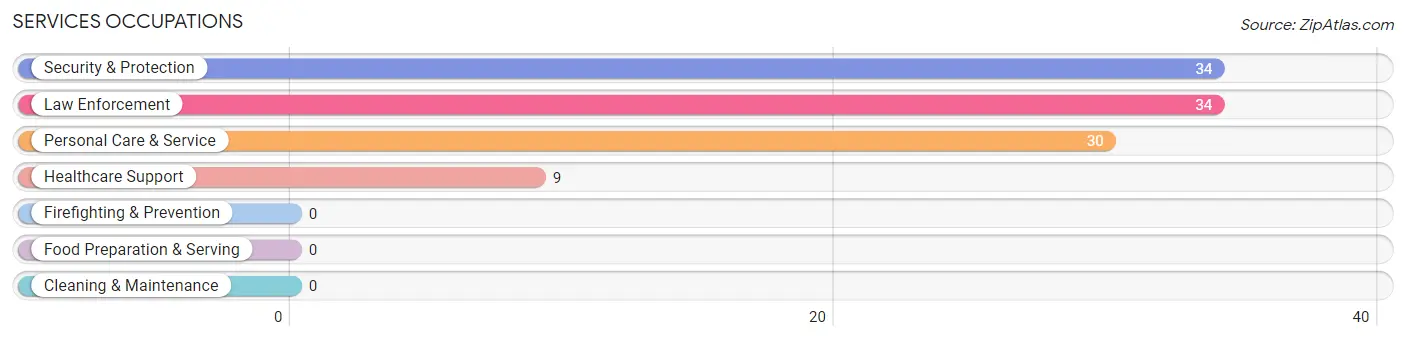
Services Occupations
The most common Services occupations in Ventress are Security & Protection (34 | 7.0%), Law Enforcement (34 | 7.0%), Personal Care & Service (30 | 6.2%), and Healthcare Support (9 | 1.8%).
Services Occupations by Sex
Within the Services occupations in Ventress, the most male-oriented occupations are Security & Protection (100.0%), and Law Enforcement (100.0%), while the most female-oriented occupations are Healthcare Support (100.0%), and Personal Care & Service (100.0%).
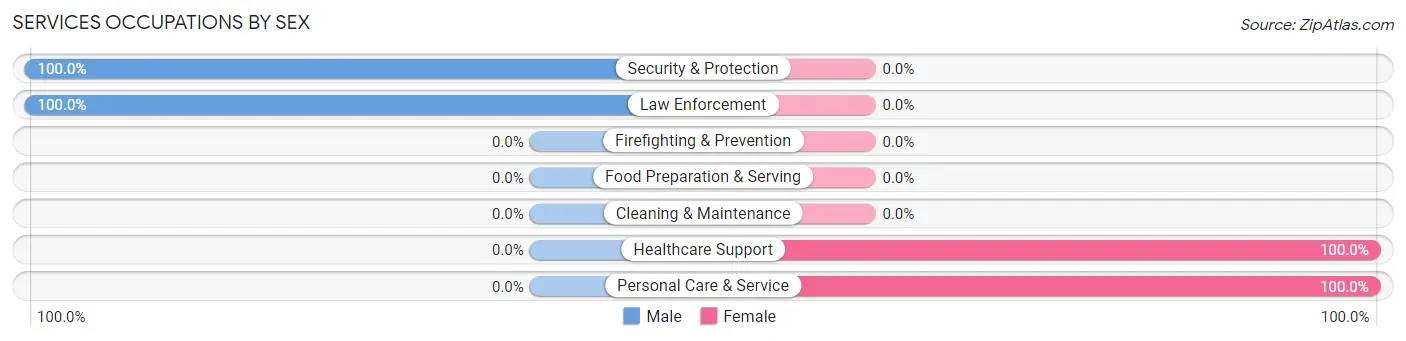
| Occupation | Male | Female |
| Healthcare Support | 0 (0.0%) | 9 (100.0%) |
| Security & Protection | 34 (100.0%) | 0 (0.0%) |
| Firefighting & Prevention | 0 (0.0%) | 0 (0.0%) |
| Law Enforcement | 34 (100.0%) | 0 (0.0%) |
| Food Preparation & Serving | 0 (0.0%) | 0 (0.0%) |
| Cleaning & Maintenance | 0 (0.0%) | 0 (0.0%) |
| Personal Care & Service | 0 (0.0%) | 30 (100.0%) |
| Total (Category) | 34 (46.6%) | 39 (53.4%) |
| Total (Overall) | 276 (56.7%) | 211 (43.3%) |
Sales and Office Occupations
The most common Sales and Office occupations in Ventress are Sales & Related (38 | 7.8%), and Office & Administration (10 | 2.1%).
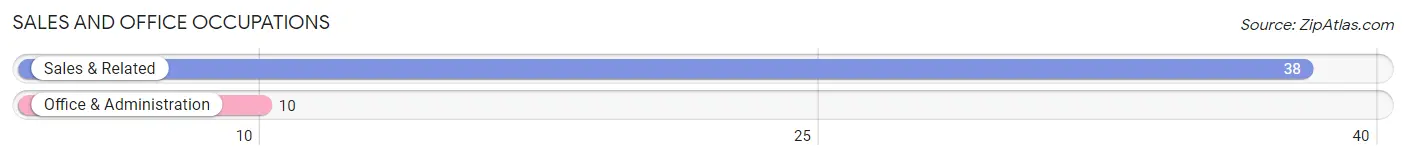
Sales and Office Occupations by Sex
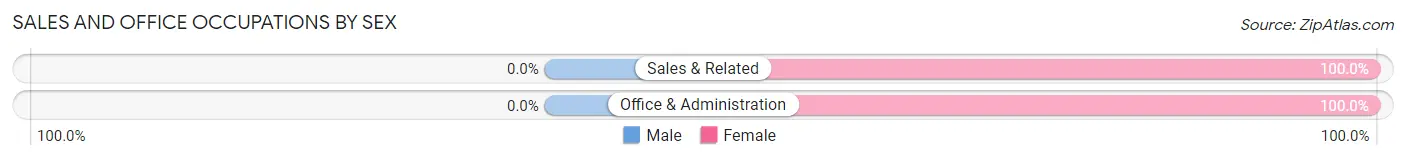
| Occupation | Male | Female |
| Sales & Related | 0 (0.0%) | 38 (100.0%) |
| Office & Administration | 0 (0.0%) | 10 (100.0%) |
| Total (Category) | 0 (0.0%) | 48 (100.0%) |
| Total (Overall) | 276 (56.7%) | 211 (43.3%) |
Natural Resources, Construction and Maintenance Occupations
The most common Natural Resources, Construction and Maintenance occupations in Ventress are Installation, Maintenance & Repair (32 | 6.6%), and Construction & Extraction (30 | 6.2%).
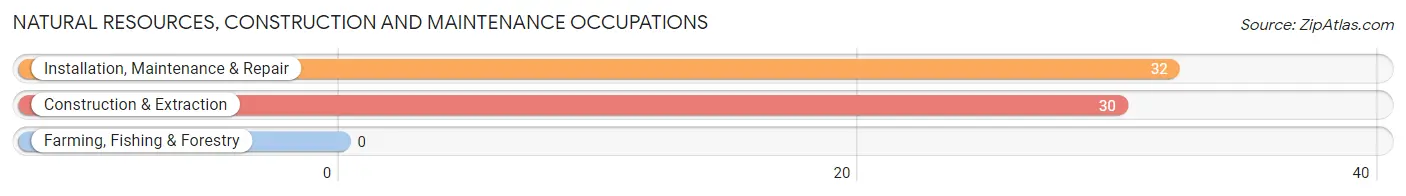
Natural Resources, Construction and Maintenance Occupations by Sex
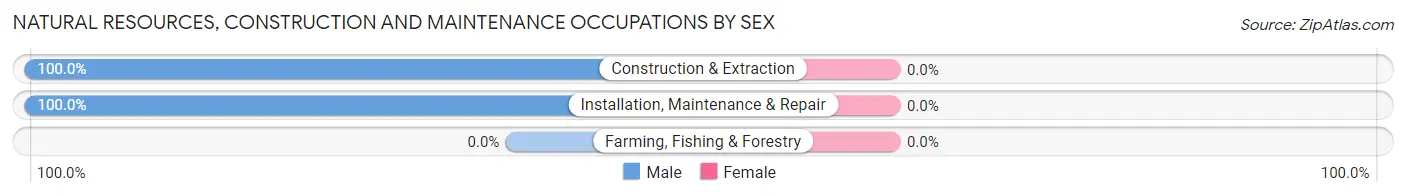
| Occupation | Male | Female |
| Farming, Fishing & Forestry | 0 (0.0%) | 0 (0.0%) |
| Construction & Extraction | 30 (100.0%) | 0 (0.0%) |
| Installation, Maintenance & Repair | 32 (100.0%) | 0 (0.0%) |
| Total (Category) | 62 (100.0%) | 0 (0.0%) |
| Total (Overall) | 276 (56.7%) | 211 (43.3%) |
Production, Transportation and Moving Occupations
The most common Production, Transportation and Moving occupations in Ventress are , and Production (69 | 14.2%).
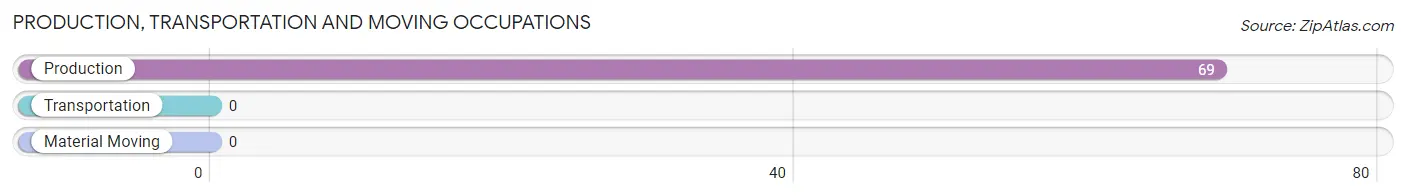
Production, Transportation and Moving Occupations by Sex
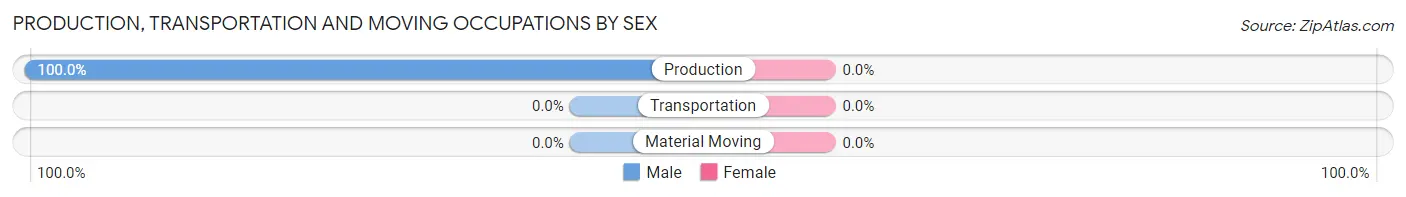
| Occupation | Male | Female |
| Production | 69 (100.0%) | 0 (0.0%) |
| Transportation | 0 (0.0%) | 0 (0.0%) |
| Material Moving | 0 (0.0%) | 0 (0.0%) |
| Total (Category) | 69 (100.0%) | 0 (0.0%) |
| Total (Overall) | 276 (56.7%) | 211 (43.3%) |
Employment Industries by Sex in Ventress
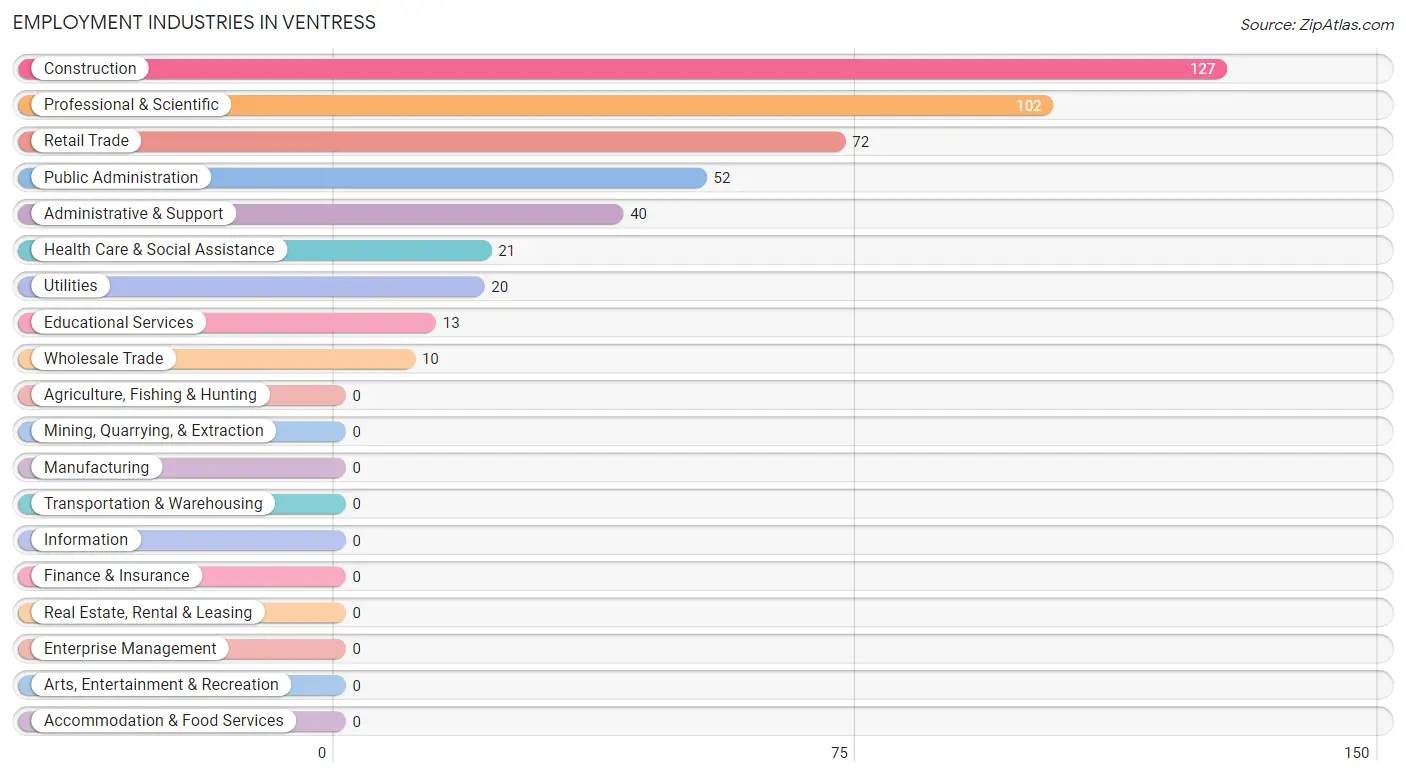
Employment Industries in Ventress
The major employment industries in Ventress include Construction (127 | 26.1%), Professional & Scientific (102 | 20.9%), Retail Trade (72 | 14.8%), Public Administration (52 | 10.7%), and Administrative & Support (40 | 8.2%).
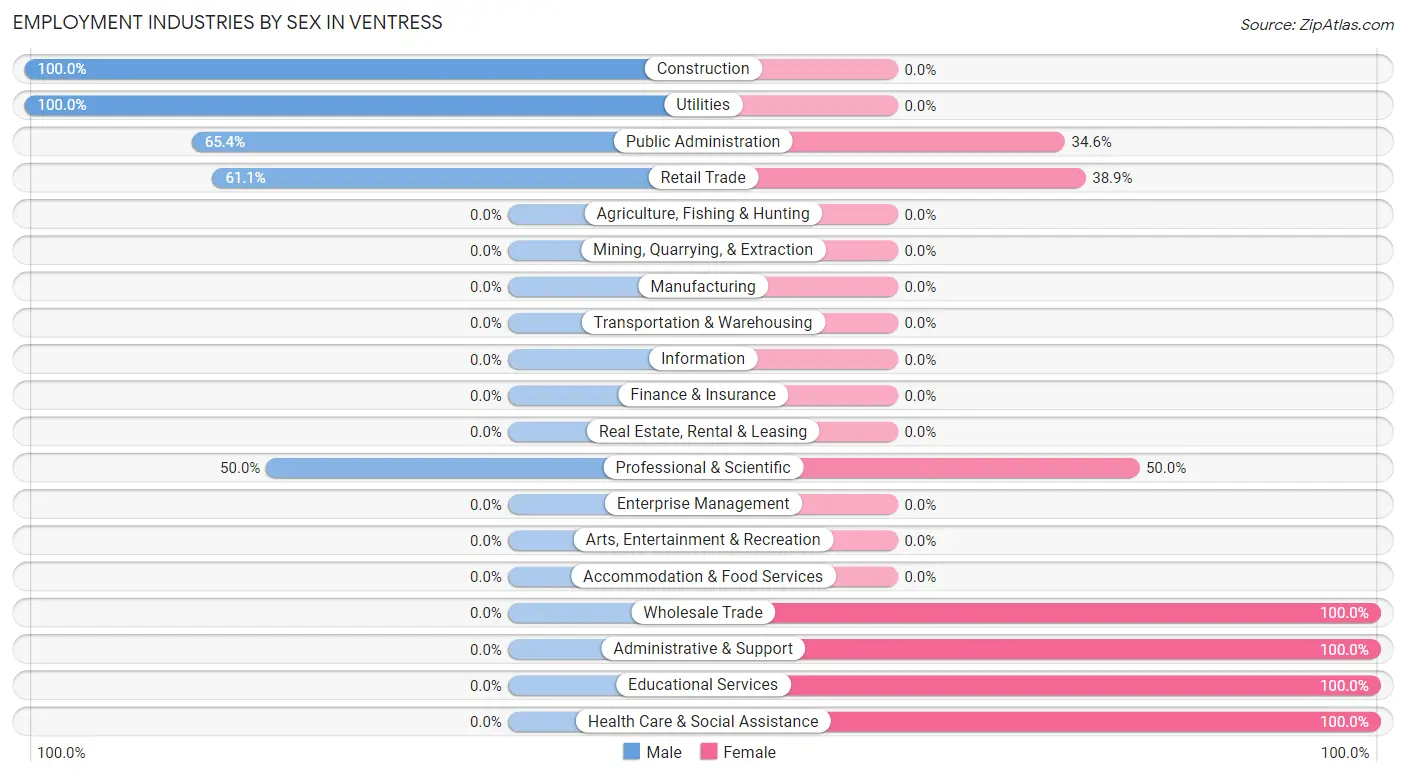
Employment Industries by Sex in Ventress
The Ventress industries that see more men than women are Construction (100.0%), Utilities (100.0%), and Public Administration (65.4%), whereas the industries that tend to have a higher number of women are Wholesale Trade (100.0%), Administrative & Support (100.0%), and Educational Services (100.0%).
| Industry | Male | Female |
| Agriculture, Fishing & Hunting | 0 (0.0%) | 0 (0.0%) |
| Mining, Quarrying, & Extraction | 0 (0.0%) | 0 (0.0%) |
| Construction | 127 (100.0%) | 0 (0.0%) |
| Manufacturing | 0 (0.0%) | 0 (0.0%) |
| Wholesale Trade | 0 (0.0%) | 10 (100.0%) |
| Retail Trade | 44 (61.1%) | 28 (38.9%) |
| Transportation & Warehousing | 0 (0.0%) | 0 (0.0%) |
| Utilities | 20 (100.0%) | 0 (0.0%) |
| Information | 0 (0.0%) | 0 (0.0%) |
| Finance & Insurance | 0 (0.0%) | 0 (0.0%) |
| Real Estate, Rental & Leasing | 0 (0.0%) | 0 (0.0%) |
| Professional & Scientific | 51 (50.0%) | 51 (50.0%) |
| Enterprise Management | 0 (0.0%) | 0 (0.0%) |
| Administrative & Support | 0 (0.0%) | 40 (100.0%) |
| Educational Services | 0 (0.0%) | 13 (100.0%) |
| Health Care & Social Assistance | 0 (0.0%) | 21 (100.0%) |
| Arts, Entertainment & Recreation | 0 (0.0%) | 0 (0.0%) |
| Accommodation & Food Services | 0 (0.0%) | 0 (0.0%) |
| Public Administration | 34 (65.4%) | 18 (34.6%) |
| Total | 276 (56.7%) | 211 (43.3%) |
Education in Ventress
School Enrollment in Ventress
The most common levels of schooling among the 239 students in Ventress are college / undergraduate (111 | 46.4%), middle school (41 | 17.2%), and graduate / professional (34 | 14.2%).
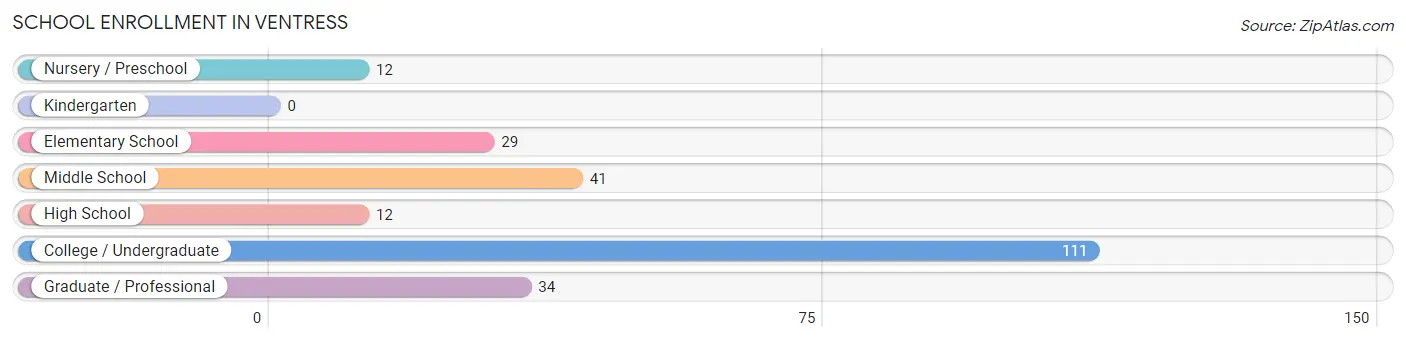
| School Level | # Students | % Students |
| Nursery / Preschool | 12 | 5.0% |
| Kindergarten | 0 | 0.0% |
| Elementary School | 29 | 12.1% |
| Middle School | 41 | 17.2% |
| High School | 12 | 5.0% |
| College / Undergraduate | 111 | 46.4% |
| Graduate / Professional | 34 | 14.2% |
| Total | 239 | 100.0% |
School Enrollment by Age by Funding Source in Ventress
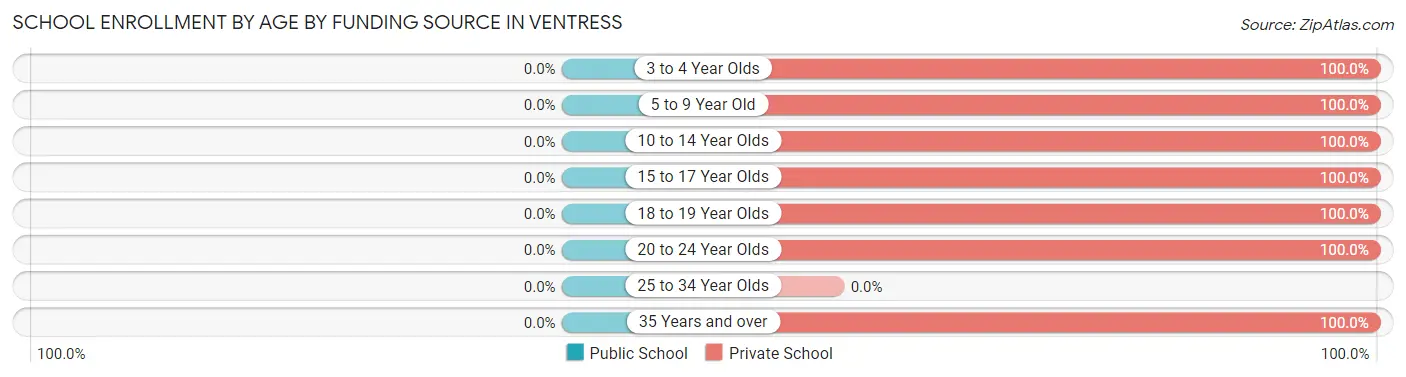
| Age Bracket | Public School | Private School |
| 3 to 4 Year Olds | 0 (0.0%) | 12 (100.0%) |
| 5 to 9 Year Old | 0 (0.0%) | 29 (100.0%) |
| 10 to 14 Year Olds | 0 (0.0%) | 41 (100.0%) |
| 15 to 17 Year Olds | 0 (0.0%) | 12 (100.0%) |
| 18 to 19 Year Olds | 0 (0.0%) | 98 (100.0%) |
| 20 to 24 Year Olds | 0 (0.0%) | 13 (100.0%) |
| 25 to 34 Year Olds | 0 (0.0%) | 0 (0.0%) |
| 35 Years and over | 0 (0.0%) | 34 (100.0%) |
| Total | 0 (0.0%) | 239 (100.0%) |
Educational Attainment by Field of Study in Ventress
Business (84 | 46.7%), education (47 | 26.1%), engineering (13 | 7.2%), science & technology (11 | 6.1%), and arts & humanities (10 | 5.6%) are the most common fields of study among 180 individuals in Ventress who have obtained a bachelor's degree or higher.
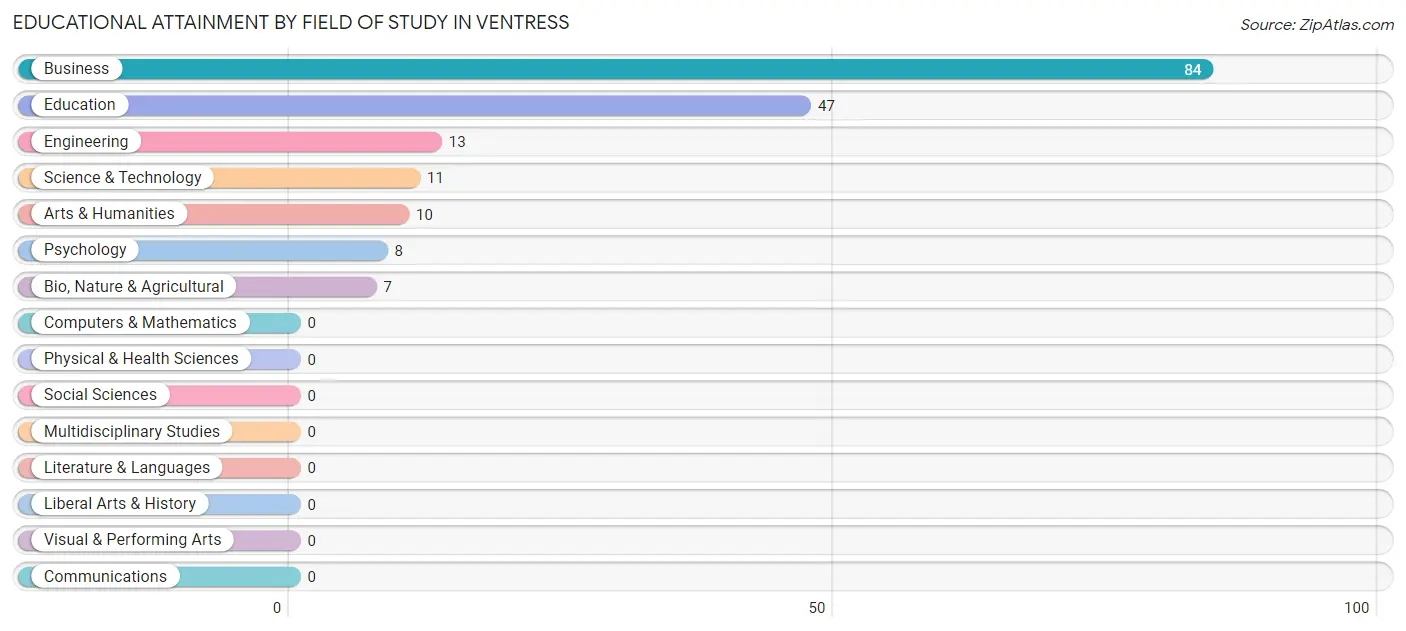
| Field of Study | # Graduates | % Graduates |
| Computers & Mathematics | 0 | 0.0% |
| Bio, Nature & Agricultural | 7 | 3.9% |
| Physical & Health Sciences | 0 | 0.0% |
| Psychology | 8 | 4.4% |
| Social Sciences | 0 | 0.0% |
| Engineering | 13 | 7.2% |
| Multidisciplinary Studies | 0 | 0.0% |
| Science & Technology | 11 | 6.1% |
| Business | 84 | 46.7% |
| Education | 47 | 26.1% |
| Literature & Languages | 0 | 0.0% |
| Liberal Arts & History | 0 | 0.0% |
| Visual & Performing Arts | 0 | 0.0% |
| Communications | 0 | 0.0% |
| Arts & Humanities | 10 | 5.6% |
| Total | 180 | 100.0% |
Transportation & Commute in Ventress
Vehicle Availability by Sex in Ventress
The most prevalent vehicle ownership categories in Ventress are males with 2 vehicles (180, accounting for 65.2%) and females with 2 vehicles (88, making up 94.7%).
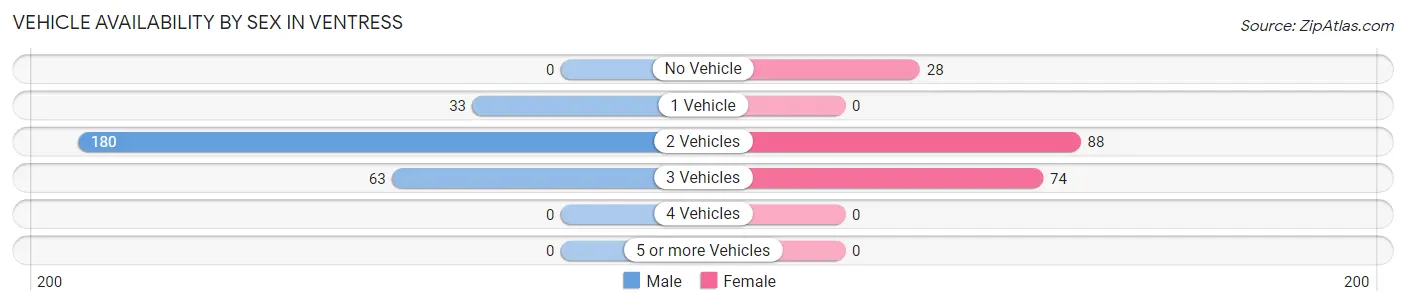
| Vehicles Available | Male | Female |
| No Vehicle | 0 (0.0%) | 28 (14.7%) |
| 1 Vehicle | 33 (12.0%) | 0 (0.0%) |
| 2 Vehicles | 180 (65.2%) | 88 (46.3%) |
| 3 Vehicles | 63 (22.8%) | 74 (39.0%) |
| 4 Vehicles | 0 (0.0%) | 0 (0.0%) |
| 5 or more Vehicles | 0 (0.0%) | 0 (0.0%) |
| Total | 276 (100.0%) | 190 (100.0%) |
Commute Time in Ventress
The most frequently occuring commute durations in Ventress are 40 to 44 minutes (146 commuters, 32.7%), 45 to 59 minutes (62 commuters, 13.9%), and 60 to 89 minutes (59 commuters, 13.2%).
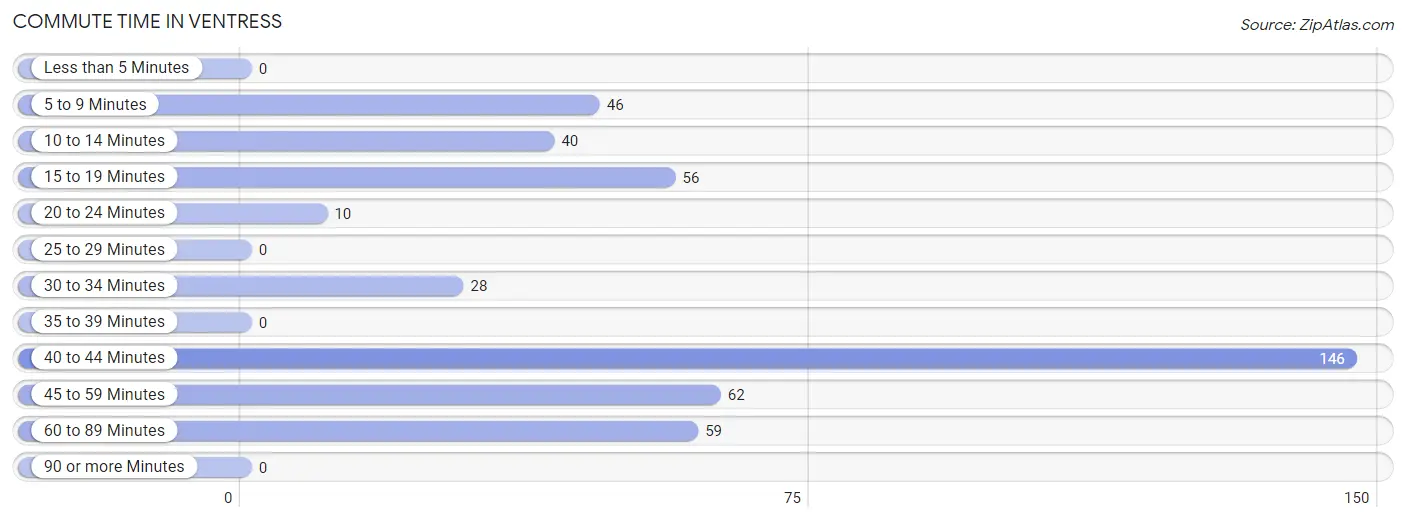
| Commute Time | # Commuters | % Commuters |
| Less than 5 Minutes | 0 | 0.0% |
| 5 to 9 Minutes | 46 | 10.3% |
| 10 to 14 Minutes | 40 | 8.9% |
| 15 to 19 Minutes | 56 | 12.5% |
| 20 to 24 Minutes | 10 | 2.2% |
| 25 to 29 Minutes | 0 | 0.0% |
| 30 to 34 Minutes | 28 | 6.3% |
| 35 to 39 Minutes | 0 | 0.0% |
| 40 to 44 Minutes | 146 | 32.7% |
| 45 to 59 Minutes | 62 | 13.9% |
| 60 to 89 Minutes | 59 | 13.2% |
| 90 or more Minutes | 0 | 0.0% |
Commute Time by Sex in Ventress
The most common commute times in Ventress are 40 to 44 minutes (95 commuters, 34.4%) for males and 40 to 44 minutes (51 commuters, 29.8%) for females.
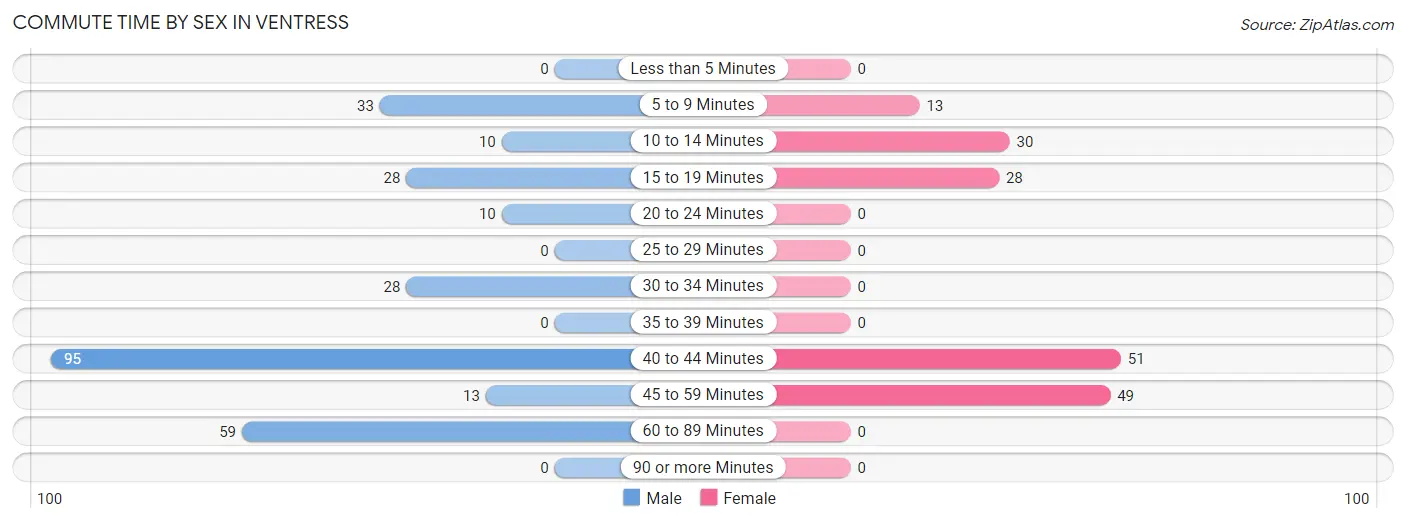
| Commute Time | Male | Female |
| Less than 5 Minutes | 0 (0.0%) | 0 (0.0%) |
| 5 to 9 Minutes | 33 (12.0%) | 13 (7.6%) |
| 10 to 14 Minutes | 10 (3.6%) | 30 (17.5%) |
| 15 to 19 Minutes | 28 (10.1%) | 28 (16.4%) |
| 20 to 24 Minutes | 10 (3.6%) | 0 (0.0%) |
| 25 to 29 Minutes | 0 (0.0%) | 0 (0.0%) |
| 30 to 34 Minutes | 28 (10.1%) | 0 (0.0%) |
| 35 to 39 Minutes | 0 (0.0%) | 0 (0.0%) |
| 40 to 44 Minutes | 95 (34.4%) | 51 (29.8%) |
| 45 to 59 Minutes | 13 (4.7%) | 49 (28.6%) |
| 60 to 89 Minutes | 59 (21.4%) | 0 (0.0%) |
| 90 or more Minutes | 0 (0.0%) | 0 (0.0%) |
Time of Departure to Work by Sex in Ventress
The most frequent times of departure to work in Ventress are 7:00 AM to 7:29 AM (123, 44.6%) for males and 7:30 AM to 7:59 AM (84, 49.1%) for females.
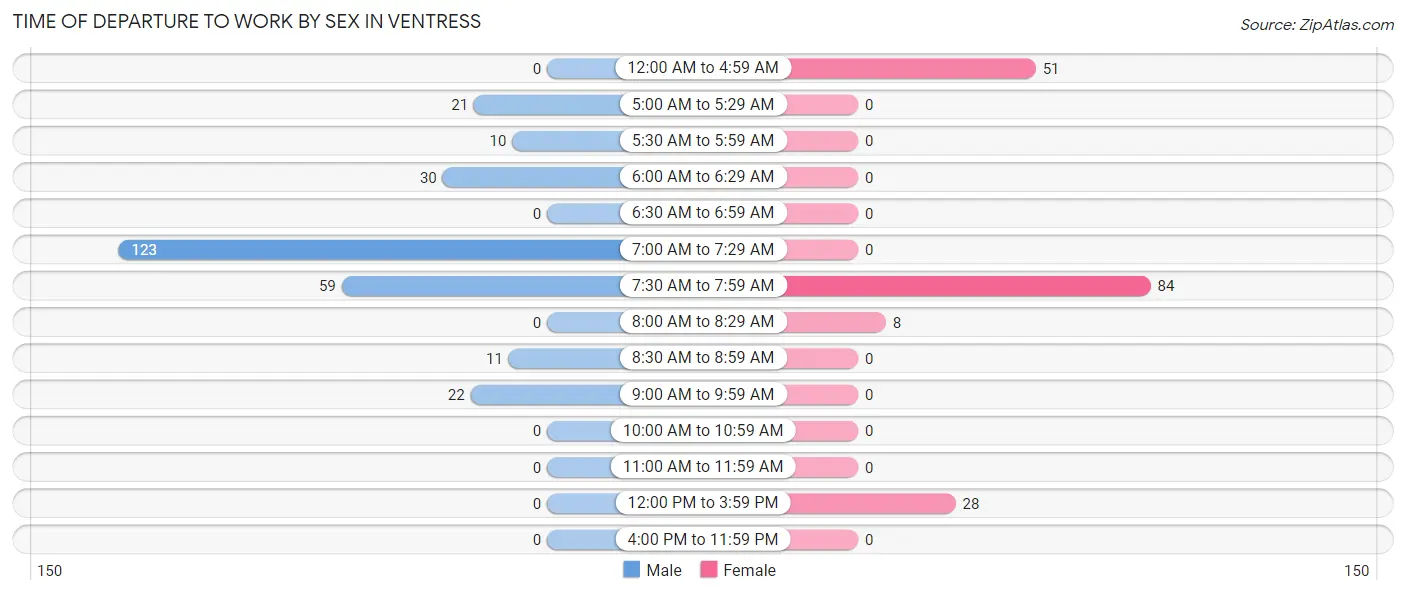
| Time of Departure | Male | Female |
| 12:00 AM to 4:59 AM | 0 (0.0%) | 51 (29.8%) |
| 5:00 AM to 5:29 AM | 21 (7.6%) | 0 (0.0%) |
| 5:30 AM to 5:59 AM | 10 (3.6%) | 0 (0.0%) |
| 6:00 AM to 6:29 AM | 30 (10.9%) | 0 (0.0%) |
| 6:30 AM to 6:59 AM | 0 (0.0%) | 0 (0.0%) |
| 7:00 AM to 7:29 AM | 123 (44.6%) | 0 (0.0%) |
| 7:30 AM to 7:59 AM | 59 (21.4%) | 84 (49.1%) |
| 8:00 AM to 8:29 AM | 0 (0.0%) | 8 (4.7%) |
| 8:30 AM to 8:59 AM | 11 (4.0%) | 0 (0.0%) |
| 9:00 AM to 9:59 AM | 22 (8.0%) | 0 (0.0%) |
| 10:00 AM to 10:59 AM | 0 (0.0%) | 0 (0.0%) |
| 11:00 AM to 11:59 AM | 0 (0.0%) | 0 (0.0%) |
| 12:00 PM to 3:59 PM | 0 (0.0%) | 28 (16.4%) |
| 4:00 PM to 11:59 PM | 0 (0.0%) | 0 (0.0%) |
| Total | 276 (100.0%) | 171 (100.0%) |
Housing Occupancy in Ventress
Occupancy by Ownership in Ventress
Of the total 412 dwellings in Ventress, owner-occupied units account for 319 (77.4%), while renter-occupied units make up 93 (22.6%).
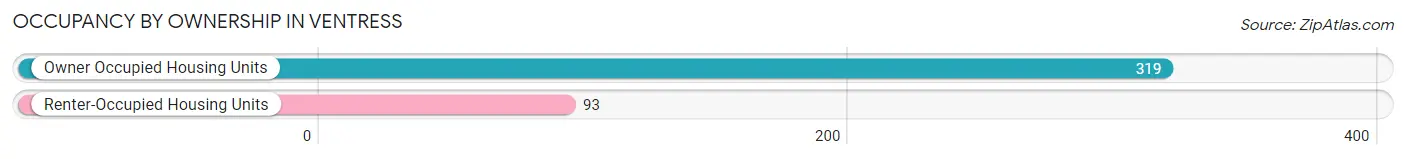
| Occupancy | # Housing Units | % Housing Units |
| Owner Occupied Housing Units | 319 | 77.4% |
| Renter-Occupied Housing Units | 93 | 22.6% |
| Total Occupied Housing Units | 412 | 100.0% |
Occupancy by Household Size in Ventress
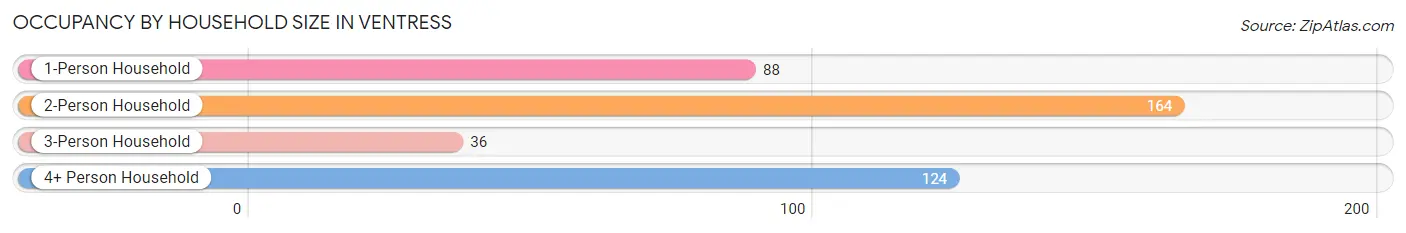
| Household Size | # Housing Units | % Housing Units |
| 1-Person Household | 88 | 21.4% |
| 2-Person Household | 164 | 39.8% |
| 3-Person Household | 36 | 8.7% |
| 4+ Person Household | 124 | 30.1% |
| Total Housing Units | 412 | 100.0% |
Occupancy by Ownership by Household Size in Ventress
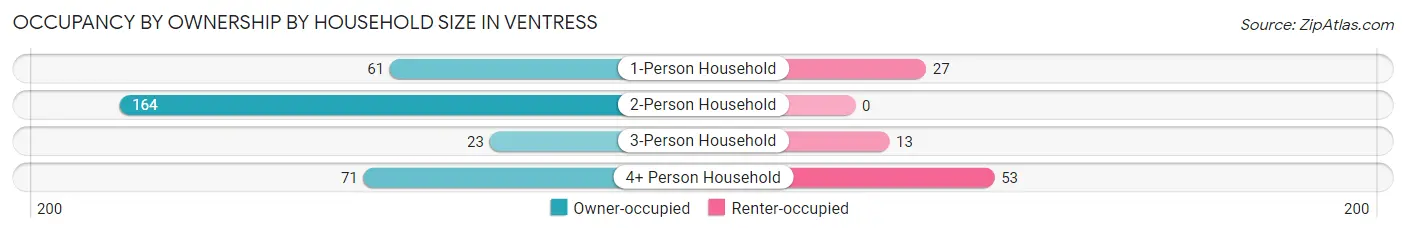
| Household Size | Owner-occupied | Renter-occupied |
| 1-Person Household | 61 (69.3%) | 27 (30.7%) |
| 2-Person Household | 164 (100.0%) | 0 (0.0%) |
| 3-Person Household | 23 (63.9%) | 13 (36.1%) |
| 4+ Person Household | 71 (57.3%) | 53 (42.7%) |
| Total Housing Units | 319 (77.4%) | 93 (22.6%) |
Occupancy by Educational Attainment in Ventress
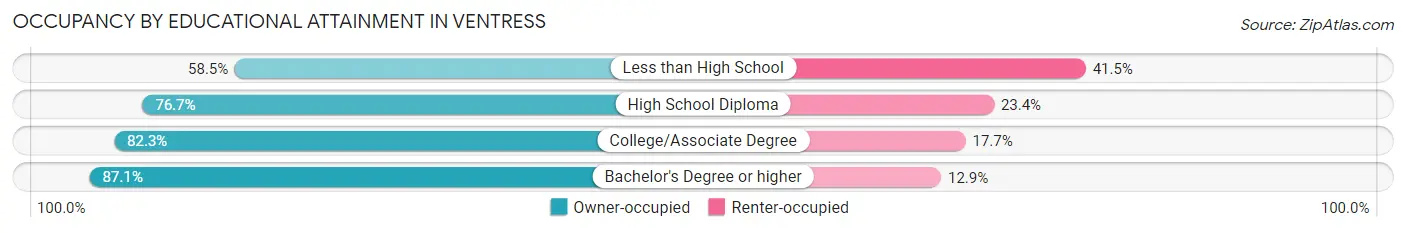
| Household Size | Owner-occupied | Renter-occupied |
| Less than High School | 38 (58.5%) | 27 (41.5%) |
| High School Diploma | 128 (76.6%) | 39 (23.4%) |
| College/Associate Degree | 65 (82.3%) | 14 (17.7%) |
| Bachelor's Degree or higher | 88 (87.1%) | 13 (12.9%) |
Occupancy by Age of Householder in Ventress
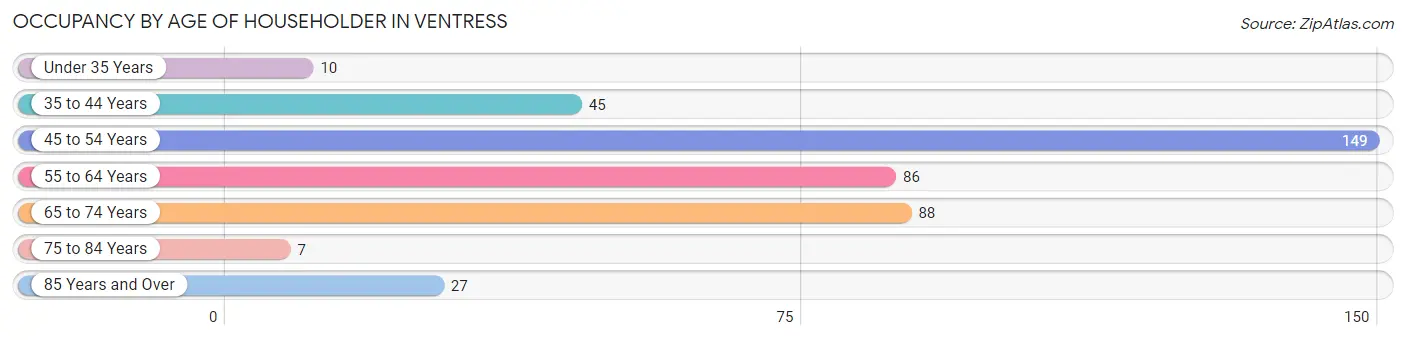
| Age Bracket | # Households | % Households |
| Under 35 Years | 10 | 2.4% |
| 35 to 44 Years | 45 | 10.9% |
| 45 to 54 Years | 149 | 36.2% |
| 55 to 64 Years | 86 | 20.9% |
| 65 to 74 Years | 88 | 21.4% |
| 75 to 84 Years | 7 | 1.7% |
| 85 Years and Over | 27 | 6.6% |
| Total | 412 | 100.0% |
Housing Finances in Ventress
Median Income by Occupancy in Ventress
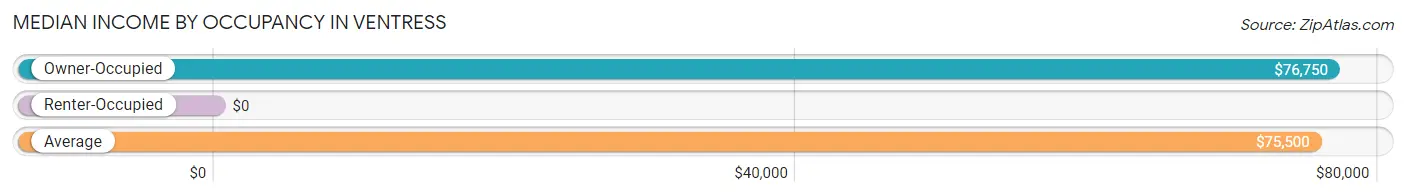
| Occupancy Type | # Households | Median Income |
| Owner-Occupied | 319 (77.4%) | $76,750 |
| Renter-Occupied | 93 (22.6%) | $0 |
| Average | 412 (100.0%) | $75,500 |
Occupancy by Householder Income Bracket in Ventress
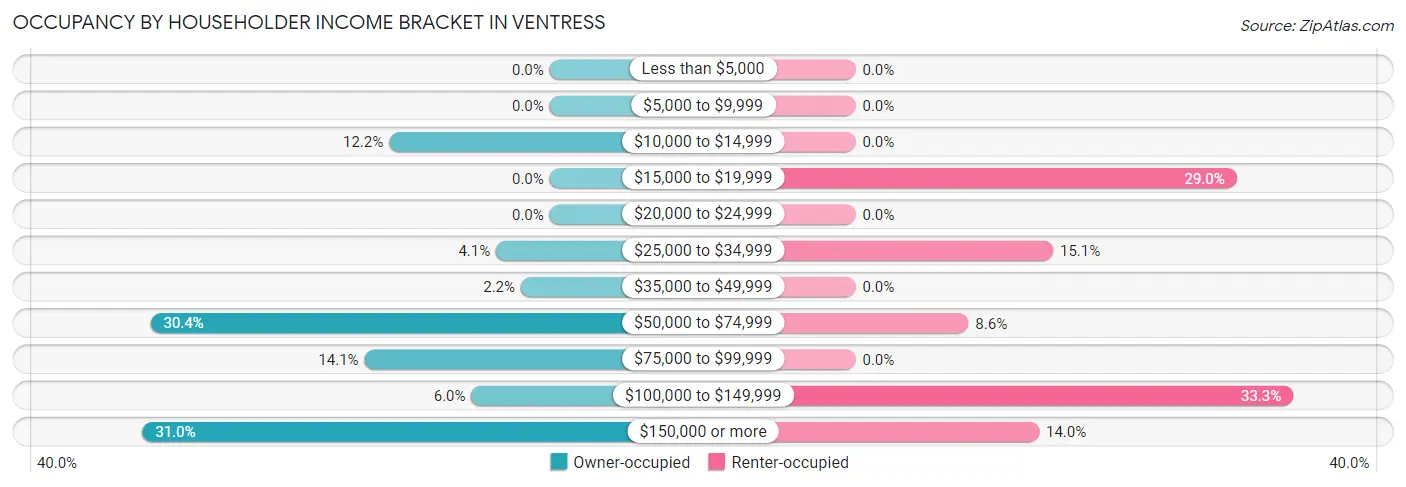
| Income Bracket | Owner-occupied | Renter-occupied |
| Less than $5,000 | 0 (0.0%) | 0 (0.0%) |
| $5,000 to $9,999 | 0 (0.0%) | 0 (0.0%) |
| $10,000 to $14,999 | 39 (12.2%) | 0 (0.0%) |
| $15,000 to $19,999 | 0 (0.0%) | 27 (29.0%) |
| $20,000 to $24,999 | 0 (0.0%) | 0 (0.0%) |
| $25,000 to $34,999 | 13 (4.1%) | 14 (15.0%) |
| $35,000 to $49,999 | 7 (2.2%) | 0 (0.0%) |
| $50,000 to $74,999 | 97 (30.4%) | 8 (8.6%) |
| $75,000 to $99,999 | 45 (14.1%) | 0 (0.0%) |
| $100,000 to $149,999 | 19 (6.0%) | 31 (33.3%) |
| $150,000 or more | 99 (31.0%) | 13 (14.0%) |
| Total | 319 (100.0%) | 93 (100.0%) |
Monthly Housing Cost Tiers in Ventress
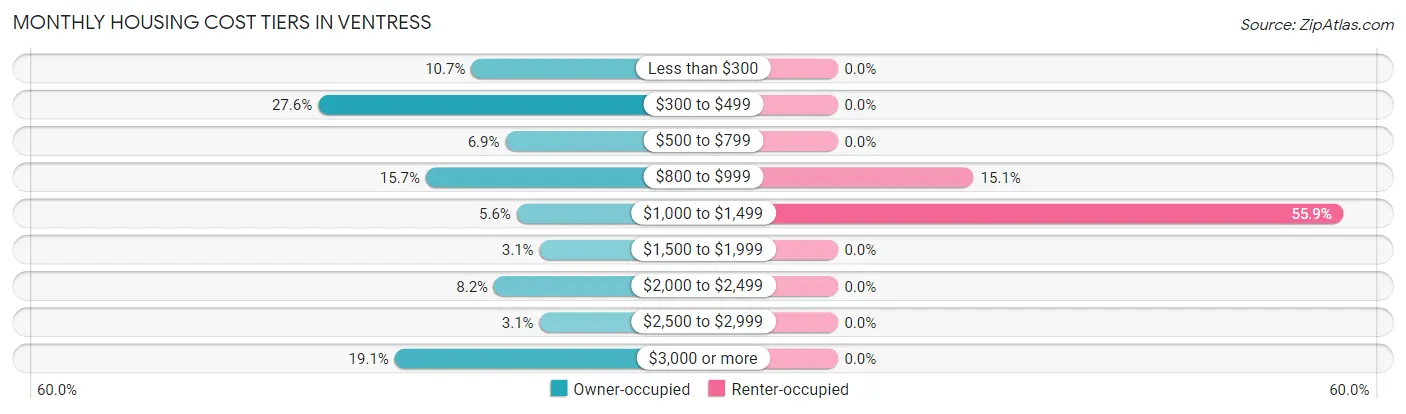
| Monthly Cost | Owner-occupied | Renter-occupied |
| Less than $300 | 34 (10.7%) | 0 (0.0%) |
| $300 to $499 | 88 (27.6%) | 0 (0.0%) |
| $500 to $799 | 22 (6.9%) | 0 (0.0%) |
| $800 to $999 | 50 (15.7%) | 14 (15.0%) |
| $1,000 to $1,499 | 18 (5.6%) | 52 (55.9%) |
| $1,500 to $1,999 | 10 (3.1%) | 0 (0.0%) |
| $2,000 to $2,499 | 26 (8.2%) | 0 (0.0%) |
| $2,500 to $2,999 | 10 (3.1%) | 0 (0.0%) |
| $3,000 or more | 61 (19.1%) | 0 (0.0%) |
| Total | 319 (100.0%) | 93 (100.0%) |
Physical Housing Characteristics in Ventress
Housing Structures in Ventress
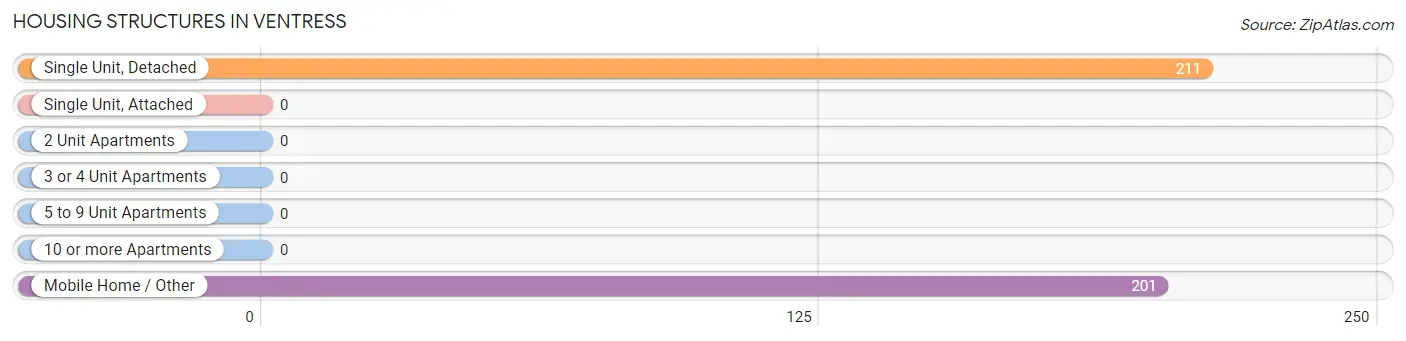
| Structure Type | # Housing Units | % Housing Units |
| Single Unit, Detached | 211 | 51.2% |
| Single Unit, Attached | 0 | 0.0% |
| 2 Unit Apartments | 0 | 0.0% |
| 3 or 4 Unit Apartments | 0 | 0.0% |
| 5 to 9 Unit Apartments | 0 | 0.0% |
| 10 or more Apartments | 0 | 0.0% |
| Mobile Home / Other | 201 | 48.8% |
| Total | 412 | 100.0% |
Housing Structures by Occupancy in Ventress
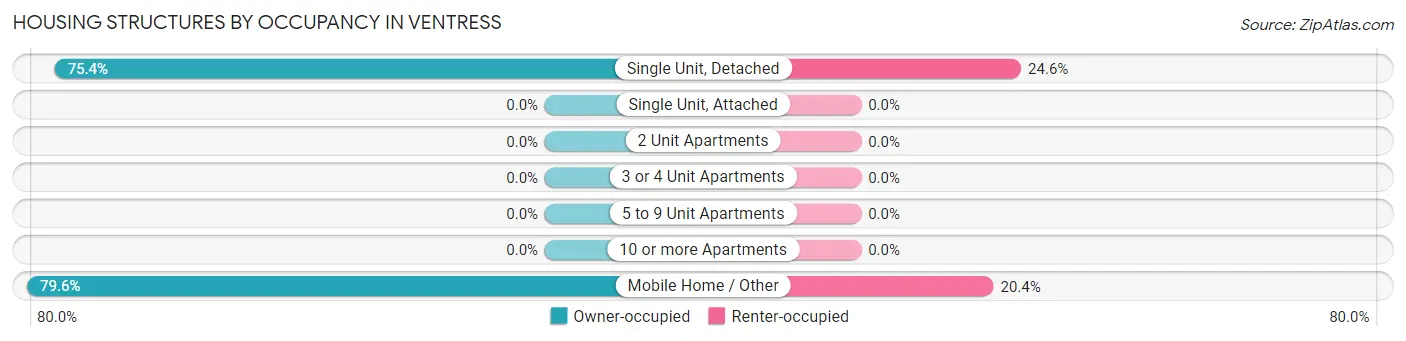
| Structure Type | Owner-occupied | Renter-occupied |
| Single Unit, Detached | 159 (75.4%) | 52 (24.6%) |
| Single Unit, Attached | 0 (0.0%) | 0 (0.0%) |
| 2 Unit Apartments | 0 (0.0%) | 0 (0.0%) |
| 3 or 4 Unit Apartments | 0 (0.0%) | 0 (0.0%) |
| 5 to 9 Unit Apartments | 0 (0.0%) | 0 (0.0%) |
| 10 or more Apartments | 0 (0.0%) | 0 (0.0%) |
| Mobile Home / Other | 160 (79.6%) | 41 (20.4%) |
| Total | 319 (77.4%) | 93 (22.6%) |
Housing Structures by Number of Rooms in Ventress
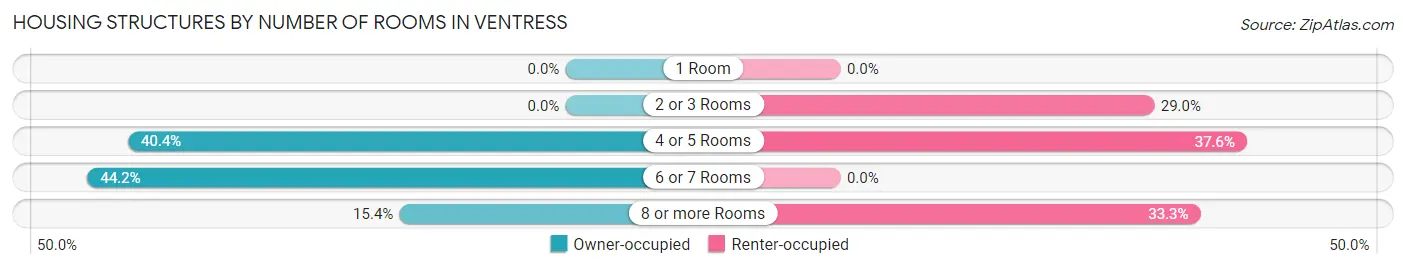
| Number of Rooms | Owner-occupied | Renter-occupied |
| 1 Room | 0 (0.0%) | 0 (0.0%) |
| 2 or 3 Rooms | 0 (0.0%) | 27 (29.0%) |
| 4 or 5 Rooms | 129 (40.4%) | 35 (37.6%) |
| 6 or 7 Rooms | 141 (44.2%) | 0 (0.0%) |
| 8 or more Rooms | 49 (15.4%) | 31 (33.3%) |
| Total | 319 (100.0%) | 93 (100.0%) |
Housing Structure by Heating Type in Ventress
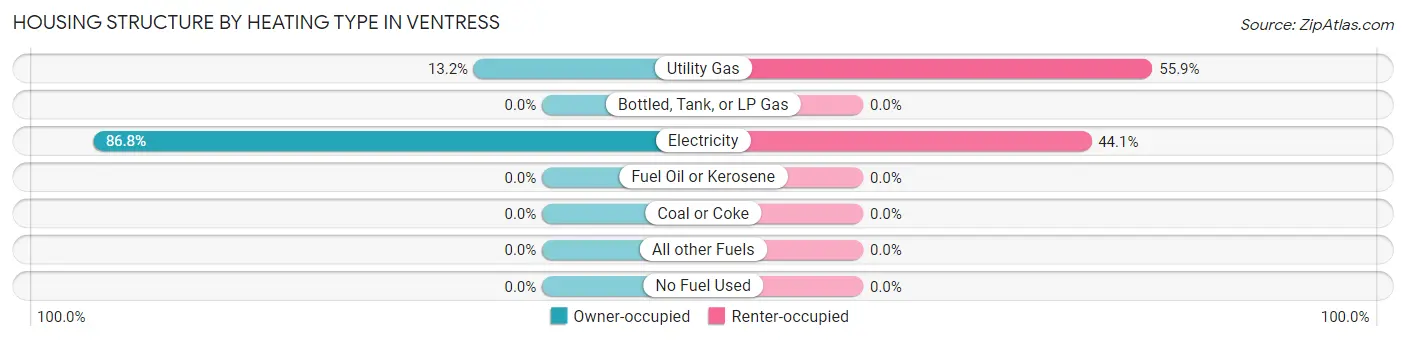
| Heating Type | Owner-occupied | Renter-occupied |
| Utility Gas | 42 (13.2%) | 52 (55.9%) |
| Bottled, Tank, or LP Gas | 0 (0.0%) | 0 (0.0%) |
| Electricity | 277 (86.8%) | 41 (44.1%) |
| Fuel Oil or Kerosene | 0 (0.0%) | 0 (0.0%) |
| Coal or Coke | 0 (0.0%) | 0 (0.0%) |
| All other Fuels | 0 (0.0%) | 0 (0.0%) |
| No Fuel Used | 0 (0.0%) | 0 (0.0%) |
| Total | 319 (100.0%) | 93 (100.0%) |
Household Vehicle Usage in Ventress
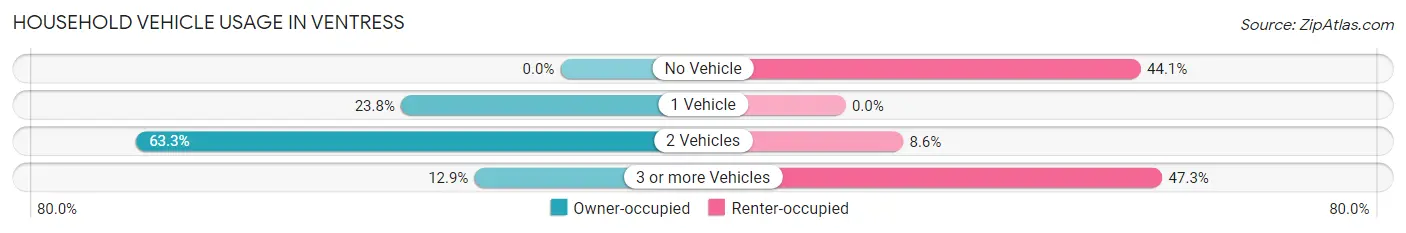
| Vehicles per Household | Owner-occupied | Renter-occupied |
| No Vehicle | 0 (0.0%) | 41 (44.1%) |
| 1 Vehicle | 76 (23.8%) | 0 (0.0%) |
| 2 Vehicles | 202 (63.3%) | 8 (8.6%) |
| 3 or more Vehicles | 41 (12.9%) | 44 (47.3%) |
| Total | 319 (100.0%) | 93 (100.0%) |
Real Estate & Mortgages in Ventress
Real Estate and Mortgage Overview in Ventress
| Characteristic | Without Mortgage | With Mortgage |
| Housing Units | 122 | 197 |
| Median Property Value | - | - |
| Median Household Income | $67,500 | $81 |
| Monthly Housing Costs | $341 | $61 |
| Real Estate Taxes | $386 | $80 |
Property Value by Mortgage Status in Ventress
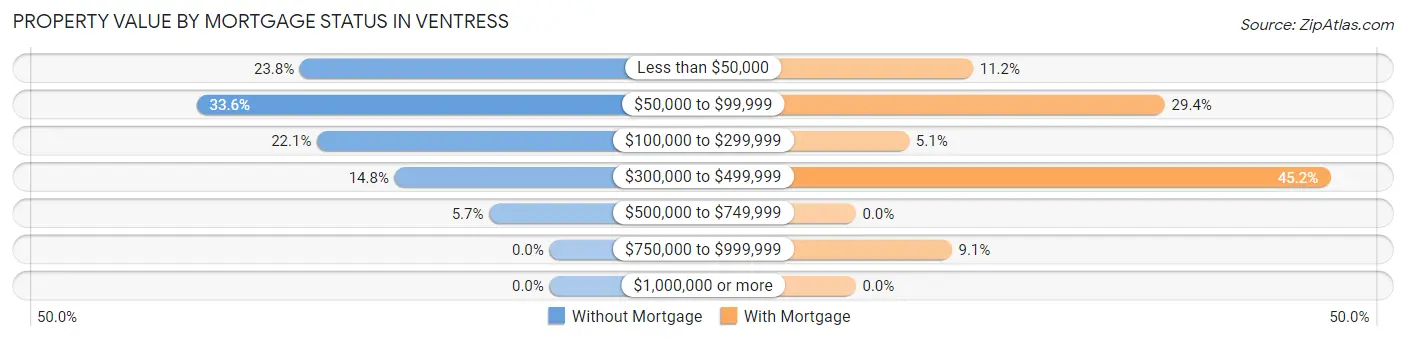
| Property Value | Without Mortgage | With Mortgage |
| Less than $50,000 | 29 (23.8%) | 22 (11.2%) |
| $50,000 to $99,999 | 41 (33.6%) | 58 (29.4%) |
| $100,000 to $299,999 | 27 (22.1%) | 10 (5.1%) |
| $300,000 to $499,999 | 18 (14.7%) | 89 (45.2%) |
| $500,000 to $749,999 | 7 (5.7%) | 0 (0.0%) |
| $750,000 to $999,999 | 0 (0.0%) | 18 (9.1%) |
| $1,000,000 or more | 0 (0.0%) | 0 (0.0%) |
| Total | 122 (100.0%) | 197 (100.0%) |
Household Income by Mortgage Status in Ventress
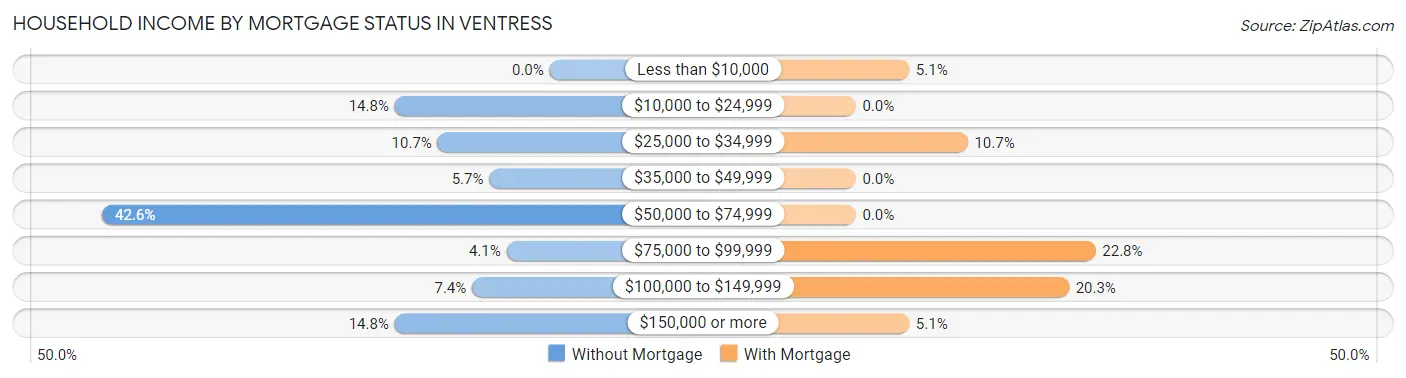
| Household Income | Without Mortgage | With Mortgage |
| Less than $10,000 | 0 (0.0%) | 10 (5.1%) |
| $10,000 to $24,999 | 18 (14.7%) | 0 (0.0%) |
| $25,000 to $34,999 | 13 (10.7%) | 21 (10.7%) |
| $35,000 to $49,999 | 7 (5.7%) | 0 (0.0%) |
| $50,000 to $74,999 | 52 (42.6%) | 0 (0.0%) |
| $75,000 to $99,999 | 5 (4.1%) | 45 (22.8%) |
| $100,000 to $149,999 | 9 (7.4%) | 40 (20.3%) |
| $150,000 or more | 18 (14.7%) | 10 (5.1%) |
| Total | 122 (100.0%) | 197 (100.0%) |
Property Value to Household Income Ratio in Ventress
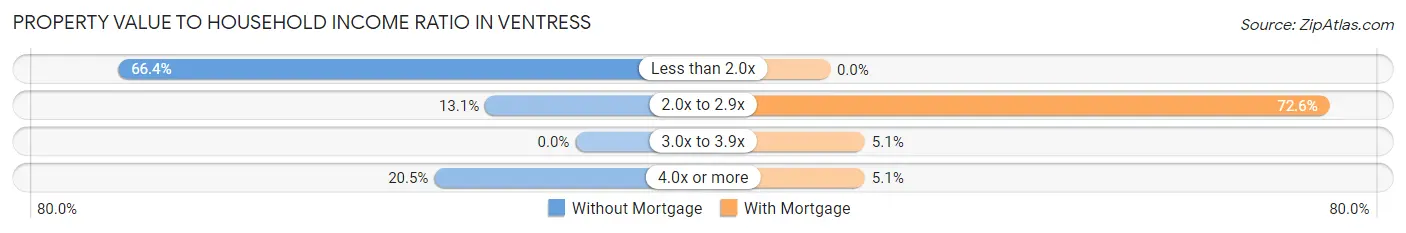
| Value-to-Income Ratio | Without Mortgage | With Mortgage |
| Less than 2.0x | 81 (66.4%) | 0 (0.0%) |
| 2.0x to 2.9x | 16 (13.1%) | 143 (72.6%) |
| 3.0x to 3.9x | 0 (0.0%) | 10 (5.1%) |
| 4.0x or more | 25 (20.5%) | 10 (5.1%) |
| Total | 122 (100.0%) | 197 (100.0%) |
Real Estate Taxes by Mortgage Status in Ventress
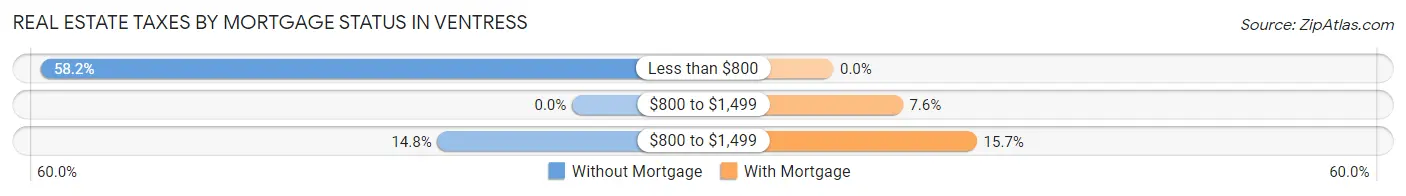
| Property Taxes | Without Mortgage | With Mortgage |
| Less than $800 | 71 (58.2%) | 0 (0.0%) |
| $800 to $1,499 | 0 (0.0%) | 15 (7.6%) |
| $800 to $1,499 | 18 (14.7%) | 31 (15.7%) |
| Total | 122 (100.0%) | 197 (100.0%) |
Health & Disability in Ventress
Health Insurance Coverage by Age in Ventress
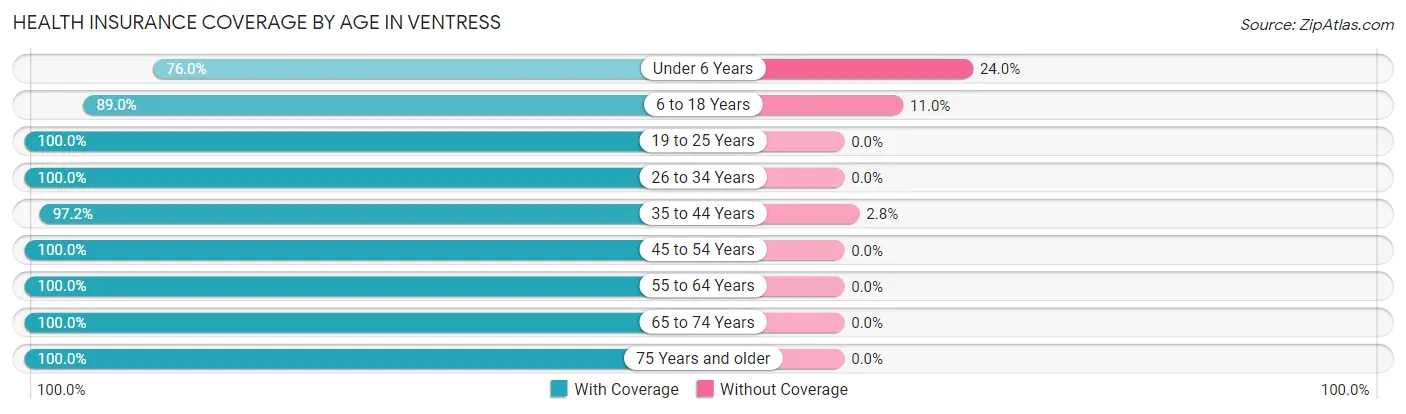
| Age Bracket | With Coverage | Without Coverage |
| Under 6 Years | 38 (76.0%) | 12 (24.0%) |
| 6 to 18 Years | 73 (89.0%) | 9 (11.0%) |
| 19 to 25 Years | 160 (100.0%) | 0 (0.0%) |
| 26 to 34 Years | 7 (100.0%) | 0 (0.0%) |
| 35 to 44 Years | 276 (97.2%) | 8 (2.8%) |
| 45 to 54 Years | 286 (100.0%) | 0 (0.0%) |
| 55 to 64 Years | 162 (100.0%) | 0 (0.0%) |
| 65 to 74 Years | 165 (100.0%) | 0 (0.0%) |
| 75 Years and older | 34 (100.0%) | 0 (0.0%) |
| Total | 1,201 (97.6%) | 29 (2.4%) |
Health Insurance Coverage by Citizenship Status in Ventress
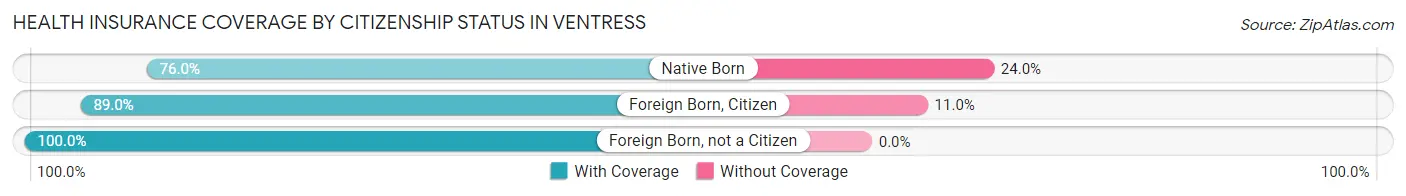
| Citizenship Status | With Coverage | Without Coverage |
| Native Born | 38 (76.0%) | 12 (24.0%) |
| Foreign Born, Citizen | 73 (89.0%) | 9 (11.0%) |
| Foreign Born, not a Citizen | 160 (100.0%) | 0 (0.0%) |
Health Insurance Coverage by Household Income in Ventress
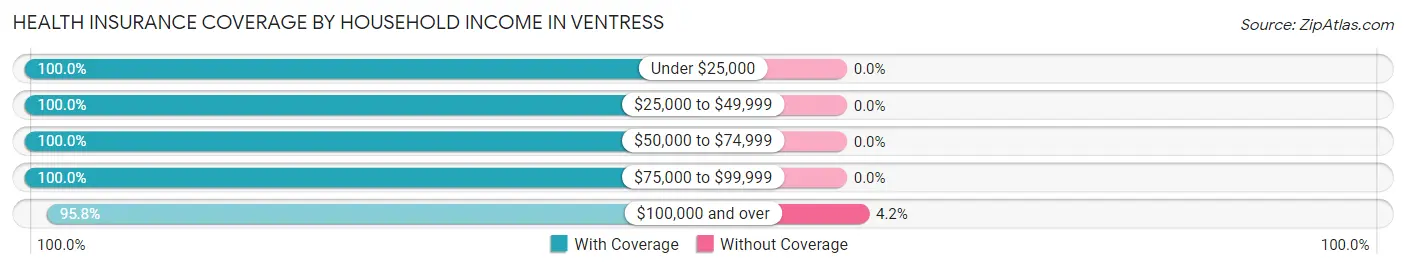
| Household Income | With Coverage | Without Coverage |
| Under $25,000 | 66 (100.0%) | 0 (0.0%) |
| $25,000 to $49,999 | 129 (100.0%) | 0 (0.0%) |
| $50,000 to $74,999 | 254 (100.0%) | 0 (0.0%) |
| $75,000 to $99,999 | 85 (100.0%) | 0 (0.0%) |
| $100,000 and over | 667 (95.8%) | 29 (4.2%) |
Public vs Private Health Insurance Coverage by Age in Ventress
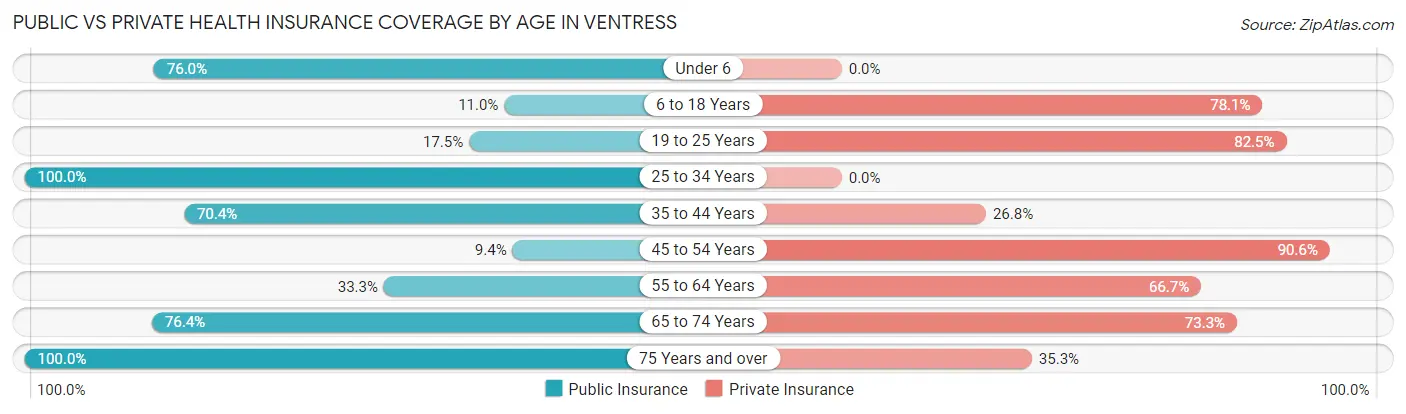
| Age Bracket | Public Insurance | Private Insurance |
| Under 6 | 38 (76.0%) | 0 (0.0%) |
| 6 to 18 Years | 9 (11.0%) | 64 (78.0%) |
| 19 to 25 Years | 28 (17.5%) | 132 (82.5%) |
| 25 to 34 Years | 7 (100.0%) | 0 (0.0%) |
| 35 to 44 Years | 200 (70.4%) | 76 (26.8%) |
| 45 to 54 Years | 27 (9.4%) | 259 (90.6%) |
| 55 to 64 Years | 54 (33.3%) | 108 (66.7%) |
| 65 to 74 Years | 126 (76.4%) | 121 (73.3%) |
| 75 Years and over | 34 (100.0%) | 12 (35.3%) |
| Total | 523 (42.5%) | 772 (62.8%) |
Disability Status by Sex by Age in Ventress
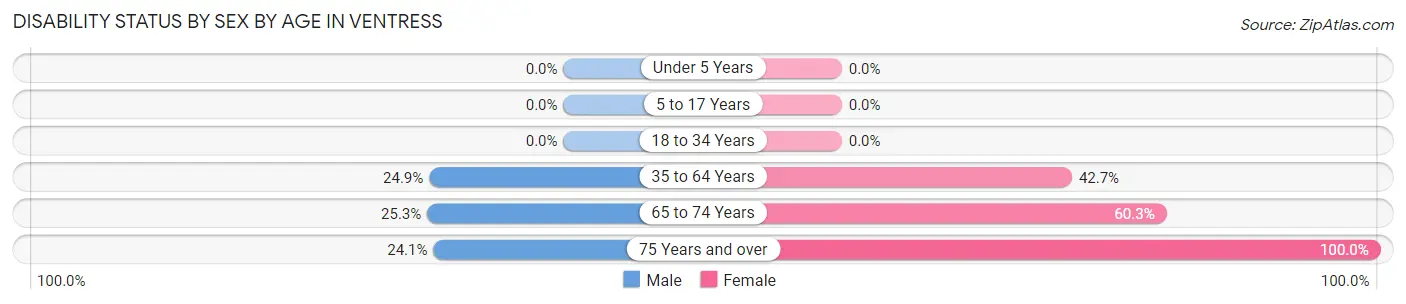
| Age Bracket | Male | Female |
| Under 5 Years | 0 (0.0%) | 0 (0.0%) |
| 5 to 17 Years | 0 (0.0%) | 0 (0.0%) |
| 18 to 34 Years | 0 (0.0%) | 0 (0.0%) |
| 35 to 64 Years | 78 (24.9%) | 179 (42.7%) |
| 65 to 74 Years | 22 (25.3%) | 47 (60.3%) |
| 75 Years and over | 7 (24.1%) | 5 (100.0%) |
Disability Class by Sex by Age in Ventress
Disability Class: Hearing Difficulty
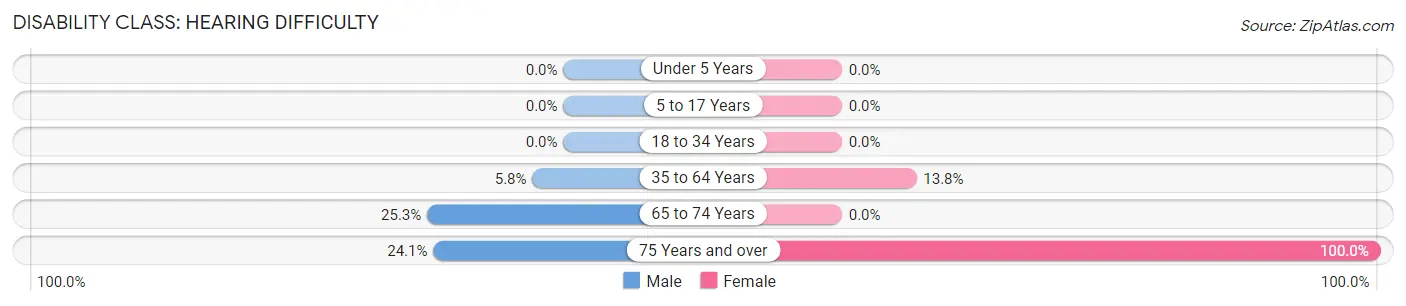
| Age Bracket | Male | Female |
| Under 5 Years | 0 (0.0%) | 0 (0.0%) |
| 5 to 17 Years | 0 (0.0%) | 0 (0.0%) |
| 18 to 34 Years | 0 (0.0%) | 0 (0.0%) |
| 35 to 64 Years | 18 (5.8%) | 58 (13.8%) |
| 65 to 74 Years | 22 (25.3%) | 0 (0.0%) |
| 75 Years and over | 7 (24.1%) | 5 (100.0%) |
Disability Class: Vision Difficulty
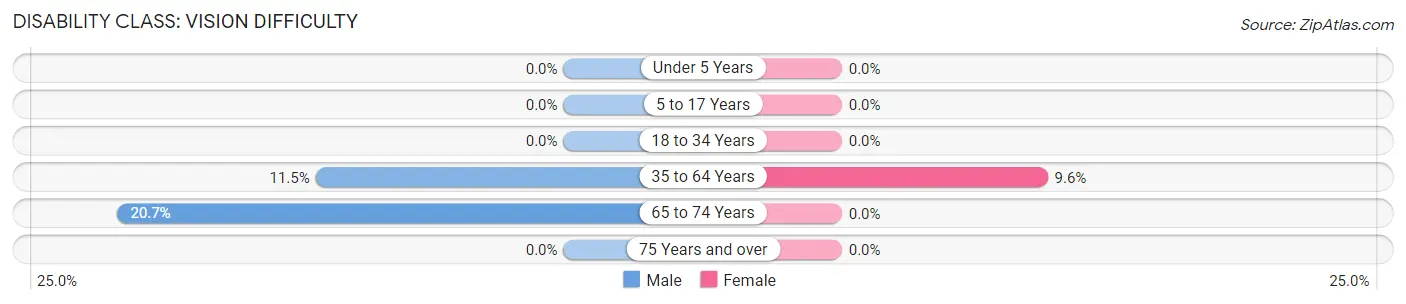
| Age Bracket | Male | Female |
| Under 5 Years | 0 (0.0%) | 0 (0.0%) |
| 5 to 17 Years | 0 (0.0%) | 0 (0.0%) |
| 18 to 34 Years | 0 (0.0%) | 0 (0.0%) |
| 35 to 64 Years | 36 (11.5%) | 40 (9.6%) |
| 65 to 74 Years | 18 (20.7%) | 0 (0.0%) |
| 75 Years and over | 0 (0.0%) | 0 (0.0%) |
Disability Class: Cognitive Difficulty
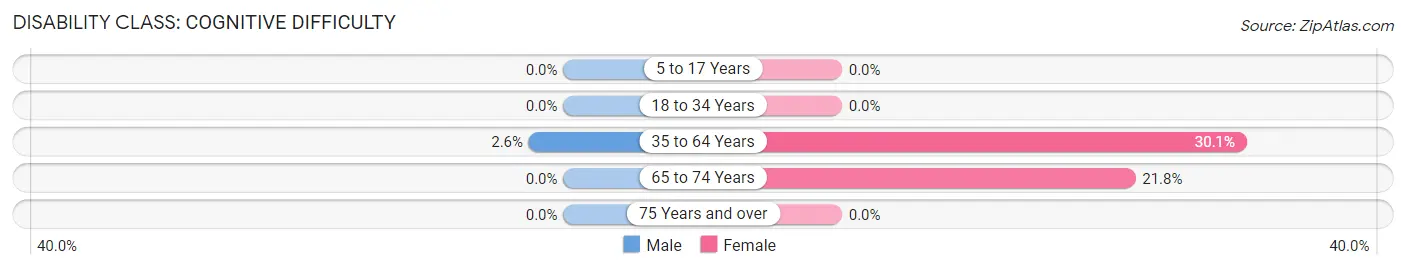
| Age Bracket | Male | Female |
| 5 to 17 Years | 0 (0.0%) | 0 (0.0%) |
| 18 to 34 Years | 0 (0.0%) | 0 (0.0%) |
| 35 to 64 Years | 8 (2.6%) | 126 (30.1%) |
| 65 to 74 Years | 0 (0.0%) | 17 (21.8%) |
| 75 Years and over | 0 (0.0%) | 0 (0.0%) |
Disability Class: Ambulatory Difficulty
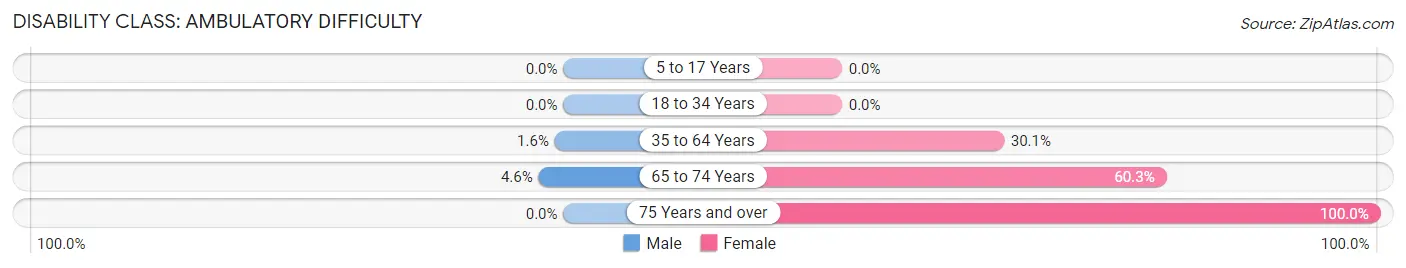
| Age Bracket | Male | Female |
| 5 to 17 Years | 0 (0.0%) | 0 (0.0%) |
| 18 to 34 Years | 0 (0.0%) | 0 (0.0%) |
| 35 to 64 Years | 5 (1.6%) | 126 (30.1%) |
| 65 to 74 Years | 4 (4.6%) | 47 (60.3%) |
| 75 Years and over | 0 (0.0%) | 5 (100.0%) |
Disability Class: Self-Care Difficulty
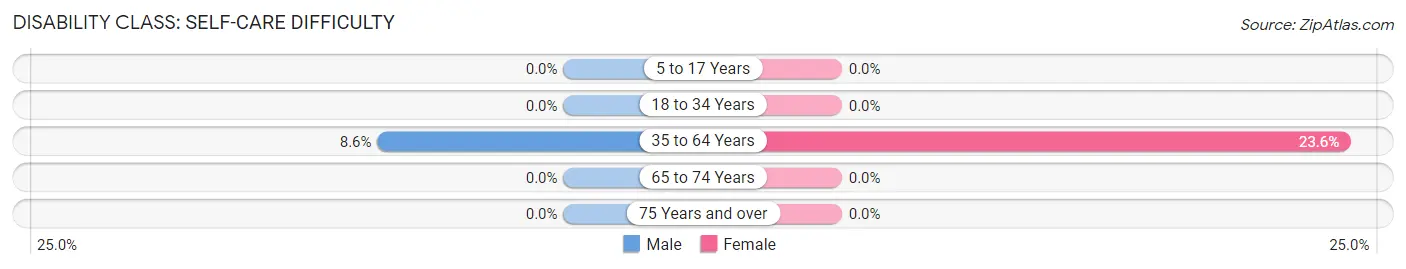
| Age Bracket | Male | Female |
| 5 to 17 Years | 0 (0.0%) | 0 (0.0%) |
| 18 to 34 Years | 0 (0.0%) | 0 (0.0%) |
| 35 to 64 Years | 27 (8.6%) | 99 (23.6%) |
| 65 to 74 Years | 0 (0.0%) | 0 (0.0%) |
| 75 Years and over | 0 (0.0%) | 0 (0.0%) |
Technology Access in Ventress
Computing Device Access in Ventress
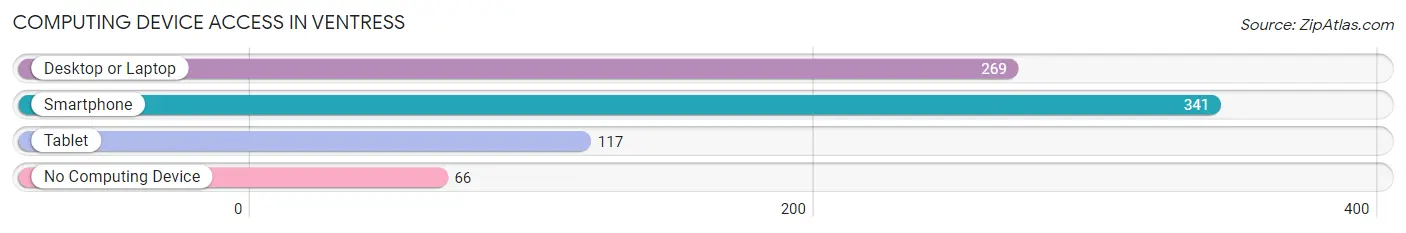
| Device Type | # Households | % Households |
| Desktop or Laptop | 269 | 65.3% |
| Smartphone | 341 | 82.8% |
| Tablet | 117 | 28.4% |
| No Computing Device | 66 | 16.0% |
| Total | 412 | 100.0% |
Internet Access in Ventress
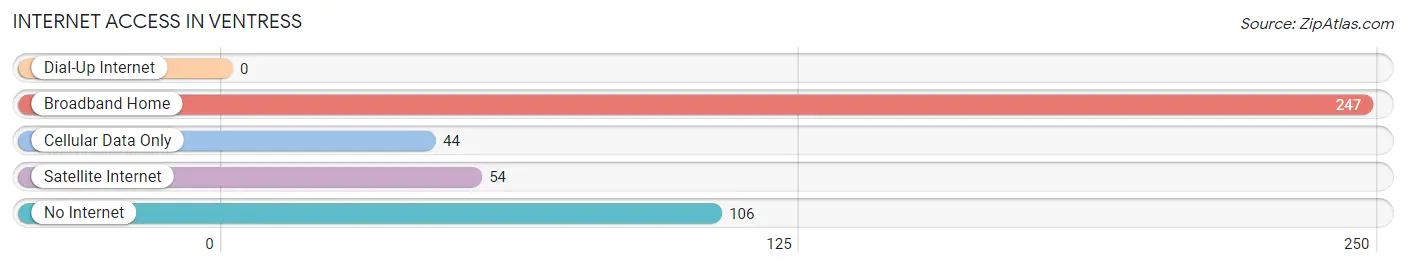
| Internet Type | # Households | % Households |
| Dial-Up Internet | 0 | 0.0% |
| Broadband Home | 247 | 60.0% |
| Cellular Data Only | 44 | 10.7% |
| Satellite Internet | 54 | 13.1% |
| No Internet | 106 | 25.7% |
| Total | 412 | 100.0% |
Ventress Summary
Ventress is a small unincorporated community located in Pointe Coupee Parish, Louisiana. It is situated on the west bank of the Mississippi River, approximately 25 miles northwest of Baton Rouge. The population of Ventress was estimated to be around 1,000 in 2000.
Geography
Ventress is located in the southeastern part of Pointe Coupee Parish, Louisiana. It is situated on the west bank of the Mississippi River, approximately 25 miles northwest of Baton Rouge. The terrain is mostly flat, with some rolling hills in the area. The climate is humid subtropical, with hot summers and mild winters. The average annual precipitation is around 50 inches.
History
Ventress was founded in the early 1800s by French settlers. The town was named after a local family, the Ventresses. The town was a major port for the cotton trade in the 19th century. During the Civil War, the town was occupied by Union forces. After the war, the town experienced a period of growth and prosperity.
In the early 20th century, the town was home to a large number of Italian immigrants. The town was also home to a large number of African-American residents. In the 1950s, the town experienced a period of decline, as many of its residents moved away in search of better economic opportunities.
Economy
The economy of Ventress is largely based on agriculture. The town is home to several farms, which produce a variety of crops, including cotton, corn, soybeans, and rice. The town is also home to a number of small businesses, including restaurants, convenience stores, and auto repair shops.
Demographics
As of the 2000 census, the population of Ventress was estimated to be around 1,000. The racial makeup of the town was 79.2% White, 19.2% African American, 0.2% Native American, 0.2% Asian, and 1.2% from other races. The median household income was $25,000, and the median family income was $30,000.
Conclusion
Ventress is a small unincorporated community located in Pointe Coupee Parish, Louisiana. It is situated on the west bank of the Mississippi River, approximately 25 miles northwest of Baton Rouge. The population of Ventress was estimated to be around 1,000 in 2000. The economy of Ventress is largely based on agriculture, and the town is home to a number of small businesses. The racial makeup of the town was 79.2% White, 19.2% African American, 0.2% Native American, 0.2% Asian, and 1.2% from other races. The median household income was $25,000, and the median family income was $30,000.
Common Questions
What is Per Capita Income in Ventress?
Per Capita income in Ventress is $34,793.
What is the Median Family Income in Ventress?
Median Family Income in Ventress is $98,750.
What is the Median Household income in Ventress?
Median Household Income in Ventress is $75,500.
What is Inequality or Gini Index in Ventress?
Inequality or Gini Index in Ventress is 0.41.
What is the Total Population of Ventress?
Total Population of Ventress is 1,230.
What is the Total Male Population of Ventress?
Total Male Population of Ventress is 541.
What is the Total Female Population of Ventress?
Total Female Population of Ventress is 689.
What is the Ratio of Males per 100 Females in Ventress?
There are 78.52 Males per 100 Females in Ventress.
What is the Ratio of Females per 100 Males in Ventress?
There are 127.36 Females per 100 Males in Ventress.
What is the Median Population Age in Ventress?
Median Population Age in Ventress is 50.3 Years.
What is the Average Family Size in Ventress
Average Family Size in Ventress is 3.4 People.
What is the Average Household Size in Ventress
Average Household Size in Ventress is 3.0 People.
How Large is the Labor Force in Ventress?
There are 487 People in the Labor Forcein in Ventress.
What is the Percentage of People in the Labor Force in Ventress?
43.9% of People are in the Labor Force in Ventress.