Venice, LA Map & Demographics
Venice Map
Venice Overview
$20,147
PER CAPITA INCOME
$50,938
AVG HOUSEHOLD INCOME
0.29
INEQUALITY / GINI INDEX
194
TOTAL POPULATION
92
MALE POPULATION
102
FEMALE POPULATION
90.20
MALES / 100 FEMALES
110.87
FEMALES / 100 MALES
32.5
MEDIAN AGE
4.4
AVG FAMILY SIZE
3.5
AVG HOUSEHOLD SIZE
84
LABOR FORCE [ PEOPLE ]
65.1%
PERCENT IN LABOR FORCE
26.2%
UNEMPLOYMENT RATE
Venice Zip Codes
Venice Area Codes
Income in Venice
Income Overview in Venice
| Characteristic | Number | Measure |
| Per Capita Income | 194 | $20,147 |
| Median Family Income | 36 | $0 |
| Mean Family Income | 36 | $51,653 |
| Median Household Income | 55 | $50,938 |
| Mean Household Income | 55 | $49,869 |
| Income Deficit | 36 | $0 |
| Wage / Income Gap (%) | 194 | 0.00% |
| Wage / Income Gap ($) | 194 | 100.00¢ per $1 |
| Gini / Inequality Index | 194 | 0.29 |
Earnings by Sex in Venice
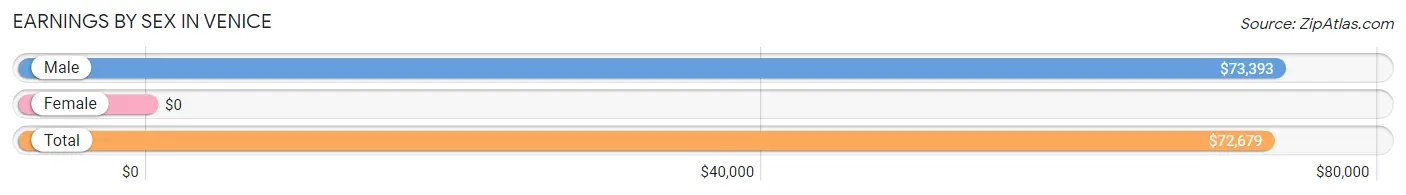
| Sex | Number | Average Earnings |
| Male | 48 (75.0%) | $73,393 |
| Female | 16 (25.0%) | $0 |
| Total | 64 (100.0%) | $72,679 |
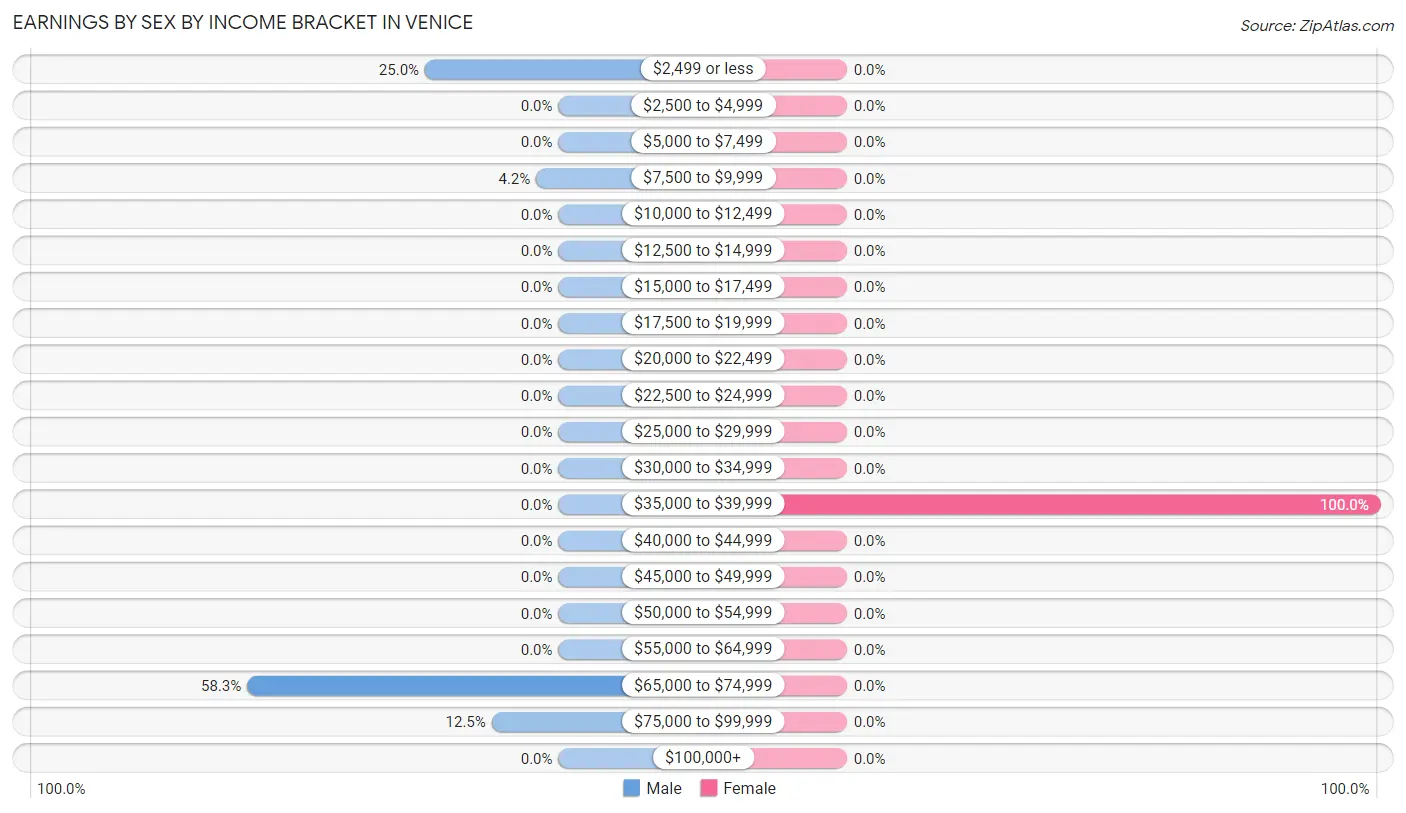
Earnings by Sex by Income Bracket in Venice
The most common earnings brackets in Venice are $65,000 to $74,999 for men (28 | 58.3%) and $35,000 to $39,999 for women (16 | 100.0%).
| Income | Male | Female |
| $2,499 or less | 12 (25.0%) | 0 (0.0%) |
| $2,500 to $4,999 | 0 (0.0%) | 0 (0.0%) |
| $5,000 to $7,499 | 0 (0.0%) | 0 (0.0%) |
| $7,500 to $9,999 | 2 (4.2%) | 0 (0.0%) |
| $10,000 to $12,499 | 0 (0.0%) | 0 (0.0%) |
| $12,500 to $14,999 | 0 (0.0%) | 0 (0.0%) |
| $15,000 to $17,499 | 0 (0.0%) | 0 (0.0%) |
| $17,500 to $19,999 | 0 (0.0%) | 0 (0.0%) |
| $20,000 to $22,499 | 0 (0.0%) | 0 (0.0%) |
| $22,500 to $24,999 | 0 (0.0%) | 0 (0.0%) |
| $25,000 to $29,999 | 0 (0.0%) | 0 (0.0%) |
| $30,000 to $34,999 | 0 (0.0%) | 0 (0.0%) |
| $35,000 to $39,999 | 0 (0.0%) | 16 (100.0%) |
| $40,000 to $44,999 | 0 (0.0%) | 0 (0.0%) |
| $45,000 to $49,999 | 0 (0.0%) | 0 (0.0%) |
| $50,000 to $54,999 | 0 (0.0%) | 0 (0.0%) |
| $55,000 to $64,999 | 0 (0.0%) | 0 (0.0%) |
| $65,000 to $74,999 | 28 (58.3%) | 0 (0.0%) |
| $75,000 to $99,999 | 6 (12.5%) | 0 (0.0%) |
| $100,000+ | 0 (0.0%) | 0 (0.0%) |
| Total | 48 (100.0%) | 16 (100.0%) |
Earnings by Sex by Educational Attainment in Venice
| Educational Attainment | Male Income | Female Income |
| Less than High School | - | - |
| High School Diploma | - | - |
| College or Associate's Degree | - | - |
| Bachelor's Degree | - | - |
| Graduate Degree | - | - |
| Total | $73,393 | $0 |
Family Income in Venice
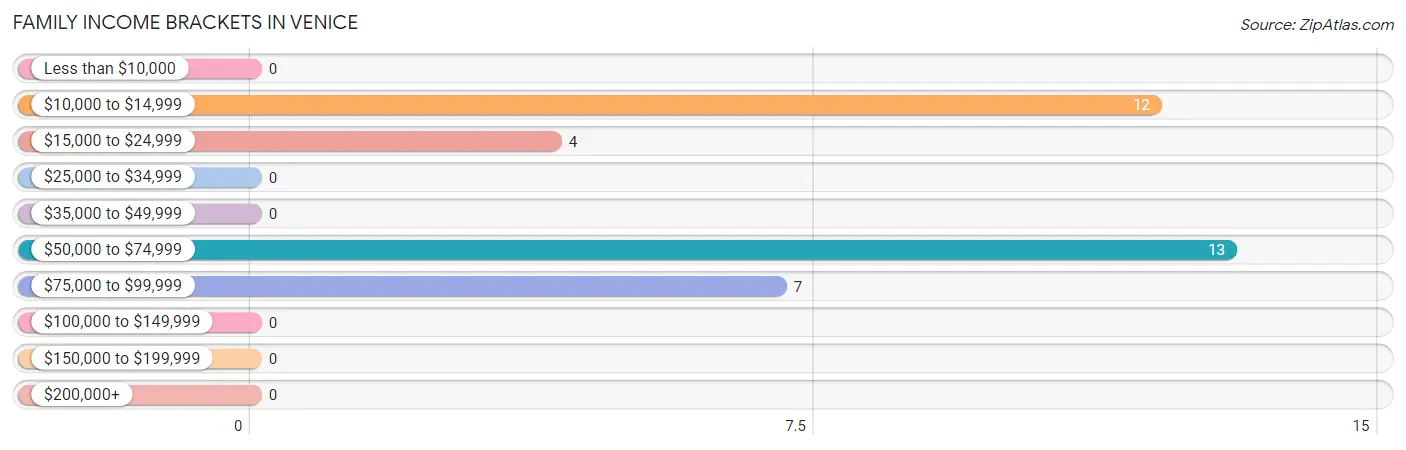
Family Income Brackets in Venice
According to the Venice family income data, there are 13 families falling into the $50,000 to $74,999 income range, which is the most common income bracket and makes up 36.1% of all families.
| Income Bracket | # Families | % Families |
| Less than $10,000 | 0 | 0.0% |
| $10,000 to $14,999 | 12 | 33.3% |
| $15,000 to $24,999 | 4 | 11.1% |
| $25,000 to $34,999 | 0 | 0.0% |
| $35,000 to $49,999 | 0 | 0.0% |
| $50,000 to $74,999 | 13 | 36.1% |
| $75,000 to $99,999 | 7 | 19.4% |
| $100,000 to $149,999 | 0 | 0.0% |
| $150,000 to $199,999 | 0 | 0.0% |
| $200,000+ | 0 | 0.0% |
Family Income by Famaliy Size in Venice
| Income Bracket | # Families | Median Income |
| 2-Person Families | 4 (11.1%) | $0 |
| 3-Person Families | 12 (33.3%) | $0 |
| 4-Person Families | 20 (55.6%) | $0 |
| 5-Person Families | 0 (0.0%) | $0 |
| 6-Person Families | 0 (0.0%) | $0 |
| 7+ Person Families | 0 (0.0%) | $0 |
| Total | 36 (100.0%) | $0 |
Family Income by Number of Earners in Venice
| Number of Earners | # Families | Median Income |
| No Earners | 0 (0.0%) | $0 |
| 1 Earner | 36 (100.0%) | $0 |
| 2 Earners | 0 (0.0%) | $0 |
| 3+ Earners | 0 (0.0%) | $0 |
| Total | 36 (100.0%) | $0 |
Household Income in Venice
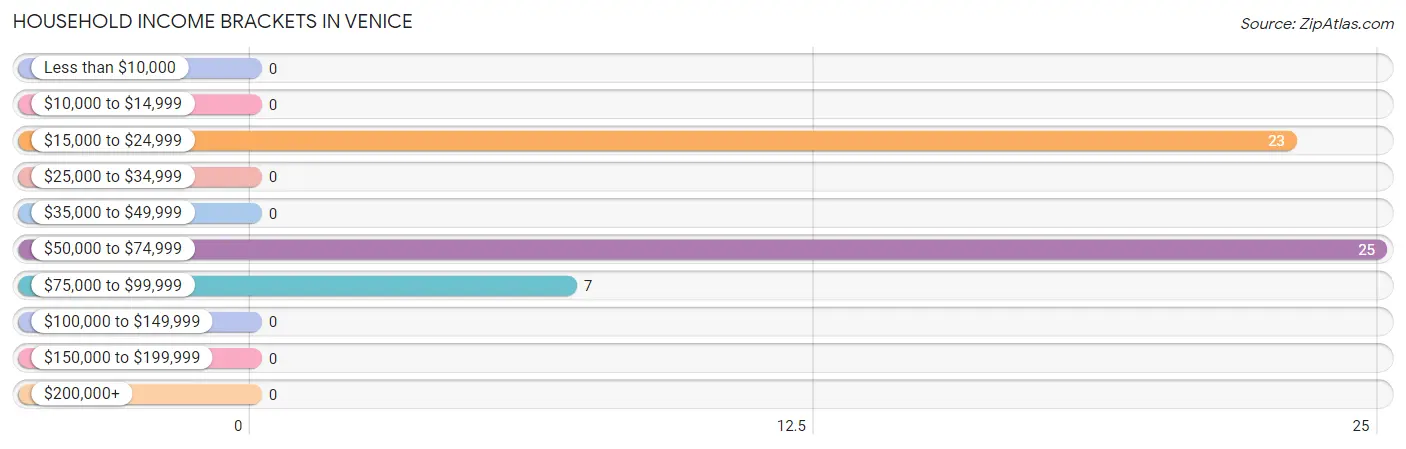
Household Income Brackets in Venice
With 25 households falling in the category, the $50,000 to $74,999 income range is the most frequent in Venice, accounting for 45.5% of all households.
| Income Bracket | # Households | % Households |
| Less than $10,000 | 0 | 0.0% |
| $10,000 to $14,999 | 0 | 0.0% |
| $15,000 to $24,999 | 23 | 41.8% |
| $25,000 to $34,999 | 0 | 0.0% |
| $35,000 to $49,999 | 0 | 0.0% |
| $50,000 to $74,999 | 25 | 45.5% |
| $75,000 to $99,999 | 7 | 12.7% |
| $100,000 to $149,999 | 0 | 0.0% |
| $150,000 to $199,999 | 0 | 0.0% |
| $200,000+ | 0 | 0.0% |
Household Income by Householder Age in Venice
| Income Bracket | # Households | Median Income |
| 15 to 24 Years | 0 (0.0%) | $0 |
| 25 to 44 Years | 20 (36.4%) | $0 |
| 45 to 64 Years | 0 (0.0%) | $0 |
| 65+ Years | 35 (63.6%) | $0 |
| Total | 55 (100.0%) | $50,938 |
Poverty in Venice
Income Below Poverty by Sex and Age in Venice
With 13.0% poverty level for males and 33.3% for females among the residents of Venice, 65 to 74 year old males and 25 to 34 year old females are the most vulnerable to poverty, with 12 males (38.7%) and 22 females (52.4%) in their respective age groups living below the poverty level.
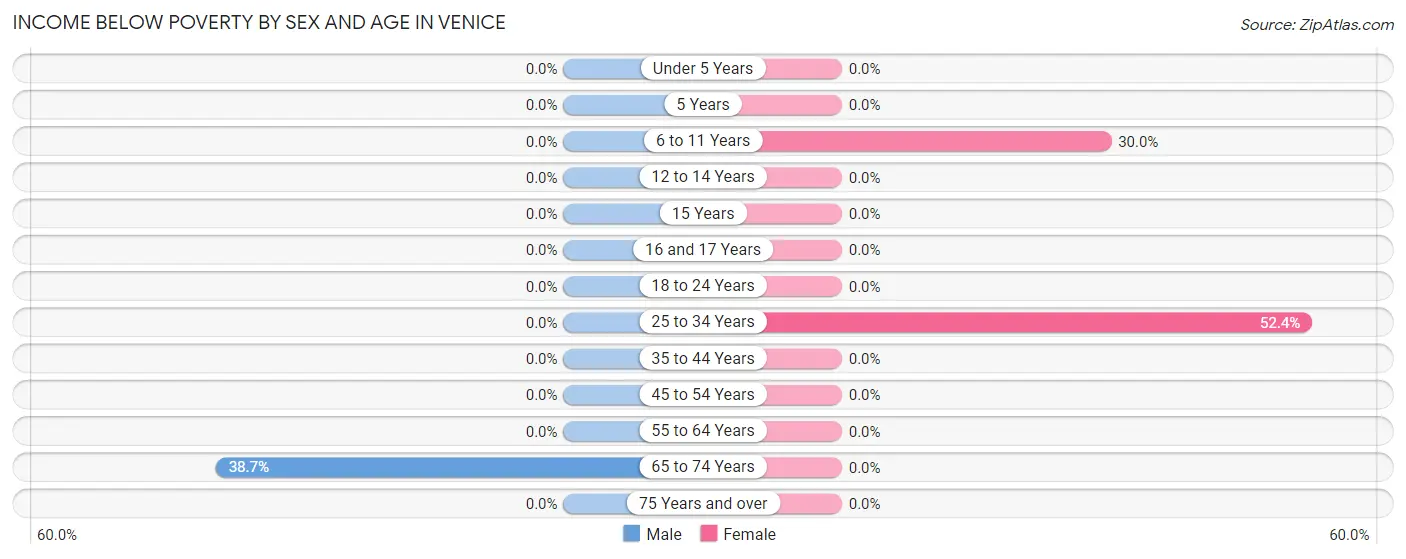
| Age Bracket | Male | Female |
| Under 5 Years | 0 (0.0%) | 0 (0.0%) |
| 5 Years | 0 (0.0%) | 0 (0.0%) |
| 6 to 11 Years | 0 (0.0%) | 12 (30.0%) |
| 12 to 14 Years | 0 (0.0%) | 0 (0.0%) |
| 15 Years | 0 (0.0%) | 0 (0.0%) |
| 16 and 17 Years | 0 (0.0%) | 0 (0.0%) |
| 18 to 24 Years | 0 (0.0%) | 0 (0.0%) |
| 25 to 34 Years | 0 (0.0%) | 22 (52.4%) |
| 35 to 44 Years | 0 (0.0%) | 0 (0.0%) |
| 45 to 54 Years | 0 (0.0%) | 0 (0.0%) |
| 55 to 64 Years | 0 (0.0%) | 0 (0.0%) |
| 65 to 74 Years | 12 (38.7%) | 0 (0.0%) |
| 75 Years and over | 0 (0.0%) | 0 (0.0%) |
| Total | 12 (13.0%) | 34 (33.3%) |
Income Above Poverty by Sex and Age in Venice
According to the poverty statistics in Venice, males aged under 5 years and females aged 45 to 54 years are the age groups that are most secure financially, with 100.0% of males and 100.0% of females in these age groups living above the poverty line.
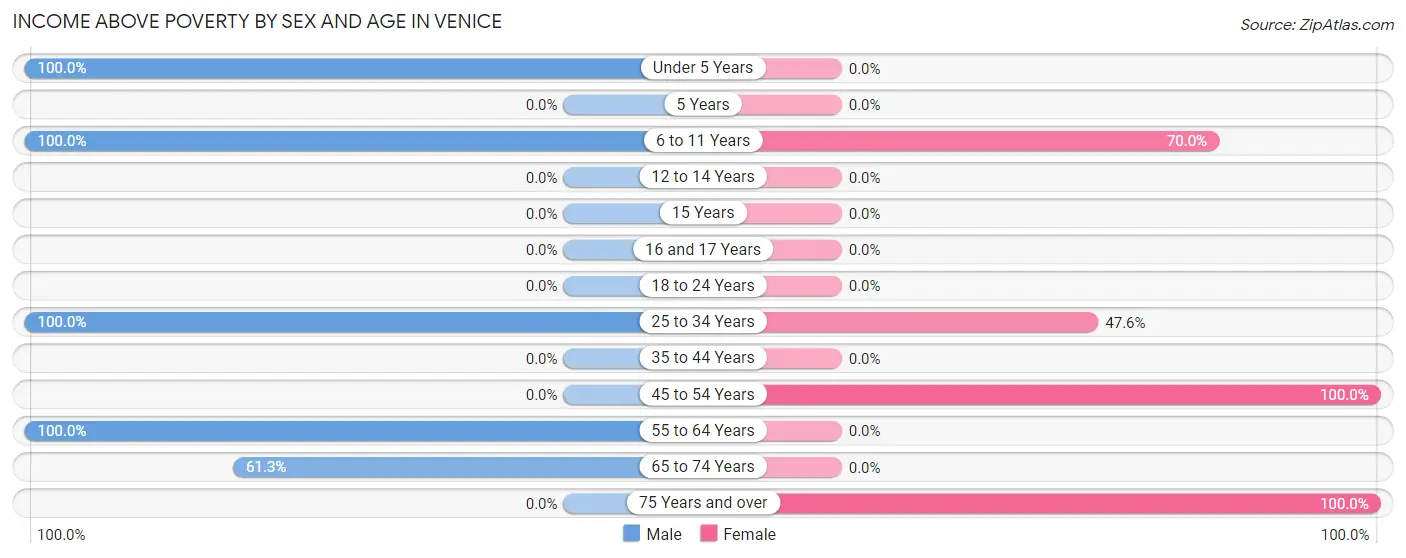
| Age Bracket | Male | Female |
| Under 5 Years | 20 (100.0%) | 0 (0.0%) |
| 5 Years | 0 (0.0%) | 0 (0.0%) |
| 6 to 11 Years | 5 (100.0%) | 28 (70.0%) |
| 12 to 14 Years | 0 (0.0%) | 0 (0.0%) |
| 15 Years | 0 (0.0%) | 0 (0.0%) |
| 16 and 17 Years | 0 (0.0%) | 0 (0.0%) |
| 18 to 24 Years | 0 (0.0%) | 0 (0.0%) |
| 25 to 34 Years | 34 (100.0%) | 20 (47.6%) |
| 35 to 44 Years | 0 (0.0%) | 0 (0.0%) |
| 45 to 54 Years | 0 (0.0%) | 16 (100.0%) |
| 55 to 64 Years | 2 (100.0%) | 0 (0.0%) |
| 65 to 74 Years | 19 (61.3%) | 0 (0.0%) |
| 75 Years and over | 0 (0.0%) | 4 (100.0%) |
| Total | 80 (87.0%) | 68 (66.7%) |
Income Below Poverty Among Married-Couple Families in Venice
| Children | Above Poverty | Below Poverty |
| No Children | 0 (0.0%) | 0 (0.0%) |
| 1 or 2 Children | 20 (100.0%) | 0 (0.0%) |
| 3 or 4 Children | 0 (0.0%) | 0 (0.0%) |
| 5 or more Children | 0 (0.0%) | 0 (0.0%) |
| Total | 20 (100.0%) | 0 (0.0%) |
Income Below Poverty Among Single-Parent Households in Venice
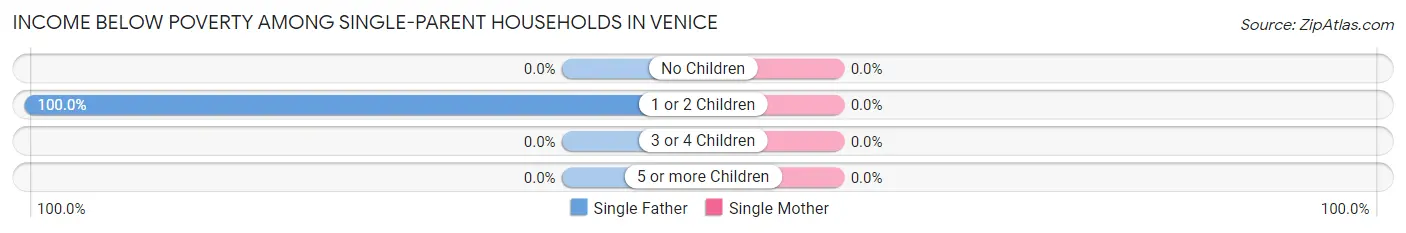
| Children | Single Father | Single Mother |
| No Children | 0 (0.0%) | 0 (0.0%) |
| 1 or 2 Children | 12 (100.0%) | 0 (0.0%) |
| 3 or 4 Children | 0 (0.0%) | 0 (0.0%) |
| 5 or more Children | 0 (0.0%) | 0 (0.0%) |
| Total | 12 (100.0%) | 0 (0.0%) |
Income Below Poverty Among Married-Couple vs Single-Parent Households in Venice
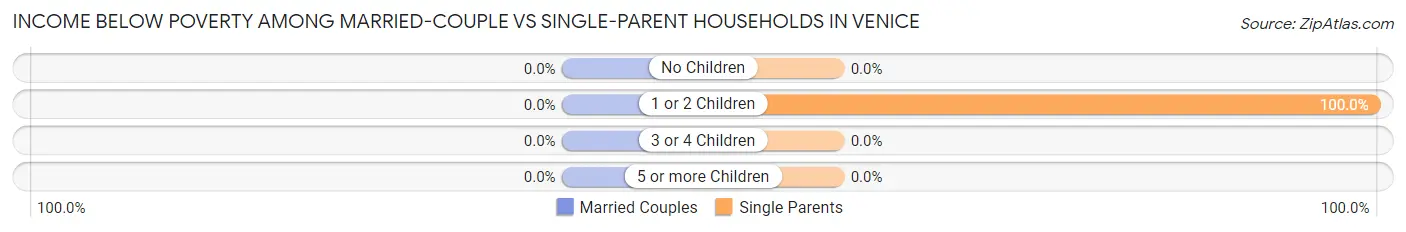
| Children | Married-Couple Families | Single-Parent Households |
| No Children | 0 (0.0%) | 0 (0.0%) |
| 1 or 2 Children | 0 (0.0%) | 12 (100.0%) |
| 3 or 4 Children | 0 (0.0%) | 0 (0.0%) |
| 5 or more Children | 0 (0.0%) | 0 (0.0%) |
| Total | 0 (0.0%) | 12 (75.0%) |
Race in Venice
The most populous races in Venice are White / Caucasian (167 | 86.1%), Hispanic or Latino (59 | 30.4%), and Two or more Races (14 | 7.2%).
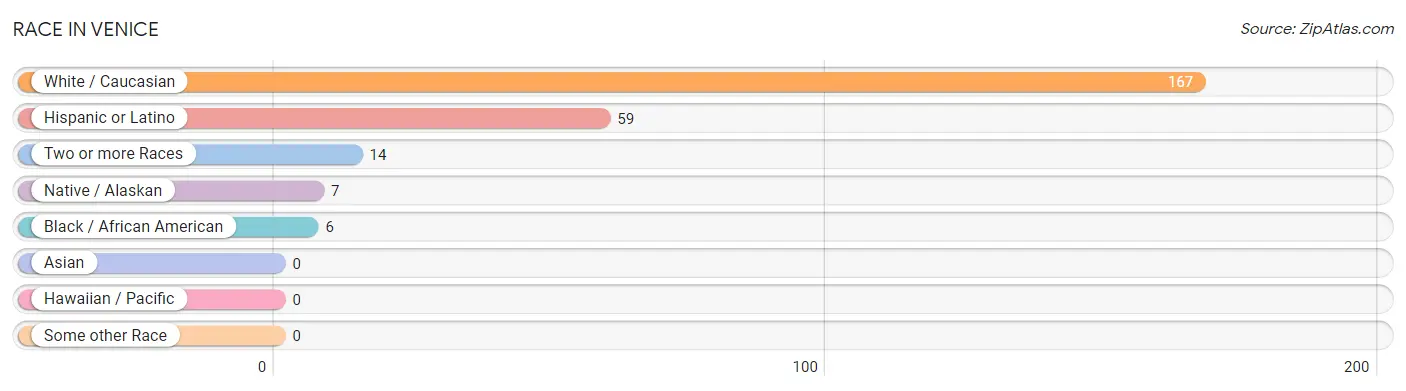
| Race | # Population | % Population |
| Asian | 0 | 0.0% |
| Black / African American | 6 | 3.1% |
| Hawaiian / Pacific | 0 | 0.0% |
| Hispanic or Latino | 59 | 30.4% |
| Native / Alaskan | 7 | 3.6% |
| White / Caucasian | 167 | 86.1% |
| Two or more Races | 14 | 7.2% |
| Some other Race | 0 | 0.0% |
| Total | 194 | 100.0% |
Ancestry in Venice
The most populous ancestries reported in Venice are French (80 | 41.2%), English (67 | 34.5%), Mexican (52 | 26.8%), Houma (21 | 10.8%), and American (18 | 9.3%), together accounting for 122.7% of all Venice residents.
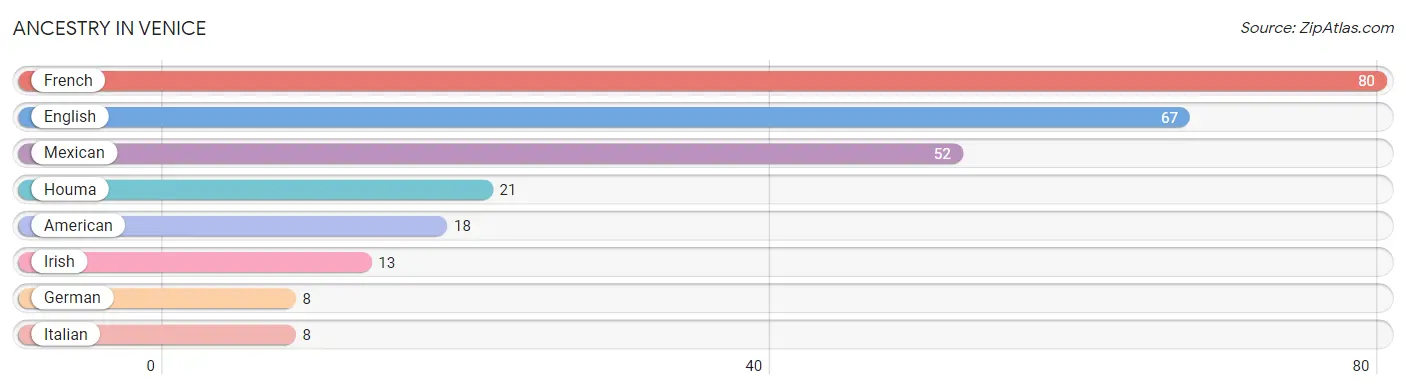
| Ancestry | # Population | % Population |
| American | 18 | 9.3% |
| English | 67 | 34.5% |
| French | 80 | 41.2% |
| German | 8 | 4.1% |
| Houma | 21 | 10.8% |
| Irish | 13 | 6.7% |
| Italian | 8 | 4.1% |
| Mexican | 52 | 26.8% | View All 8 Rows |
Immigrants in Venice

| Immigration Origin | # Population | % Population | View All 0 Rows |
Sex and Age in Venice
Sex and Age in Venice
The most populous age groups in Venice are 30 to 34 Years (34 | 37.0%) for men and 30 to 34 Years (42 | 41.2%) for women.

| Age Bracket | Male | Female |
| Under 5 Years | 20 (21.7%) | 0 (0.0%) |
| 5 to 9 Years | 5 (5.4%) | 28 (27.5%) |
| 10 to 14 Years | 0 (0.0%) | 12 (11.8%) |
| 15 to 19 Years | 0 (0.0%) | 0 (0.0%) |
| 20 to 24 Years | 0 (0.0%) | 0 (0.0%) |
| 25 to 29 Years | 0 (0.0%) | 0 (0.0%) |
| 30 to 34 Years | 34 (37.0%) | 42 (41.2%) |
| 35 to 39 Years | 0 (0.0%) | 0 (0.0%) |
| 40 to 44 Years | 0 (0.0%) | 0 (0.0%) |
| 45 to 49 Years | 0 (0.0%) | 0 (0.0%) |
| 50 to 54 Years | 0 (0.0%) | 16 (15.7%) |
| 55 to 59 Years | 0 (0.0%) | 0 (0.0%) |
| 60 to 64 Years | 2 (2.2%) | 0 (0.0%) |
| 65 to 69 Years | 12 (13.0%) | 0 (0.0%) |
| 70 to 74 Years | 19 (20.6%) | 0 (0.0%) |
| 75 to 79 Years | 0 (0.0%) | 0 (0.0%) |
| 80 to 84 Years | 0 (0.0%) | 4 (3.9%) |
| 85 Years and over | 0 (0.0%) | 0 (0.0%) |
| Total | 92 (100.0%) | 102 (100.0%) |
Families and Households in Venice
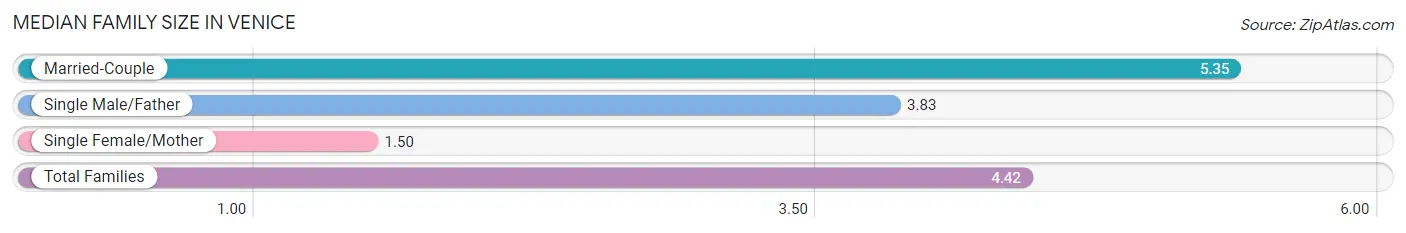
Median Family Size in Venice
The median family size in Venice is 4.42 persons per family, with married-couple families (20 | 55.6%) accounting for the largest median family size of 5.35 persons per family. On the other hand, single female/mother families (4 | 11.1%) represent the smallest median family size with 1.50 persons per family.
| Family Type | # Families | Family Size |
| Married-Couple | 20 (55.6%) | 5.35 |
| Single Male/Father | 12 (33.3%) | 3.83 |
| Single Female/Mother | 4 (11.1%) | 1.50 |
| Total Families | 36 (100.0%) | 4.42 |
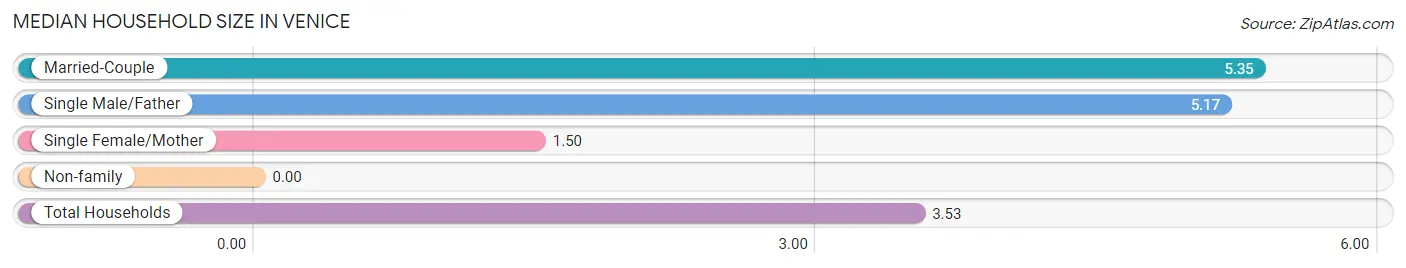
Median Household Size in Venice
| Household Type | # Households | Household Size |
| Married-Couple | 20 (36.4%) | 5.35 |
| Single Male/Father | 12 (21.8%) | 5.17 |
| Single Female/Mother | 4 (7.3%) | 1.50 |
| Non-family | 19 (34.5%) | - |
| Total Households | 55 (100.0%) | 3.53 |
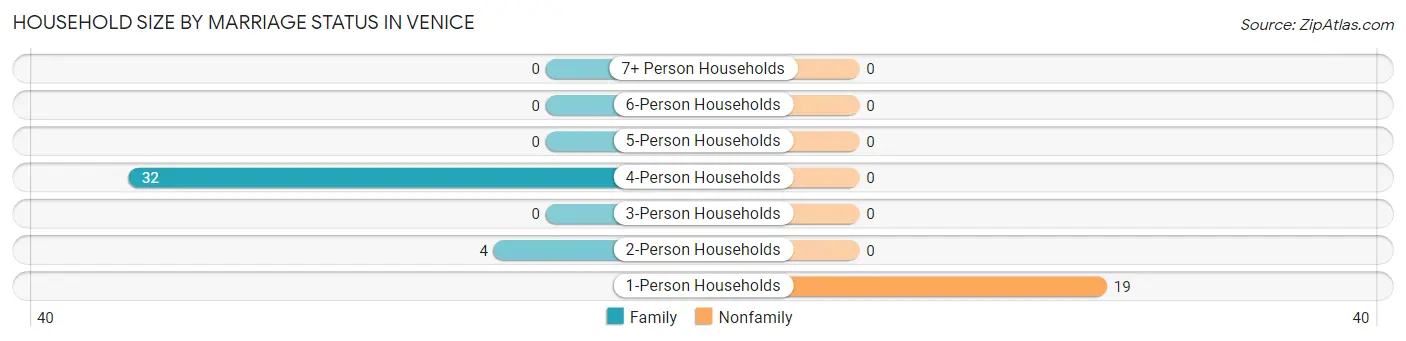
Household Size by Marriage Status in Venice
Out of a total of 55 households in Venice, 36 (65.4%) are family households, while 19 (34.5%) are nonfamily households. The most numerous type of family households are 4-person households, comprising 32, and the most common type of nonfamily households are 1-person households, comprising 19.
| Household Size | Family Households | Nonfamily Households |
| 1-Person Households | - | 19 (34.5%) |
| 2-Person Households | 4 (7.3%) | 0 (0.0%) |
| 3-Person Households | 0 (0.0%) | 0 (0.0%) |
| 4-Person Households | 32 (58.2%) | 0 (0.0%) |
| 5-Person Households | 0 (0.0%) | 0 (0.0%) |
| 6-Person Households | 0 (0.0%) | 0 (0.0%) |
| 7+ Person Households | 0 (0.0%) | 0 (0.0%) |
| Total | 36 (65.4%) | 19 (34.5%) |
Female Fertility in Venice
Fertility by Age in Venice
| Age Bracket | Women with Births | Births / 1,000 Women |
| 15 to 19 years | 0 (0.0%) | 0.0 |
| 20 to 34 years | 0 (0.0%) | 0.0 |
| 35 to 50 years | 0 (0.0%) | 0.0 |
| Total | 0 (0.0%) | 0.0 |
Fertility by Age by Marriage Status in Venice
| Age Bracket | Married | Unmarried |
| 15 to 19 years | 0 (0.0%) | 0 (0.0%) |
| 20 to 34 years | 0 (0.0%) | 0 (0.0%) |
| 35 to 50 years | 0 (0.0%) | 0 (0.0%) |
| Total | 0 (0.0%) | 0 (0.0%) |
Fertility by Education in Venice
| Educational Attainment | Women with Births | Births / 1,000 Women |
| Less than High School | 0 (0.0%) | 0.0 |
| High School Diploma | 0 (0.0%) | 0.0 |
| College or Associate's Degree | 0 (0.0%) | 0.0 |
| Bachelor's Degree | 0 (0.0%) | 0.0 |
| Graduate Degree | 0 (0.0%) | 0.0 |
| Total | 0 (0.0%) | 0.0 |
Fertility by Education by Marriage Status in Venice
| Educational Attainment | Married | Unmarried |
| Less than High School | 0 (0.0%) | 0 (0.0%) |
| High School Diploma | 0 (0.0%) | 0 (0.0%) |
| College or Associate's Degree | 0 (0.0%) | 0 (0.0%) |
| Bachelor's Degree | 0 (0.0%) | 0 (0.0%) |
| Graduate Degree | 0 (0.0%) | 0 (0.0%) |
| Total | 0 (0.0%) | 0 (0.0%) |
Employment Characteristics in Venice
Employment by Class of Employer in Venice
Among the 62 employed individuals in Venice, private company employees (44 | 71.0%), self-employed (not incorporated) (12 | 19.4%), and self-employed (incorporated) (6 | 9.7%) make up the most common classes of employment.
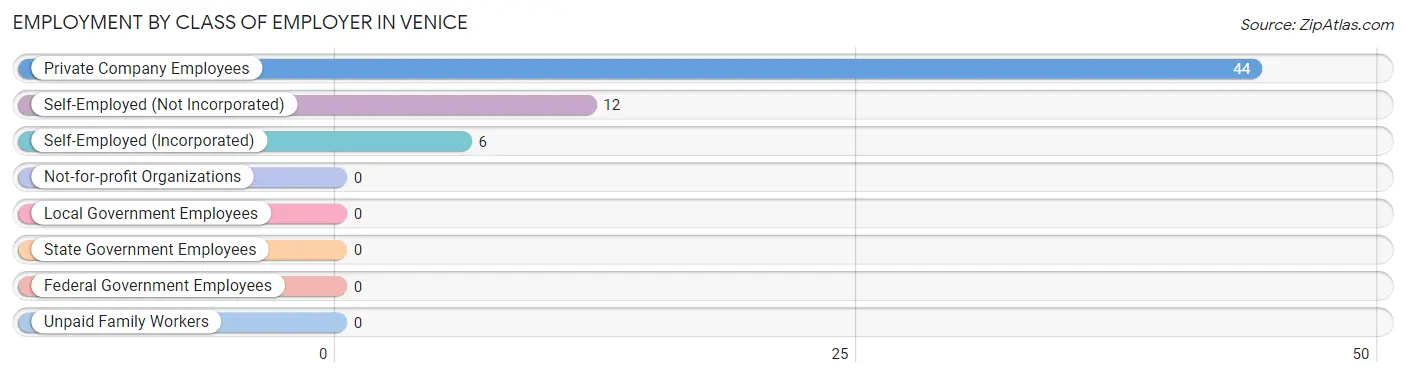
| Employer Class | # Employees | % Employees |
| Private Company Employees | 44 | 71.0% |
| Self-Employed (Incorporated) | 6 | 9.7% |
| Self-Employed (Not Incorporated) | 12 | 19.4% |
| Not-for-profit Organizations | 0 | 0.0% |
| Local Government Employees | 0 | 0.0% |
| State Government Employees | 0 | 0.0% |
| Federal Government Employees | 0 | 0.0% |
| Unpaid Family Workers | 0 | 0.0% |
| Total | 62 | 100.0% |
Employment Status by Age in Venice
According to the labor force statistics for Venice, out of the total population over 16 years of age (129), 65.1% or 84 individuals are in the labor force, with 26.2% or 22 of them unemployed. The age group with the highest labor force participation rate is 45 to 54 years, with 100.0% or 16 individuals in the labor force. Within the labor force, the 30 to 34 years age range has the highest percentage of unemployed individuals, with 39.3% or 22 of them being unemployed.
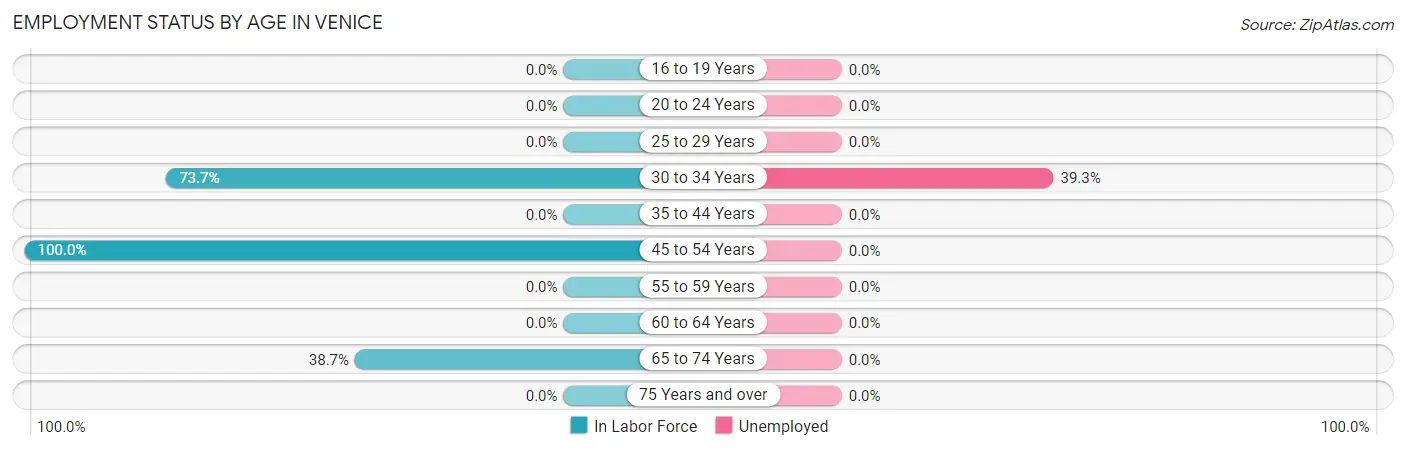
| Age Bracket | In Labor Force | Unemployed |
| 16 to 19 Years | 0 (0.0%) | 0 (0.0%) |
| 20 to 24 Years | 0 (0.0%) | 0 (0.0%) |
| 25 to 29 Years | 0 (0.0%) | 0 (0.0%) |
| 30 to 34 Years | 56 (73.7%) | 22 (39.3%) |
| 35 to 44 Years | 0 (0.0%) | 0 (0.0%) |
| 45 to 54 Years | 16 (100.0%) | 0 (0.0%) |
| 55 to 59 Years | 0 (0.0%) | 0 (0.0%) |
| 60 to 64 Years | 0 (0.0%) | 0 (0.0%) |
| 65 to 74 Years | 12 (38.7%) | 0 (0.0%) |
| 75 Years and over | 0 (0.0%) | 0 (0.0%) |
| Total | 84 (65.1%) | 22 (26.2%) |
Employment Status by Educational Attainment in Venice
According to labor force statistics for Venice, 76.6% of individuals (72) out of the total population between 25 and 64 years of age (94) are in the labor force, with 30.6% or 22 of them being unemployed. The group with the highest labor force participation rate are those with the educational attainment of college / associate degree, with 100.0% or 28 individuals in the labor force. Within the labor force, individuals with less than high school education have the highest percentage of unemployment, with 57.9% or 22 of them being unemployed.
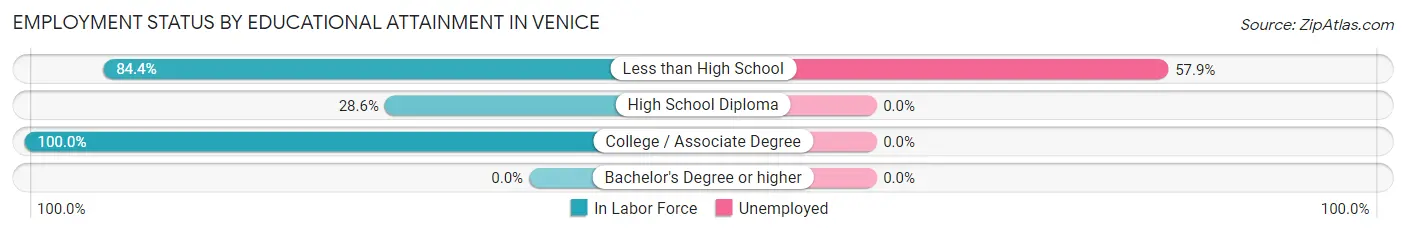
| Educational Attainment | In Labor Force | Unemployed |
| Less than High School | 38 (84.4%) | 26 (57.9%) |
| High School Diploma | 6 (28.6%) | 0 (0.0%) |
| College / Associate Degree | 28 (100.0%) | 0 (0.0%) |
| Bachelor's Degree or higher | 0 (0.0%) | 0 (0.0%) |
| Total | 72 (76.6%) | 29 (30.6%) |
Employment Occupations by Sex in Venice
Management, Business, Science and Arts Occupations
Management, Business, Science and Arts Occupations by Sex
| Occupation | Male | Female |
| Management | 0 (0.0%) | 0 (0.0%) |
| Business & Financial | 0 (0.0%) | 0 (0.0%) |
| Computers, Engineering & Science | 0 (0.0%) | 0 (0.0%) |
| Computers & Mathematics | 0 (0.0%) | 0 (0.0%) |
| Architecture & Engineering | 0 (0.0%) | 0 (0.0%) |
| Life, Physical & Social Science | 0 (0.0%) | 0 (0.0%) |
| Community & Social Service | 0 (0.0%) | 0 (0.0%) |
| Education, Arts & Media | 0 (0.0%) | 0 (0.0%) |
| Legal Services & Support | 0 (0.0%) | 0 (0.0%) |
| Education Instruction & Library | 0 (0.0%) | 0 (0.0%) |
| Arts, Media & Entertainment | 0 (0.0%) | 0 (0.0%) |
| Health Diagnosing & Treating | 0 (0.0%) | 0 (0.0%) |
| Health Technologists | 0 (0.0%) | 0 (0.0%) |
| Total (Category) | 0 (0.0%) | 0 (0.0%) |
| Total (Overall) | 46 (74.2%) | 16 (25.8%) |
Services Occupations
Services Occupations by Sex
| Occupation | Male | Female |
| Healthcare Support | 0 (0.0%) | 0 (0.0%) |
| Security & Protection | 0 (0.0%) | 0 (0.0%) |
| Firefighting & Prevention | 0 (0.0%) | 0 (0.0%) |
| Law Enforcement | 0 (0.0%) | 0 (0.0%) |
| Food Preparation & Serving | 0 (0.0%) | 0 (0.0%) |
| Cleaning & Maintenance | 0 (0.0%) | 0 (0.0%) |
| Personal Care & Service | 0 (0.0%) | 0 (0.0%) |
| Total (Category) | 0 (0.0%) | 0 (0.0%) |
| Total (Overall) | 46 (74.2%) | 16 (25.8%) |
Sales and Office Occupations
Sales and Office Occupations by Sex
| Occupation | Male | Female |
| Sales & Related | 0 (0.0%) | 0 (0.0%) |
| Office & Administration | 0 (0.0%) | 0 (0.0%) |
| Total (Category) | 0 (0.0%) | 0 (0.0%) |
| Total (Overall) | 46 (74.2%) | 16 (25.8%) |
Natural Resources, Construction and Maintenance Occupations
The most common Natural Resources, Construction and Maintenance occupations in Venice are , and Construction & Extraction (12 | 19.4%).
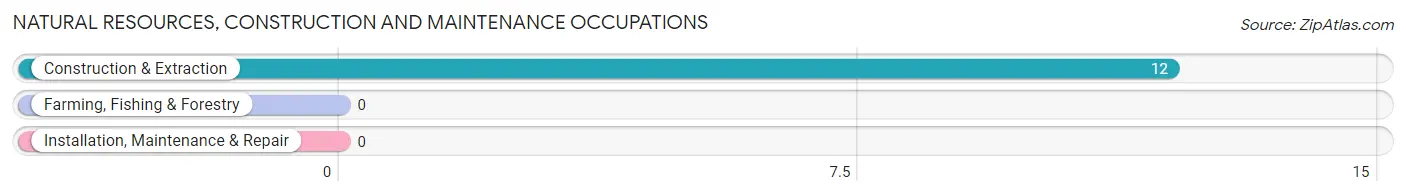
Natural Resources, Construction and Maintenance Occupations by Sex
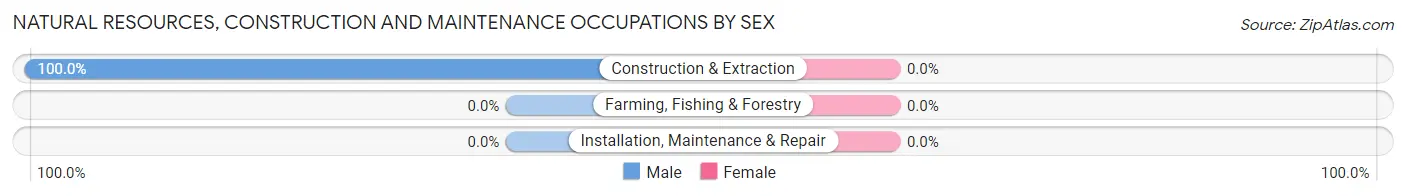
| Occupation | Male | Female |
| Farming, Fishing & Forestry | 0 (0.0%) | 0 (0.0%) |
| Construction & Extraction | 12 (100.0%) | 0 (0.0%) |
| Installation, Maintenance & Repair | 0 (0.0%) | 0 (0.0%) |
| Total (Category) | 12 (100.0%) | 0 (0.0%) |
| Total (Overall) | 46 (74.2%) | 16 (25.8%) |
Production, Transportation and Moving Occupations
The most common Production, Transportation and Moving occupations in Venice are , and Material Moving (50 | 80.6%).
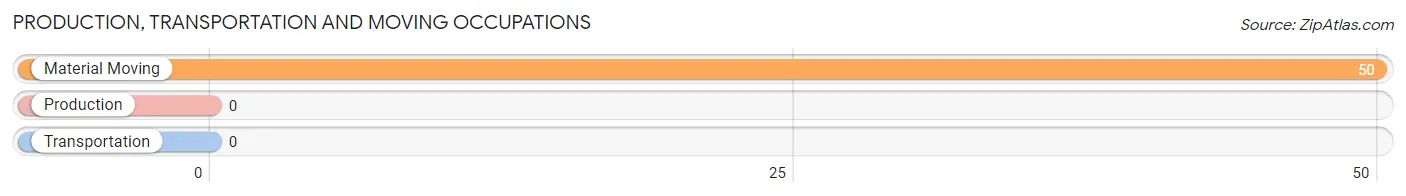
Production, Transportation and Moving Occupations by Sex
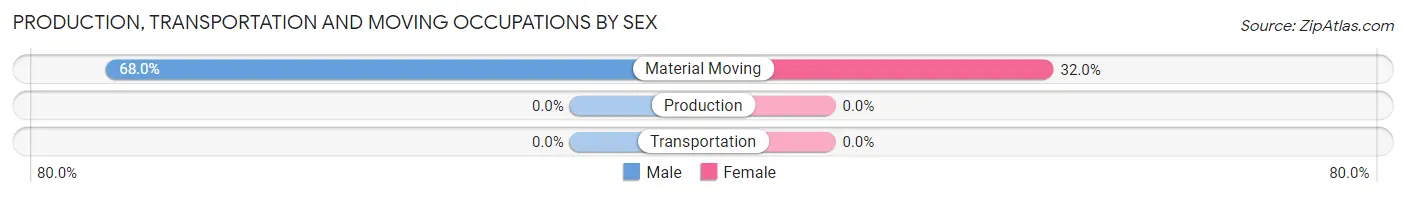
| Occupation | Male | Female |
| Production | 0 (0.0%) | 0 (0.0%) |
| Transportation | 0 (0.0%) | 0 (0.0%) |
| Material Moving | 34 (68.0%) | 16 (32.0%) |
| Total (Category) | 34 (68.0%) | 16 (32.0%) |
| Total (Overall) | 46 (74.2%) | 16 (25.8%) |
Employment Industries by Sex in Venice
Employment Industries in Venice
The major employment industries in Venice include Construction (40 | 64.5%), and Transportation & Warehousing (22 | 35.5%).
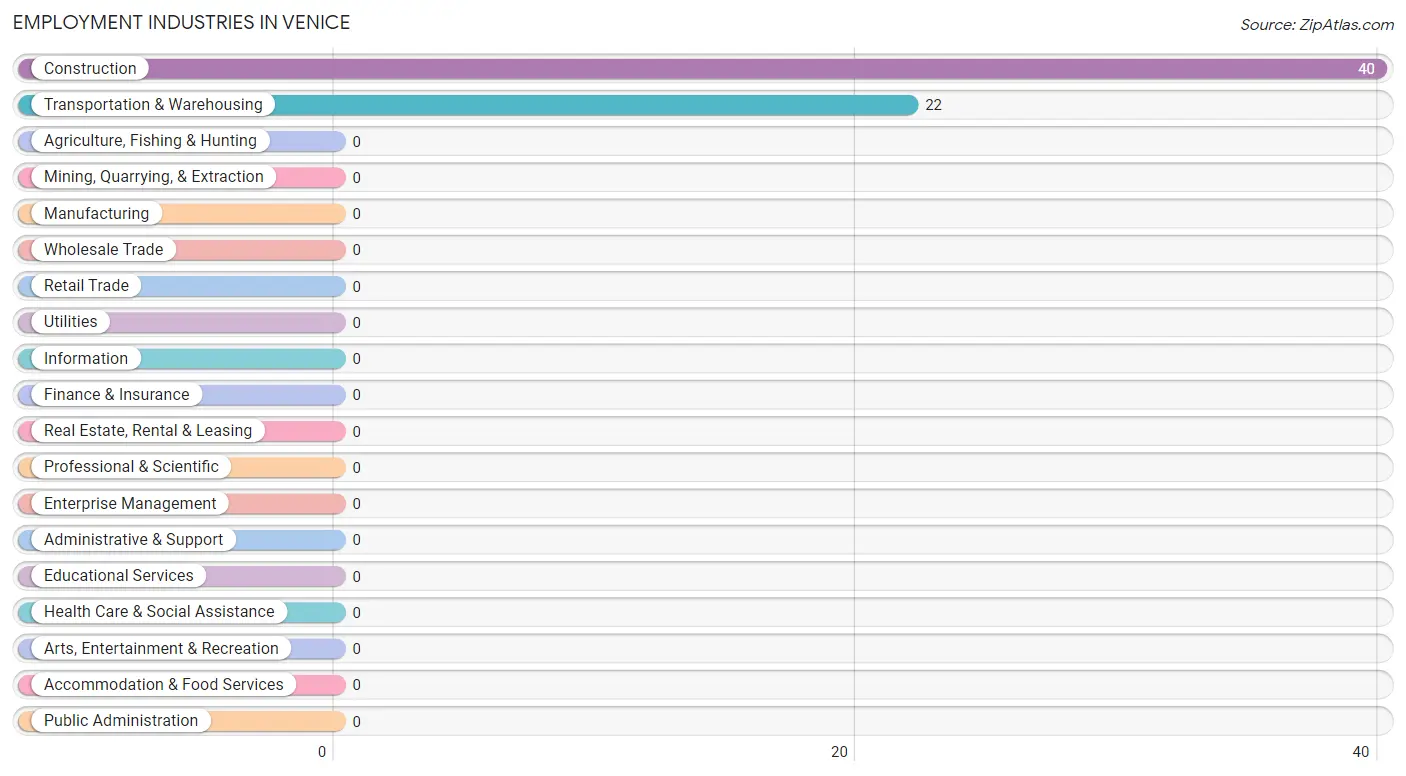
Employment Industries by Sex in Venice
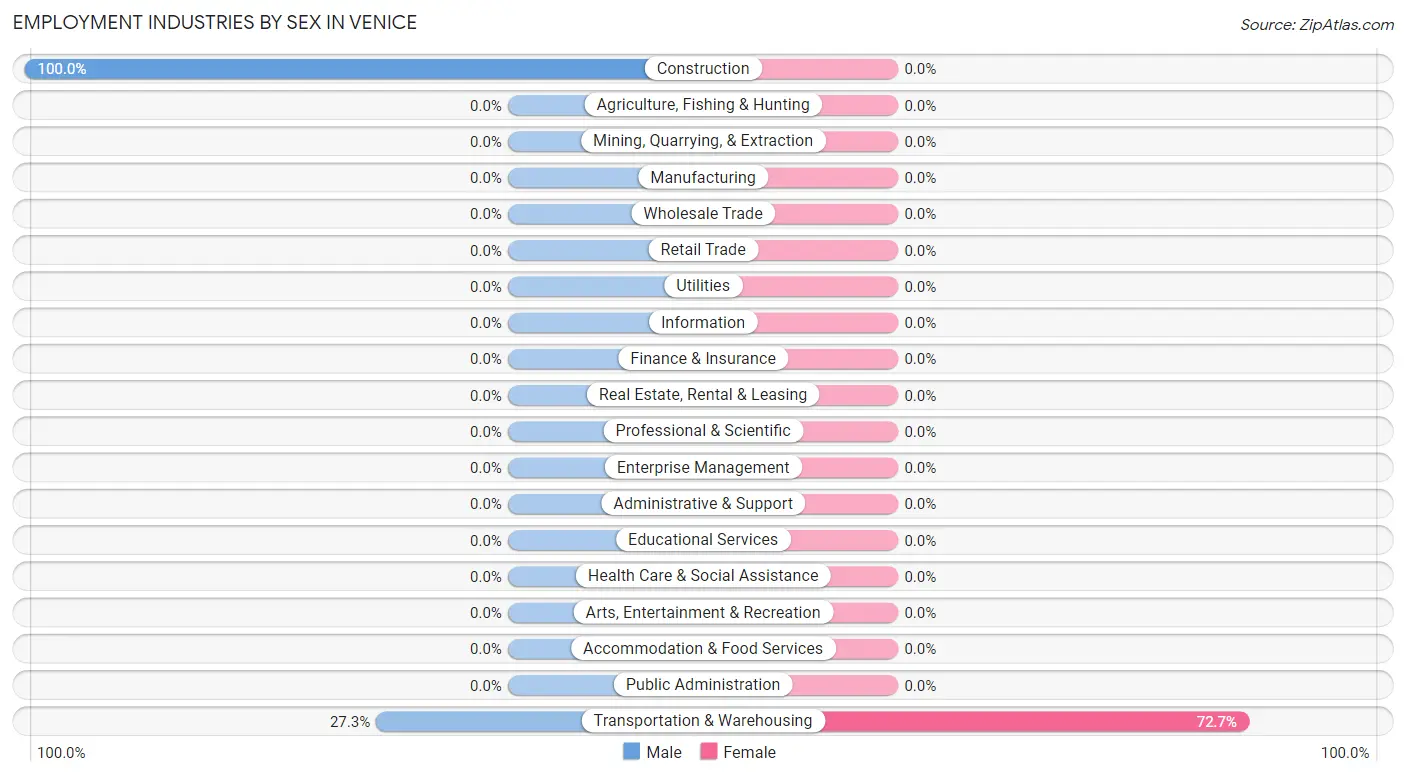
| Industry | Male | Female |
| Agriculture, Fishing & Hunting | 0 (0.0%) | 0 (0.0%) |
| Mining, Quarrying, & Extraction | 0 (0.0%) | 0 (0.0%) |
| Construction | 40 (100.0%) | 0 (0.0%) |
| Manufacturing | 0 (0.0%) | 0 (0.0%) |
| Wholesale Trade | 0 (0.0%) | 0 (0.0%) |
| Retail Trade | 0 (0.0%) | 0 (0.0%) |
| Transportation & Warehousing | 6 (27.3%) | 16 (72.7%) |
| Utilities | 0 (0.0%) | 0 (0.0%) |
| Information | 0 (0.0%) | 0 (0.0%) |
| Finance & Insurance | 0 (0.0%) | 0 (0.0%) |
| Real Estate, Rental & Leasing | 0 (0.0%) | 0 (0.0%) |
| Professional & Scientific | 0 (0.0%) | 0 (0.0%) |
| Enterprise Management | 0 (0.0%) | 0 (0.0%) |
| Administrative & Support | 0 (0.0%) | 0 (0.0%) |
| Educational Services | 0 (0.0%) | 0 (0.0%) |
| Health Care & Social Assistance | 0 (0.0%) | 0 (0.0%) |
| Arts, Entertainment & Recreation | 0 (0.0%) | 0 (0.0%) |
| Accommodation & Food Services | 0 (0.0%) | 0 (0.0%) |
| Public Administration | 0 (0.0%) | 0 (0.0%) |
| Total | 46 (74.2%) | 16 (25.8%) |
Education in Venice
School Enrollment in Venice
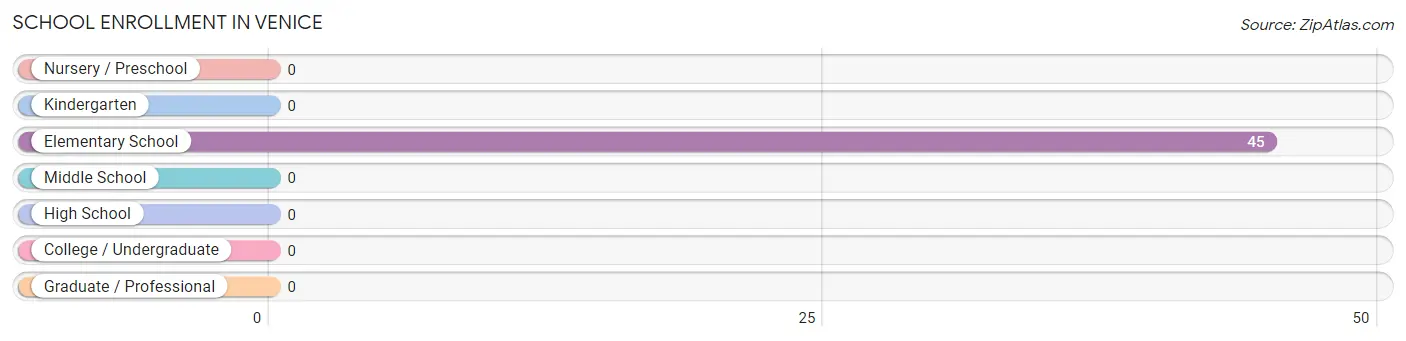
| School Level | # Students | % Students |
| Nursery / Preschool | 0 | 0.0% |
| Kindergarten | 0 | 0.0% |
| Elementary School | 45 | 100.0% |
| Middle School | 0 | 0.0% |
| High School | 0 | 0.0% |
| College / Undergraduate | 0 | 0.0% |
| Graduate / Professional | 0 | 0.0% |
| Total | 45 | 100.0% |
School Enrollment by Age by Funding Source in Venice
Out of a total of 45 students who are enrolled in schools in Venice, 5 (11.1%) attend a private institution, while the remaining 40 (88.9%) are enrolled in public schools. The age group of 5 to 9 year old has the highest likelihood of being enrolled in private schools, with 5 (15.1% in the age bracket) enrolled. Conversely, the age group of 10 to 14 year olds has the lowest likelihood of being enrolled in a private school, with 12 (100.0% in the age bracket) attending a public institution.
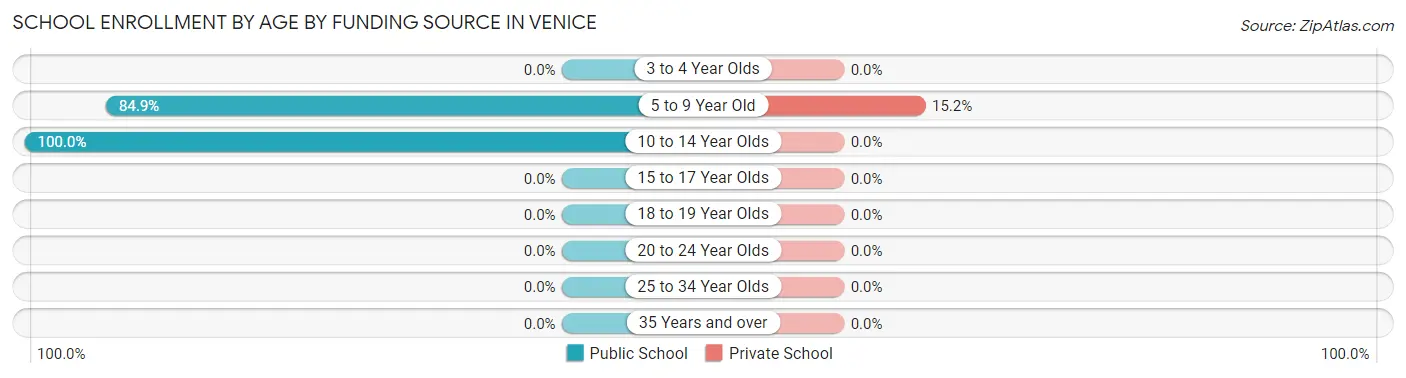
| Age Bracket | Public School | Private School |
| 3 to 4 Year Olds | 0 (0.0%) | 0 (0.0%) |
| 5 to 9 Year Old | 28 (84.9%) | 5 (15.1%) |
| 10 to 14 Year Olds | 12 (100.0%) | 0 (0.0%) |
| 15 to 17 Year Olds | 0 (0.0%) | 0 (0.0%) |
| 18 to 19 Year Olds | 0 (0.0%) | 0 (0.0%) |
| 20 to 24 Year Olds | 0 (0.0%) | 0 (0.0%) |
| 25 to 34 Year Olds | 0 (0.0%) | 0 (0.0%) |
| 35 Years and over | 0 (0.0%) | 0 (0.0%) |
| Total | 40 (88.9%) | 5 (11.1%) |
Educational Attainment by Field of Study in Venice
| Field of Study | # Graduates | % Graduates |
| Computers & Mathematics | 0 | 0.0% |
| Bio, Nature & Agricultural | 0 | 0.0% |
| Physical & Health Sciences | 0 | 0.0% |
| Psychology | 0 | 0.0% |
| Social Sciences | 0 | 0.0% |
| Engineering | 0 | 0.0% |
| Multidisciplinary Studies | 0 | 0.0% |
| Science & Technology | 0 | 0.0% |
| Business | 0 | 0.0% |
| Education | 0 | 0.0% |
| Literature & Languages | 0 | 0.0% |
| Liberal Arts & History | 0 | 0.0% |
| Visual & Performing Arts | 0 | 0.0% |
| Communications | 0 | 0.0% |
| Arts & Humanities | 0 | 0.0% |
| Total | 0 | 0.0% |
Transportation & Commute in Venice
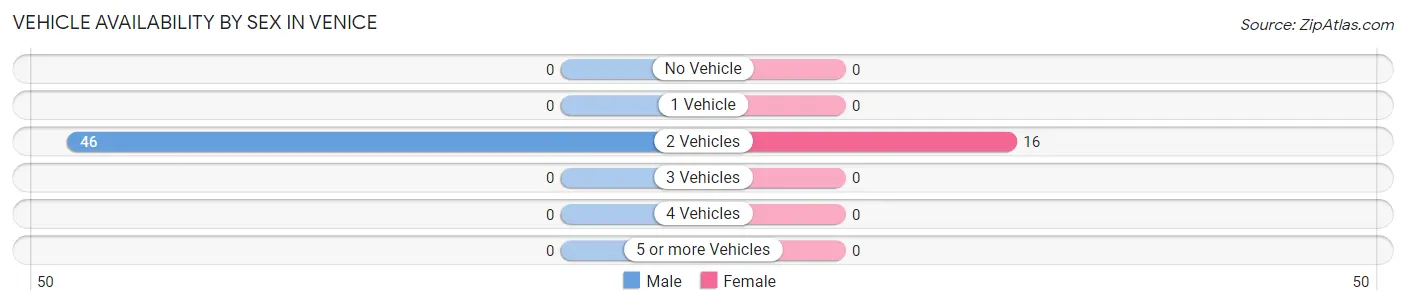
Vehicle Availability by Sex in Venice
The most prevalent vehicle ownership categories in Venice are males with 2 vehicles (46, accounting for 100.0%) and females with 2 vehicles (16, making up 287.5%).
| Vehicles Available | Male | Female |
| No Vehicle | 0 (0.0%) | 0 (0.0%) |
| 1 Vehicle | 0 (0.0%) | 0 (0.0%) |
| 2 Vehicles | 46 (100.0%) | 16 (100.0%) |
| 3 Vehicles | 0 (0.0%) | 0 (0.0%) |
| 4 Vehicles | 0 (0.0%) | 0 (0.0%) |
| 5 or more Vehicles | 0 (0.0%) | 0 (0.0%) |
| Total | 46 (100.0%) | 16 (100.0%) |
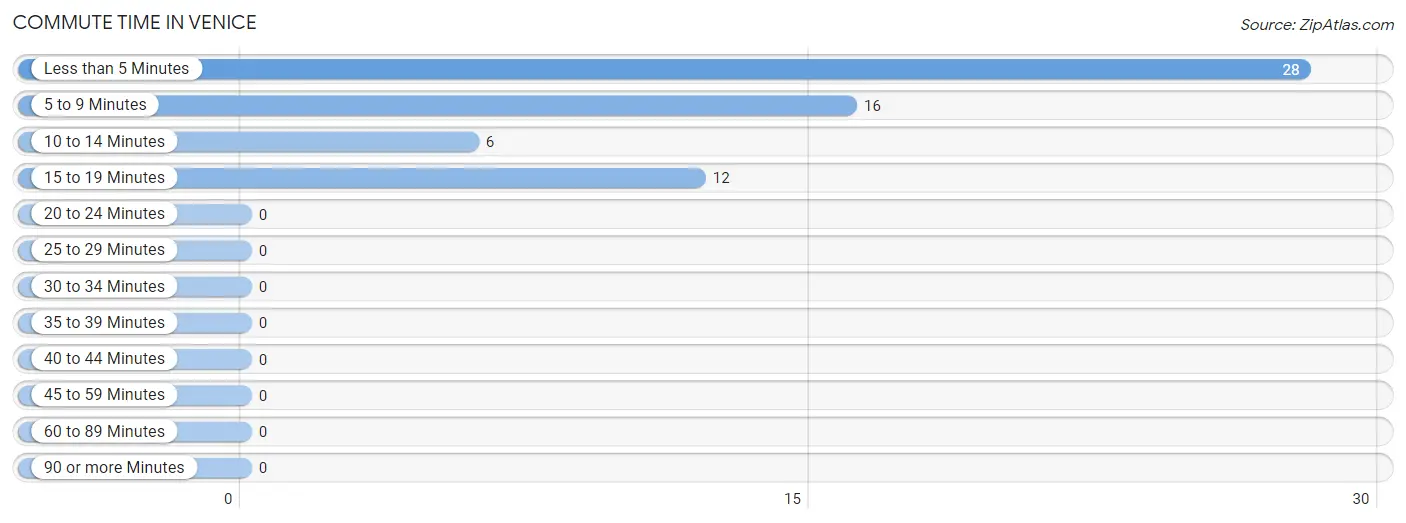
Commute Time in Venice
The most frequently occuring commute durations in Venice are less than 5 minutes (28 commuters, 45.2%), 5 to 9 minutes (16 commuters, 25.8%), and 15 to 19 minutes (12 commuters, 19.4%).
| Commute Time | # Commuters | % Commuters |
| Less than 5 Minutes | 28 | 45.2% |
| 5 to 9 Minutes | 16 | 25.8% |
| 10 to 14 Minutes | 6 | 9.7% |
| 15 to 19 Minutes | 12 | 19.4% |
| 20 to 24 Minutes | 0 | 0.0% |
| 25 to 29 Minutes | 0 | 0.0% |
| 30 to 34 Minutes | 0 | 0.0% |
| 35 to 39 Minutes | 0 | 0.0% |
| 40 to 44 Minutes | 0 | 0.0% |
| 45 to 59 Minutes | 0 | 0.0% |
| 60 to 89 Minutes | 0 | 0.0% |
| 90 or more Minutes | 0 | 0.0% |
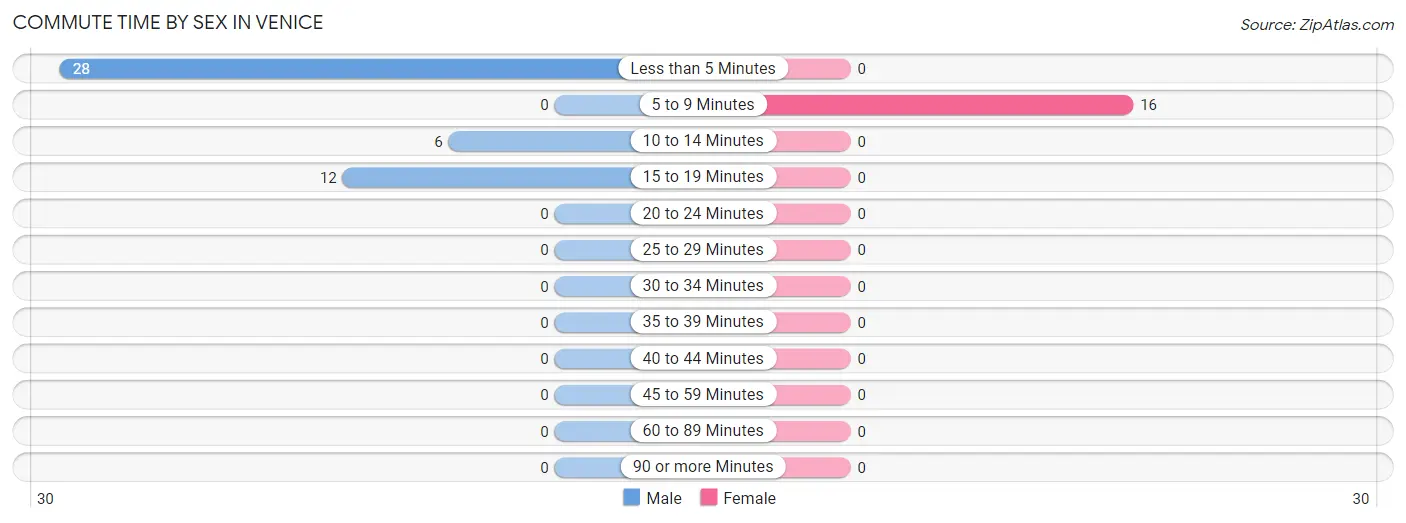
Commute Time by Sex in Venice
The most common commute times in Venice are less than 5 minutes (28 commuters, 60.9%) for males and 5 to 9 minutes (16 commuters, 100.0%) for females.
| Commute Time | Male | Female |
| Less than 5 Minutes | 28 (60.9%) | 0 (0.0%) |
| 5 to 9 Minutes | 0 (0.0%) | 16 (100.0%) |
| 10 to 14 Minutes | 6 (13.0%) | 0 (0.0%) |
| 15 to 19 Minutes | 12 (26.1%) | 0 (0.0%) |
| 20 to 24 Minutes | 0 (0.0%) | 0 (0.0%) |
| 25 to 29 Minutes | 0 (0.0%) | 0 (0.0%) |
| 30 to 34 Minutes | 0 (0.0%) | 0 (0.0%) |
| 35 to 39 Minutes | 0 (0.0%) | 0 (0.0%) |
| 40 to 44 Minutes | 0 (0.0%) | 0 (0.0%) |
| 45 to 59 Minutes | 0 (0.0%) | 0 (0.0%) |
| 60 to 89 Minutes | 0 (0.0%) | 0 (0.0%) |
| 90 or more Minutes | 0 (0.0%) | 0 (0.0%) |
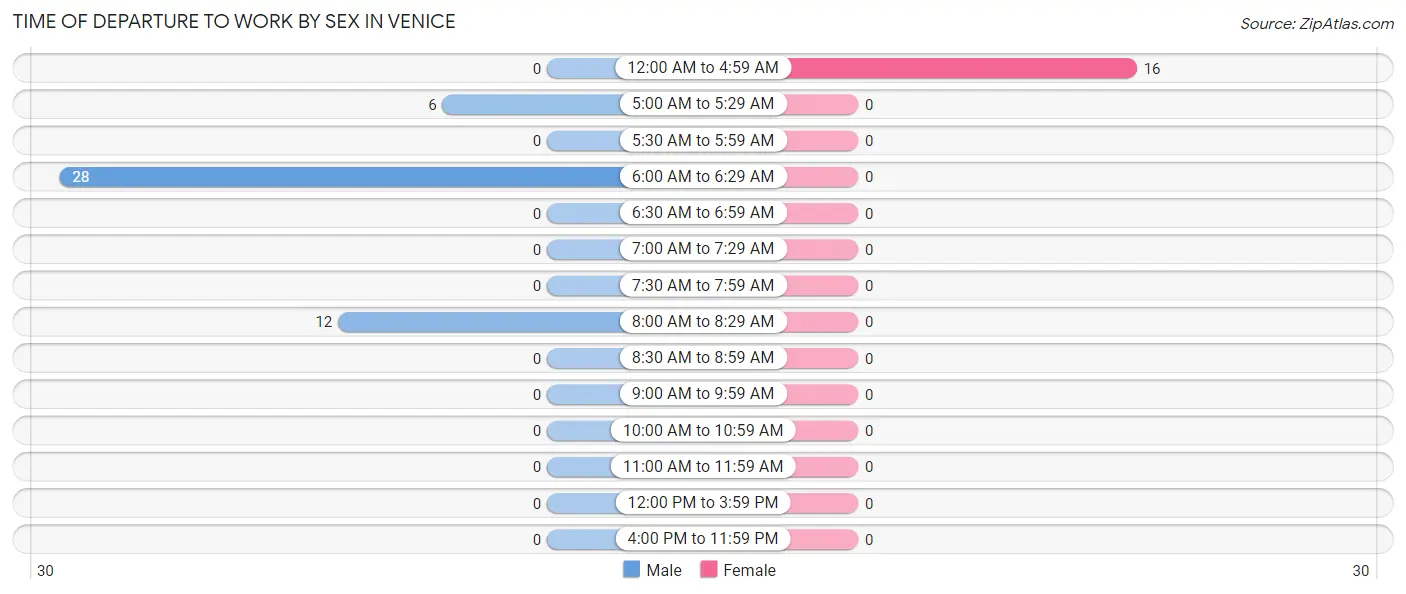
Time of Departure to Work by Sex in Venice
The most frequent times of departure to work in Venice are 6:00 AM to 6:29 AM (28, 60.9%) for males and 12:00 AM to 4:59 AM (16, 100.0%) for females.
| Time of Departure | Male | Female |
| 12:00 AM to 4:59 AM | 0 (0.0%) | 16 (100.0%) |
| 5:00 AM to 5:29 AM | 6 (13.0%) | 0 (0.0%) |
| 5:30 AM to 5:59 AM | 0 (0.0%) | 0 (0.0%) |
| 6:00 AM to 6:29 AM | 28 (60.9%) | 0 (0.0%) |
| 6:30 AM to 6:59 AM | 0 (0.0%) | 0 (0.0%) |
| 7:00 AM to 7:29 AM | 0 (0.0%) | 0 (0.0%) |
| 7:30 AM to 7:59 AM | 0 (0.0%) | 0 (0.0%) |
| 8:00 AM to 8:29 AM | 12 (26.1%) | 0 (0.0%) |
| 8:30 AM to 8:59 AM | 0 (0.0%) | 0 (0.0%) |
| 9:00 AM to 9:59 AM | 0 (0.0%) | 0 (0.0%) |
| 10:00 AM to 10:59 AM | 0 (0.0%) | 0 (0.0%) |
| 11:00 AM to 11:59 AM | 0 (0.0%) | 0 (0.0%) |
| 12:00 PM to 3:59 PM | 0 (0.0%) | 0 (0.0%) |
| 4:00 PM to 11:59 PM | 0 (0.0%) | 0 (0.0%) |
| Total | 46 (100.0%) | 16 (100.0%) |
Housing Occupancy in Venice
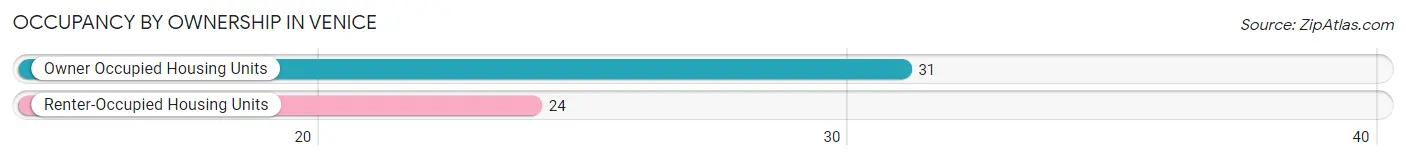
Occupancy by Ownership in Venice
Of the total 55 dwellings in Venice, owner-occupied units account for 31 (56.4%), while renter-occupied units make up 24 (43.6%).
| Occupancy | # Housing Units | % Housing Units |
| Owner Occupied Housing Units | 31 | 56.4% |
| Renter-Occupied Housing Units | 24 | 43.6% |
| Total Occupied Housing Units | 55 | 100.0% |
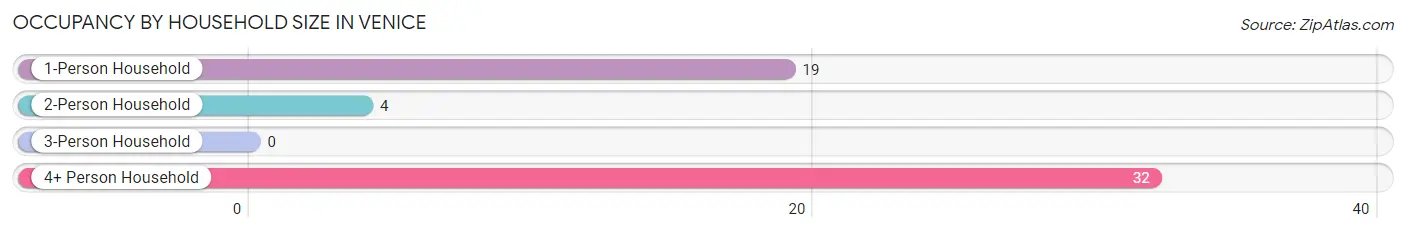
Occupancy by Household Size in Venice
| Household Size | # Housing Units | % Housing Units |
| 1-Person Household | 19 | 34.5% |
| 2-Person Household | 4 | 7.3% |
| 3-Person Household | 0 | 0.0% |
| 4+ Person Household | 32 | 58.2% |
| Total Housing Units | 55 | 100.0% |
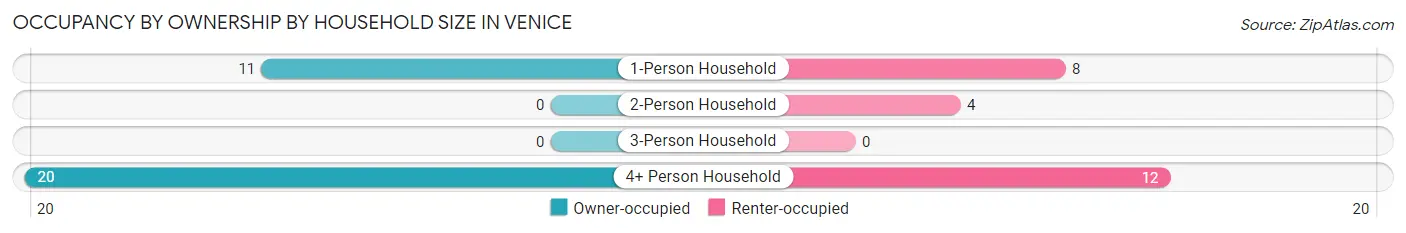
Occupancy by Ownership by Household Size in Venice
| Household Size | Owner-occupied | Renter-occupied |
| 1-Person Household | 11 (57.9%) | 8 (42.1%) |
| 2-Person Household | 0 (0.0%) | 4 (100.0%) |
| 3-Person Household | 0 (0.0%) | 0 (0.0%) |
| 4+ Person Household | 20 (62.5%) | 12 (37.5%) |
| Total Housing Units | 31 (56.4%) | 24 (43.6%) |
Occupancy by Educational Attainment in Venice
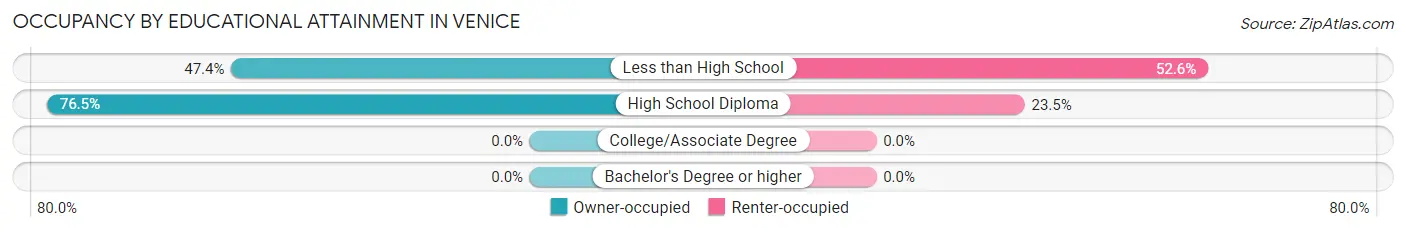
| Household Size | Owner-occupied | Renter-occupied |
| Less than High School | 18 (47.4%) | 20 (52.6%) |
| High School Diploma | 13 (76.5%) | 4 (23.5%) |
| College/Associate Degree | 0 (0.0%) | 0 (0.0%) |
| Bachelor's Degree or higher | 0 (0.0%) | 0 (0.0%) |
Occupancy by Age of Householder in Venice
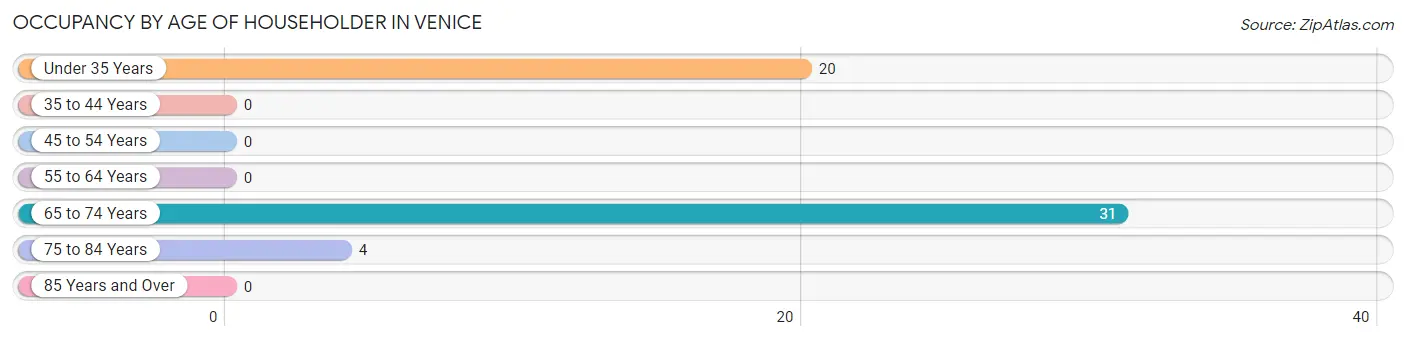
| Age Bracket | # Households | % Households |
| Under 35 Years | 20 | 36.4% |
| 35 to 44 Years | 0 | 0.0% |
| 45 to 54 Years | 0 | 0.0% |
| 55 to 64 Years | 0 | 0.0% |
| 65 to 74 Years | 31 | 56.4% |
| 75 to 84 Years | 4 | 7.3% |
| 85 Years and Over | 0 | 0.0% |
| Total | 55 | 100.0% |
Housing Finances in Venice
Median Income by Occupancy in Venice
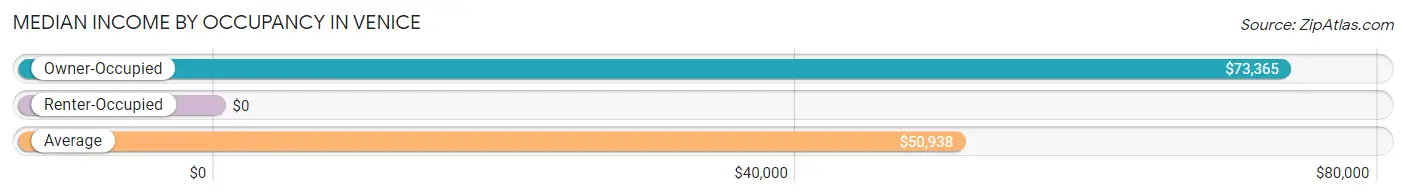
| Occupancy Type | # Households | Median Income |
| Owner-Occupied | 31 (56.4%) | $73,365 |
| Renter-Occupied | 24 (43.6%) | $0 |
| Average | 55 (100.0%) | $50,938 |
Occupancy by Householder Income Bracket in Venice
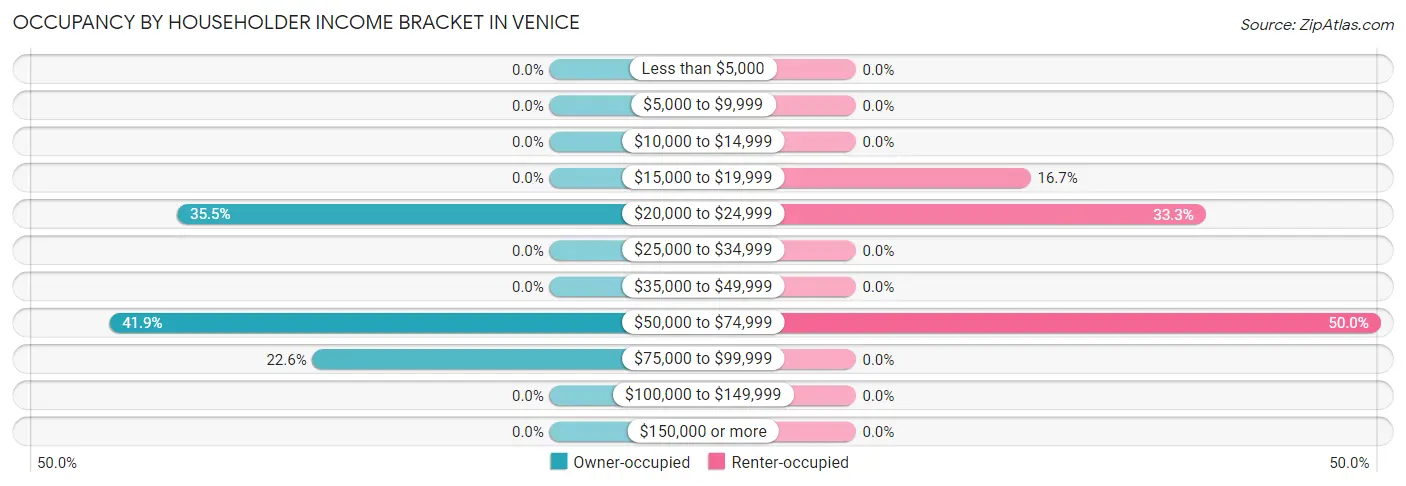
| Income Bracket | Owner-occupied | Renter-occupied |
| Less than $5,000 | 0 (0.0%) | 0 (0.0%) |
| $5,000 to $9,999 | 0 (0.0%) | 0 (0.0%) |
| $10,000 to $14,999 | 0 (0.0%) | 0 (0.0%) |
| $15,000 to $19,999 | 0 (0.0%) | 4 (16.7%) |
| $20,000 to $24,999 | 11 (35.5%) | 8 (33.3%) |
| $25,000 to $34,999 | 0 (0.0%) | 0 (0.0%) |
| $35,000 to $49,999 | 0 (0.0%) | 0 (0.0%) |
| $50,000 to $74,999 | 13 (41.9%) | 12 (50.0%) |
| $75,000 to $99,999 | 7 (22.6%) | 0 (0.0%) |
| $100,000 to $149,999 | 0 (0.0%) | 0 (0.0%) |
| $150,000 or more | 0 (0.0%) | 0 (0.0%) |
| Total | 31 (100.0%) | 24 (100.0%) |
Monthly Housing Cost Tiers in Venice
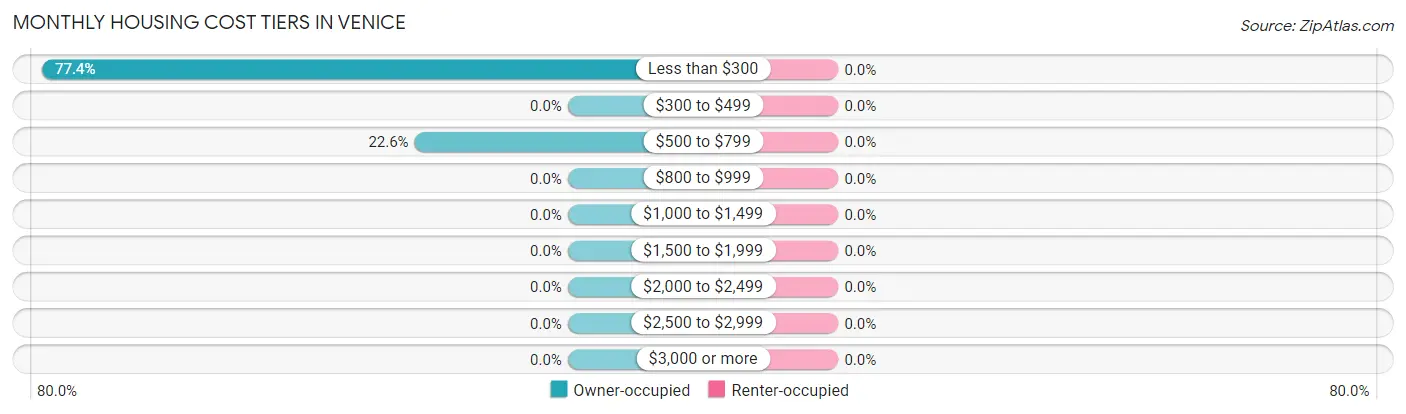
| Monthly Cost | Owner-occupied | Renter-occupied |
| Less than $300 | 24 (77.4%) | 0 (0.0%) |
| $300 to $499 | 0 (0.0%) | 0 (0.0%) |
| $500 to $799 | 7 (22.6%) | 0 (0.0%) |
| $800 to $999 | 0 (0.0%) | 0 (0.0%) |
| $1,000 to $1,499 | 0 (0.0%) | 0 (0.0%) |
| $1,500 to $1,999 | 0 (0.0%) | 0 (0.0%) |
| $2,000 to $2,499 | 0 (0.0%) | 0 (0.0%) |
| $2,500 to $2,999 | 0 (0.0%) | 0 (0.0%) |
| $3,000 or more | 0 (0.0%) | 0 (0.0%) |
| Total | 31 (100.0%) | 24 (100.0%) |
Physical Housing Characteristics in Venice
Housing Structures in Venice
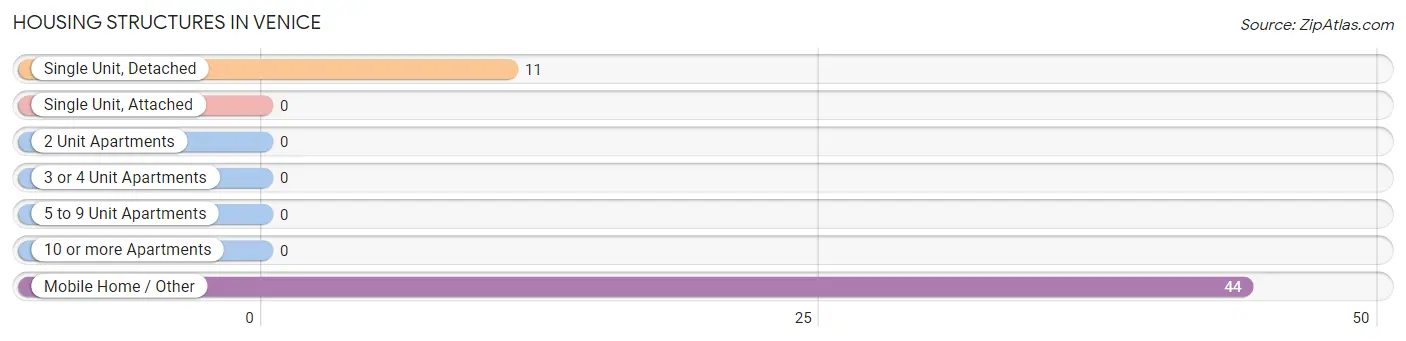
| Structure Type | # Housing Units | % Housing Units |
| Single Unit, Detached | 11 | 20.0% |
| Single Unit, Attached | 0 | 0.0% |
| 2 Unit Apartments | 0 | 0.0% |
| 3 or 4 Unit Apartments | 0 | 0.0% |
| 5 to 9 Unit Apartments | 0 | 0.0% |
| 10 or more Apartments | 0 | 0.0% |
| Mobile Home / Other | 44 | 80.0% |
| Total | 55 | 100.0% |
Housing Structures by Occupancy in Venice
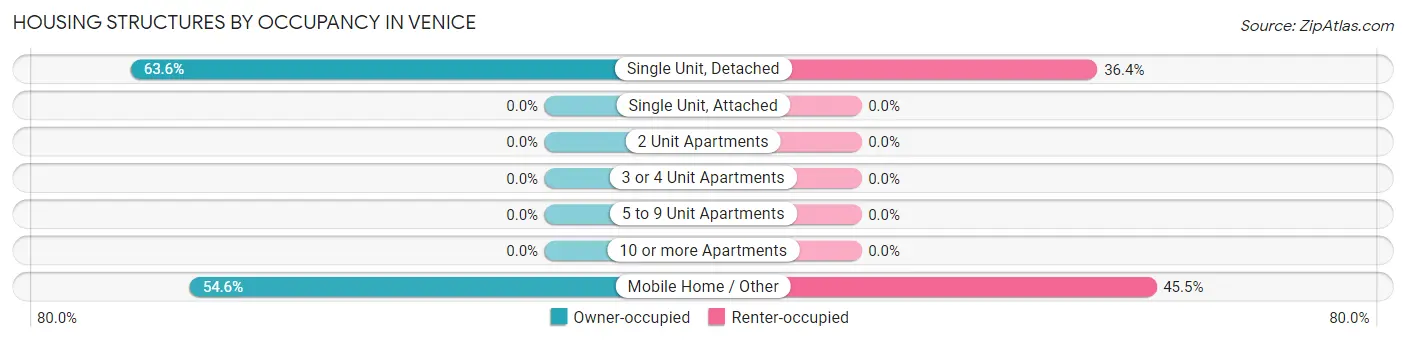
| Structure Type | Owner-occupied | Renter-occupied |
| Single Unit, Detached | 7 (63.6%) | 4 (36.4%) |
| Single Unit, Attached | 0 (0.0%) | 0 (0.0%) |
| 2 Unit Apartments | 0 (0.0%) | 0 (0.0%) |
| 3 or 4 Unit Apartments | 0 (0.0%) | 0 (0.0%) |
| 5 to 9 Unit Apartments | 0 (0.0%) | 0 (0.0%) |
| 10 or more Apartments | 0 (0.0%) | 0 (0.0%) |
| Mobile Home / Other | 24 (54.5%) | 20 (45.5%) |
| Total | 31 (56.4%) | 24 (43.6%) |
Housing Structures by Number of Rooms in Venice
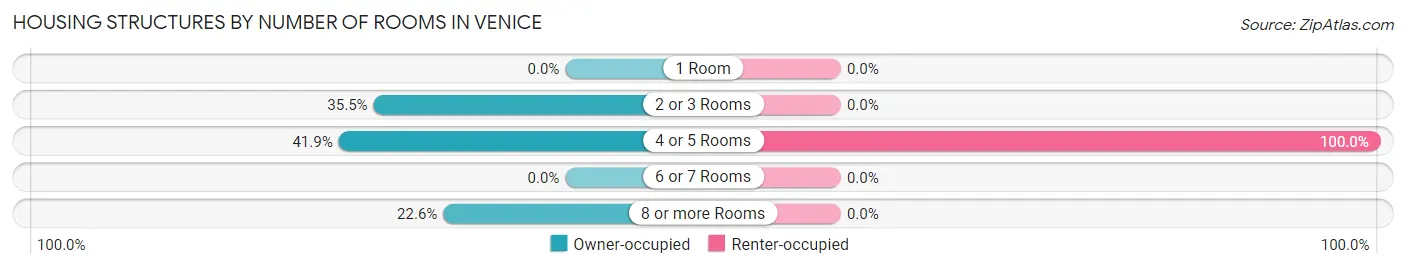
| Number of Rooms | Owner-occupied | Renter-occupied |
| 1 Room | 0 (0.0%) | 0 (0.0%) |
| 2 or 3 Rooms | 11 (35.5%) | 0 (0.0%) |
| 4 or 5 Rooms | 13 (41.9%) | 24 (100.0%) |
| 6 or 7 Rooms | 0 (0.0%) | 0 (0.0%) |
| 8 or more Rooms | 7 (22.6%) | 0 (0.0%) |
| Total | 31 (100.0%) | 24 (100.0%) |
Housing Structure by Heating Type in Venice
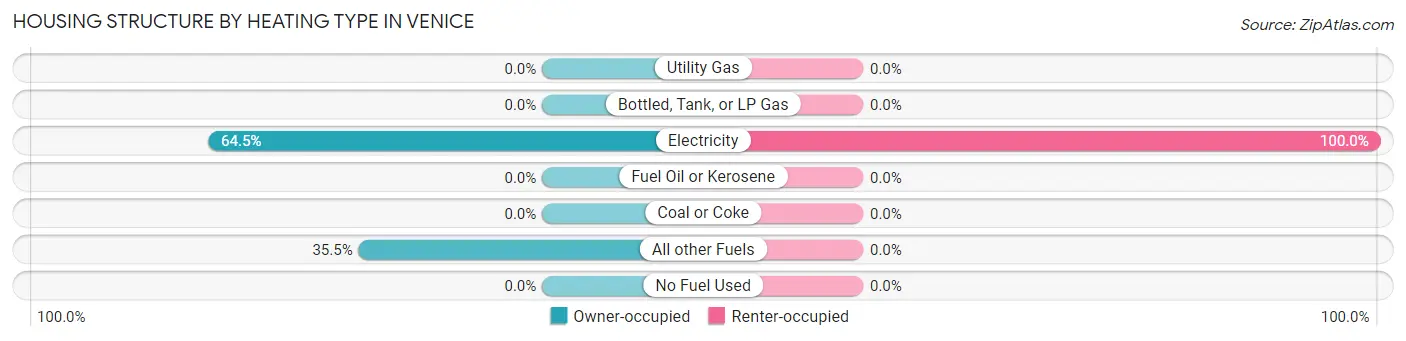
| Heating Type | Owner-occupied | Renter-occupied |
| Utility Gas | 0 (0.0%) | 0 (0.0%) |
| Bottled, Tank, or LP Gas | 0 (0.0%) | 0 (0.0%) |
| Electricity | 20 (64.5%) | 24 (100.0%) |
| Fuel Oil or Kerosene | 0 (0.0%) | 0 (0.0%) |
| Coal or Coke | 0 (0.0%) | 0 (0.0%) |
| All other Fuels | 11 (35.5%) | 0 (0.0%) |
| No Fuel Used | 0 (0.0%) | 0 (0.0%) |
| Total | 31 (100.0%) | 24 (100.0%) |
Household Vehicle Usage in Venice
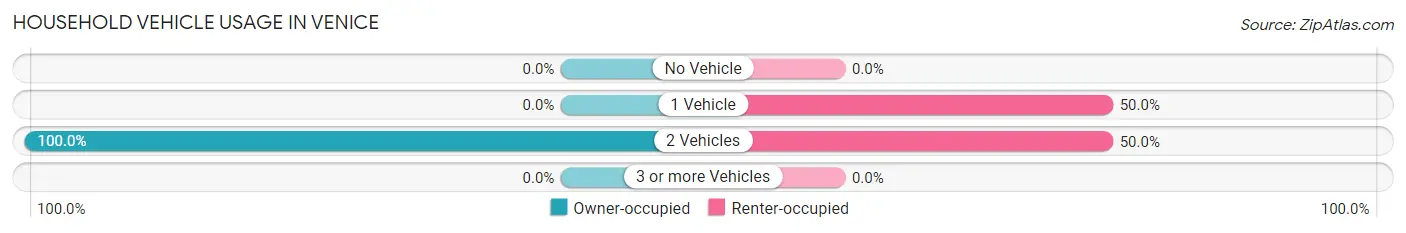
| Vehicles per Household | Owner-occupied | Renter-occupied |
| No Vehicle | 0 (0.0%) | 0 (0.0%) |
| 1 Vehicle | 0 (0.0%) | 12 (50.0%) |
| 2 Vehicles | 31 (100.0%) | 12 (50.0%) |
| 3 or more Vehicles | 0 (0.0%) | 0 (0.0%) |
| Total | 31 (100.0%) | 24 (100.0%) |
Real Estate & Mortgages in Venice
Real Estate and Mortgage Overview in Venice
| Characteristic | Without Mortgage | With Mortgage |
| Housing Units | 31 | 0 |
| Median Property Value | - | - |
| Median Household Income | $73,365 | $0 |
| Monthly Housing Costs | $232 | $0 |
| Real Estate Taxes | - | - |
Property Value by Mortgage Status in Venice
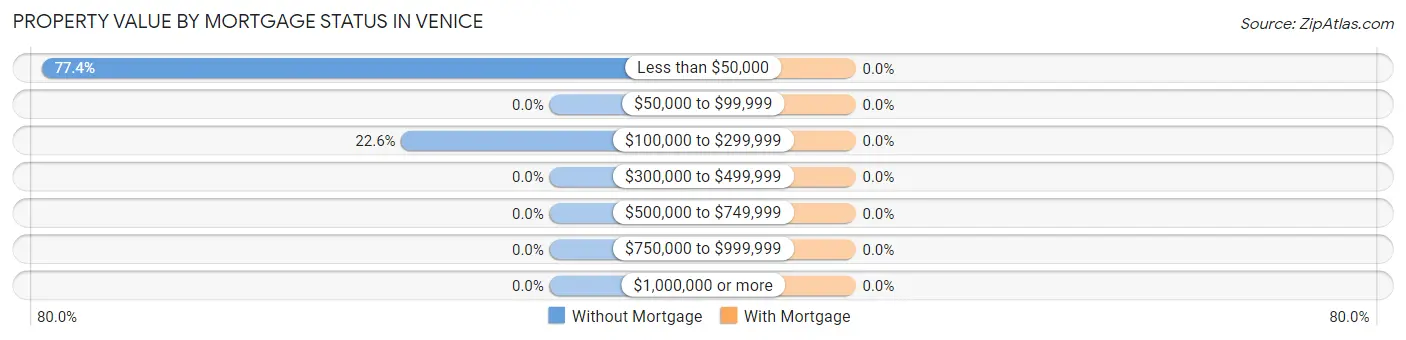
| Property Value | Without Mortgage | With Mortgage |
| Less than $50,000 | 24 (77.4%) | 0 (0.0%) |
| $50,000 to $99,999 | 0 (0.0%) | 0 (0.0%) |
| $100,000 to $299,999 | 7 (22.6%) | 0 (0.0%) |
| $300,000 to $499,999 | 0 (0.0%) | 0 (0.0%) |
| $500,000 to $749,999 | 0 (0.0%) | 0 (0.0%) |
| $750,000 to $999,999 | 0 (0.0%) | 0 (0.0%) |
| $1,000,000 or more | 0 (0.0%) | 0 (0.0%) |
| Total | 31 (100.0%) | 0 (0.0%) |
Household Income by Mortgage Status in Venice
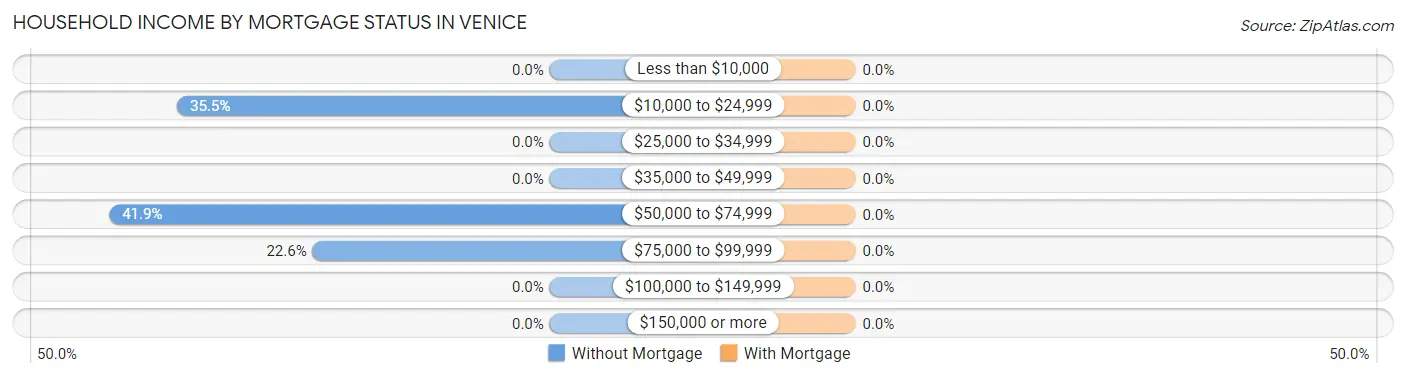
| Household Income | Without Mortgage | With Mortgage |
| Less than $10,000 | 0 (0.0%) | 0 (0.0%) |
| $10,000 to $24,999 | 11 (35.5%) | 0 (0.0%) |
| $25,000 to $34,999 | 0 (0.0%) | 0 (0.0%) |
| $35,000 to $49,999 | 0 (0.0%) | 0 (0.0%) |
| $50,000 to $74,999 | 13 (41.9%) | 0 (0.0%) |
| $75,000 to $99,999 | 7 (22.6%) | 0 (0.0%) |
| $100,000 to $149,999 | 0 (0.0%) | 0 (0.0%) |
| $150,000 or more | 0 (0.0%) | 0 (0.0%) |
| Total | 31 (100.0%) | 0 (0.0%) |
Property Value to Household Income Ratio in Venice
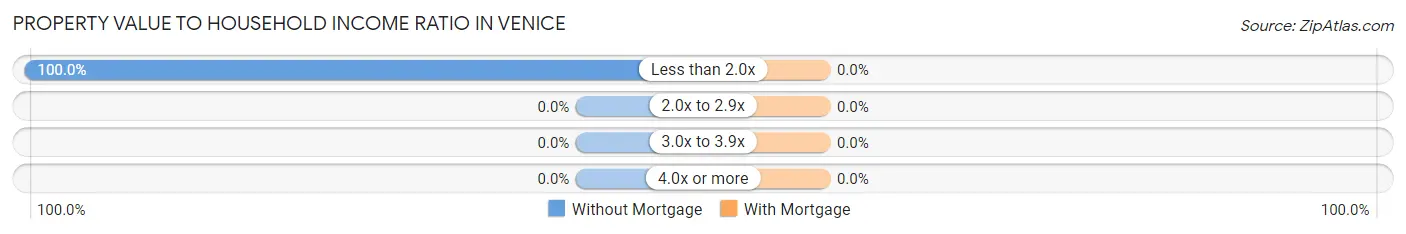
| Value-to-Income Ratio | Without Mortgage | With Mortgage |
| Less than 2.0x | 31 (100.0%) | 0 (0.0%) |
| 2.0x to 2.9x | 0 (0.0%) | 0 (0.0%) |
| 3.0x to 3.9x | 0 (0.0%) | 0 (0.0%) |
| 4.0x or more | 0 (0.0%) | 0 (0.0%) |
| Total | 31 (100.0%) | 0 (0.0%) |
Real Estate Taxes by Mortgage Status in Venice
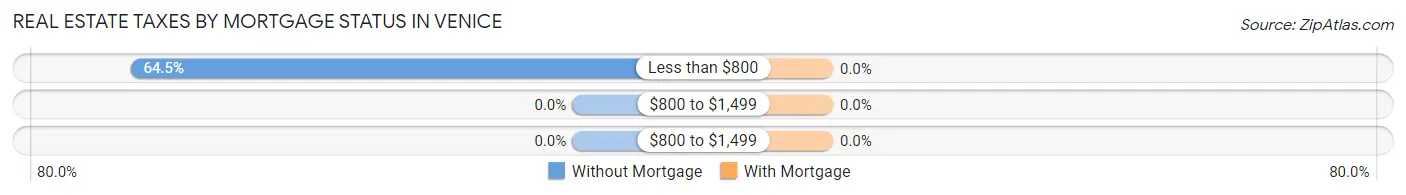
| Property Taxes | Without Mortgage | With Mortgage |
| Less than $800 | 20 (64.5%) | 0 (0.0%) |
| $800 to $1,499 | 0 (0.0%) | 0 (0.0%) |
| $800 to $1,499 | 0 (0.0%) | 0 (0.0%) |
| Total | 31 (100.0%) | 0 (0.0%) |
Health & Disability in Venice
Health Insurance Coverage by Age in Venice
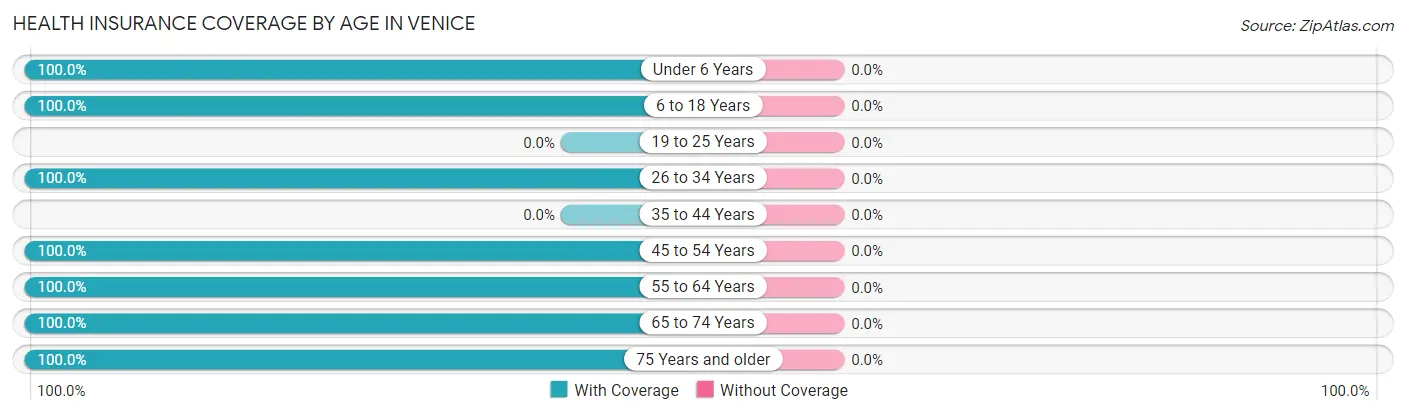
| Age Bracket | With Coverage | Without Coverage |
| Under 6 Years | 20 (100.0%) | 0 (0.0%) |
| 6 to 18 Years | 45 (100.0%) | 0 (0.0%) |
| 19 to 25 Years | 0 (0.0%) | 0 (0.0%) |
| 26 to 34 Years | 76 (100.0%) | 0 (0.0%) |
| 35 to 44 Years | 0 (0.0%) | 0 (0.0%) |
| 45 to 54 Years | 16 (100.0%) | 0 (0.0%) |
| 55 to 64 Years | 2 (100.0%) | 0 (0.0%) |
| 65 to 74 Years | 31 (100.0%) | 0 (0.0%) |
| 75 Years and older | 4 (100.0%) | 0 (0.0%) |
| Total | 194 (100.0%) | 0 (0.0%) |
Health Insurance Coverage by Citizenship Status in Venice
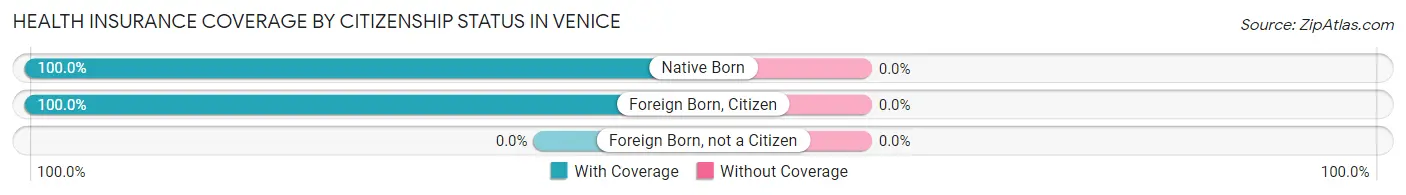
| Citizenship Status | With Coverage | Without Coverage |
| Native Born | 20 (100.0%) | 0 (0.0%) |
| Foreign Born, Citizen | 45 (100.0%) | 0 (0.0%) |
| Foreign Born, not a Citizen | 0 (0.0%) | 0 (0.0%) |
Health Insurance Coverage by Household Income in Venice
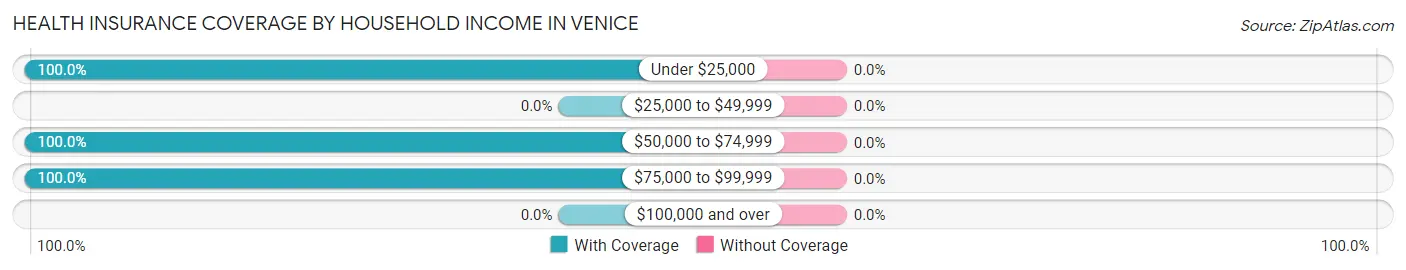
| Household Income | With Coverage | Without Coverage |
| Under $25,000 | 25 (100.0%) | 0 (0.0%) |
| $25,000 to $49,999 | 0 (0.0%) | 0 (0.0%) |
| $50,000 to $74,999 | 142 (100.0%) | 0 (0.0%) |
| $75,000 to $99,999 | 27 (100.0%) | 0 (0.0%) |
| $100,000 and over | 0 (0.0%) | 0 (0.0%) |
Public vs Private Health Insurance Coverage by Age in Venice
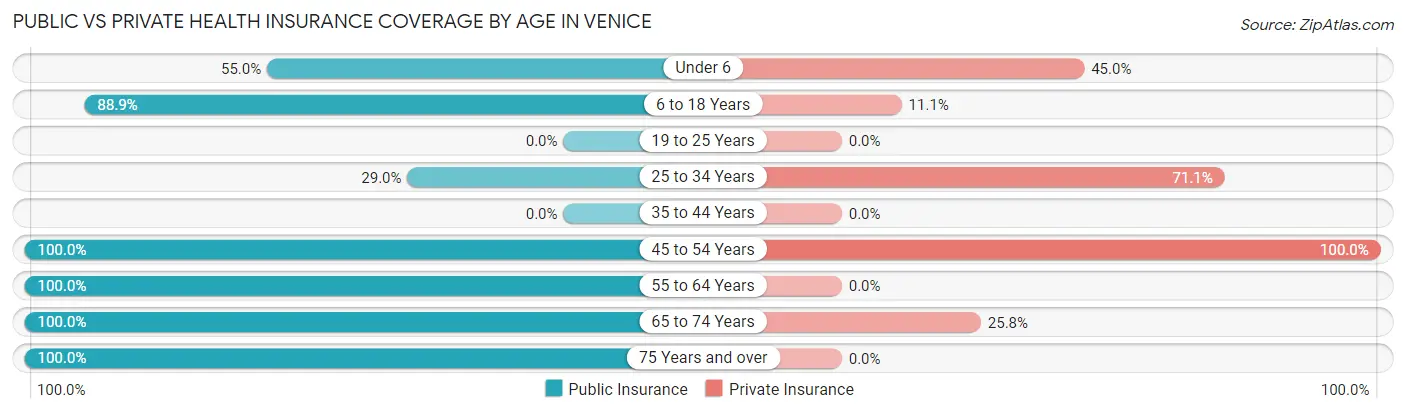
| Age Bracket | Public Insurance | Private Insurance |
| Under 6 | 11 (55.0%) | 9 (45.0%) |
| 6 to 18 Years | 40 (88.9%) | 5 (11.1%) |
| 19 to 25 Years | 0 (0.0%) | 0 (0.0%) |
| 25 to 34 Years | 22 (28.9%) | 54 (71.1%) |
| 35 to 44 Years | 0 (0.0%) | 0 (0.0%) |
| 45 to 54 Years | 16 (100.0%) | 16 (100.0%) |
| 55 to 64 Years | 2 (100.0%) | 0 (0.0%) |
| 65 to 74 Years | 31 (100.0%) | 8 (25.8%) |
| 75 Years and over | 4 (100.0%) | 0 (0.0%) |
| Total | 126 (64.9%) | 92 (47.4%) |
Disability Status by Sex by Age in Venice
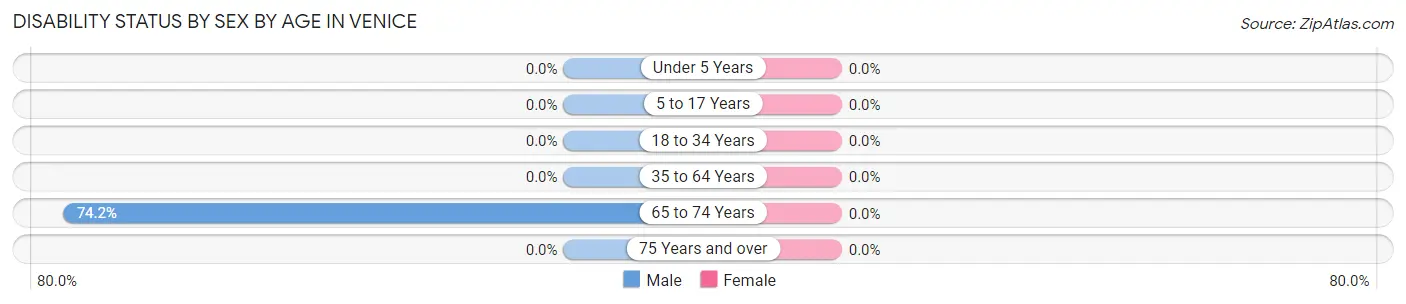
| Age Bracket | Male | Female |
| Under 5 Years | 0 (0.0%) | 0 (0.0%) |
| 5 to 17 Years | 0 (0.0%) | 0 (0.0%) |
| 18 to 34 Years | 0 (0.0%) | 0 (0.0%) |
| 35 to 64 Years | 0 (0.0%) | 0 (0.0%) |
| 65 to 74 Years | 23 (74.2%) | 0 (0.0%) |
| 75 Years and over | 0 (0.0%) | 0 (0.0%) |
Disability Class by Sex by Age in Venice
Disability Class: Hearing Difficulty
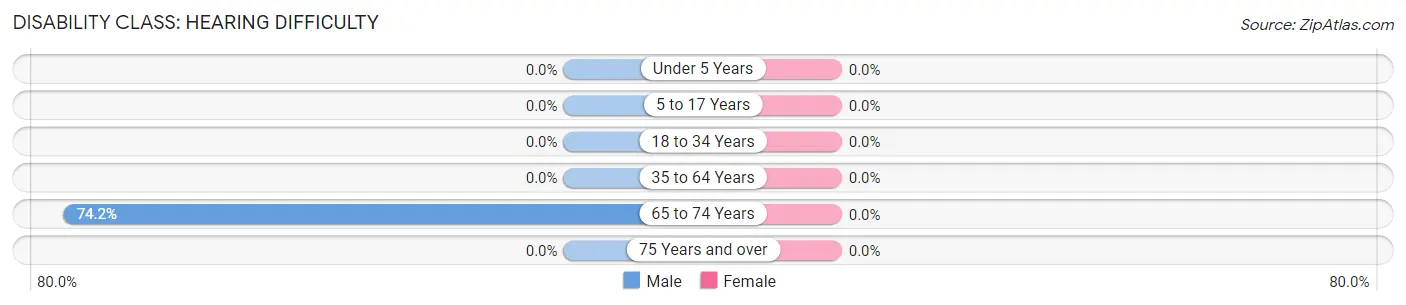
| Age Bracket | Male | Female |
| Under 5 Years | 0 (0.0%) | 0 (0.0%) |
| 5 to 17 Years | 0 (0.0%) | 0 (0.0%) |
| 18 to 34 Years | 0 (0.0%) | 0 (0.0%) |
| 35 to 64 Years | 0 (0.0%) | 0 (0.0%) |
| 65 to 74 Years | 23 (74.2%) | 0 (0.0%) |
| 75 Years and over | 0 (0.0%) | 0 (0.0%) |
Disability Class: Vision Difficulty
| Age Bracket | Male | Female |
| Under 5 Years | 0 (0.0%) | 0 (0.0%) |
| 5 to 17 Years | 0 (0.0%) | 0 (0.0%) |
| 18 to 34 Years | 0 (0.0%) | 0 (0.0%) |
| 35 to 64 Years | 0 (0.0%) | 0 (0.0%) |
| 65 to 74 Years | 0 (0.0%) | 0 (0.0%) |
| 75 Years and over | 0 (0.0%) | 0 (0.0%) |
Disability Class: Cognitive Difficulty
| Age Bracket | Male | Female |
| 5 to 17 Years | 0 (0.0%) | 0 (0.0%) |
| 18 to 34 Years | 0 (0.0%) | 0 (0.0%) |
| 35 to 64 Years | 0 (0.0%) | 0 (0.0%) |
| 65 to 74 Years | 0 (0.0%) | 0 (0.0%) |
| 75 Years and over | 0 (0.0%) | 0 (0.0%) |
Disability Class: Ambulatory Difficulty
| Age Bracket | Male | Female |
| 5 to 17 Years | 0 (0.0%) | 0 (0.0%) |
| 18 to 34 Years | 0 (0.0%) | 0 (0.0%) |
| 35 to 64 Years | 0 (0.0%) | 0 (0.0%) |
| 65 to 74 Years | 0 (0.0%) | 0 (0.0%) |
| 75 Years and over | 0 (0.0%) | 0 (0.0%) |
Disability Class: Self-Care Difficulty

| Age Bracket | Male | Female |
| 5 to 17 Years | 0 (0.0%) | 0 (0.0%) |
| 18 to 34 Years | 0 (0.0%) | 0 (0.0%) |
| 35 to 64 Years | 0 (0.0%) | 0 (0.0%) |
| 65 to 74 Years | 0 (0.0%) | 0 (0.0%) |
| 75 Years and over | 0 (0.0%) | 0 (0.0%) |
Technology Access in Venice
Computing Device Access in Venice
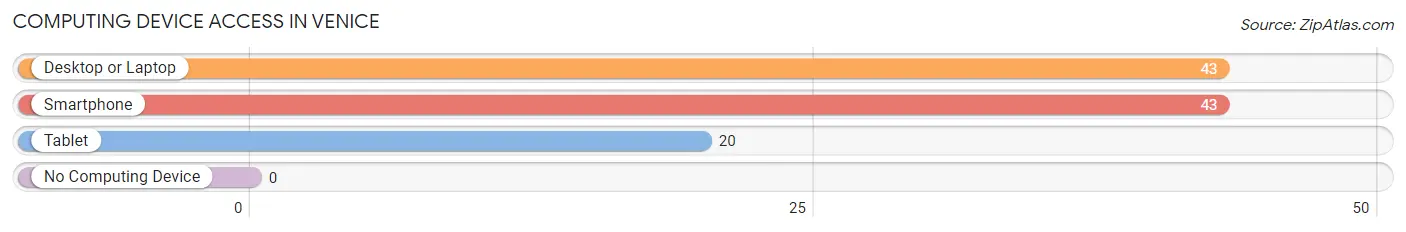
| Device Type | # Households | % Households |
| Desktop or Laptop | 43 | 78.2% |
| Smartphone | 43 | 78.2% |
| Tablet | 20 | 36.4% |
| No Computing Device | 0 | 0.0% |
| Total | 55 | 100.0% |
Internet Access in Venice
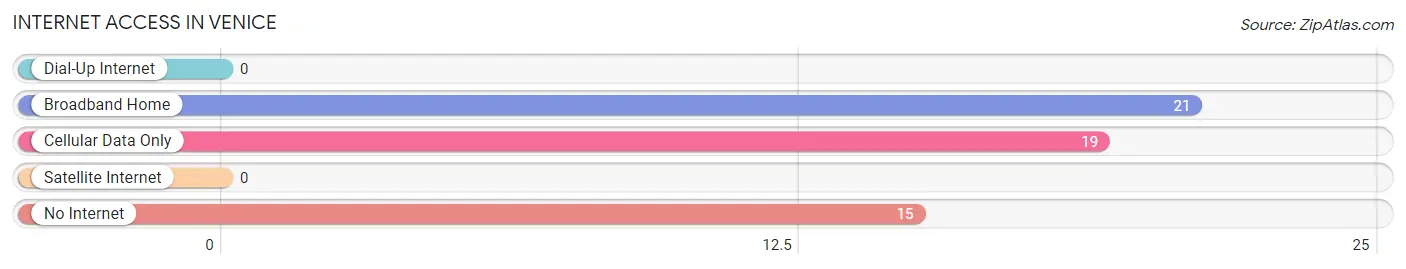
| Internet Type | # Households | % Households |
| Dial-Up Internet | 0 | 0.0% |
| Broadband Home | 21 | 38.2% |
| Cellular Data Only | 19 | 34.5% |
| Satellite Internet | 0 | 0.0% |
| No Internet | 15 | 27.3% |
| Total | 55 | 100.0% |
Venice Summary
Venice, Louisiana is a small town located in Plaquemines Parish, Louisiana, United States. It is situated on the Mississippi River Delta, approximately 40 miles south of New Orleans. The town is known for its fishing and shrimping industry, as well as its unique culture and history.
Geography
Venice is located in the southeastern corner of Plaquemines Parish, Louisiana, on the Mississippi River Delta. The town is situated on the west bank of the Mississippi River, approximately 40 miles south of New Orleans. The town is surrounded by marshland and is accessible by boat or by car via Louisiana Highway 23.
The town is located in a humid subtropical climate zone, with hot, humid summers and mild winters. The average annual temperature is 68°F (20°C), with an average high of 81°F (27°C) in July and an average low of 55°F (13°C) in January. The average annual precipitation is 62 inches (157 cm).
History
The area that is now Venice was first settled by Native Americans, including the Chitimacha and Houma tribes. The first European settlers arrived in the area in the late 1700s, and the town was officially founded in 1882. The town was named after Venice, Italy, by a group of Italian immigrants who had settled in the area.
The town quickly became a hub for the fishing and shrimping industry, and by the early 1900s, it was the largest shrimping port in the United States. The town was also home to a large Italian-American population, and the culture of the town was heavily influenced by the Italian immigrants.
In the late 20th century, the town was hit hard by the decline of the fishing and shrimping industry, as well as the effects of Hurricane Katrina in 2005. The town has since been rebuilding and is now a popular tourist destination, with many visitors coming to experience the unique culture and history of the town.
Economy
The economy of Venice is largely based on the fishing and shrimping industry, as well as tourism. The town is home to several seafood processing plants, as well as a number of restaurants and shops that cater to tourists. The town is also home to a number of marinas and boat docks, which provide access to the Gulf of Mexico.
The town is also home to a number of oil and gas companies, which are involved in the exploration and production of oil and gas in the Gulf of Mexico. The town is also home to a number of manufacturing companies, which produce a variety of products, including boats, fishing equipment, and other marine-related items.
Demographics
As of the 2010 census, the population of Venice was 2,142. The racial makeup of the town was 79.3% White, 15.2% African American, 0.7% Native American, 0.3% Asian, 0.1% Pacific Islander, and 4.4% from other races. The median household income was $37,917, and the median family income was $45,938.
The town is home to a large Italian-American population, and the culture of the town is heavily influenced by the Italian immigrants. The town is also home to a number of other ethnic groups, including African Americans, Native Americans, and Asians.
Conclusion
Venice, Louisiana is a small town located in Plaquemines Parish, Louisiana, United States. It is situated on the Mississippi River Delta, approximately 40 miles south of New Orleans. The town is known for its fishing and shrimping industry, as well as its unique culture and history. The economy of Venice is largely based on the fishing and shrimping industry, as well as tourism. The town is home to a large Italian-American population, and the culture of the town is heavily influenced by the Italian immigrants. As of the 2010 census, the population of Venice was 2,142.
Common Questions
What is Per Capita Income in Venice?
Per Capita income in Venice is $20,147.
What is the Median Household income in Venice?
Median Household Income in Venice is $50,938.
What is Inequality or Gini Index in Venice?
Inequality or Gini Index in Venice is 0.29.
What is the Total Population of Venice?
Total Population of Venice is 194.
What is the Total Male Population of Venice?
Total Male Population of Venice is 92.
What is the Total Female Population of Venice?
Total Female Population of Venice is 102.
What is the Ratio of Males per 100 Females in Venice?
There are 90.20 Males per 100 Females in Venice.
What is the Ratio of Females per 100 Males in Venice?
There are 110.87 Females per 100 Males in Venice.
What is the Median Population Age in Venice?
Median Population Age in Venice is 32.5 Years.
What is the Average Family Size in Venice
Average Family Size in Venice is 4.4 People.
What is the Average Household Size in Venice
Average Household Size in Venice is 3.5 People.
How Large is the Labor Force in Venice?
There are 84 People in the Labor Forcein in Venice.
What is the Percentage of People in the Labor Force in Venice?
65.1% of People are in the Labor Force in Venice.
What is the Unemployment Rate in Venice?
Unemployment Rate in Venice is 26.2%.