Urania, LA Map & Demographics
Urania Map
Urania Overview
$15,400
PER CAPITA INCOME
$75,625
AVG FAMILY INCOME
$54,375
AVG HOUSEHOLD INCOME
18.6%
WAGE / INCOME GAP [ % ]
81.4¢/ $1
WAGE / INCOME GAP [ $ ]
0.44
INEQUALITY / GINI INDEX
1,219
TOTAL POPULATION
953
MALE POPULATION
266
FEMALE POPULATION
358.27
MALES / 100 FEMALES
27.91
FEMALES / 100 MALES
39.5
MEDIAN AGE
4.1
AVG FAMILY SIZE
2.8
AVG HOUSEHOLD SIZE
208
LABOR FORCE [ PEOPLE ]
19.0%
PERCENT IN LABOR FORCE
7.2%
UNEMPLOYMENT RATE
Urania Zip Codes
Urania Area Codes
Income in Urania
Income Overview in Urania
Per Capita Income in Urania is $15,400, while median incomes of families and households are $75,625 and $54,375 respectively.
| Characteristic | Number | Measure |
| Per Capita Income | 1,219 | $15,400 |
| Median Family Income | 109 | $75,625 |
| Mean Family Income | 109 | $91,866 |
| Median Household Income | 201 | $54,375 |
| Mean Household Income | 201 | $69,388 |
| Income Deficit | 109 | $0 |
| Wage / Income Gap (%) | 1,219 | 18.59% |
| Wage / Income Gap ($) | 1,219 | 81.41¢ per $1 |
| Gini / Inequality Index | 1,219 | 0.44 |
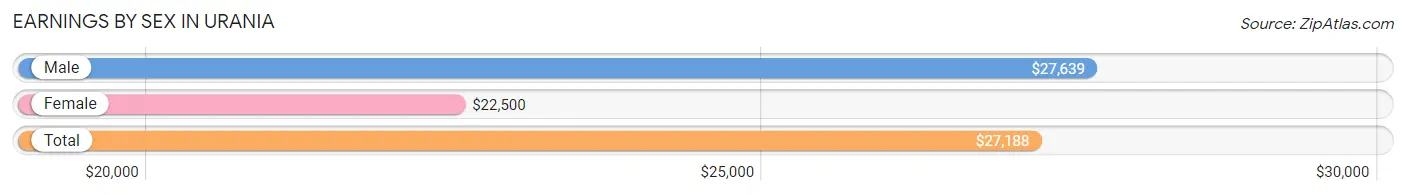
Earnings by Sex in Urania
Average Earnings in Urania are $27,188, $27,639 for men and $22,500 for women, a difference of 18.6%.
| Sex | Number | Average Earnings |
| Male | 301 (82.5%) | $27,639 |
| Female | 64 (17.5%) | $22,500 |
| Total | 365 (100.0%) | $27,188 |
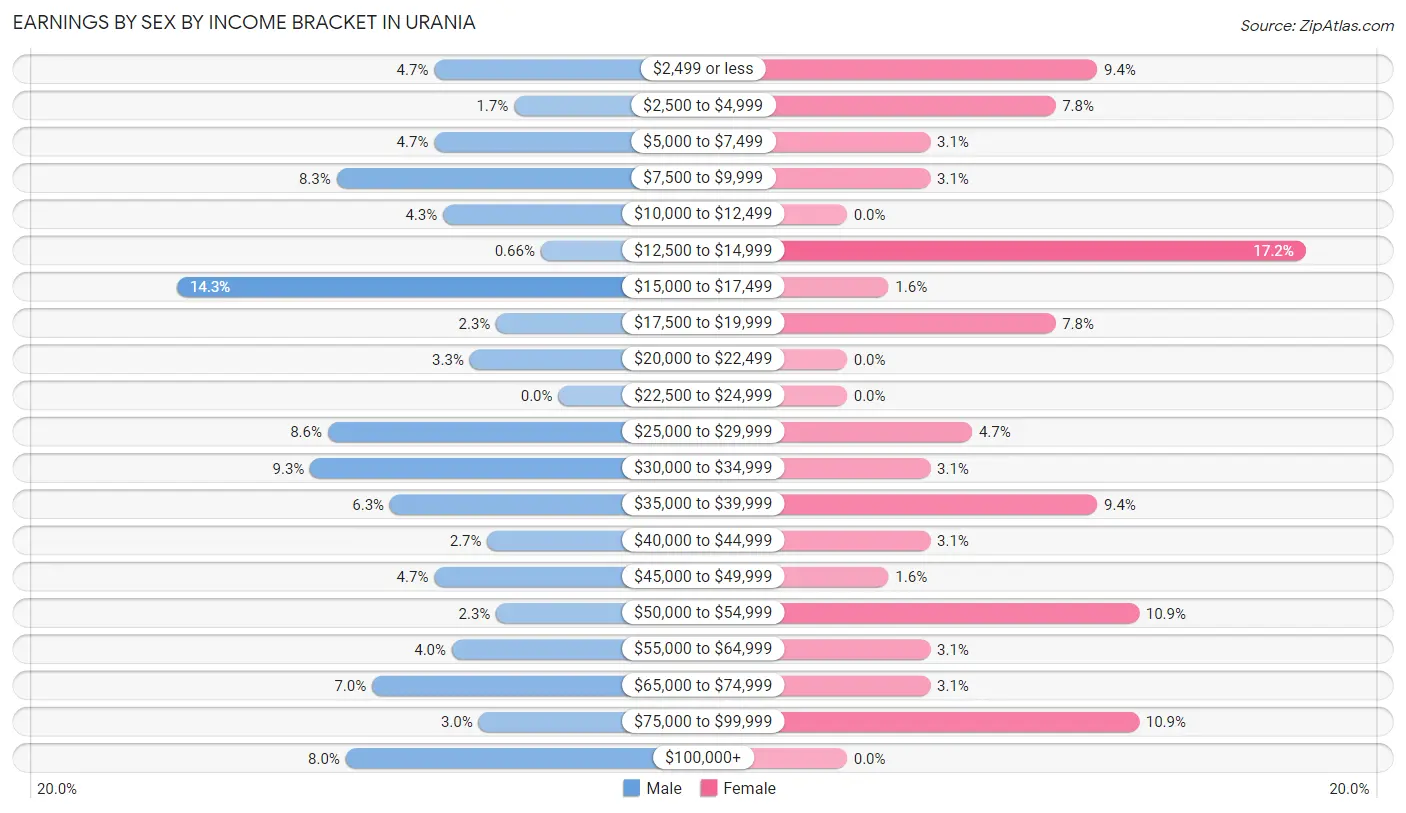
Earnings by Sex by Income Bracket in Urania
The most common earnings brackets in Urania are $15,000 to $17,499 for men (43 | 14.3%) and $12,500 to $14,999 for women (11 | 17.2%).
| Income | Male | Female |
| $2,499 or less | 14 (4.6%) | 6 (9.4%) |
| $2,500 to $4,999 | 5 (1.7%) | 5 (7.8%) |
| $5,000 to $7,499 | 14 (4.6%) | 2 (3.1%) |
| $7,500 to $9,999 | 25 (8.3%) | 2 (3.1%) |
| $10,000 to $12,499 | 13 (4.3%) | 0 (0.0%) |
| $12,500 to $14,999 | 2 (0.7%) | 11 (17.2%) |
| $15,000 to $17,499 | 43 (14.3%) | 1 (1.6%) |
| $17,500 to $19,999 | 7 (2.3%) | 5 (7.8%) |
| $20,000 to $22,499 | 10 (3.3%) | 0 (0.0%) |
| $22,500 to $24,999 | 0 (0.0%) | 0 (0.0%) |
| $25,000 to $29,999 | 26 (8.6%) | 3 (4.7%) |
| $30,000 to $34,999 | 28 (9.3%) | 2 (3.1%) |
| $35,000 to $39,999 | 19 (6.3%) | 6 (9.4%) |
| $40,000 to $44,999 | 8 (2.7%) | 2 (3.1%) |
| $45,000 to $49,999 | 14 (4.6%) | 1 (1.6%) |
| $50,000 to $54,999 | 7 (2.3%) | 7 (10.9%) |
| $55,000 to $64,999 | 12 (4.0%) | 2 (3.1%) |
| $65,000 to $74,999 | 21 (7.0%) | 2 (3.1%) |
| $75,000 to $99,999 | 9 (3.0%) | 7 (10.9%) |
| $100,000+ | 24 (8.0%) | 0 (0.0%) |
| Total | 301 (100.0%) | 64 (100.0%) |
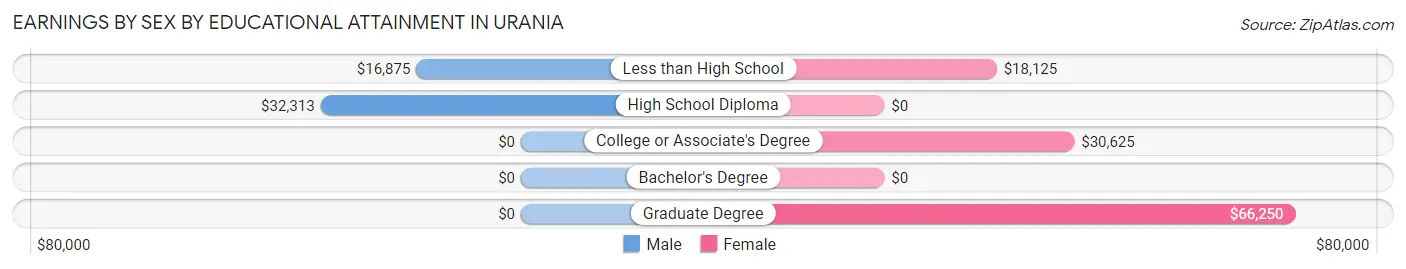
Earnings by Sex by Educational Attainment in Urania
Average earnings in Urania are $30,417 for men and $31,250 for women, a difference of 2.7%. Men with an educational attainment of high school diploma enjoy the highest average annual earnings of $32,313, while those with less than high school education earn the least with $16,875. Women with an educational attainment of graduate degree earn the most with the average annual earnings of $66,250, while those with less than high school education have the smallest earnings of $18,125.
| Educational Attainment | Male Income | Female Income |
| Less than High School | $16,875 | $18,125 |
| High School Diploma | $32,313 | $0 |
| College or Associate's Degree | - | - |
| Bachelor's Degree | - | - |
| Graduate Degree | - | - |
| Total | $30,417 | $31,250 |
Family Income in Urania
Family Income Brackets in Urania
According to the Urania family income data, there are 29 families falling into the $100,000 to $149,999 income range, which is the most common income bracket and makes up 26.6% of all families.
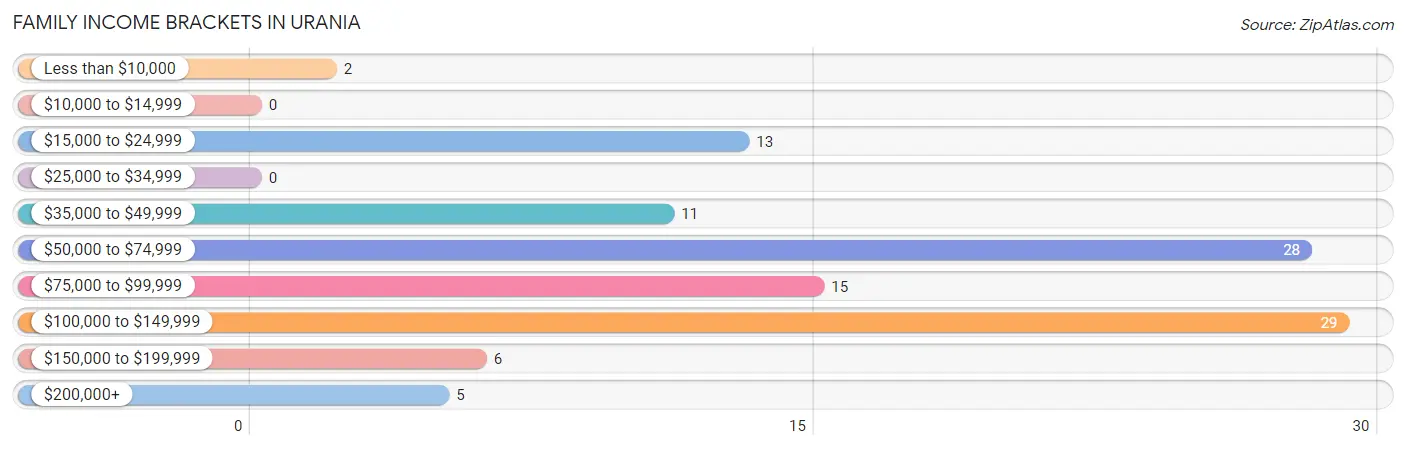
| Income Bracket | # Families | % Families |
| Less than $10,000 | 2 | 1.8% |
| $10,000 to $14,999 | 0 | 0.0% |
| $15,000 to $24,999 | 13 | 11.9% |
| $25,000 to $34,999 | 0 | 0.0% |
| $35,000 to $49,999 | 11 | 10.1% |
| $50,000 to $74,999 | 28 | 25.7% |
| $75,000 to $99,999 | 15 | 13.8% |
| $100,000 to $149,999 | 29 | 26.6% |
| $150,000 to $199,999 | 6 | 5.5% |
| $200,000+ | 5 | 4.6% |
Family Income by Famaliy Size in Urania
5-person families (21 | 19.3%) account for the highest median family income in Urania with $111,042 per family, while 2-person families (45 | 41.3%) have the highest median income of $34,479 per family member.
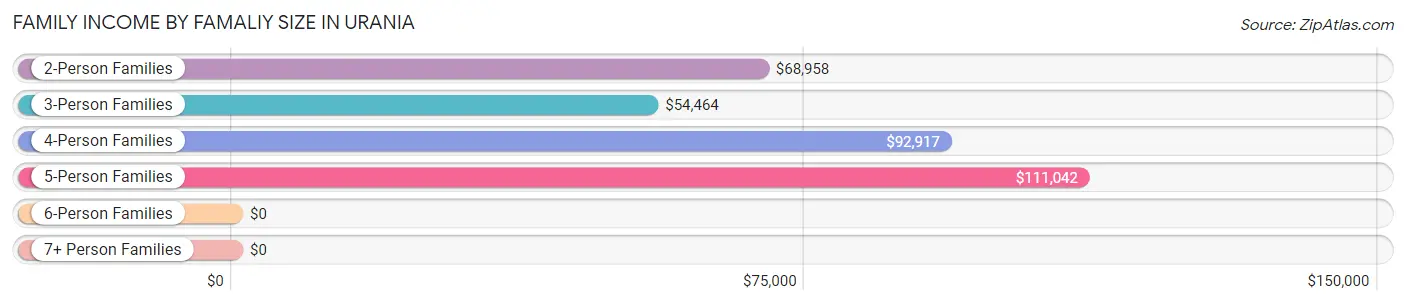
| Income Bracket | # Families | Median Income |
| 2-Person Families | 45 (41.3%) | $68,958 |
| 3-Person Families | 17 (15.6%) | $54,464 |
| 4-Person Families | 23 (21.1%) | $92,917 |
| 5-Person Families | 21 (19.3%) | $111,042 |
| 6-Person Families | 3 (2.8%) | $0 |
| 7+ Person Families | 0 (0.0%) | $0 |
| Total | 109 (100.0%) | $75,625 |
Family Income by Number of Earners in Urania
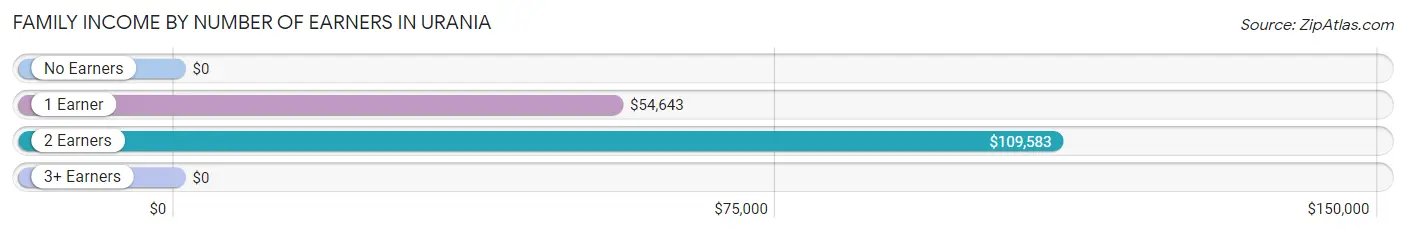
| Number of Earners | # Families | Median Income |
| No Earners | 10 (9.2%) | $0 |
| 1 Earner | 48 (44.0%) | $54,643 |
| 2 Earners | 45 (41.3%) | $109,583 |
| 3+ Earners | 6 (5.5%) | $0 |
| Total | 109 (100.0%) | $75,625 |
Household Income in Urania
Household Income Brackets in Urania
With 40 households falling in the category, the $100,000 to $149,999 income range is the most frequent in Urania, accounting for 19.9% of all households. In contrast, only 5 households (2.5%) fall into the $200,000+ income bracket, making it the least populous group.
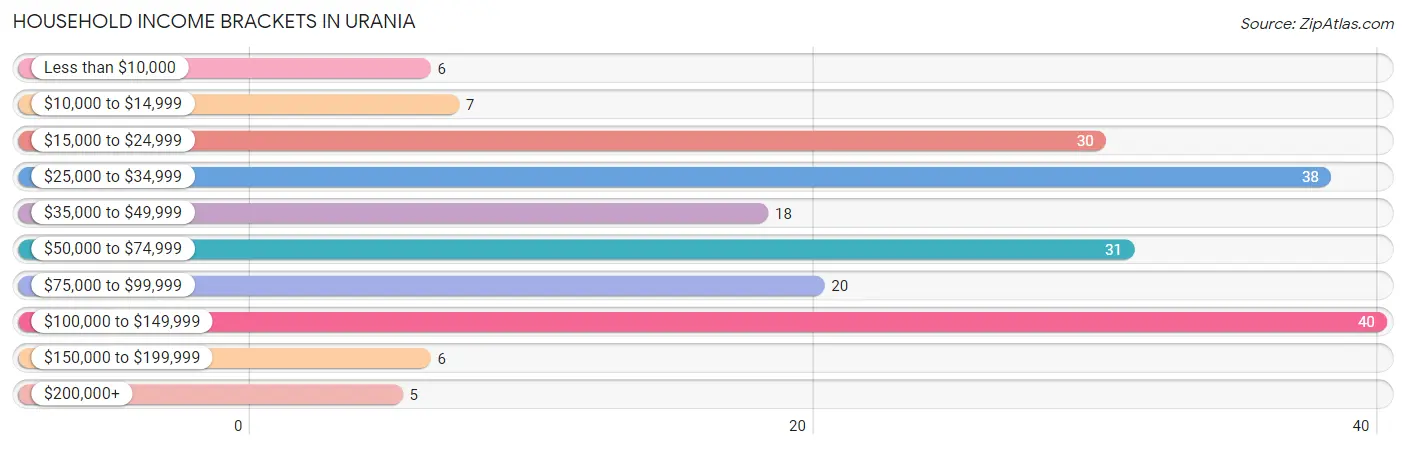
| Income Bracket | # Households | % Households |
| Less than $10,000 | 6 | 3.0% |
| $10,000 to $14,999 | 7 | 3.5% |
| $15,000 to $24,999 | 30 | 14.9% |
| $25,000 to $34,999 | 38 | 18.9% |
| $35,000 to $49,999 | 18 | 9.0% |
| $50,000 to $74,999 | 31 | 15.4% |
| $75,000 to $99,999 | 20 | 10.0% |
| $100,000 to $149,999 | 40 | 19.9% |
| $150,000 to $199,999 | 6 | 3.0% |
| $200,000+ | 5 | 2.5% |
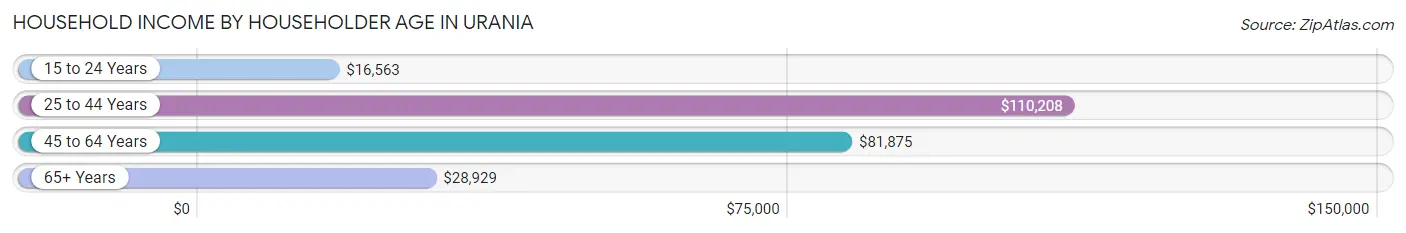
Household Income by Householder Age in Urania
The median household income in Urania is $54,375, with the highest median household income of $110,208 found in the 25 to 44 years age bracket for the primary householder. A total of 51 households (25.4%) fall into this category. Meanwhile, the 15 to 24 years age bracket for the primary householder has the lowest median household income of $16,563, with 5 households (2.5%) in this group.
| Income Bracket | # Households | Median Income |
| 15 to 24 Years | 5 (2.5%) | $16,563 |
| 25 to 44 Years | 51 (25.4%) | $110,208 |
| 45 to 64 Years | 57 (28.4%) | $81,875 |
| 65+ Years | 88 (43.8%) | $28,929 |
| Total | 201 (100.0%) | $54,375 |
Poverty in Urania
Income Below Poverty by Sex and Age in Urania
With 4.2% poverty level for males and 16.6% for females among the residents of Urania, under 5 year old males and 18 to 24 year old females are the most vulnerable to poverty, with 2 males (22.2%) and 28 females (90.3%) in their respective age groups living below the poverty level.
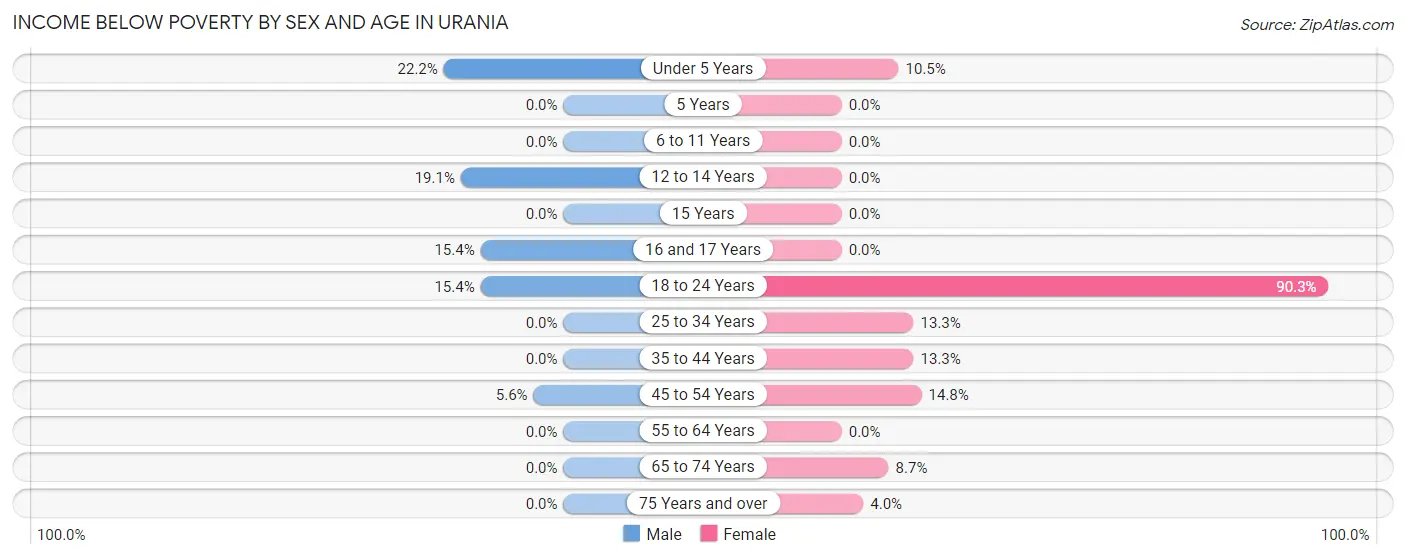
| Age Bracket | Male | Female |
| Under 5 Years | 2 (22.2%) | 2 (10.5%) |
| 5 Years | 0 (0.0%) | 0 (0.0%) |
| 6 to 11 Years | 0 (0.0%) | 0 (0.0%) |
| 12 to 14 Years | 4 (19.1%) | 0 (0.0%) |
| 15 Years | 0 (0.0%) | 0 (0.0%) |
| 16 and 17 Years | 2 (15.4%) | 0 (0.0%) |
| 18 to 24 Years | 2 (15.4%) | 28 (90.3%) |
| 25 to 34 Years | 0 (0.0%) | 2 (13.3%) |
| 35 to 44 Years | 0 (0.0%) | 4 (13.3%) |
| 45 to 54 Years | 2 (5.6%) | 4 (14.8%) |
| 55 to 64 Years | 0 (0.0%) | 0 (0.0%) |
| 65 to 74 Years | 0 (0.0%) | 2 (8.7%) |
| 75 Years and over | 0 (0.0%) | 2 (4.0%) |
| Total | 12 (4.2%) | 44 (16.6%) |
Income Above Poverty by Sex and Age in Urania
According to the poverty statistics in Urania, males aged 6 to 11 years and females aged 6 to 11 years are the age groups that are most secure financially, with 100.0% of males and 100.0% of females in these age groups living above the poverty line.
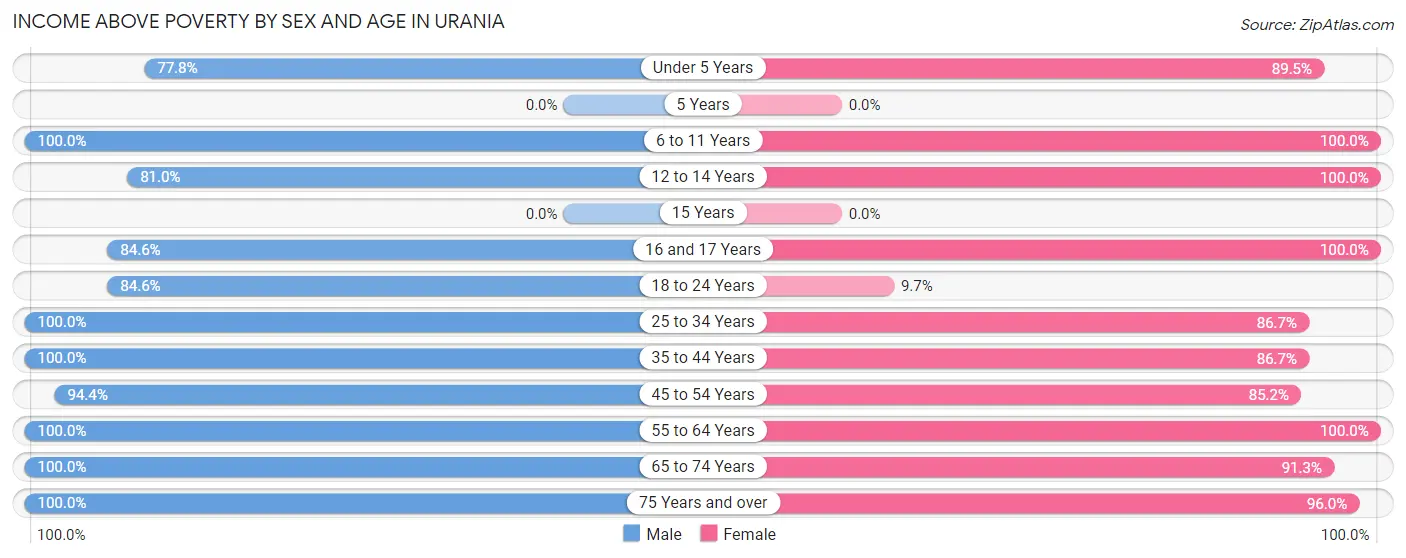
| Age Bracket | Male | Female |
| Under 5 Years | 7 (77.8%) | 17 (89.5%) |
| 5 Years | 0 (0.0%) | 0 (0.0%) |
| 6 to 11 Years | 46 (100.0%) | 10 (100.0%) |
| 12 to 14 Years | 17 (80.9%) | 17 (100.0%) |
| 15 Years | 0 (0.0%) | 0 (0.0%) |
| 16 and 17 Years | 11 (84.6%) | 12 (100.0%) |
| 18 to 24 Years | 11 (84.6%) | 3 (9.7%) |
| 25 to 34 Years | 24 (100.0%) | 13 (86.7%) |
| 35 to 44 Years | 65 (100.0%) | 26 (86.7%) |
| 45 to 54 Years | 34 (94.4%) | 23 (85.2%) |
| 55 to 64 Years | 24 (100.0%) | 31 (100.0%) |
| 65 to 74 Years | 26 (100.0%) | 21 (91.3%) |
| 75 Years and over | 12 (100.0%) | 48 (96.0%) |
| Total | 277 (95.9%) | 221 (83.4%) |
Income Below Poverty Among Married-Couple Families in Urania
The poverty statistics for married-couple families in Urania show that 6.0% or 5 of the total 83 families live below the poverty line. Families with 1 or 2 children have the highest poverty rate of 10.3%, comprising of 3 families. On the other hand, families with 3 or 4 children have the lowest poverty rate of 0.0%, which includes 0 families.
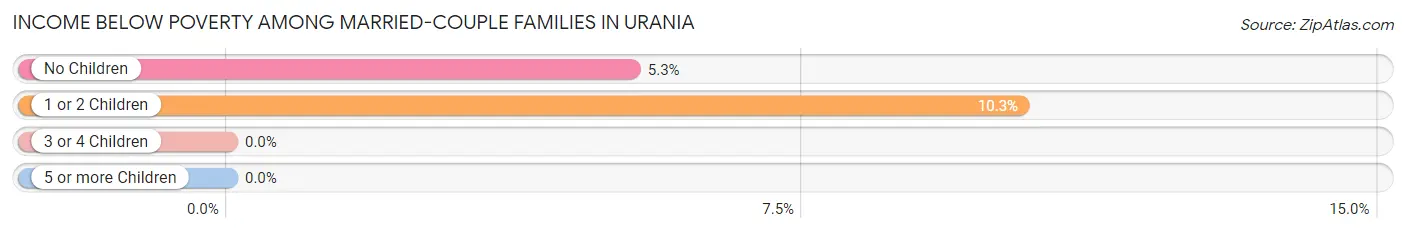
| Children | Above Poverty | Below Poverty |
| No Children | 36 (94.7%) | 2 (5.3%) |
| 1 or 2 Children | 26 (89.7%) | 3 (10.3%) |
| 3 or 4 Children | 16 (100.0%) | 0 (0.0%) |
| 5 or more Children | 0 (0.0%) | 0 (0.0%) |
| Total | 78 (94.0%) | 5 (6.0%) |
Income Below Poverty Among Single-Parent Households in Urania
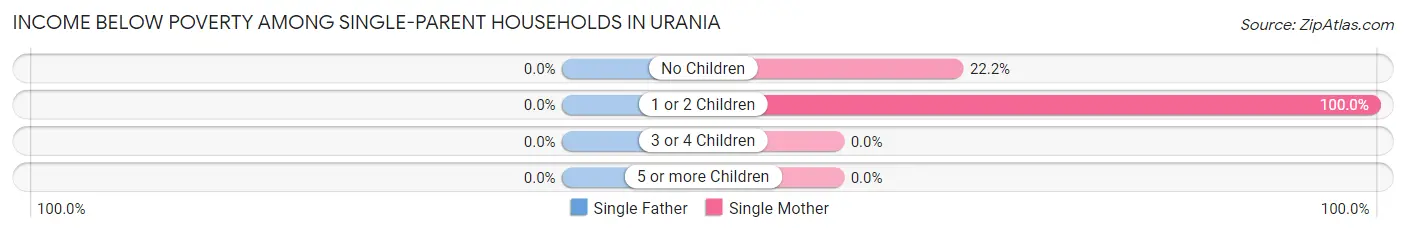
| Children | Single Father | Single Mother |
| No Children | 0 (0.0%) | 2 (22.2%) |
| 1 or 2 Children | 0 (0.0%) | 2 (100.0%) |
| 3 or 4 Children | 0 (0.0%) | 0 (0.0%) |
| 5 or more Children | 0 (0.0%) | 0 (0.0%) |
| Total | 0 (0.0%) | 4 (28.6%) |
Income Below Poverty Among Married-Couple vs Single-Parent Households in Urania
The poverty data for Urania shows that 5 of the married-couple family households (6.0%) and 4 of the single-parent households (15.4%) are living below the poverty level. Within the married-couple family households, those with 1 or 2 children have the highest poverty rate, with 3 households (10.3%) falling below the poverty line. Among the single-parent households, those with 1 or 2 children have the highest poverty rate, with 2 household (22.2%) living below poverty.
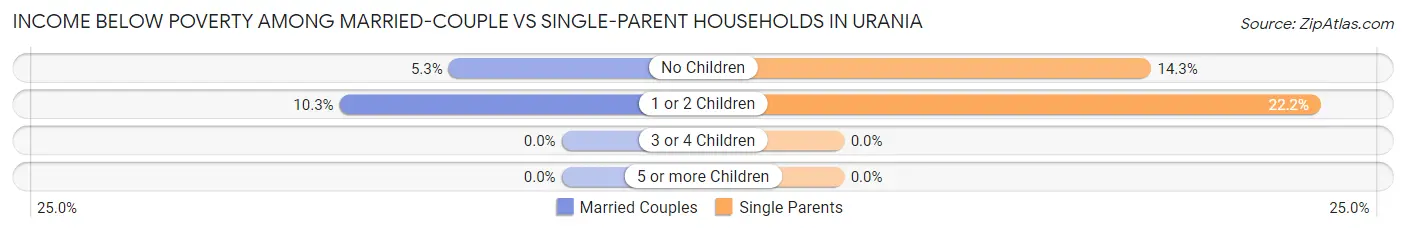
| Children | Married-Couple Families | Single-Parent Households |
| No Children | 2 (5.3%) | 2 (14.3%) |
| 1 or 2 Children | 3 (10.3%) | 2 (22.2%) |
| 3 or 4 Children | 0 (0.0%) | 0 (0.0%) |
| 5 or more Children | 0 (0.0%) | 0 (0.0%) |
| Total | 5 (6.0%) | 4 (15.4%) |
Race in Urania
The most populous races in Urania are White / Caucasian (700 | 57.4%), Black / African American (432 | 35.4%), and Two or more Races (60 | 4.9%).
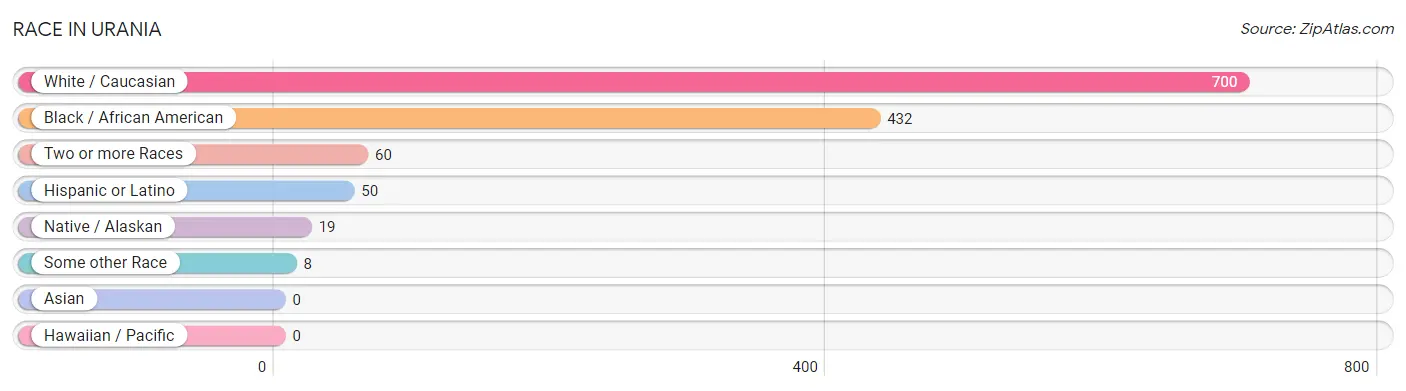
| Race | # Population | % Population |
| Asian | 0 | 0.0% |
| Black / African American | 432 | 35.4% |
| Hawaiian / Pacific | 0 | 0.0% |
| Hispanic or Latino | 50 | 4.1% |
| Native / Alaskan | 19 | 1.6% |
| White / Caucasian | 700 | 57.4% |
| Two or more Races | 60 | 4.9% |
| Some other Race | 8 | 0.7% |
| Total | 1,219 | 100.0% |
Ancestry in Urania
The most populous ancestries reported in Urania are American (496 | 40.7%), English (49 | 4.0%), Scotch-Irish (19 | 1.6%), German (15 | 1.2%), and Houma (10 | 0.8%), together accounting for 48.3% of all Urania residents.
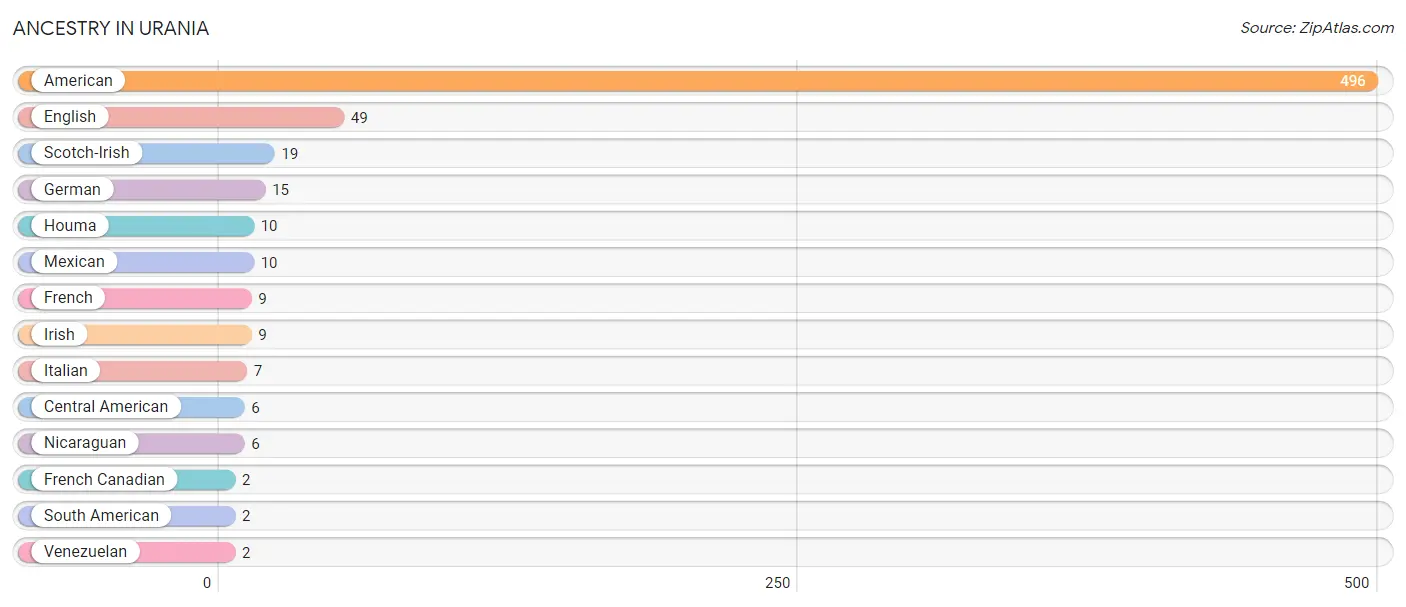
| Ancestry | # Population | % Population |
| American | 496 | 40.7% |
| Central American | 6 | 0.5% |
| English | 49 | 4.0% |
| French | 9 | 0.7% |
| French Canadian | 2 | 0.2% |
| German | 15 | 1.2% |
| Houma | 10 | 0.8% |
| Irish | 9 | 0.7% |
| Italian | 7 | 0.6% |
| Mexican | 10 | 0.8% |
| Nicaraguan | 6 | 0.5% |
| Scotch-Irish | 19 | 1.6% |
| South American | 2 | 0.2% |
| Venezuelan | 2 | 0.2% | View All 14 Rows |
Immigrants in Urania
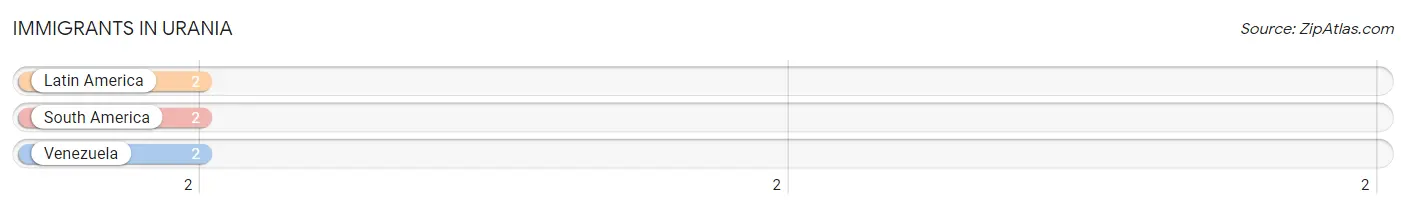
The most numerous immigrant groups reported in Urania came from Latin America (2 | 0.2%), South America (2 | 0.2%), and Venezuela (2 | 0.2%), together accounting for 0.5% of all Urania residents.
| Immigration Origin | # Population | % Population |
| Latin America | 2 | 0.2% |
| South America | 2 | 0.2% |
| Venezuela | 2 | 0.2% | View All 3 Rows |
Sex and Age in Urania
Sex and Age in Urania
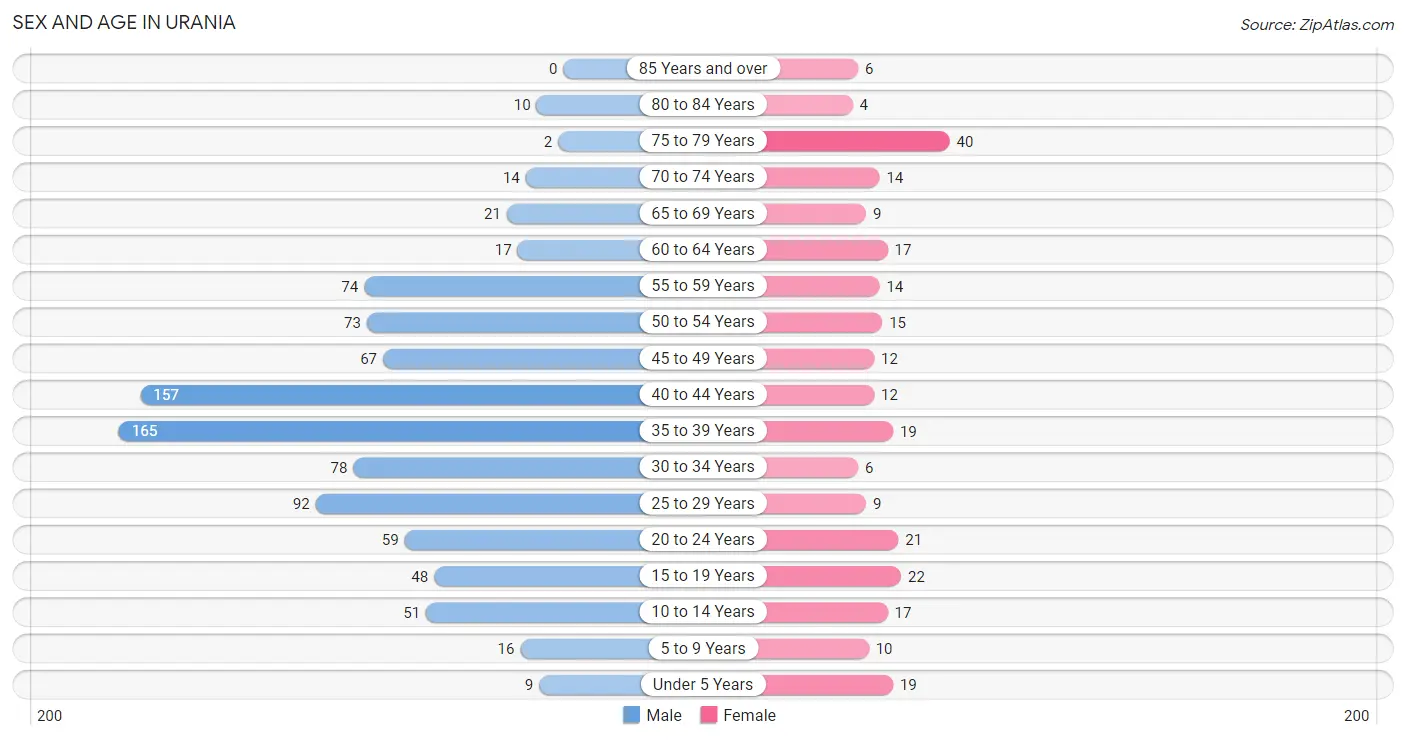
The most populous age groups in Urania are 35 to 39 Years (165 | 17.3%) for men and 75 to 79 Years (40 | 15.0%) for women.
| Age Bracket | Male | Female |
| Under 5 Years | 9 (0.9%) | 19 (7.1%) |
| 5 to 9 Years | 16 (1.7%) | 10 (3.8%) |
| 10 to 14 Years | 51 (5.3%) | 17 (6.4%) |
| 15 to 19 Years | 48 (5.0%) | 22 (8.3%) |
| 20 to 24 Years | 59 (6.2%) | 21 (7.9%) |
| 25 to 29 Years | 92 (9.7%) | 9 (3.4%) |
| 30 to 34 Years | 78 (8.2%) | 6 (2.3%) |
| 35 to 39 Years | 165 (17.3%) | 19 (7.1%) |
| 40 to 44 Years | 157 (16.5%) | 12 (4.5%) |
| 45 to 49 Years | 67 (7.0%) | 12 (4.5%) |
| 50 to 54 Years | 73 (7.7%) | 15 (5.6%) |
| 55 to 59 Years | 74 (7.8%) | 14 (5.3%) |
| 60 to 64 Years | 17 (1.8%) | 17 (6.4%) |
| 65 to 69 Years | 21 (2.2%) | 9 (3.4%) |
| 70 to 74 Years | 14 (1.5%) | 14 (5.3%) |
| 75 to 79 Years | 2 (0.2%) | 40 (15.0%) |
| 80 to 84 Years | 10 (1.1%) | 4 (1.5%) |
| 85 Years and over | 0 (0.0%) | 6 (2.3%) |
| Total | 953 (100.0%) | 266 (100.0%) |
Families and Households in Urania
Median Family Size in Urania
The median family size in Urania is 4.06 persons per family, with single female/mother families (14 | 12.8%) accounting for the largest median family size of 5.21 persons per family. On the other hand, single male/father families (12 | 11.0%) represent the smallest median family size with 2.83 persons per family.
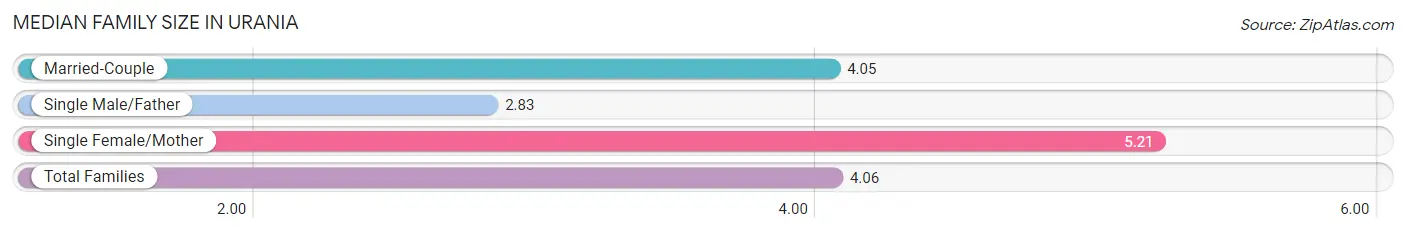
| Family Type | # Families | Family Size |
| Married-Couple | 83 (76.1%) | 4.05 |
| Single Male/Father | 12 (11.0%) | 2.83 |
| Single Female/Mother | 14 (12.8%) | 5.21 |
| Total Families | 109 (100.0%) | 4.06 |
Median Household Size in Urania
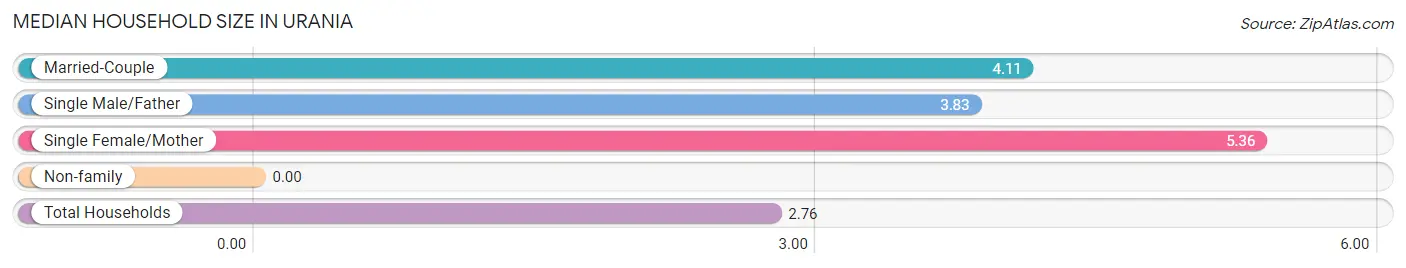
| Household Type | # Households | Household Size |
| Married-Couple | 83 (41.3%) | 4.11 |
| Single Male/Father | 12 (6.0%) | 3.83 |
| Single Female/Mother | 14 (7.0%) | 5.36 |
| Non-family | 92 (45.8%) | - |
| Total Households | 201 (100.0%) | 2.76 |
Household Size by Marriage Status in Urania
Out of a total of 201 households in Urania, 109 (54.2%) are family households, while 92 (45.8%) are nonfamily households. The most numerous type of family households are 2-person households, comprising 40, and the most common type of nonfamily households are 1-person households, comprising 92.
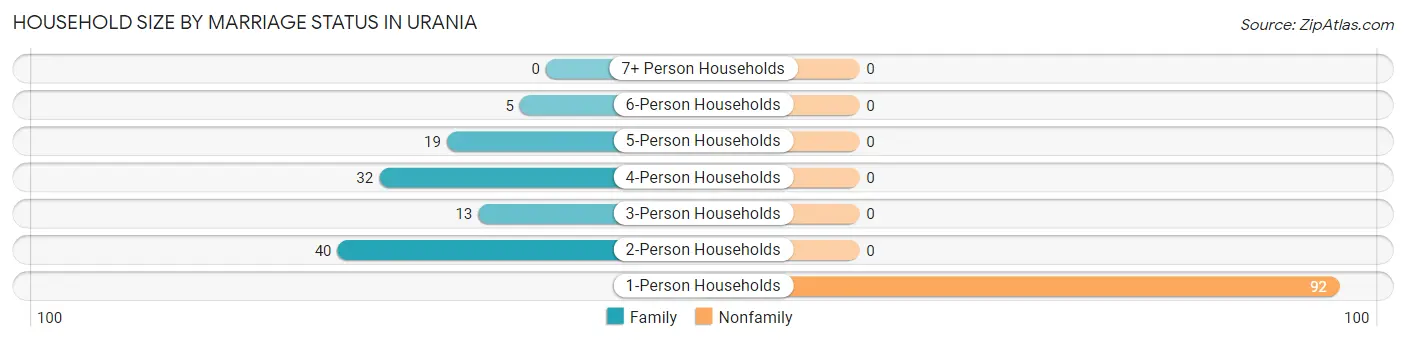
| Household Size | Family Households | Nonfamily Households |
| 1-Person Households | - | 92 (45.8%) |
| 2-Person Households | 40 (19.9%) | 0 (0.0%) |
| 3-Person Households | 13 (6.5%) | 0 (0.0%) |
| 4-Person Households | 32 (15.9%) | 0 (0.0%) |
| 5-Person Households | 19 (9.5%) | 0 (0.0%) |
| 6-Person Households | 5 (2.5%) | 0 (0.0%) |
| 7+ Person Households | 0 (0.0%) | 0 (0.0%) |
| Total | 109 (54.2%) | 92 (45.8%) |
Female Fertility in Urania
Fertility by Age in Urania
Average fertility rate in Urania is 118.0 births per 1,000 women. Women in the age bracket of 20 to 34 years have the highest fertility rate with 333.0 births per 1,000 women. Women in the age bracket of 20 to 34 years acount for 100.0% of all women with births.
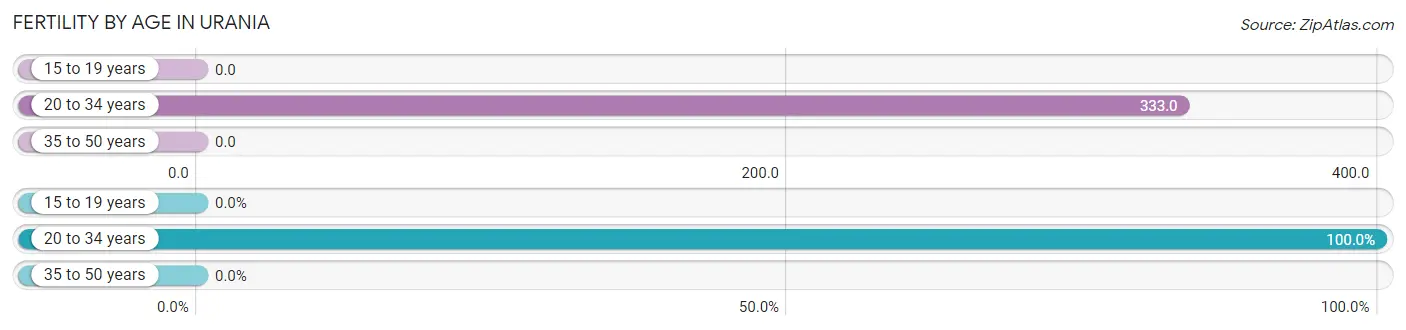
| Age Bracket | Women with Births | Births / 1,000 Women |
| 15 to 19 years | 0 (0.0%) | 0.0 |
| 20 to 34 years | 12 (100.0%) | 333.0 |
| 35 to 50 years | 0 (0.0%) | 0.0 |
| Total | 12 (100.0%) | 118.0 |
Fertility by Age by Marriage Status in Urania
66.7% of women with births (12) in Urania are married. The highest percentage of unmarried women with births falls into 20 to 34 years age bracket with 33.3% of them unmarried at the time of birth, while the lowest percentage of unmarried women with births belong to 20 to 34 years age bracket with 33.3% of them unmarried.
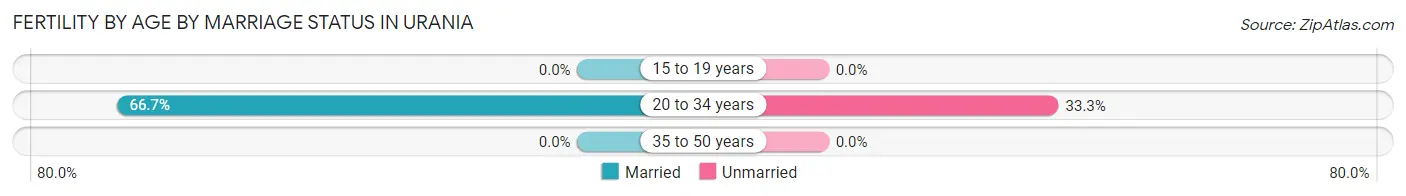
| Age Bracket | Married | Unmarried |
| 15 to 19 years | 0 (0.0%) | 0 (0.0%) |
| 20 to 34 years | 8 (66.7%) | 4 (33.3%) |
| 35 to 50 years | 0 (0.0%) | 0 (0.0%) |
| Total | 8 (66.7%) | 4 (33.3%) |
Fertility by Education in Urania
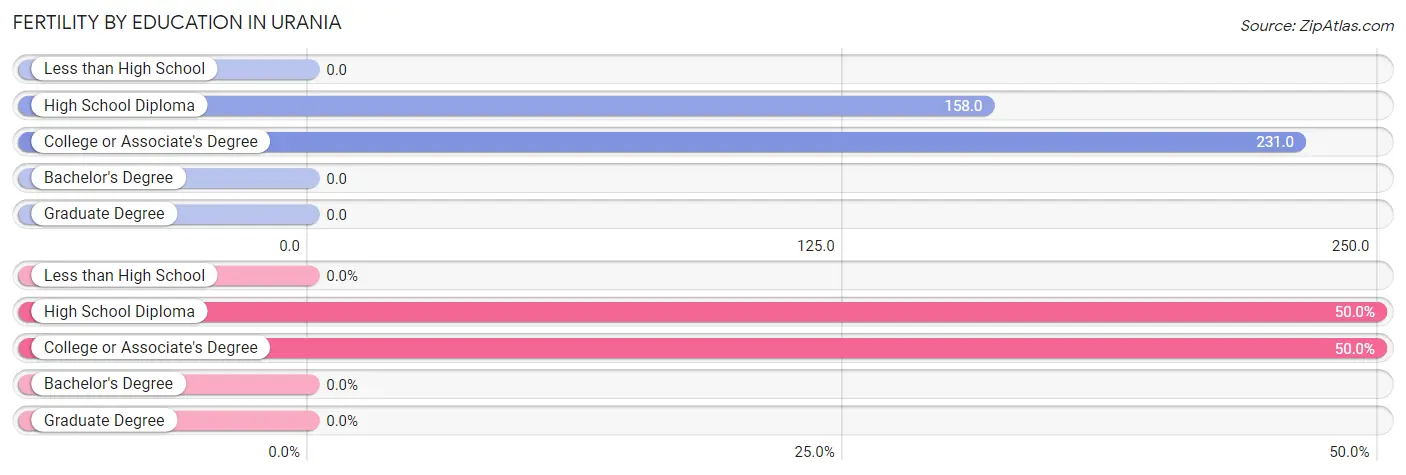
| Educational Attainment | Women with Births | Births / 1,000 Women |
| Less than High School | 0 (0.0%) | 0.0 |
| High School Diploma | 6 (50.0%) | 158.0 |
| College or Associate's Degree | 6 (50.0%) | 231.0 |
| Bachelor's Degree | 0 (0.0%) | 0.0 |
| Graduate Degree | 0 (0.0%) | 0.0 |
| Total | 12 (100.0%) | 118.0 |
Fertility by Education by Marriage Status in Urania
33.3% of women with births in Urania are unmarried. Women with the educational attainment of college or associate's degree are most likely to be married with 100.0% of them married at childbirth, while women with the educational attainment of high school diploma are least likely to be married with 66.7% of them unmarried at childbirth.
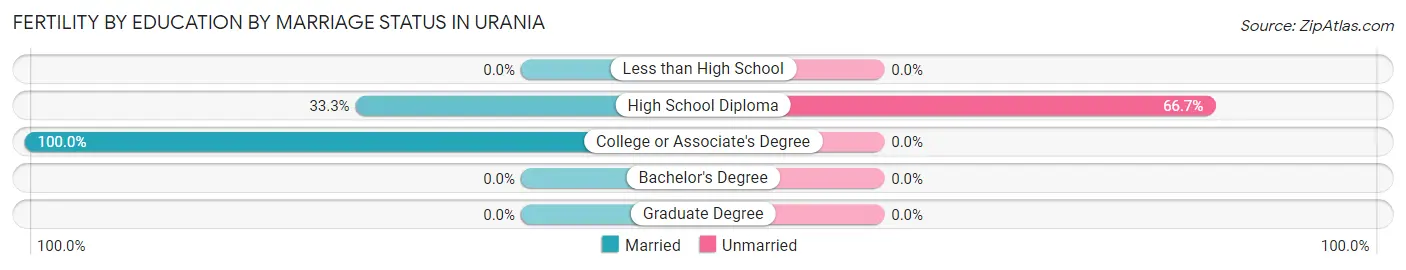
| Educational Attainment | Married | Unmarried |
| Less than High School | 0 (0.0%) | 0 (0.0%) |
| High School Diploma | 2 (33.3%) | 4 (66.7%) |
| College or Associate's Degree | 6 (100.0%) | 0 (0.0%) |
| Bachelor's Degree | 0 (0.0%) | 0 (0.0%) |
| Graduate Degree | 0 (0.0%) | 0 (0.0%) |
| Total | 8 (66.7%) | 4 (33.3%) |
Employment Characteristics in Urania
Employment by Class of Employer in Urania
Among the 193 employed individuals in Urania, private company employees (147 | 76.2%), not-for-profit organizations (19 | 9.8%), and federal government employees (10 | 5.2%) make up the most common classes of employment.
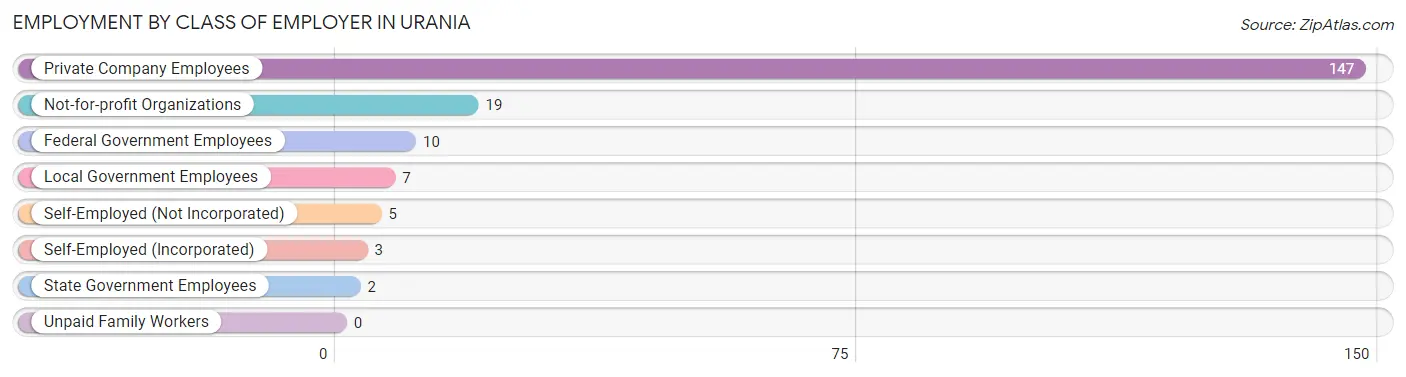
| Employer Class | # Employees | % Employees |
| Private Company Employees | 147 | 76.2% |
| Self-Employed (Incorporated) | 3 | 1.5% |
| Self-Employed (Not Incorporated) | 5 | 2.6% |
| Not-for-profit Organizations | 19 | 9.8% |
| Local Government Employees | 7 | 3.6% |
| State Government Employees | 2 | 1.0% |
| Federal Government Employees | 10 | 5.2% |
| Unpaid Family Workers | 0 | 0.0% |
| Total | 193 | 100.0% |
Employment Status by Age in Urania
According to the labor force statistics for Urania, out of the total population over 16 years of age (1,097), 19.0% or 208 individuals are in the labor force, with 7.2% or 15 of them unemployed. The age group with the highest labor force participation rate is 60 to 64 years, with 32.4% or 11 individuals in the labor force. Within the labor force, the 25 to 29 years age range has the highest percentage of unemployed individuals, with 27.3% or 6 of them being unemployed.
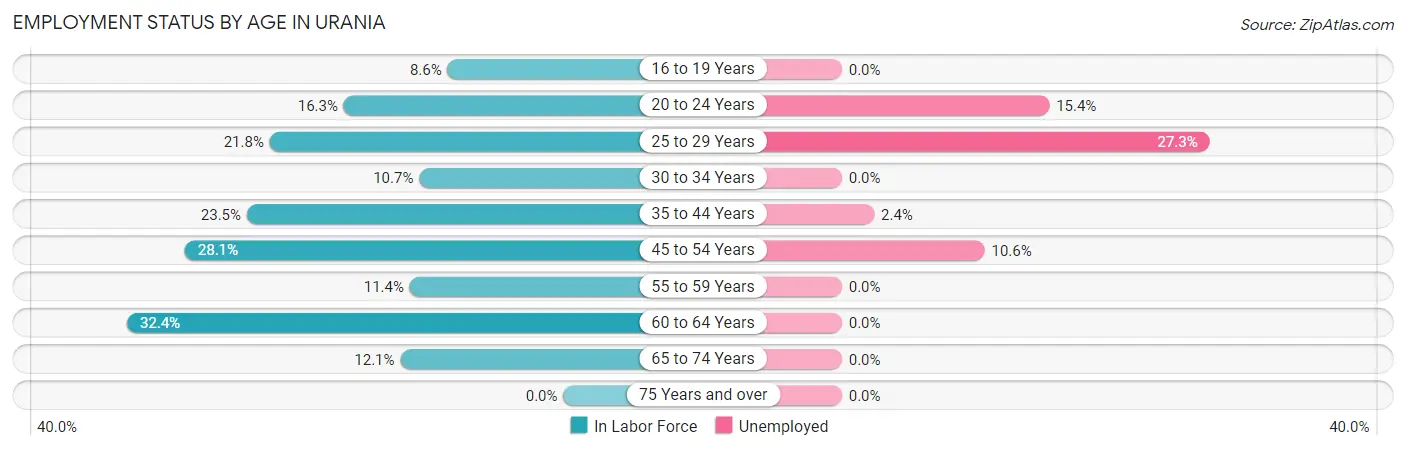
| Age Bracket | In Labor Force | Unemployed |
| 16 to 19 Years | 6 (8.6%) | 0 (0.0%) |
| 20 to 24 Years | 13 (16.3%) | 2 (15.4%) |
| 25 to 29 Years | 22 (21.8%) | 6 (27.3%) |
| 30 to 34 Years | 9 (10.7%) | 0 (0.0%) |
| 35 to 44 Years | 83 (23.5%) | 2 (2.4%) |
| 45 to 54 Years | 47 (28.1%) | 5 (10.6%) |
| 55 to 59 Years | 10 (11.4%) | 0 (0.0%) |
| 60 to 64 Years | 11 (32.4%) | 0 (0.0%) |
| 65 to 74 Years | 7 (12.1%) | 0 (0.0%) |
| 75 Years and over | 0 (0.0%) | 0 (0.0%) |
| Total | 208 (19.0%) | 15 (7.2%) |
Employment Status by Educational Attainment in Urania
According to labor force statistics for Urania, 22.0% of individuals (182) out of the total population between 25 and 64 years of age (827) are in the labor force, with 7.1% or 13 of them being unemployed. The group with the highest labor force participation rate are those with the educational attainment of bachelor's degree or higher, with 74.4% or 32 individuals in the labor force. Within the labor force, individuals with high school diploma education have the highest percentage of unemployment, with 13.4% or 11 of them being unemployed.
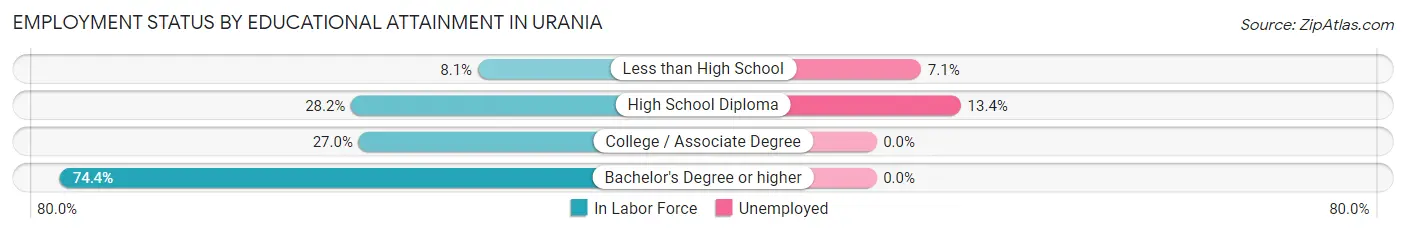
| Educational Attainment | In Labor Force | Unemployed |
| Less than High School | 28 (8.1%) | 24 (7.1%) |
| High School Diploma | 82 (28.2%) | 39 (13.4%) |
| College / Associate Degree | 40 (27.0%) | 0 (0.0%) |
| Bachelor's Degree or higher | 32 (74.4%) | 0 (0.0%) |
| Total | 182 (22.0%) | 59 (7.1%) |
Employment Occupations by Sex in Urania
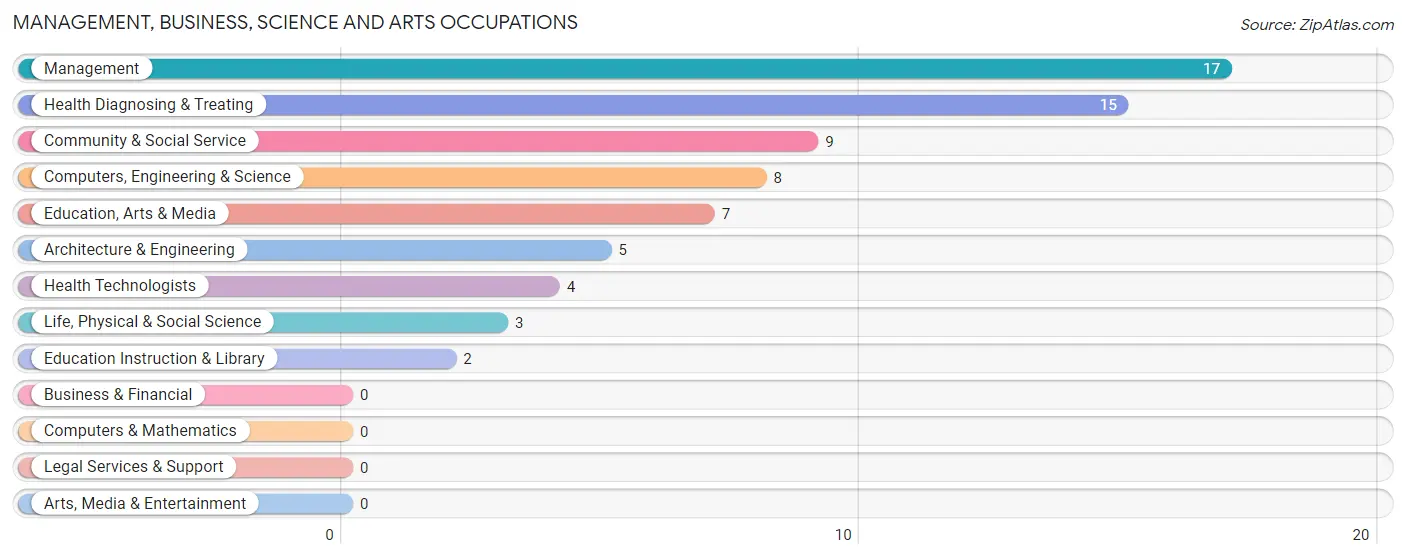
Management, Business, Science and Arts Occupations
The most common Management, Business, Science and Arts occupations in Urania are Management (17 | 8.8%), Health Diagnosing & Treating (15 | 7.8%), Community & Social Service (9 | 4.7%), Computers, Engineering & Science (8 | 4.2%), and Education, Arts & Media (7 | 3.6%).
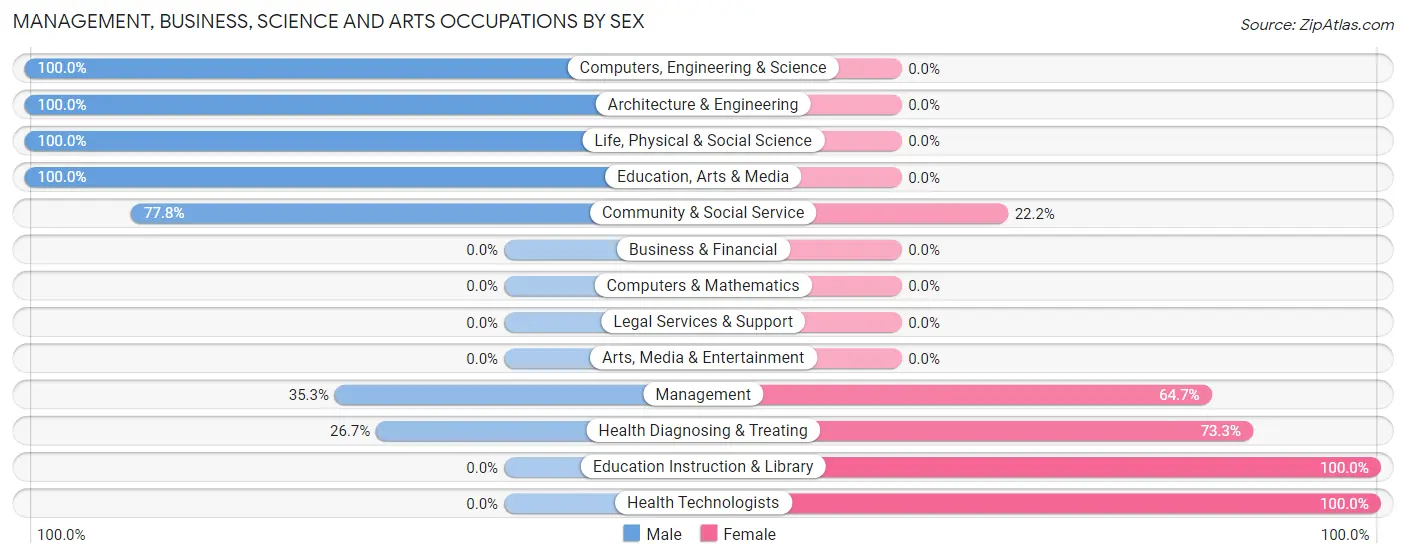
Management, Business, Science and Arts Occupations by Sex
Within the Management, Business, Science and Arts occupations in Urania, the most male-oriented occupations are Computers, Engineering & Science (100.0%), Architecture & Engineering (100.0%), and Life, Physical & Social Science (100.0%), while the most female-oriented occupations are Education Instruction & Library (100.0%), Health Technologists (100.0%), and Health Diagnosing & Treating (73.3%).
| Occupation | Male | Female |
| Management | 6 (35.3%) | 11 (64.7%) |
| Business & Financial | 0 (0.0%) | 0 (0.0%) |
| Computers, Engineering & Science | 8 (100.0%) | 0 (0.0%) |
| Computers & Mathematics | 0 (0.0%) | 0 (0.0%) |
| Architecture & Engineering | 5 (100.0%) | 0 (0.0%) |
| Life, Physical & Social Science | 3 (100.0%) | 0 (0.0%) |
| Community & Social Service | 7 (77.8%) | 2 (22.2%) |
| Education, Arts & Media | 7 (100.0%) | 0 (0.0%) |
| Legal Services & Support | 0 (0.0%) | 0 (0.0%) |
| Education Instruction & Library | 0 (0.0%) | 2 (100.0%) |
| Arts, Media & Entertainment | 0 (0.0%) | 0 (0.0%) |
| Health Diagnosing & Treating | 4 (26.7%) | 11 (73.3%) |
| Health Technologists | 0 (0.0%) | 4 (100.0%) |
| Total (Category) | 25 (51.0%) | 24 (49.0%) |
| Total (Overall) | 131 (67.9%) | 62 (32.1%) |
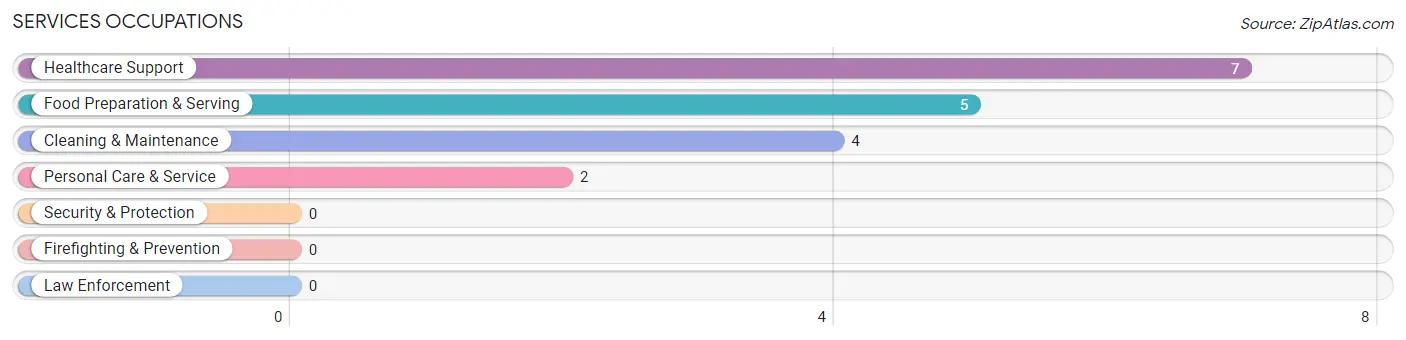
Services Occupations
The most common Services occupations in Urania are Healthcare Support (7 | 3.6%), Food Preparation & Serving (5 | 2.6%), Cleaning & Maintenance (4 | 2.1%), and Personal Care & Service (2 | 1.0%).
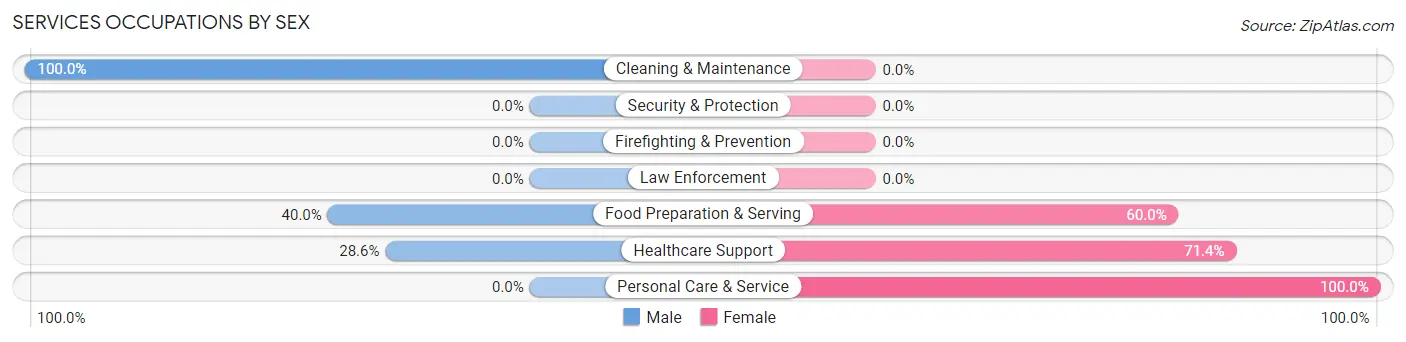
Services Occupations by Sex
Within the Services occupations in Urania, the most male-oriented occupations are Cleaning & Maintenance (100.0%), Food Preparation & Serving (40.0%), and Healthcare Support (28.6%), while the most female-oriented occupations are Personal Care & Service (100.0%), Healthcare Support (71.4%), and Food Preparation & Serving (60.0%).
| Occupation | Male | Female |
| Healthcare Support | 2 (28.6%) | 5 (71.4%) |
| Security & Protection | 0 (0.0%) | 0 (0.0%) |
| Firefighting & Prevention | 0 (0.0%) | 0 (0.0%) |
| Law Enforcement | 0 (0.0%) | 0 (0.0%) |
| Food Preparation & Serving | 2 (40.0%) | 3 (60.0%) |
| Cleaning & Maintenance | 4 (100.0%) | 0 (0.0%) |
| Personal Care & Service | 0 (0.0%) | 2 (100.0%) |
| Total (Category) | 8 (44.4%) | 10 (55.6%) |
| Total (Overall) | 131 (67.9%) | 62 (32.1%) |
Sales and Office Occupations
The most common Sales and Office occupations in Urania are Sales & Related (19 | 9.8%), and Office & Administration (8 | 4.2%).
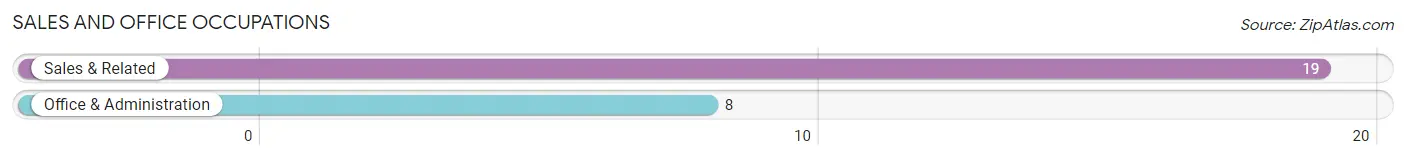
Sales and Office Occupations by Sex
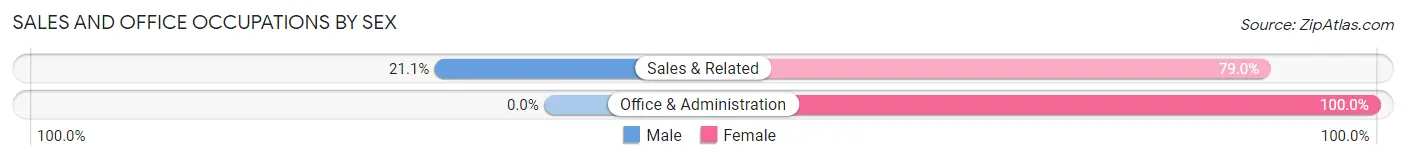
| Occupation | Male | Female |
| Sales & Related | 4 (21.0%) | 15 (78.9%) |
| Office & Administration | 0 (0.0%) | 8 (100.0%) |
| Total (Category) | 4 (14.8%) | 23 (85.2%) |
| Total (Overall) | 131 (67.9%) | 62 (32.1%) |
Natural Resources, Construction and Maintenance Occupations
The most common Natural Resources, Construction and Maintenance occupations in Urania are Construction & Extraction (22 | 11.4%), Installation, Maintenance & Repair (15 | 7.8%), and Farming, Fishing & Forestry (7 | 3.6%).
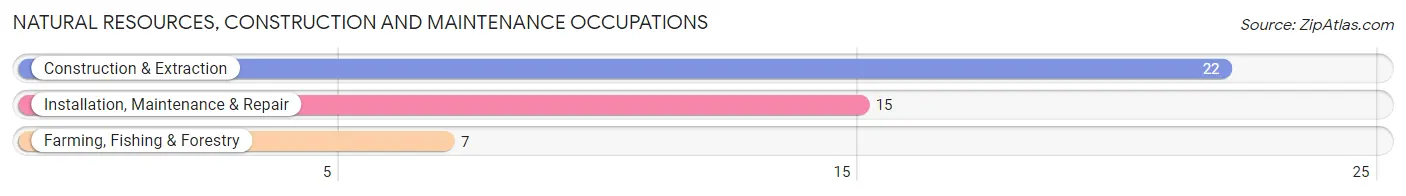
Natural Resources, Construction and Maintenance Occupations by Sex
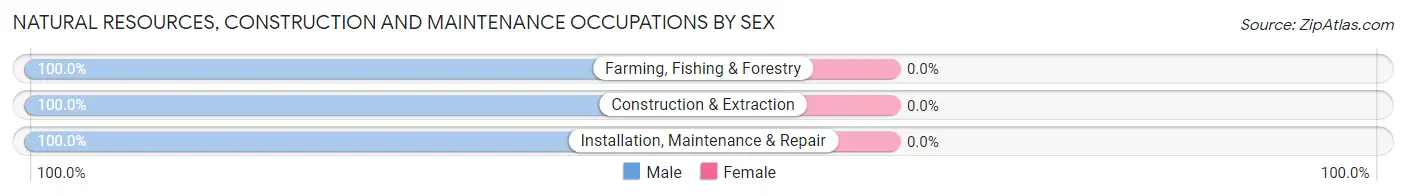
| Occupation | Male | Female |
| Farming, Fishing & Forestry | 7 (100.0%) | 0 (0.0%) |
| Construction & Extraction | 22 (100.0%) | 0 (0.0%) |
| Installation, Maintenance & Repair | 15 (100.0%) | 0 (0.0%) |
| Total (Category) | 44 (100.0%) | 0 (0.0%) |
| Total (Overall) | 131 (67.9%) | 62 (32.1%) |
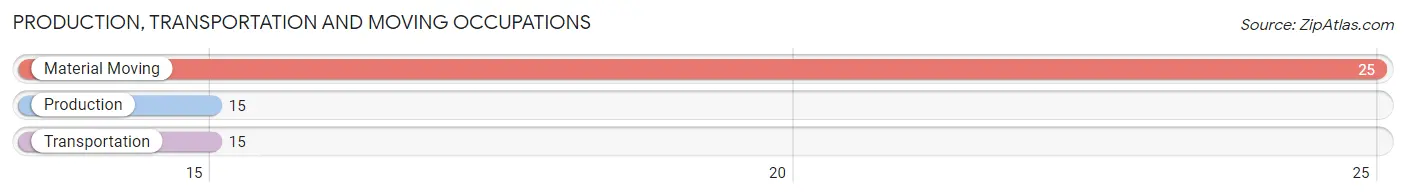
Production, Transportation and Moving Occupations
The most common Production, Transportation and Moving occupations in Urania are Material Moving (25 | 13.0%), Production (15 | 7.8%), and Transportation (15 | 7.8%).
Production, Transportation and Moving Occupations by Sex
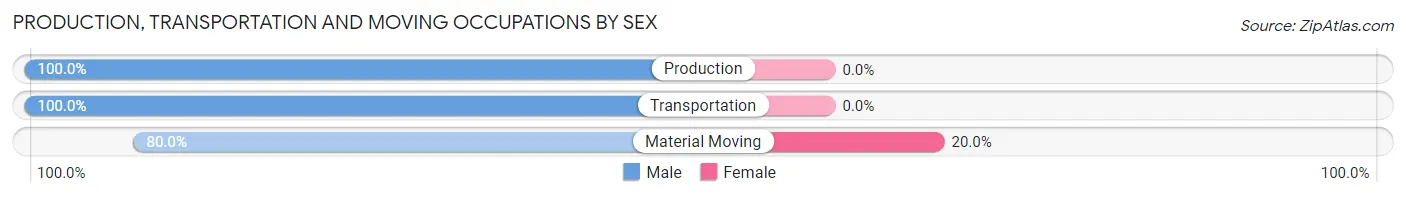
| Occupation | Male | Female |
| Production | 15 (100.0%) | 0 (0.0%) |
| Transportation | 15 (100.0%) | 0 (0.0%) |
| Material Moving | 20 (80.0%) | 5 (20.0%) |
| Total (Category) | 50 (90.9%) | 5 (9.1%) |
| Total (Overall) | 131 (67.9%) | 62 (32.1%) |
Employment Industries by Sex in Urania
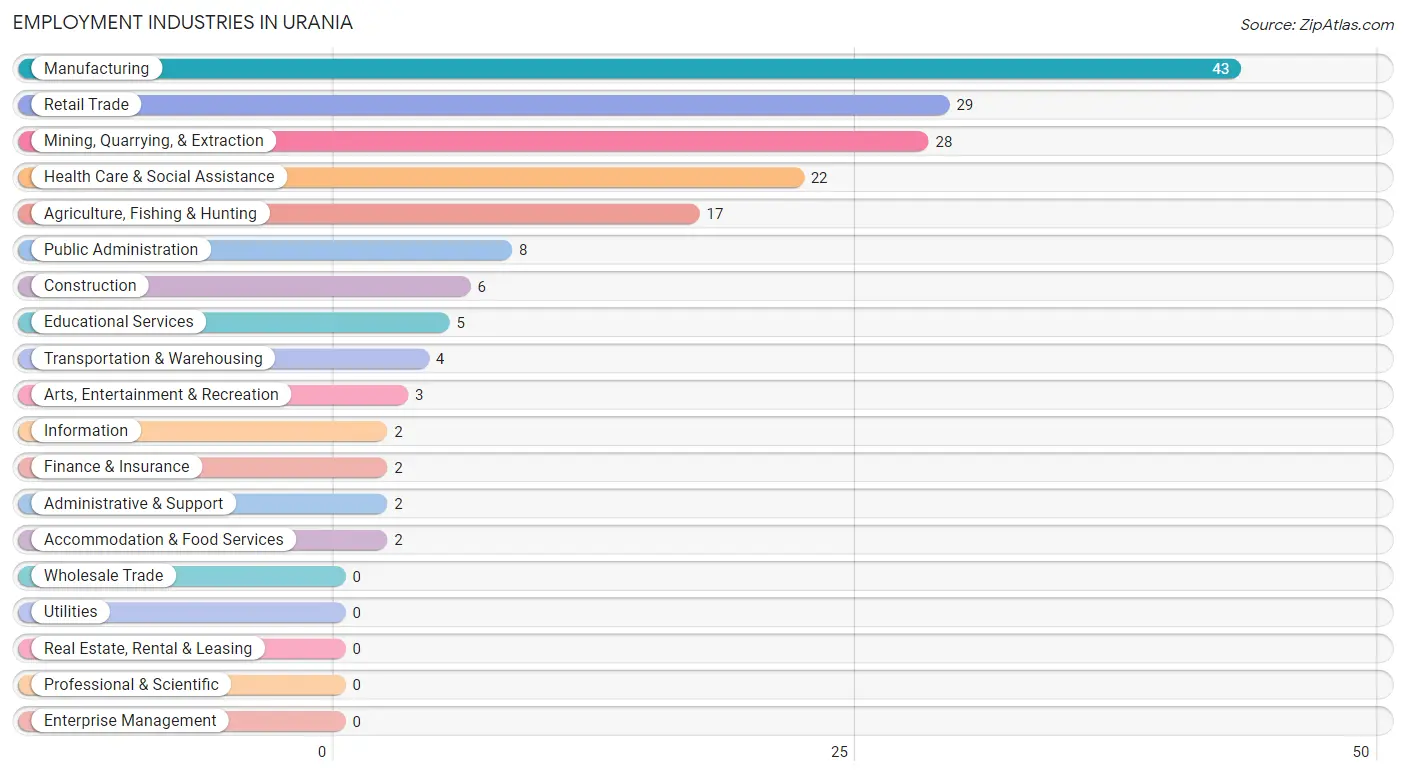
Employment Industries in Urania
The major employment industries in Urania include Manufacturing (43 | 22.3%), Retail Trade (29 | 15.0%), Mining, Quarrying, & Extraction (28 | 14.5%), Health Care & Social Assistance (22 | 11.4%), and Agriculture, Fishing & Hunting (17 | 8.8%).
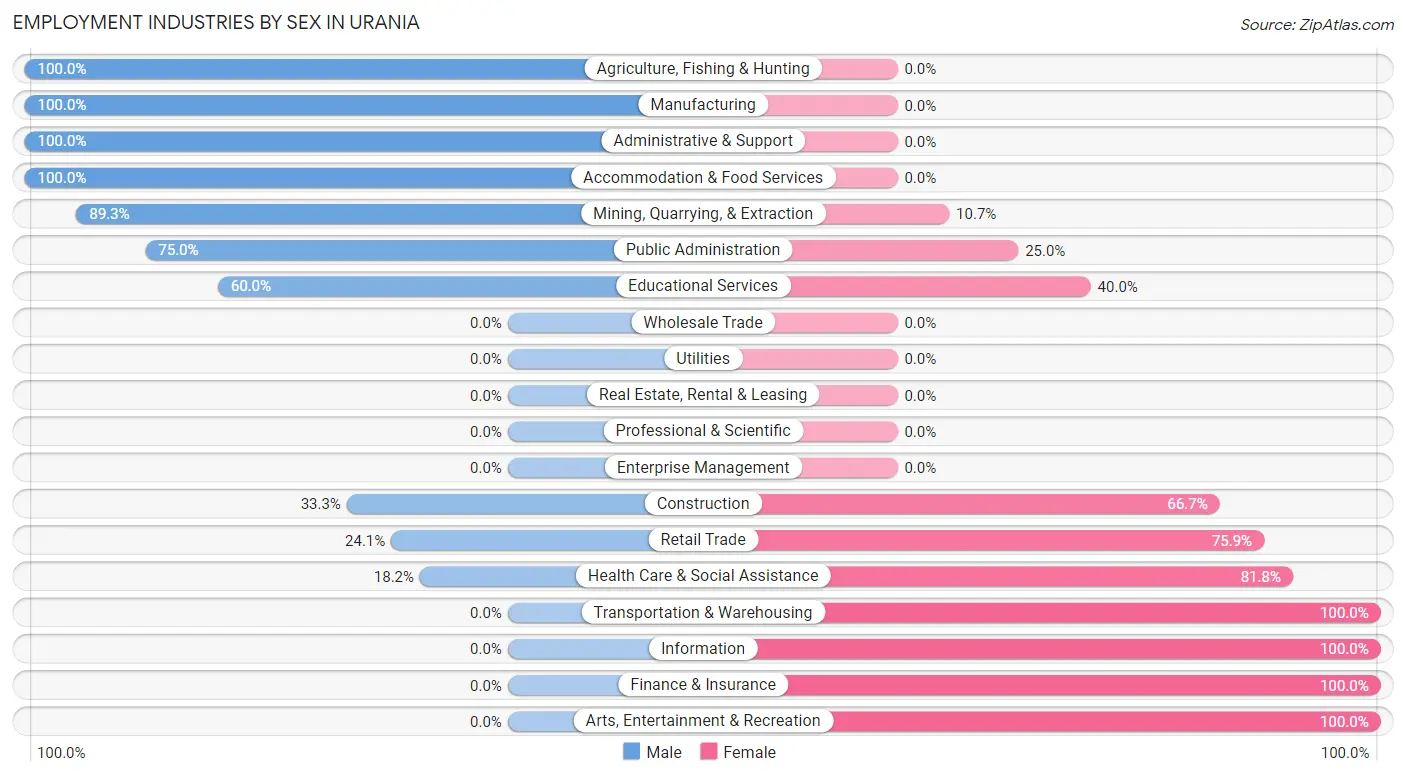
Employment Industries by Sex in Urania
The Urania industries that see more men than women are Agriculture, Fishing & Hunting (100.0%), Manufacturing (100.0%), and Administrative & Support (100.0%), whereas the industries that tend to have a higher number of women are Transportation & Warehousing (100.0%), Information (100.0%), and Finance & Insurance (100.0%).
| Industry | Male | Female |
| Agriculture, Fishing & Hunting | 17 (100.0%) | 0 (0.0%) |
| Mining, Quarrying, & Extraction | 25 (89.3%) | 3 (10.7%) |
| Construction | 2 (33.3%) | 4 (66.7%) |
| Manufacturing | 43 (100.0%) | 0 (0.0%) |
| Wholesale Trade | 0 (0.0%) | 0 (0.0%) |
| Retail Trade | 7 (24.1%) | 22 (75.9%) |
| Transportation & Warehousing | 0 (0.0%) | 4 (100.0%) |
| Utilities | 0 (0.0%) | 0 (0.0%) |
| Information | 0 (0.0%) | 2 (100.0%) |
| Finance & Insurance | 0 (0.0%) | 2 (100.0%) |
| Real Estate, Rental & Leasing | 0 (0.0%) | 0 (0.0%) |
| Professional & Scientific | 0 (0.0%) | 0 (0.0%) |
| Enterprise Management | 0 (0.0%) | 0 (0.0%) |
| Administrative & Support | 2 (100.0%) | 0 (0.0%) |
| Educational Services | 3 (60.0%) | 2 (40.0%) |
| Health Care & Social Assistance | 4 (18.2%) | 18 (81.8%) |
| Arts, Entertainment & Recreation | 0 (0.0%) | 3 (100.0%) |
| Accommodation & Food Services | 2 (100.0%) | 0 (0.0%) |
| Public Administration | 6 (75.0%) | 2 (25.0%) |
| Total | 131 (67.9%) | 62 (32.1%) |
Education in Urania
School Enrollment in Urania
The most common levels of schooling among the 150 students in Urania are high school (68 | 45.3%), middle school (42 | 28.0%), and elementary school (26 | 17.3%).
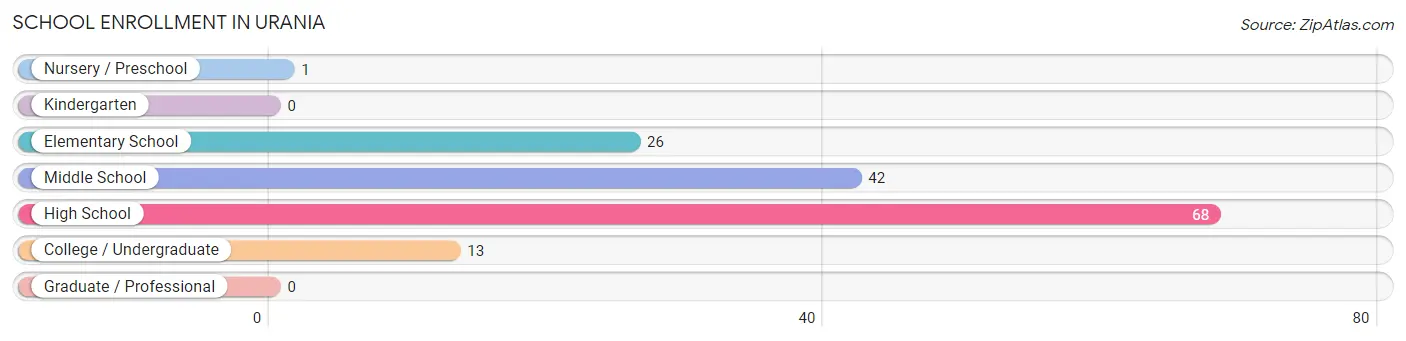
| School Level | # Students | % Students |
| Nursery / Preschool | 1 | 0.7% |
| Kindergarten | 0 | 0.0% |
| Elementary School | 26 | 17.3% |
| Middle School | 42 | 28.0% |
| High School | 68 | 45.3% |
| College / Undergraduate | 13 | 8.7% |
| Graduate / Professional | 0 | 0.0% |
| Total | 150 | 100.0% |
School Enrollment by Age by Funding Source in Urania
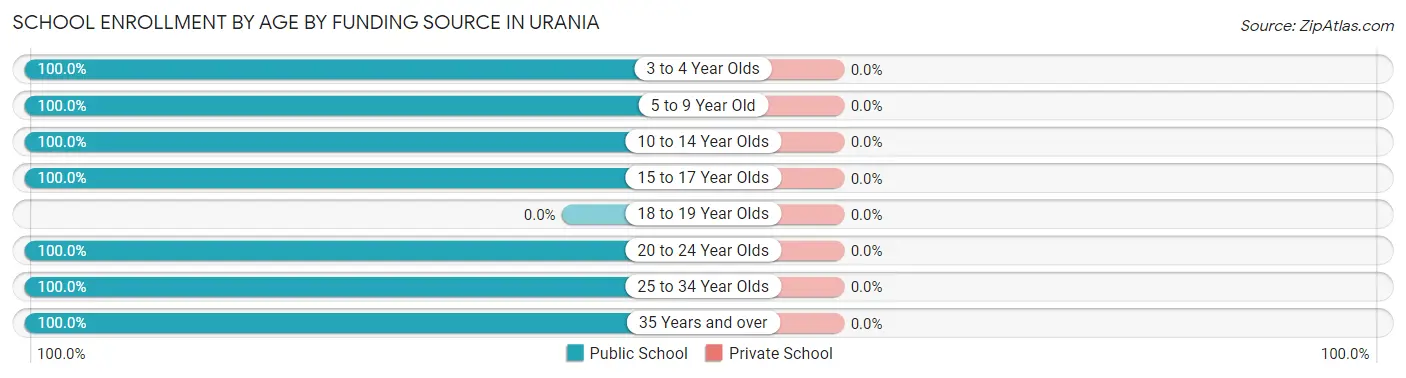
| Age Bracket | Public School | Private School |
| 3 to 4 Year Olds | 1 (100.0%) | 0 (0.0%) |
| 5 to 9 Year Old | 26 (100.0%) | 0 (0.0%) |
| 10 to 14 Year Olds | 68 (100.0%) | 0 (0.0%) |
| 15 to 17 Year Olds | 25 (100.0%) | 0 (0.0%) |
| 18 to 19 Year Olds | 0 (0.0%) | 0 (0.0%) |
| 20 to 24 Year Olds | 2 (100.0%) | 0 (0.0%) |
| 25 to 34 Year Olds | 13 (100.0%) | 0 (0.0%) |
| 35 Years and over | 15 (100.0%) | 0 (0.0%) |
| Total | 150 (100.0%) | 0 (0.0%) |
Educational Attainment by Field of Study in Urania
Education (11 | 19.3%), arts & humanities (11 | 19.3%), bio, nature & agricultural (10 | 17.5%), social sciences (9 | 15.8%), and liberal arts & history (7 | 12.3%) are the most common fields of study among 57 individuals in Urania who have obtained a bachelor's degree or higher.
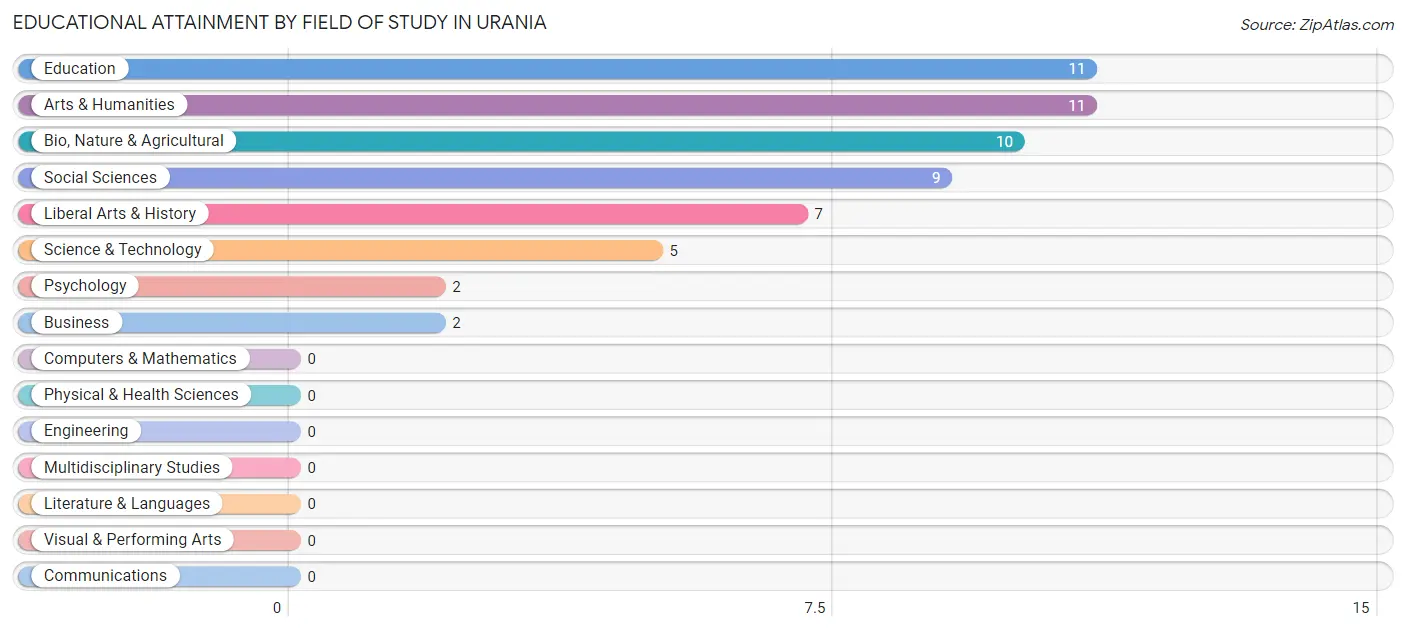
| Field of Study | # Graduates | % Graduates |
| Computers & Mathematics | 0 | 0.0% |
| Bio, Nature & Agricultural | 10 | 17.5% |
| Physical & Health Sciences | 0 | 0.0% |
| Psychology | 2 | 3.5% |
| Social Sciences | 9 | 15.8% |
| Engineering | 0 | 0.0% |
| Multidisciplinary Studies | 0 | 0.0% |
| Science & Technology | 5 | 8.8% |
| Business | 2 | 3.5% |
| Education | 11 | 19.3% |
| Literature & Languages | 0 | 0.0% |
| Liberal Arts & History | 7 | 12.3% |
| Visual & Performing Arts | 0 | 0.0% |
| Communications | 0 | 0.0% |
| Arts & Humanities | 11 | 19.3% |
| Total | 57 | 100.0% |
Transportation & Commute in Urania
Vehicle Availability by Sex in Urania
The most prevalent vehicle ownership categories in Urania are males with 2 vehicles (66, accounting for 50.4%) and females with 2 vehicles (31, making up 106.5%).
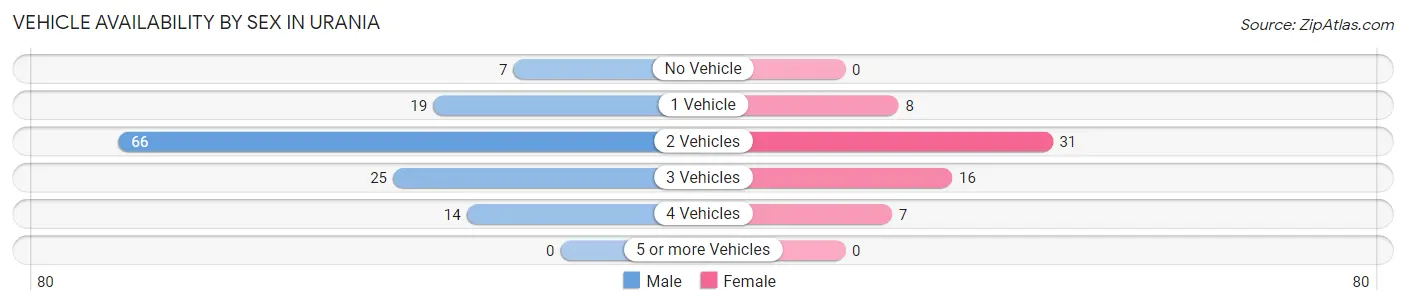
| Vehicles Available | Male | Female |
| No Vehicle | 7 (5.3%) | 0 (0.0%) |
| 1 Vehicle | 19 (14.5%) | 8 (12.9%) |
| 2 Vehicles | 66 (50.4%) | 31 (50.0%) |
| 3 Vehicles | 25 (19.1%) | 16 (25.8%) |
| 4 Vehicles | 14 (10.7%) | 7 (11.3%) |
| 5 or more Vehicles | 0 (0.0%) | 0 (0.0%) |
| Total | 131 (100.0%) | 62 (100.0%) |
Commute Time in Urania
The most frequently occuring commute durations in Urania are 5 to 9 minutes (56 commuters, 30.8%), 45 to 59 minutes (31 commuters, 17.0%), and 90 or more minutes (27 commuters, 14.8%).
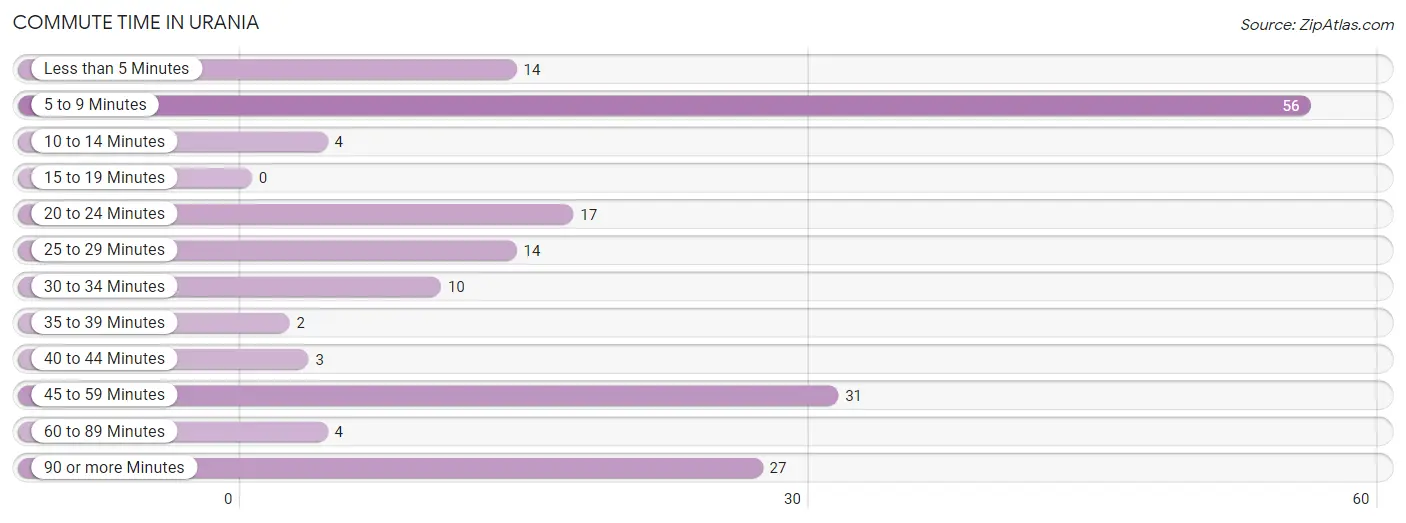
| Commute Time | # Commuters | % Commuters |
| Less than 5 Minutes | 14 | 7.7% |
| 5 to 9 Minutes | 56 | 30.8% |
| 10 to 14 Minutes | 4 | 2.2% |
| 15 to 19 Minutes | 0 | 0.0% |
| 20 to 24 Minutes | 17 | 9.3% |
| 25 to 29 Minutes | 14 | 7.7% |
| 30 to 34 Minutes | 10 | 5.5% |
| 35 to 39 Minutes | 2 | 1.1% |
| 40 to 44 Minutes | 3 | 1.7% |
| 45 to 59 Minutes | 31 | 17.0% |
| 60 to 89 Minutes | 4 | 2.2% |
| 90 or more Minutes | 27 | 14.8% |
Commute Time by Sex in Urania
The most common commute times in Urania are 5 to 9 minutes (34 commuters, 27.4%) for males and 5 to 9 minutes (22 commuters, 37.9%) for females.
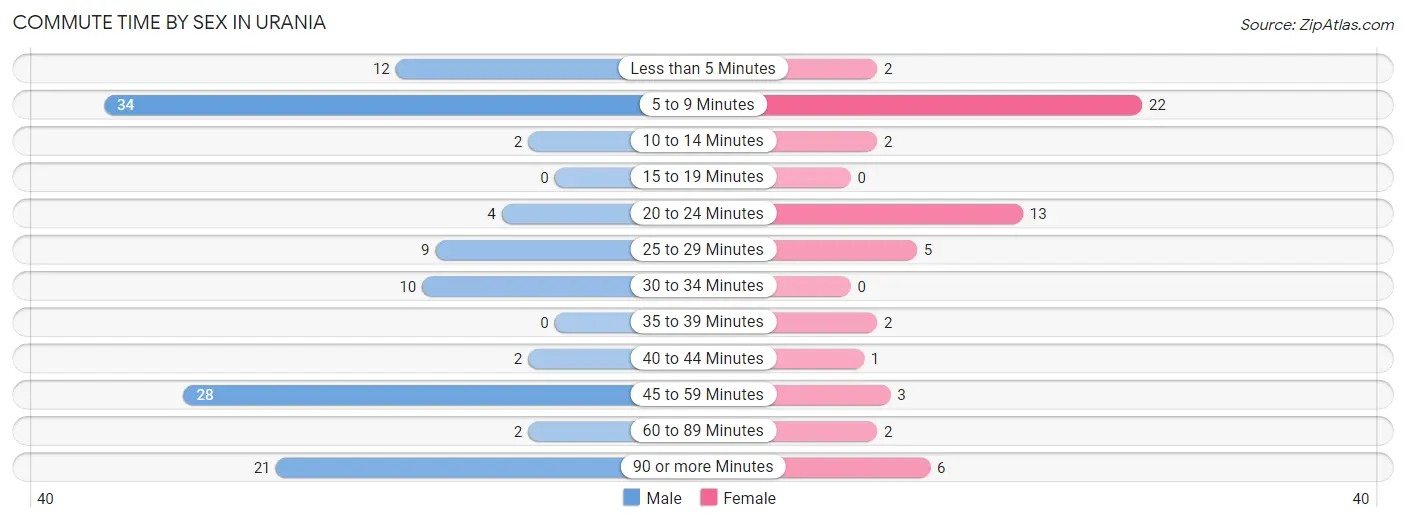
| Commute Time | Male | Female |
| Less than 5 Minutes | 12 (9.7%) | 2 (3.5%) |
| 5 to 9 Minutes | 34 (27.4%) | 22 (37.9%) |
| 10 to 14 Minutes | 2 (1.6%) | 2 (3.5%) |
| 15 to 19 Minutes | 0 (0.0%) | 0 (0.0%) |
| 20 to 24 Minutes | 4 (3.2%) | 13 (22.4%) |
| 25 to 29 Minutes | 9 (7.3%) | 5 (8.6%) |
| 30 to 34 Minutes | 10 (8.1%) | 0 (0.0%) |
| 35 to 39 Minutes | 0 (0.0%) | 2 (3.5%) |
| 40 to 44 Minutes | 2 (1.6%) | 1 (1.7%) |
| 45 to 59 Minutes | 28 (22.6%) | 3 (5.2%) |
| 60 to 89 Minutes | 2 (1.6%) | 2 (3.5%) |
| 90 or more Minutes | 21 (16.9%) | 6 (10.3%) |
Time of Departure to Work by Sex in Urania
The most frequent times of departure to work in Urania are 12:00 AM to 4:59 AM (36, 29.0%) for males and 4:00 PM to 11:59 PM (14, 24.1%) for females.
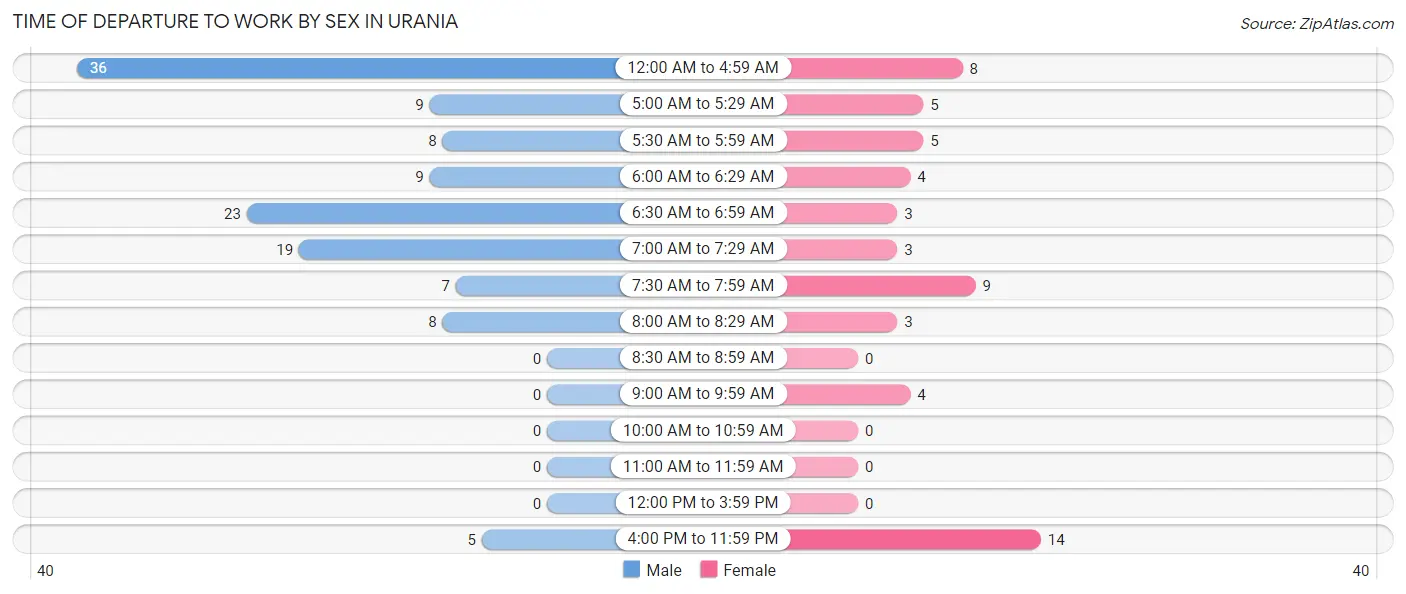
| Time of Departure | Male | Female |
| 12:00 AM to 4:59 AM | 36 (29.0%) | 8 (13.8%) |
| 5:00 AM to 5:29 AM | 9 (7.3%) | 5 (8.6%) |
| 5:30 AM to 5:59 AM | 8 (6.5%) | 5 (8.6%) |
| 6:00 AM to 6:29 AM | 9 (7.3%) | 4 (6.9%) |
| 6:30 AM to 6:59 AM | 23 (18.5%) | 3 (5.2%) |
| 7:00 AM to 7:29 AM | 19 (15.3%) | 3 (5.2%) |
| 7:30 AM to 7:59 AM | 7 (5.7%) | 9 (15.5%) |
| 8:00 AM to 8:29 AM | 8 (6.5%) | 3 (5.2%) |
| 8:30 AM to 8:59 AM | 0 (0.0%) | 0 (0.0%) |
| 9:00 AM to 9:59 AM | 0 (0.0%) | 4 (6.9%) |
| 10:00 AM to 10:59 AM | 0 (0.0%) | 0 (0.0%) |
| 11:00 AM to 11:59 AM | 0 (0.0%) | 0 (0.0%) |
| 12:00 PM to 3:59 PM | 0 (0.0%) | 0 (0.0%) |
| 4:00 PM to 11:59 PM | 5 (4.0%) | 14 (24.1%) |
| Total | 124 (100.0%) | 58 (100.0%) |
Housing Occupancy in Urania
Occupancy by Ownership in Urania
Of the total 201 dwellings in Urania, owner-occupied units account for 174 (86.6%), while renter-occupied units make up 27 (13.4%).
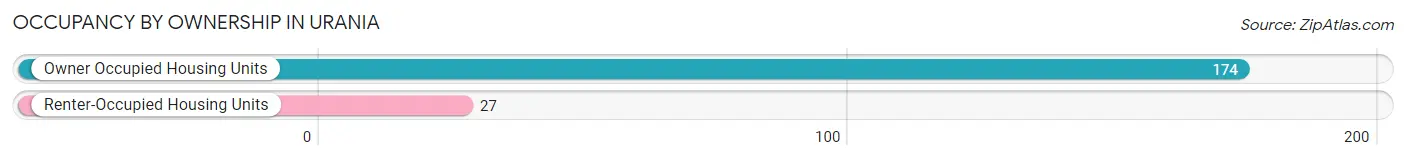
| Occupancy | # Housing Units | % Housing Units |
| Owner Occupied Housing Units | 174 | 86.6% |
| Renter-Occupied Housing Units | 27 | 13.4% |
| Total Occupied Housing Units | 201 | 100.0% |
Occupancy by Household Size in Urania
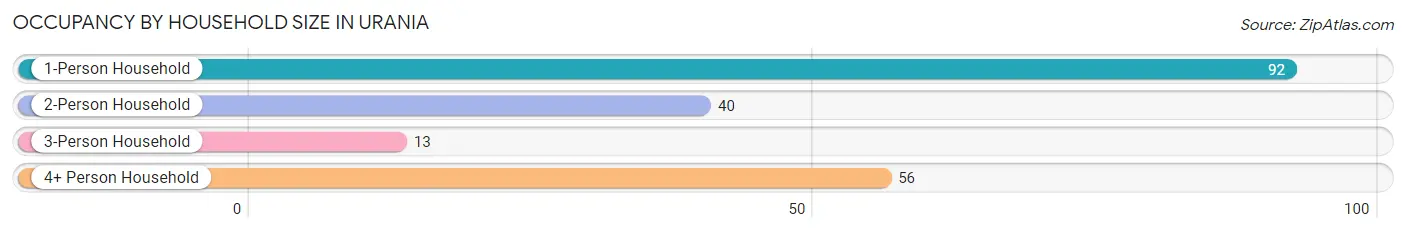
| Household Size | # Housing Units | % Housing Units |
| 1-Person Household | 92 | 45.8% |
| 2-Person Household | 40 | 19.9% |
| 3-Person Household | 13 | 6.5% |
| 4+ Person Household | 56 | 27.9% |
| Total Housing Units | 201 | 100.0% |
Occupancy by Ownership by Household Size in Urania
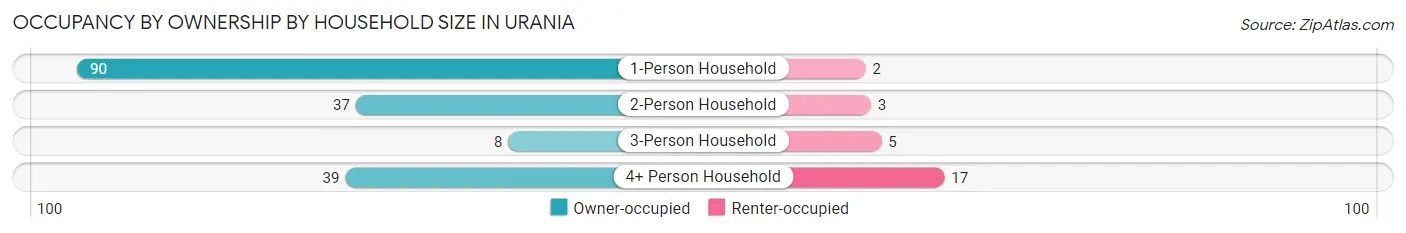
| Household Size | Owner-occupied | Renter-occupied |
| 1-Person Household | 90 (97.8%) | 2 (2.2%) |
| 2-Person Household | 37 (92.5%) | 3 (7.5%) |
| 3-Person Household | 8 (61.5%) | 5 (38.5%) |
| 4+ Person Household | 39 (69.6%) | 17 (30.4%) |
| Total Housing Units | 174 (86.6%) | 27 (13.4%) |
Occupancy by Educational Attainment in Urania
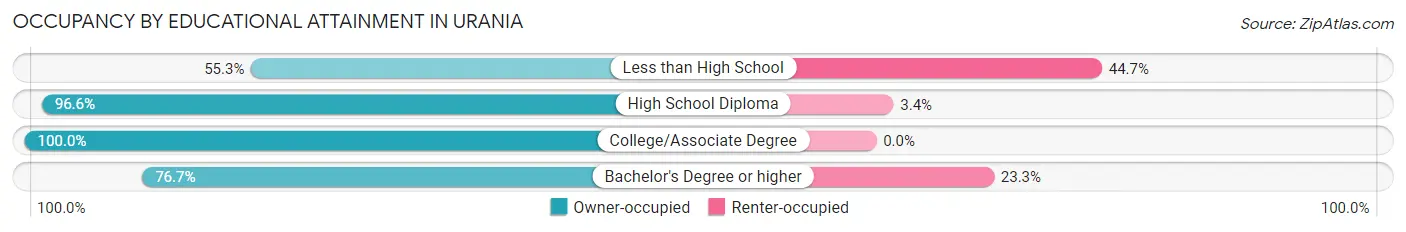
| Household Size | Owner-occupied | Renter-occupied |
| Less than High School | 21 (55.3%) | 17 (44.7%) |
| High School Diploma | 85 (96.6%) | 3 (3.4%) |
| College/Associate Degree | 45 (100.0%) | 0 (0.0%) |
| Bachelor's Degree or higher | 23 (76.7%) | 7 (23.3%) |
Occupancy by Age of Householder in Urania
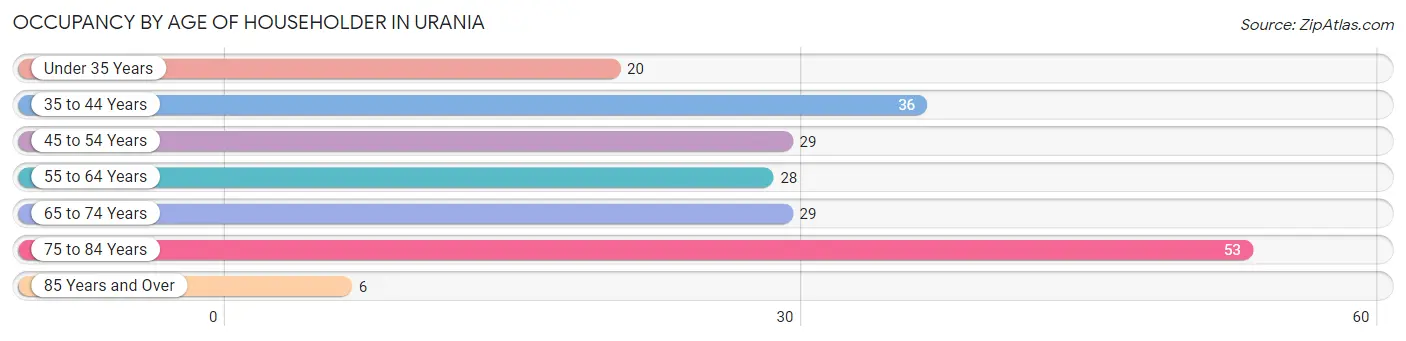
| Age Bracket | # Households | % Households |
| Under 35 Years | 20 | 10.0% |
| 35 to 44 Years | 36 | 17.9% |
| 45 to 54 Years | 29 | 14.4% |
| 55 to 64 Years | 28 | 13.9% |
| 65 to 74 Years | 29 | 14.4% |
| 75 to 84 Years | 53 | 26.4% |
| 85 Years and Over | 6 | 3.0% |
| Total | 201 | 100.0% |
Housing Finances in Urania
Median Income by Occupancy in Urania
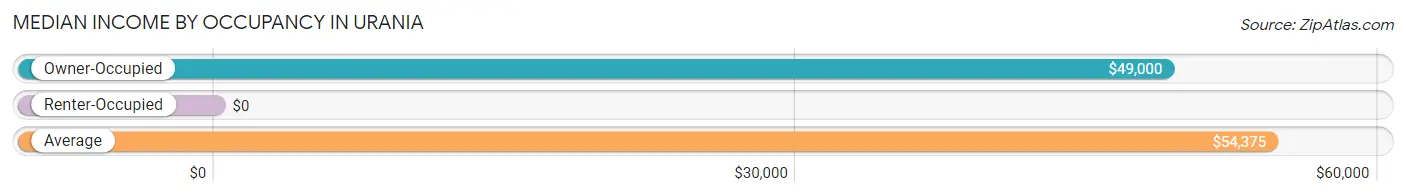
| Occupancy Type | # Households | Median Income |
| Owner-Occupied | 174 (86.6%) | $49,000 |
| Renter-Occupied | 27 (13.4%) | $0 |
| Average | 201 (100.0%) | $54,375 |
Occupancy by Householder Income Bracket in Urania
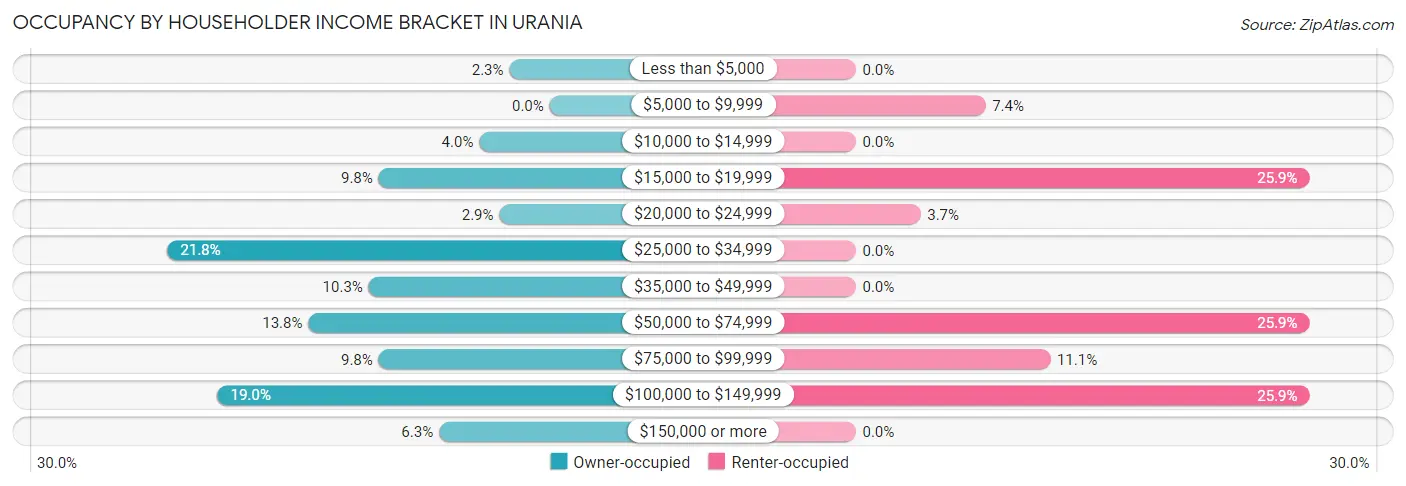
| Income Bracket | Owner-occupied | Renter-occupied |
| Less than $5,000 | 4 (2.3%) | 0 (0.0%) |
| $5,000 to $9,999 | 0 (0.0%) | 2 (7.4%) |
| $10,000 to $14,999 | 7 (4.0%) | 0 (0.0%) |
| $15,000 to $19,999 | 17 (9.8%) | 7 (25.9%) |
| $20,000 to $24,999 | 5 (2.9%) | 1 (3.7%) |
| $25,000 to $34,999 | 38 (21.8%) | 0 (0.0%) |
| $35,000 to $49,999 | 18 (10.3%) | 0 (0.0%) |
| $50,000 to $74,999 | 24 (13.8%) | 7 (25.9%) |
| $75,000 to $99,999 | 17 (9.8%) | 3 (11.1%) |
| $100,000 to $149,999 | 33 (19.0%) | 7 (25.9%) |
| $150,000 or more | 11 (6.3%) | 0 (0.0%) |
| Total | 174 (100.0%) | 27 (100.0%) |
Monthly Housing Cost Tiers in Urania
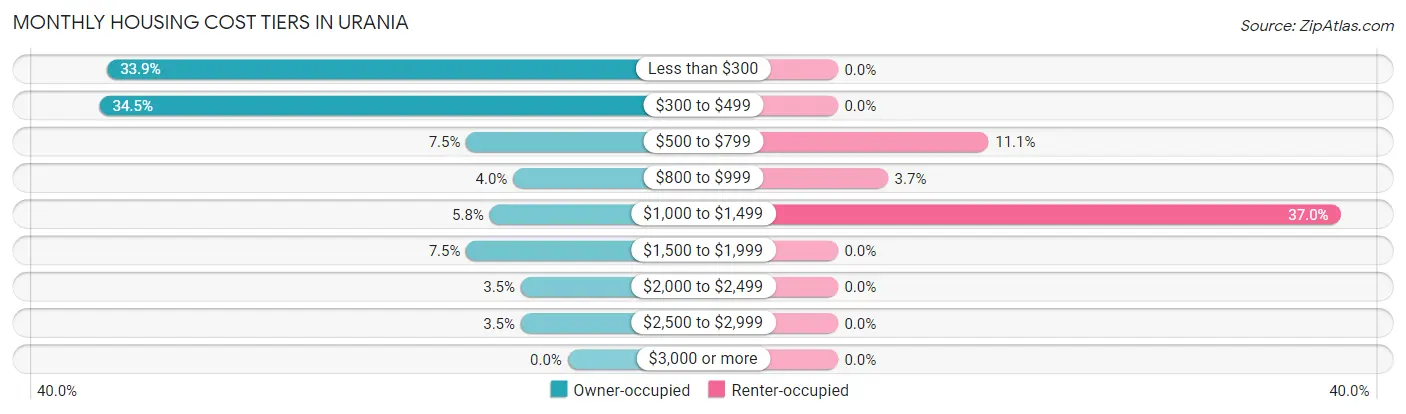
| Monthly Cost | Owner-occupied | Renter-occupied |
| Less than $300 | 59 (33.9%) | 0 (0.0%) |
| $300 to $499 | 60 (34.5%) | 0 (0.0%) |
| $500 to $799 | 13 (7.5%) | 3 (11.1%) |
| $800 to $999 | 7 (4.0%) | 1 (3.7%) |
| $1,000 to $1,499 | 10 (5.8%) | 10 (37.0%) |
| $1,500 to $1,999 | 13 (7.5%) | 0 (0.0%) |
| $2,000 to $2,499 | 6 (3.5%) | 0 (0.0%) |
| $2,500 to $2,999 | 6 (3.5%) | 0 (0.0%) |
| $3,000 or more | 0 (0.0%) | 0 (0.0%) |
| Total | 174 (100.0%) | 27 (100.0%) |
Physical Housing Characteristics in Urania
Housing Structures in Urania
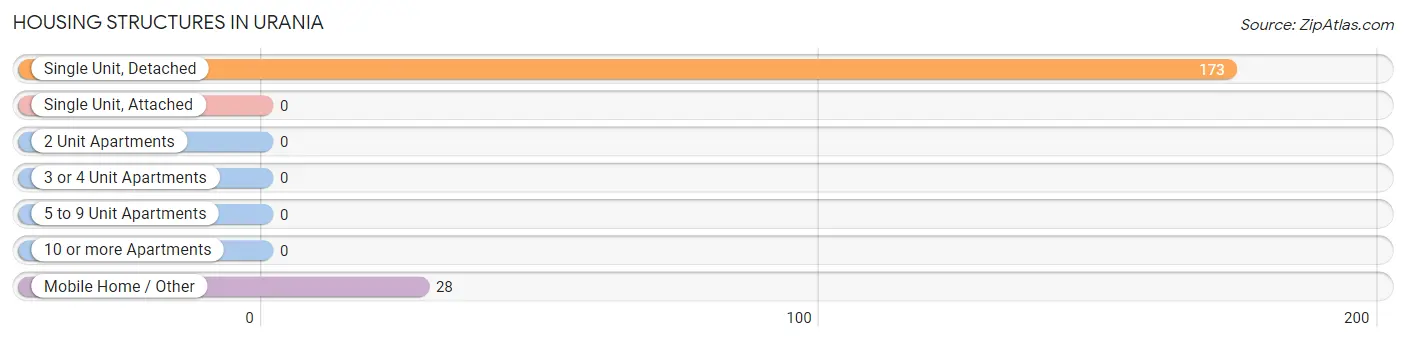
| Structure Type | # Housing Units | % Housing Units |
| Single Unit, Detached | 173 | 86.1% |
| Single Unit, Attached | 0 | 0.0% |
| 2 Unit Apartments | 0 | 0.0% |
| 3 or 4 Unit Apartments | 0 | 0.0% |
| 5 to 9 Unit Apartments | 0 | 0.0% |
| 10 or more Apartments | 0 | 0.0% |
| Mobile Home / Other | 28 | 13.9% |
| Total | 201 | 100.0% |
Housing Structures by Occupancy in Urania
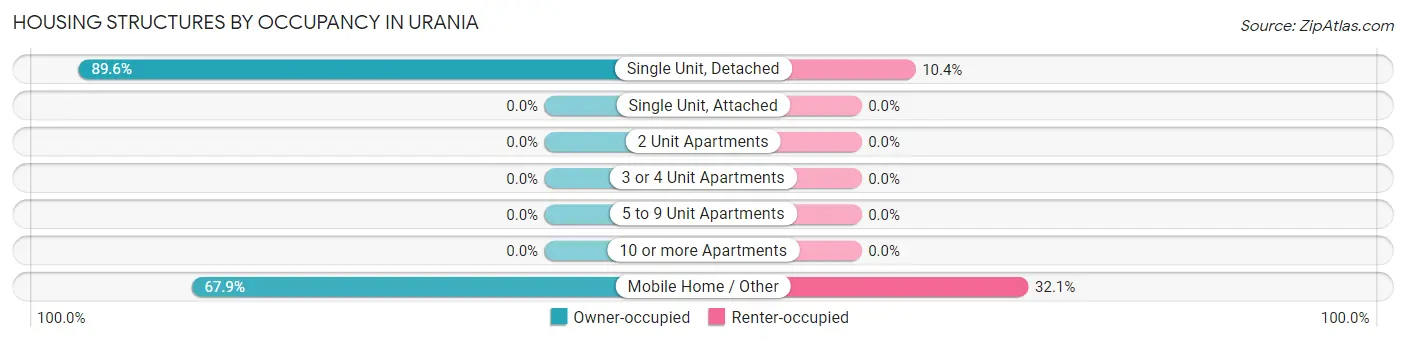
| Structure Type | Owner-occupied | Renter-occupied |
| Single Unit, Detached | 155 (89.6%) | 18 (10.4%) |
| Single Unit, Attached | 0 (0.0%) | 0 (0.0%) |
| 2 Unit Apartments | 0 (0.0%) | 0 (0.0%) |
| 3 or 4 Unit Apartments | 0 (0.0%) | 0 (0.0%) |
| 5 to 9 Unit Apartments | 0 (0.0%) | 0 (0.0%) |
| 10 or more Apartments | 0 (0.0%) | 0 (0.0%) |
| Mobile Home / Other | 19 (67.9%) | 9 (32.1%) |
| Total | 174 (86.6%) | 27 (13.4%) |
Housing Structures by Number of Rooms in Urania
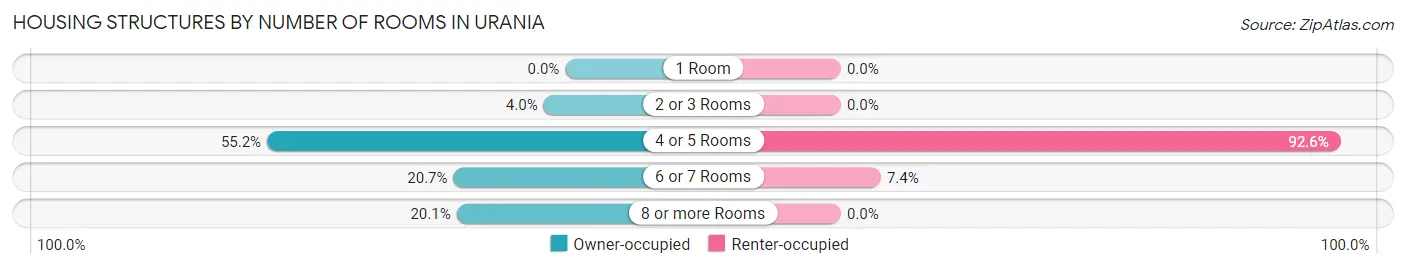
| Number of Rooms | Owner-occupied | Renter-occupied |
| 1 Room | 0 (0.0%) | 0 (0.0%) |
| 2 or 3 Rooms | 7 (4.0%) | 0 (0.0%) |
| 4 or 5 Rooms | 96 (55.2%) | 25 (92.6%) |
| 6 or 7 Rooms | 36 (20.7%) | 2 (7.4%) |
| 8 or more Rooms | 35 (20.1%) | 0 (0.0%) |
| Total | 174 (100.0%) | 27 (100.0%) |
Housing Structure by Heating Type in Urania
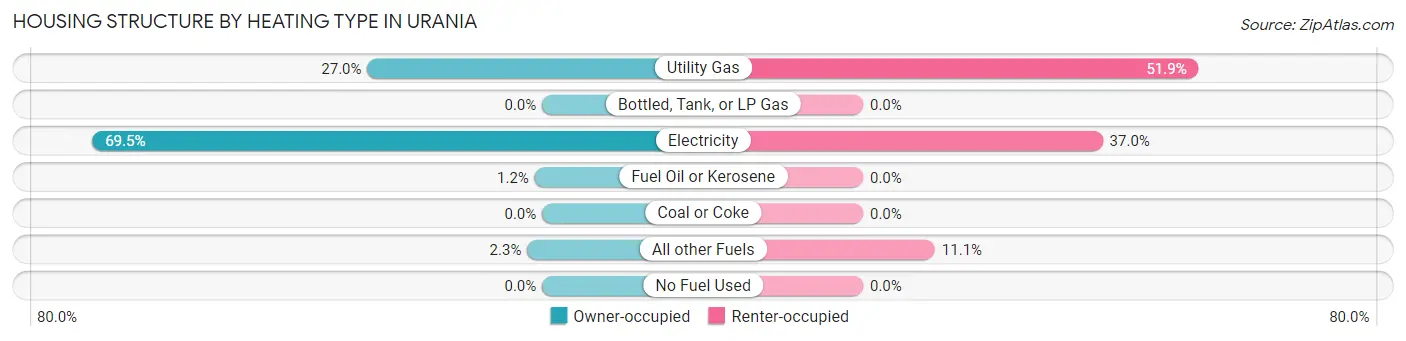
| Heating Type | Owner-occupied | Renter-occupied |
| Utility Gas | 47 (27.0%) | 14 (51.8%) |
| Bottled, Tank, or LP Gas | 0 (0.0%) | 0 (0.0%) |
| Electricity | 121 (69.5%) | 10 (37.0%) |
| Fuel Oil or Kerosene | 2 (1.1%) | 0 (0.0%) |
| Coal or Coke | 0 (0.0%) | 0 (0.0%) |
| All other Fuels | 4 (2.3%) | 3 (11.1%) |
| No Fuel Used | 0 (0.0%) | 0 (0.0%) |
| Total | 174 (100.0%) | 27 (100.0%) |
Household Vehicle Usage in Urania
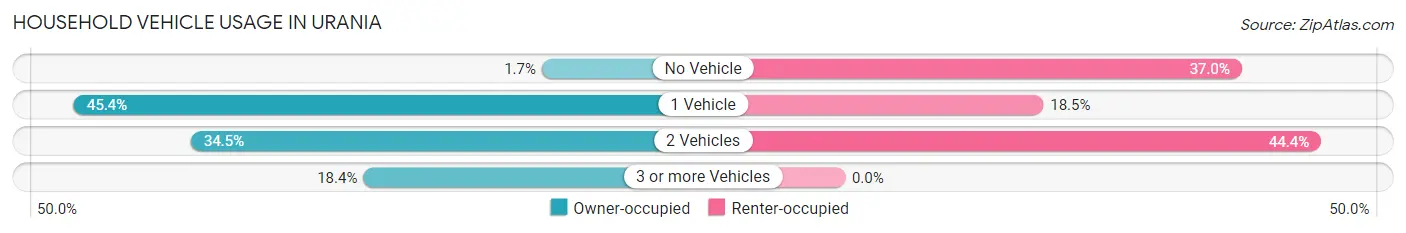
| Vehicles per Household | Owner-occupied | Renter-occupied |
| No Vehicle | 3 (1.7%) | 10 (37.0%) |
| 1 Vehicle | 79 (45.4%) | 5 (18.5%) |
| 2 Vehicles | 60 (34.5%) | 12 (44.4%) |
| 3 or more Vehicles | 32 (18.4%) | 0 (0.0%) |
| Total | 174 (100.0%) | 27 (100.0%) |
Real Estate & Mortgages in Urania
Real Estate and Mortgage Overview in Urania
| Characteristic | Without Mortgage | With Mortgage |
| Housing Units | 128 | 46 |
| Median Property Value | $77,600 | $188,900 |
| Median Household Income | $29,786 | $9 |
| Monthly Housing Costs | $306 | $0 |
| Real Estate Taxes | $199 | $21 |
Property Value by Mortgage Status in Urania
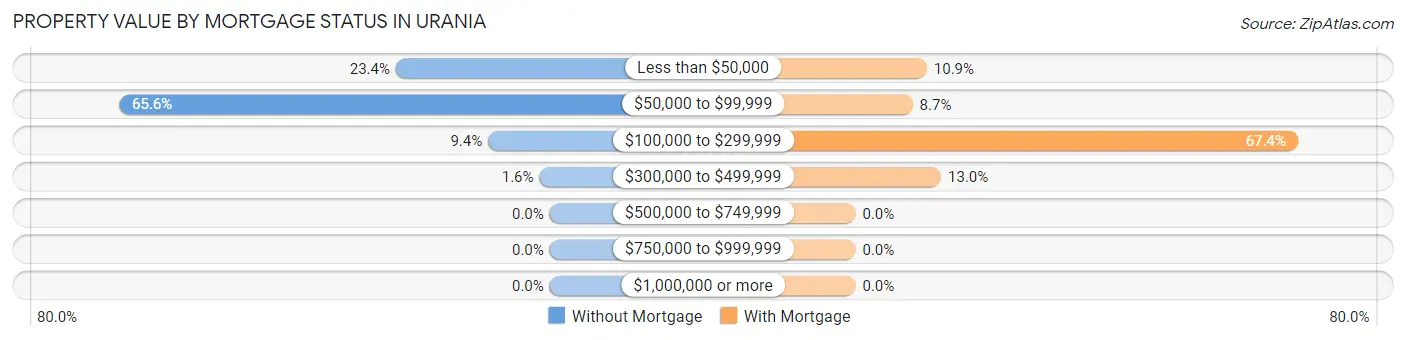
| Property Value | Without Mortgage | With Mortgage |
| Less than $50,000 | 30 (23.4%) | 5 (10.9%) |
| $50,000 to $99,999 | 84 (65.6%) | 4 (8.7%) |
| $100,000 to $299,999 | 12 (9.4%) | 31 (67.4%) |
| $300,000 to $499,999 | 2 (1.6%) | 6 (13.0%) |
| $500,000 to $749,999 | 0 (0.0%) | 0 (0.0%) |
| $750,000 to $999,999 | 0 (0.0%) | 0 (0.0%) |
| $1,000,000 or more | 0 (0.0%) | 0 (0.0%) |
| Total | 128 (100.0%) | 46 (100.0%) |
Household Income by Mortgage Status in Urania
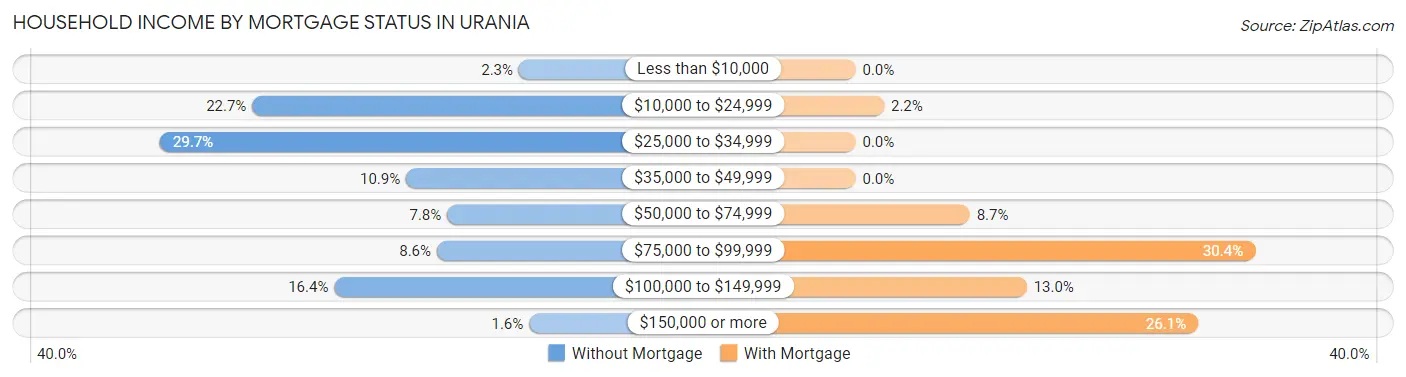
| Household Income | Without Mortgage | With Mortgage |
| Less than $10,000 | 3 (2.3%) | 0 (0.0%) |
| $10,000 to $24,999 | 29 (22.7%) | 1 (2.2%) |
| $25,000 to $34,999 | 38 (29.7%) | 0 (0.0%) |
| $35,000 to $49,999 | 14 (10.9%) | 0 (0.0%) |
| $50,000 to $74,999 | 10 (7.8%) | 4 (8.7%) |
| $75,000 to $99,999 | 11 (8.6%) | 14 (30.4%) |
| $100,000 to $149,999 | 21 (16.4%) | 6 (13.0%) |
| $150,000 or more | 2 (1.6%) | 12 (26.1%) |
| Total | 128 (100.0%) | 46 (100.0%) |
Property Value to Household Income Ratio in Urania
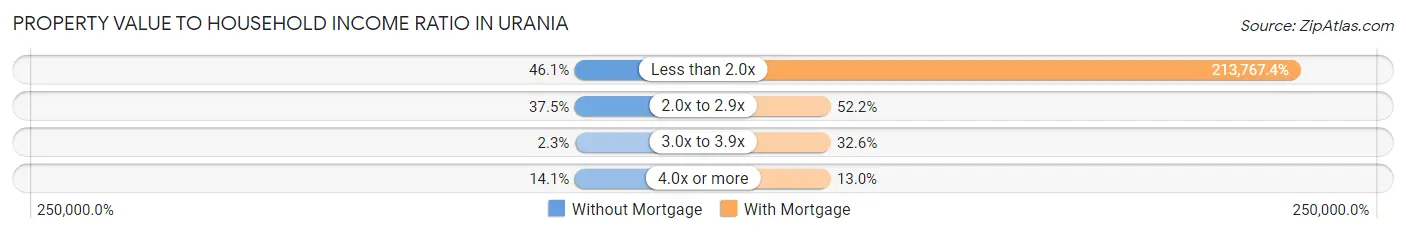
| Value-to-Income Ratio | Without Mortgage | With Mortgage |
| Less than 2.0x | 59 (46.1%) | 98,333 (213,767.4%) |
| 2.0x to 2.9x | 48 (37.5%) | 24 (52.2%) |
| 3.0x to 3.9x | 3 (2.3%) | 15 (32.6%) |
| 4.0x or more | 18 (14.1%) | 6 (13.0%) |
| Total | 128 (100.0%) | 46 (100.0%) |
Real Estate Taxes by Mortgage Status in Urania
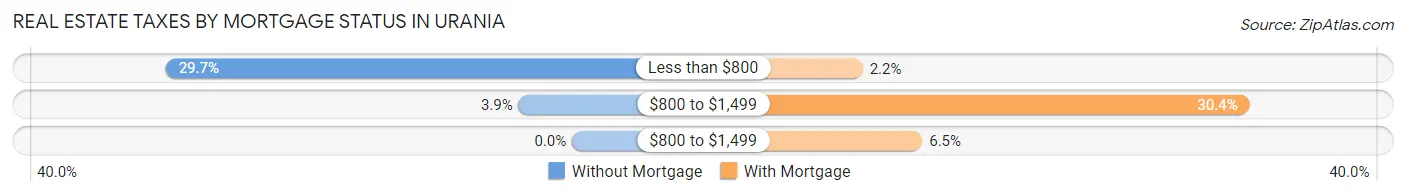
| Property Taxes | Without Mortgage | With Mortgage |
| Less than $800 | 38 (29.7%) | 1 (2.2%) |
| $800 to $1,499 | 5 (3.9%) | 14 (30.4%) |
| $800 to $1,499 | 0 (0.0%) | 3 (6.5%) |
| Total | 128 (100.0%) | 46 (100.0%) |
Health & Disability in Urania
Health Insurance Coverage by Age in Urania
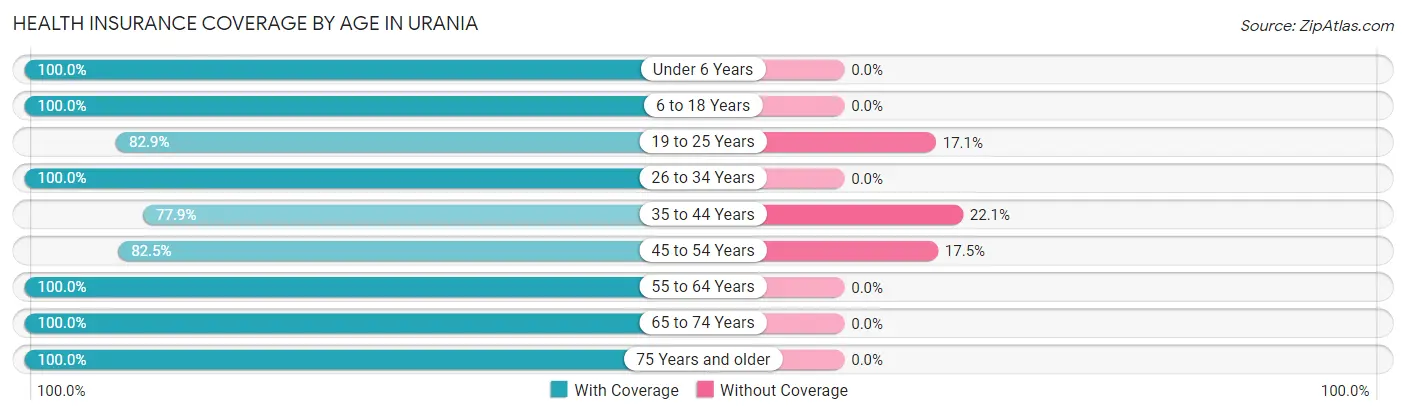
| Age Bracket | With Coverage | Without Coverage |
| Under 6 Years | 28 (100.0%) | 0 (0.0%) |
| 6 to 18 Years | 128 (100.0%) | 0 (0.0%) |
| 19 to 25 Years | 34 (82.9%) | 7 (17.1%) |
| 26 to 34 Years | 33 (100.0%) | 0 (0.0%) |
| 35 to 44 Years | 74 (77.9%) | 21 (22.1%) |
| 45 to 54 Years | 52 (82.5%) | 11 (17.5%) |
| 55 to 64 Years | 55 (100.0%) | 0 (0.0%) |
| 65 to 74 Years | 49 (100.0%) | 0 (0.0%) |
| 75 Years and older | 62 (100.0%) | 0 (0.0%) |
| Total | 515 (93.0%) | 39 (7.0%) |
Health Insurance Coverage by Citizenship Status in Urania
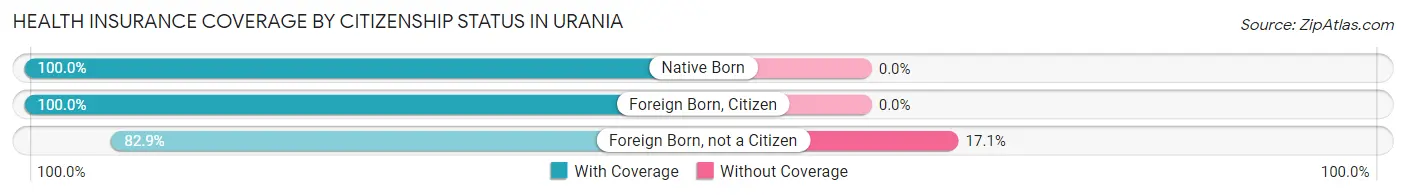
| Citizenship Status | With Coverage | Without Coverage |
| Native Born | 28 (100.0%) | 0 (0.0%) |
| Foreign Born, Citizen | 128 (100.0%) | 0 (0.0%) |
| Foreign Born, not a Citizen | 34 (82.9%) | 7 (17.1%) |
Health Insurance Coverage by Household Income in Urania
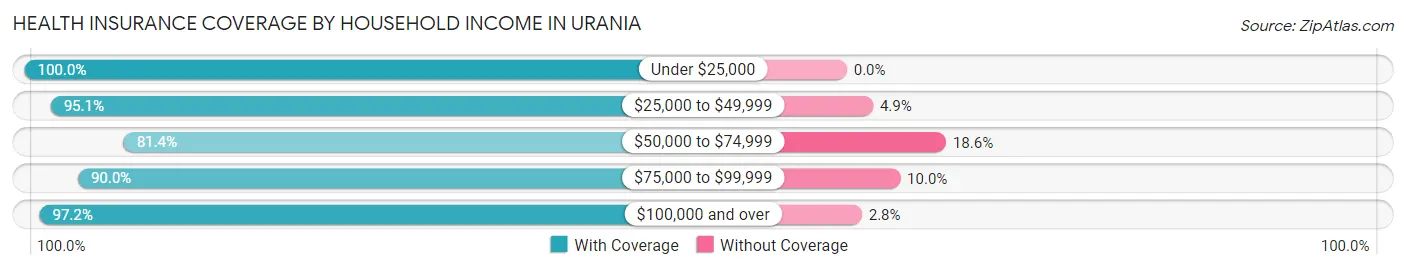
| Household Income | With Coverage | Without Coverage |
| Under $25,000 | 81 (100.0%) | 0 (0.0%) |
| $25,000 to $49,999 | 97 (95.1%) | 5 (4.9%) |
| $50,000 to $74,999 | 92 (81.4%) | 21 (18.6%) |
| $75,000 to $99,999 | 72 (90.0%) | 8 (10.0%) |
| $100,000 and over | 173 (97.2%) | 5 (2.8%) |
Public vs Private Health Insurance Coverage by Age in Urania
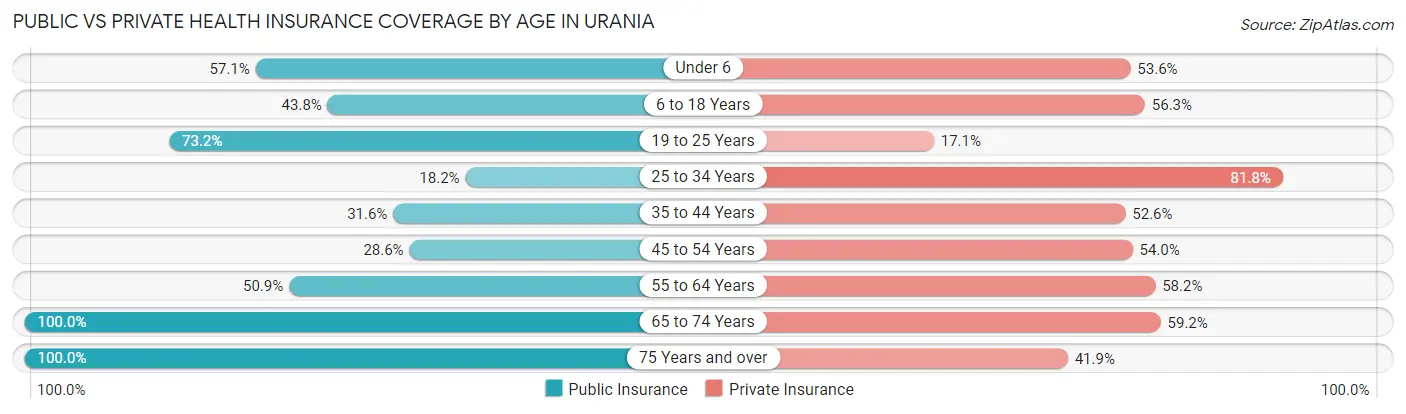
| Age Bracket | Public Insurance | Private Insurance |
| Under 6 | 16 (57.1%) | 15 (53.6%) |
| 6 to 18 Years | 56 (43.8%) | 72 (56.2%) |
| 19 to 25 Years | 30 (73.2%) | 7 (17.1%) |
| 25 to 34 Years | 6 (18.2%) | 27 (81.8%) |
| 35 to 44 Years | 30 (31.6%) | 50 (52.6%) |
| 45 to 54 Years | 18 (28.6%) | 34 (54.0%) |
| 55 to 64 Years | 28 (50.9%) | 32 (58.2%) |
| 65 to 74 Years | 49 (100.0%) | 29 (59.2%) |
| 75 Years and over | 62 (100.0%) | 26 (41.9%) |
| Total | 295 (53.2%) | 292 (52.7%) |
Disability Status by Sex by Age in Urania
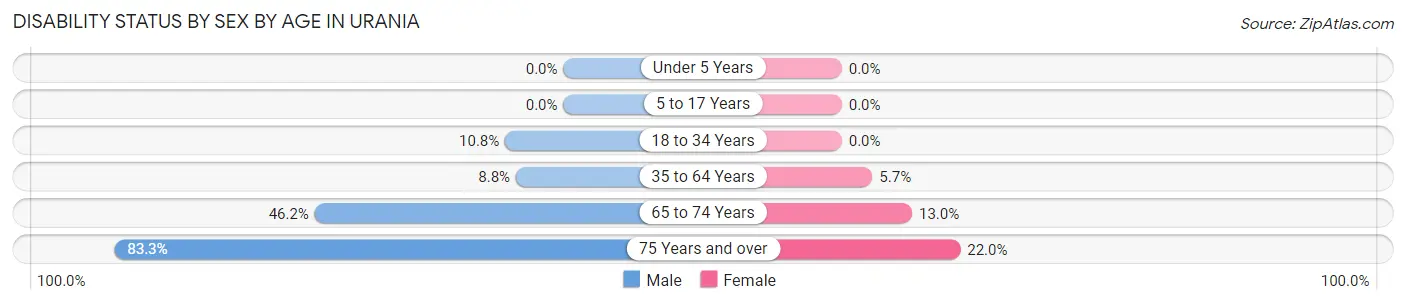
| Age Bracket | Male | Female |
| Under 5 Years | 0 (0.0%) | 0 (0.0%) |
| 5 to 17 Years | 0 (0.0%) | 0 (0.0%) |
| 18 to 34 Years | 4 (10.8%) | 0 (0.0%) |
| 35 to 64 Years | 11 (8.8%) | 5 (5.7%) |
| 65 to 74 Years | 12 (46.2%) | 3 (13.0%) |
| 75 Years and over | 10 (83.3%) | 11 (22.0%) |
Disability Class by Sex by Age in Urania
Disability Class: Hearing Difficulty
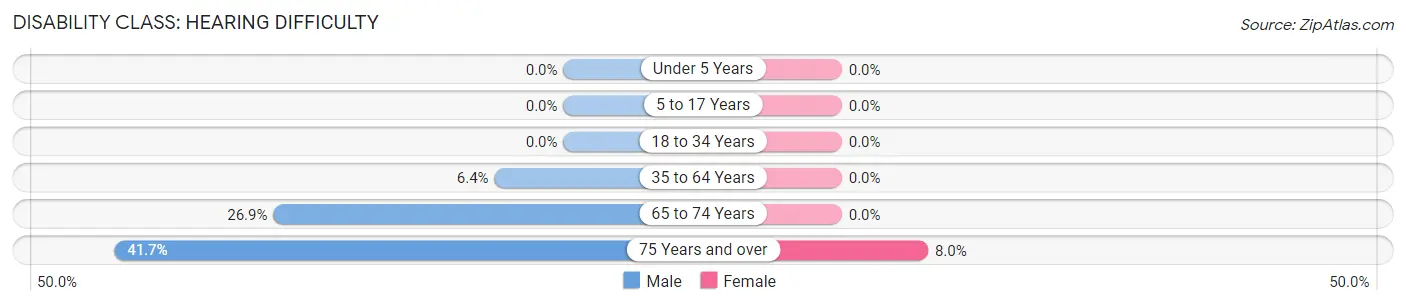
| Age Bracket | Male | Female |
| Under 5 Years | 0 (0.0%) | 0 (0.0%) |
| 5 to 17 Years | 0 (0.0%) | 0 (0.0%) |
| 18 to 34 Years | 0 (0.0%) | 0 (0.0%) |
| 35 to 64 Years | 8 (6.4%) | 0 (0.0%) |
| 65 to 74 Years | 7 (26.9%) | 0 (0.0%) |
| 75 Years and over | 5 (41.7%) | 4 (8.0%) |
Disability Class: Vision Difficulty
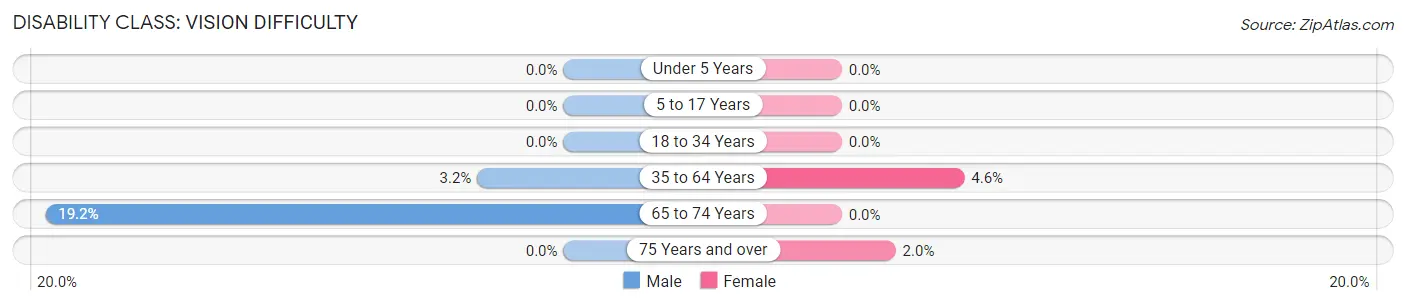
| Age Bracket | Male | Female |
| Under 5 Years | 0 (0.0%) | 0 (0.0%) |
| 5 to 17 Years | 0 (0.0%) | 0 (0.0%) |
| 18 to 34 Years | 0 (0.0%) | 0 (0.0%) |
| 35 to 64 Years | 4 (3.2%) | 4 (4.5%) |
| 65 to 74 Years | 5 (19.2%) | 0 (0.0%) |
| 75 Years and over | 0 (0.0%) | 1 (2.0%) |
Disability Class: Cognitive Difficulty
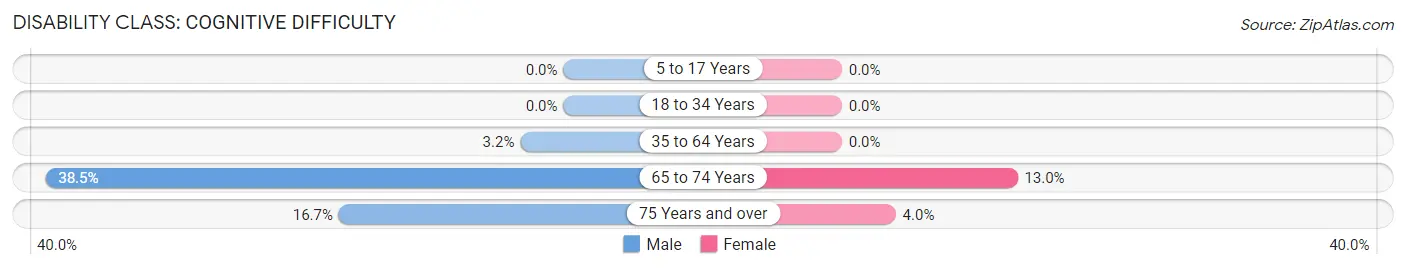
| Age Bracket | Male | Female |
| 5 to 17 Years | 0 (0.0%) | 0 (0.0%) |
| 18 to 34 Years | 0 (0.0%) | 0 (0.0%) |
| 35 to 64 Years | 4 (3.2%) | 0 (0.0%) |
| 65 to 74 Years | 10 (38.5%) | 3 (13.0%) |
| 75 Years and over | 2 (16.7%) | 2 (4.0%) |
Disability Class: Ambulatory Difficulty
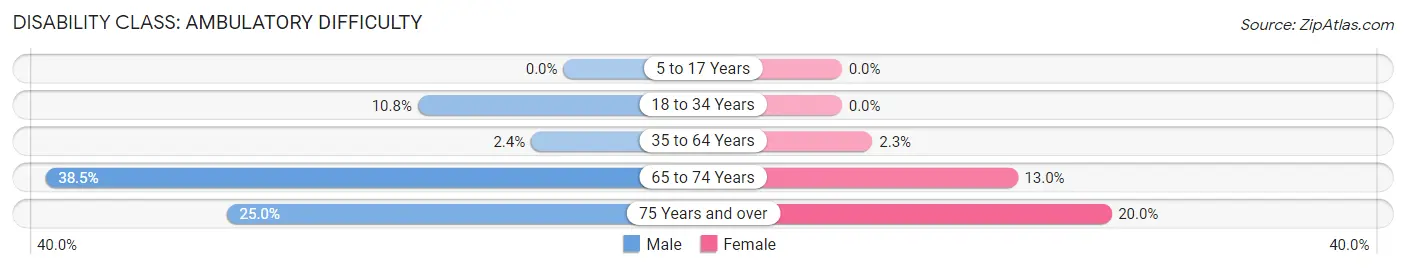
| Age Bracket | Male | Female |
| 5 to 17 Years | 0 (0.0%) | 0 (0.0%) |
| 18 to 34 Years | 4 (10.8%) | 0 (0.0%) |
| 35 to 64 Years | 3 (2.4%) | 2 (2.3%) |
| 65 to 74 Years | 10 (38.5%) | 3 (13.0%) |
| 75 Years and over | 3 (25.0%) | 10 (20.0%) |
Disability Class: Self-Care Difficulty
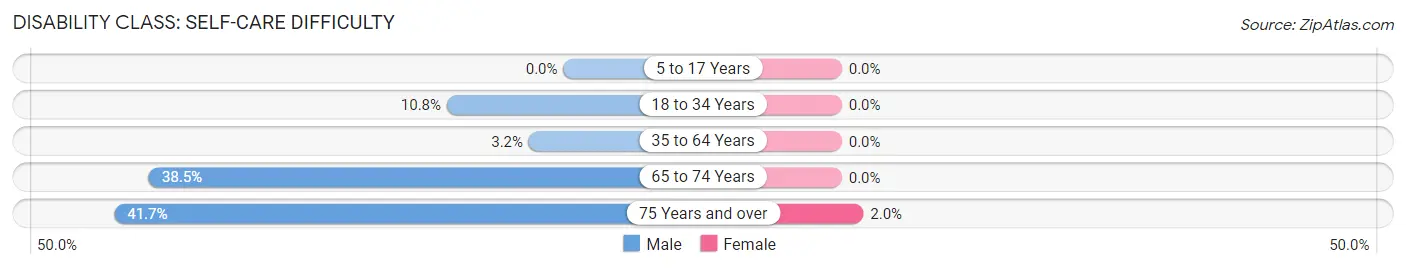
| Age Bracket | Male | Female |
| 5 to 17 Years | 0 (0.0%) | 0 (0.0%) |
| 18 to 34 Years | 4 (10.8%) | 0 (0.0%) |
| 35 to 64 Years | 4 (3.2%) | 0 (0.0%) |
| 65 to 74 Years | 10 (38.5%) | 0 (0.0%) |
| 75 Years and over | 5 (41.7%) | 1 (2.0%) |
Technology Access in Urania
Computing Device Access in Urania
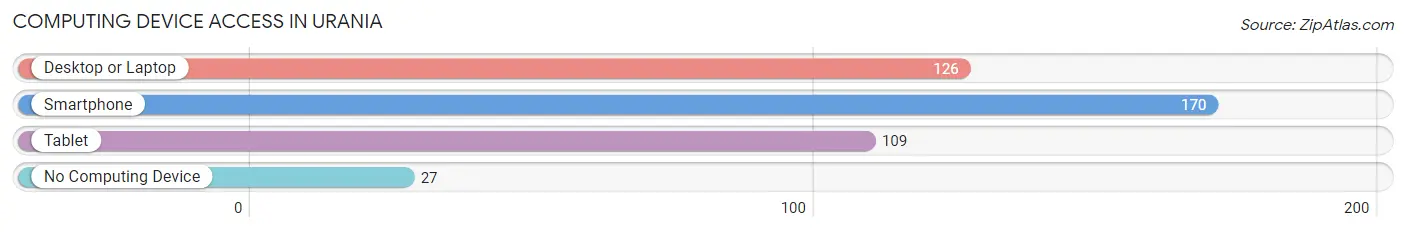
| Device Type | # Households | % Households |
| Desktop or Laptop | 126 | 62.7% |
| Smartphone | 170 | 84.6% |
| Tablet | 109 | 54.2% |
| No Computing Device | 27 | 13.4% |
| Total | 201 | 100.0% |
Internet Access in Urania
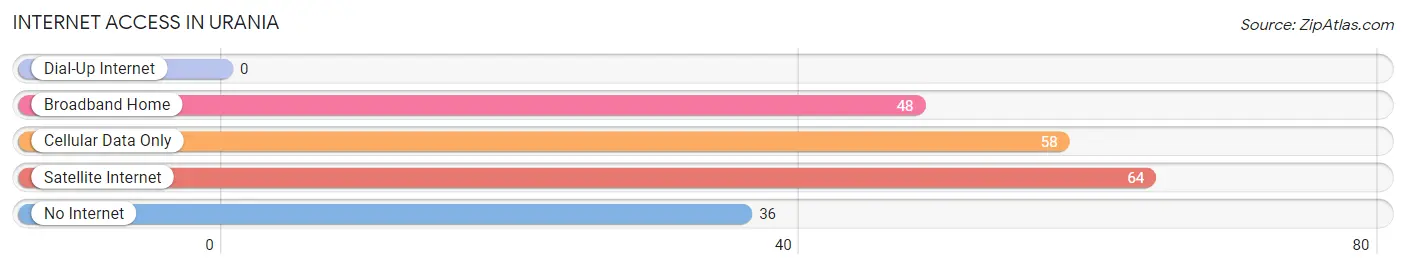
| Internet Type | # Households | % Households |
| Dial-Up Internet | 0 | 0.0% |
| Broadband Home | 48 | 23.9% |
| Cellular Data Only | 58 | 28.9% |
| Satellite Internet | 64 | 31.8% |
| No Internet | 36 | 17.9% |
| Total | 201 | 100.0% |
Urania Summary
Urania is a small town located in the northeastern corner of Louisiana, in the United States. It is situated in the heart of the Ouachita Mountains, and is part of the Monroe Metropolitan Statistical Area. The town has a population of 1,845 people, according to the 2010 census.
Geography
Urania is located in the northeastern corner of Louisiana, in the United States. It is situated in the heart of the Ouachita Mountains, and is part of the Monroe Metropolitan Statistical Area. The town is located at the intersection of Louisiana Highways 15 and 126, and is approximately 20 miles south of the Arkansas border. The town is situated on the banks of the Ouachita River, and is surrounded by rolling hills and forests.
The climate in Urania is humid subtropical, with hot, humid summers and mild winters. The average annual temperature is around 68 degrees Fahrenheit, and the average annual precipitation is around 50 inches.
History
Urania was founded in 1845 by a group of settlers from the nearby town of Monroe. The town was named after the Greek goddess of astronomy, Urania. The town was originally a small farming community, and the main crops grown were cotton, corn, and tobacco.
In the late 19th century, Urania began to grow and develop. The town was incorporated in 1891, and the first mayor was elected in 1892. The town was connected to the railroad in 1895, and the first bank was established in 1896.
In the early 20th century, Urania continued to grow and develop. The town was connected to the electric grid in 1910, and the first telephone service was established in 1911. The town was also connected to the natural gas grid in 1912.
Economy
Urania’s economy is largely based on agriculture and forestry. The town is home to several large farms, and the main crops grown are cotton, corn, and soybeans. The town is also home to several timber companies, and the main products produced are lumber and paper products.
The town is also home to several small businesses, including restaurants, retail stores, and service providers. The town is also home to several manufacturing companies, including a furniture factory and a plastics factory.
Demographics
As of the 2010 census, Urania had a population of 1,845 people. The racial makeup of the town was 79.3% White, 17.7% African American, 0.5% Native American, 0.3% Asian, 0.1% Pacific Islander, and 2.1% from other races. The median household income was $30,938, and the median family income was $37,813.
Conclusion
Urania is a small town located in the northeastern corner of Louisiana, in the United States. It is situated in the heart of the Ouachita Mountains, and is part of the Monroe Metropolitan Statistical Area. The town has a population of 1,845 people, according to the 2010 census. The town’s economy is largely based on agriculture and forestry, and the town is also home to several small businesses. The racial makeup of the town is 79.3% White, 17.7% African American, 0.5% Native American, 0.3% Asian, 0.1% Pacific Islander, and 2.1% from other races. The median household income was $30,938, and the median family income was $37,813.
Common Questions
What is Per Capita Income in Urania?
Per Capita income in Urania is $15,400.
What is the Median Family Income in Urania?
Median Family Income in Urania is $75,625.
What is the Median Household income in Urania?
Median Household Income in Urania is $54,375.
What is Income or Wage Gap in Urania?
Income or Wage Gap in Urania is 18.6%.
Women in Urania earn 81.4 cents for every dollar earned by a man.
What is Inequality or Gini Index in Urania?
Inequality or Gini Index in Urania is 0.44.
What is the Total Population of Urania?
Total Population of Urania is 1,219.
What is the Total Male Population of Urania?
Total Male Population of Urania is 953.
What is the Total Female Population of Urania?
Total Female Population of Urania is 266.
What is the Ratio of Males per 100 Females in Urania?
There are 358.27 Males per 100 Females in Urania.
What is the Ratio of Females per 100 Males in Urania?
There are 27.91 Females per 100 Males in Urania.
What is the Median Population Age in Urania?
Median Population Age in Urania is 39.5 Years.
What is the Average Family Size in Urania
Average Family Size in Urania is 4.1 People.
What is the Average Household Size in Urania
Average Household Size in Urania is 2.8 People.
How Large is the Labor Force in Urania?
There are 208 People in the Labor Forcein in Urania.
What is the Percentage of People in the Labor Force in Urania?
19.0% of People are in the Labor Force in Urania.
What is the Unemployment Rate in Urania?
Unemployment Rate in Urania is 7.2%.