Tallulah, LA Map & Demographics
Tallulah Map
Tallulah Overview
$14,718
PER CAPITA INCOME
$38,007
AVG FAMILY INCOME
$31,070
AVG HOUSEHOLD INCOME
8.5%
WAGE / INCOME GAP [ % ]
91.5¢/ $1
WAGE / INCOME GAP [ $ ]
0.48
INEQUALITY / GINI INDEX
6,290
TOTAL POPULATION
2,612
MALE POPULATION
3,678
FEMALE POPULATION
71.02
MALES / 100 FEMALES
140.81
FEMALES / 100 MALES
35.1
MEDIAN AGE
3.3
AVG FAMILY SIZE
2.7
AVG HOUSEHOLD SIZE
1,998
LABOR FORCE [ PEOPLE ]
42.0%
PERCENT IN LABOR FORCE
7.1%
UNEMPLOYMENT RATE
Tallulah Zip Codes
Tallulah Area Codes
Income in Tallulah
Income Overview in Tallulah
Per Capita Income in Tallulah is $14,718, while median incomes of families and households are $38,007 and $31,070 respectively.
| Characteristic | Number | Measure |
| Per Capita Income | 6,290 | $14,718 |
| Median Family Income | 1,394 | $38,007 |
| Mean Family Income | 1,394 | $48,622 |
| Median Household Income | 2,131 | $31,070 |
| Mean Household Income | 2,131 | $40,299 |
| Income Deficit | 1,394 | $0 |
| Wage / Income Gap (%) | 6,290 | 8.52% |
| Wage / Income Gap ($) | 6,290 | 91.48¢ per $1 |
| Gini / Inequality Index | 6,290 | 0.48 |
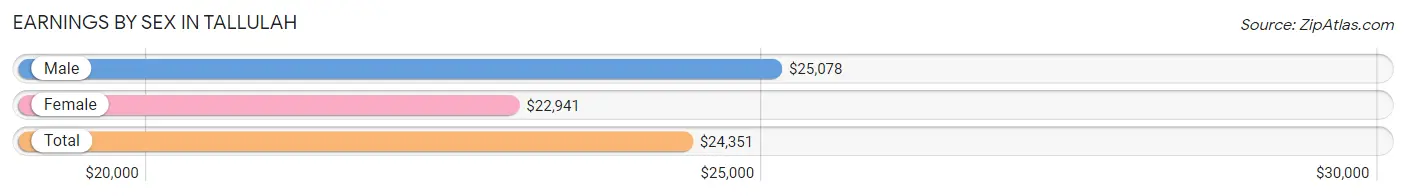
Earnings by Sex in Tallulah
Average Earnings in Tallulah are $24,351, $25,078 for men and $22,941 for women, a difference of 8.5%.
| Sex | Number | Average Earnings |
| Male | 750 (35.5%) | $25,078 |
| Female | 1,364 (64.5%) | $22,941 |
| Total | 2,114 (100.0%) | $24,351 |
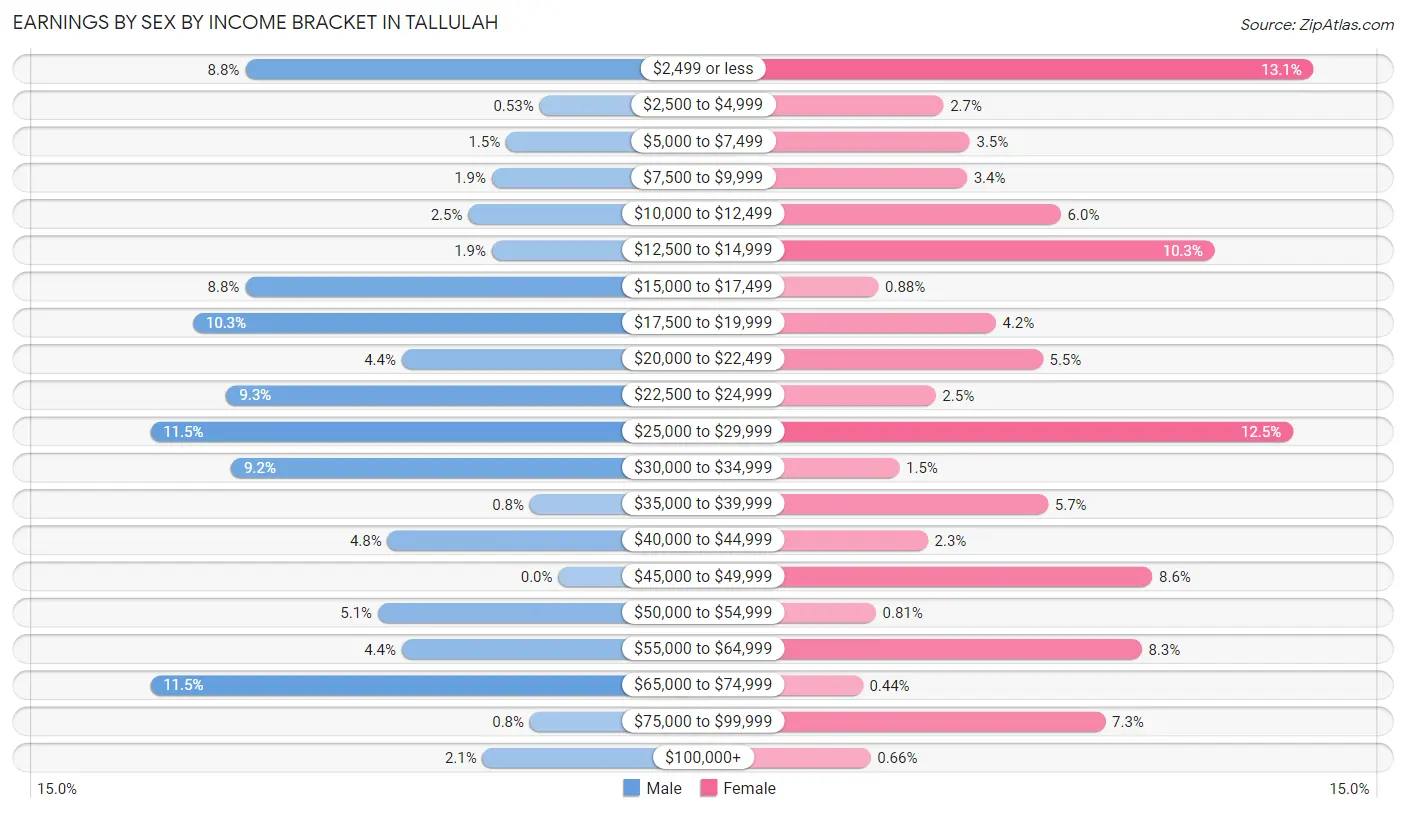
Earnings by Sex by Income Bracket in Tallulah
The most common earnings brackets in Tallulah are $25,000 to $29,999 for men (86 | 11.5%) and $2,499 or less for women (179 | 13.1%).
| Income | Male | Female |
| $2,499 or less | 66 (8.8%) | 179 (13.1%) |
| $2,500 to $4,999 | 4 (0.5%) | 37 (2.7%) |
| $5,000 to $7,499 | 11 (1.5%) | 47 (3.5%) |
| $7,500 to $9,999 | 14 (1.9%) | 46 (3.4%) |
| $10,000 to $12,499 | 19 (2.5%) | 82 (6.0%) |
| $12,500 to $14,999 | 14 (1.9%) | 141 (10.3%) |
| $15,000 to $17,499 | 66 (8.8%) | 12 (0.9%) |
| $17,500 to $19,999 | 77 (10.3%) | 57 (4.2%) |
| $20,000 to $22,499 | 33 (4.4%) | 75 (5.5%) |
| $22,500 to $24,999 | 70 (9.3%) | 34 (2.5%) |
| $25,000 to $29,999 | 86 (11.5%) | 171 (12.5%) |
| $30,000 to $34,999 | 69 (9.2%) | 20 (1.5%) |
| $35,000 to $39,999 | 6 (0.8%) | 77 (5.7%) |
| $40,000 to $44,999 | 36 (4.8%) | 31 (2.3%) |
| $45,000 to $49,999 | 0 (0.0%) | 117 (8.6%) |
| $50,000 to $54,999 | 38 (5.1%) | 11 (0.8%) |
| $55,000 to $64,999 | 33 (4.4%) | 113 (8.3%) |
| $65,000 to $74,999 | 86 (11.5%) | 6 (0.4%) |
| $75,000 to $99,999 | 6 (0.8%) | 99 (7.3%) |
| $100,000+ | 16 (2.1%) | 9 (0.7%) |
| Total | 750 (100.0%) | 1,364 (100.0%) |
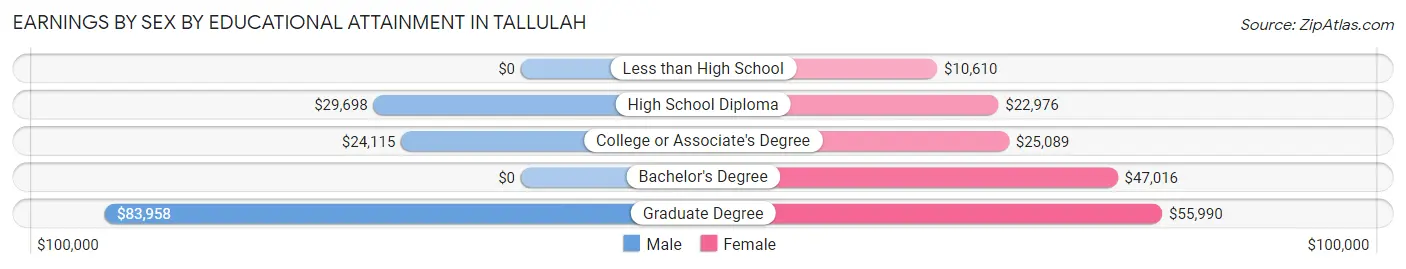
Earnings by Sex by Educational Attainment in Tallulah
Average earnings in Tallulah are $27,531 for men and $25,753 for women, a difference of 6.5%. Men with an educational attainment of graduate degree enjoy the highest average annual earnings of $83,958, while those with college or associate's degree education earn the least with $24,115. Women with an educational attainment of graduate degree earn the most with the average annual earnings of $55,990, while those with less than high school education have the smallest earnings of $10,610.
| Educational Attainment | Male Income | Female Income |
| Less than High School | - | - |
| High School Diploma | $29,698 | $22,976 |
| College or Associate's Degree | $24,115 | $25,089 |
| Bachelor's Degree | - | - |
| Graduate Degree | $83,958 | $55,990 |
| Total | $27,531 | $25,753 |
Family Income in Tallulah
Family Income Brackets in Tallulah
According to the Tallulah family income data, there are 275 families falling into the $50,000 to $74,999 income range, which is the most common income bracket and makes up 19.7% of all families. Conversely, the $200,000+ income bracket is the least frequent group with only 3 families (0.2%) belonging to this category.
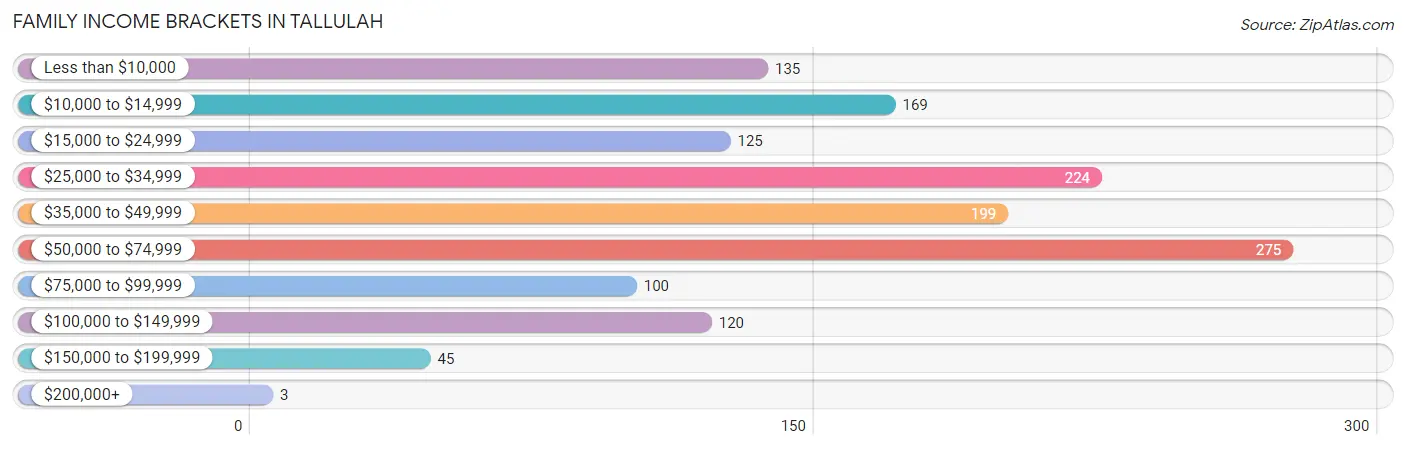
| Income Bracket | # Families | % Families |
| Less than $10,000 | 135 | 9.7% |
| $10,000 to $14,999 | 169 | 12.1% |
| $15,000 to $24,999 | 125 | 9.0% |
| $25,000 to $34,999 | 224 | 16.1% |
| $35,000 to $49,999 | 199 | 14.3% |
| $50,000 to $74,999 | 275 | 19.7% |
| $75,000 to $99,999 | 100 | 7.2% |
| $100,000 to $149,999 | 120 | 8.6% |
| $150,000 to $199,999 | 45 | 3.2% |
| $200,000+ | 3 | 0.2% |
Family Income by Famaliy Size in Tallulah
4-person families (147 | 10.5%) account for the highest median family income in Tallulah with $57,031 per family, while 2-person families (672 | 48.2%) have the highest median income of $23,400 per family member.
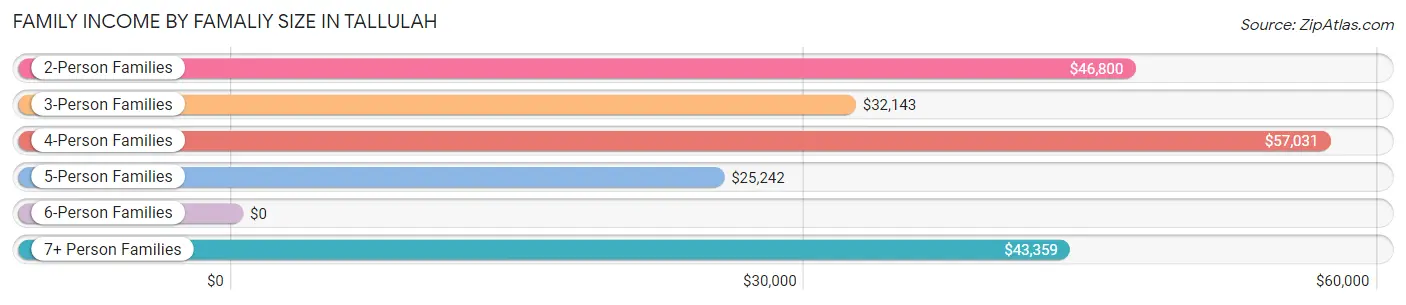
| Income Bracket | # Families | Median Income |
| 2-Person Families | 672 (48.2%) | $46,800 |
| 3-Person Families | 376 (27.0%) | $32,143 |
| 4-Person Families | 147 (10.5%) | $57,031 |
| 5-Person Families | 138 (9.9%) | $25,242 |
| 6-Person Families | 19 (1.4%) | $0 |
| 7+ Person Families | 42 (3.0%) | $43,359 |
| Total | 1,394 (100.0%) | $38,007 |
Family Income by Number of Earners in Tallulah
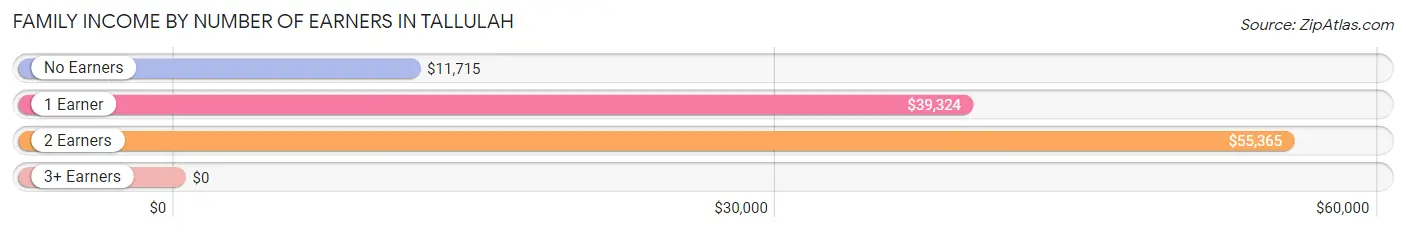
| Number of Earners | # Families | Median Income |
| No Earners | 356 (25.5%) | $11,715 |
| 1 Earner | 484 (34.7%) | $39,324 |
| 2 Earners | 533 (38.2%) | $55,365 |
| 3+ Earners | 21 (1.5%) | $0 |
| Total | 1,394 (100.0%) | $38,007 |
Household Income in Tallulah
Household Income Brackets in Tallulah
With 390 households falling in the category, the $10,000 to $14,999 income range is the most frequent in Tallulah, accounting for 18.3% of all households. In contrast, only 2 households (0.1%) fall into the $200,000+ income bracket, making it the least populous group.
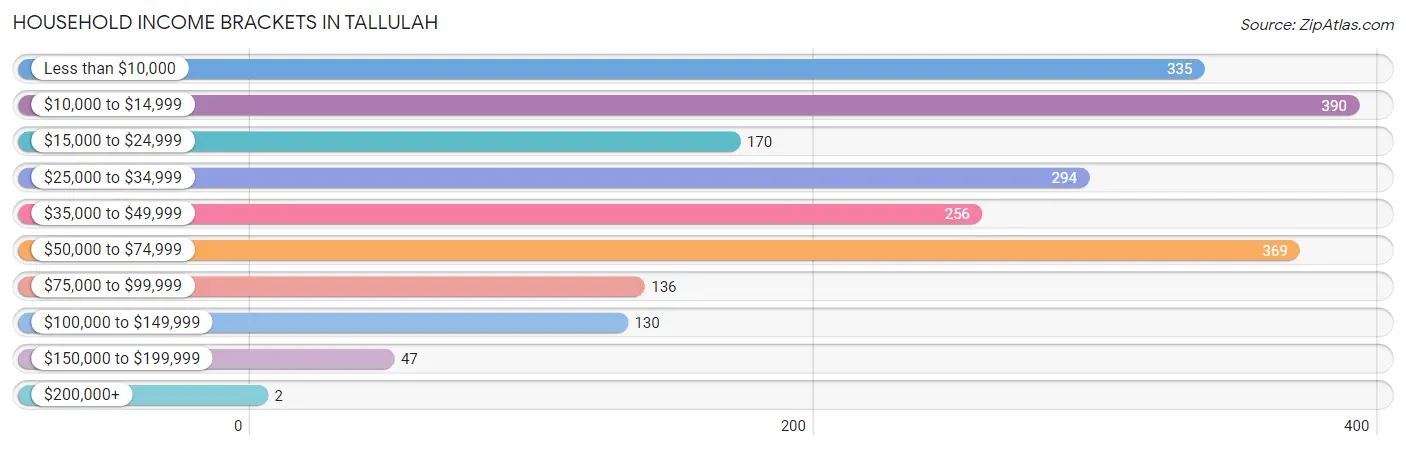
| Income Bracket | # Households | % Households |
| Less than $10,000 | 335 | 15.7% |
| $10,000 to $14,999 | 390 | 18.3% |
| $15,000 to $24,999 | 170 | 8.0% |
| $25,000 to $34,999 | 294 | 13.8% |
| $35,000 to $49,999 | 256 | 12.0% |
| $50,000 to $74,999 | 369 | 17.3% |
| $75,000 to $99,999 | 136 | 6.4% |
| $100,000 to $149,999 | 130 | 6.1% |
| $150,000 to $199,999 | 47 | 2.2% |
| $200,000+ | 2 | 0.1% |
Household Income by Householder Age in Tallulah
The median household income in Tallulah is $31,070, with the highest median household income of $34,261 found in the 45 to 64 years age bracket for the primary householder. A total of 845 households (39.7%) fall into this category. Meanwhile, the 15 to 24 years age bracket for the primary householder has the lowest median household income of $0, with 46 households (2.2%) in this group.
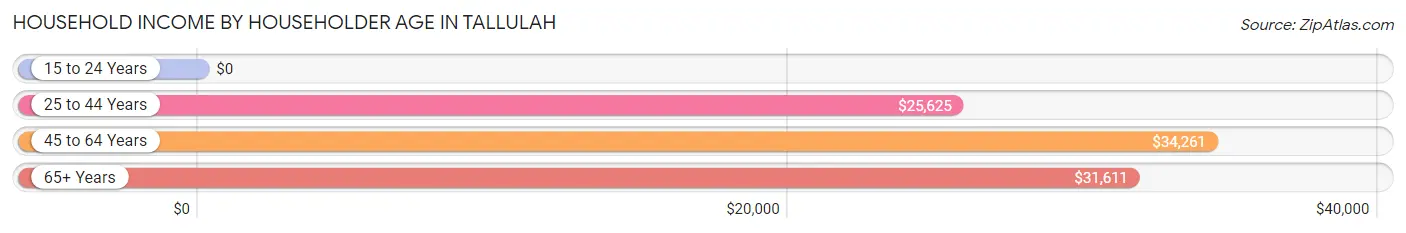
| Income Bracket | # Households | Median Income |
| 15 to 24 Years | 46 (2.2%) | $0 |
| 25 to 44 Years | 501 (23.5%) | $25,625 |
| 45 to 64 Years | 845 (39.7%) | $34,261 |
| 65+ Years | 739 (34.7%) | $31,611 |
| Total | 2,131 (100.0%) | $31,070 |
Poverty in Tallulah
Income Below Poverty by Sex and Age in Tallulah
With 41.1% poverty level for males and 51.9% for females among the residents of Tallulah, under 5 year old males and 6 to 11 year old females are the most vulnerable to poverty, with 176 males (75.5%) and 232 females (92.4%) in their respective age groups living below the poverty level.
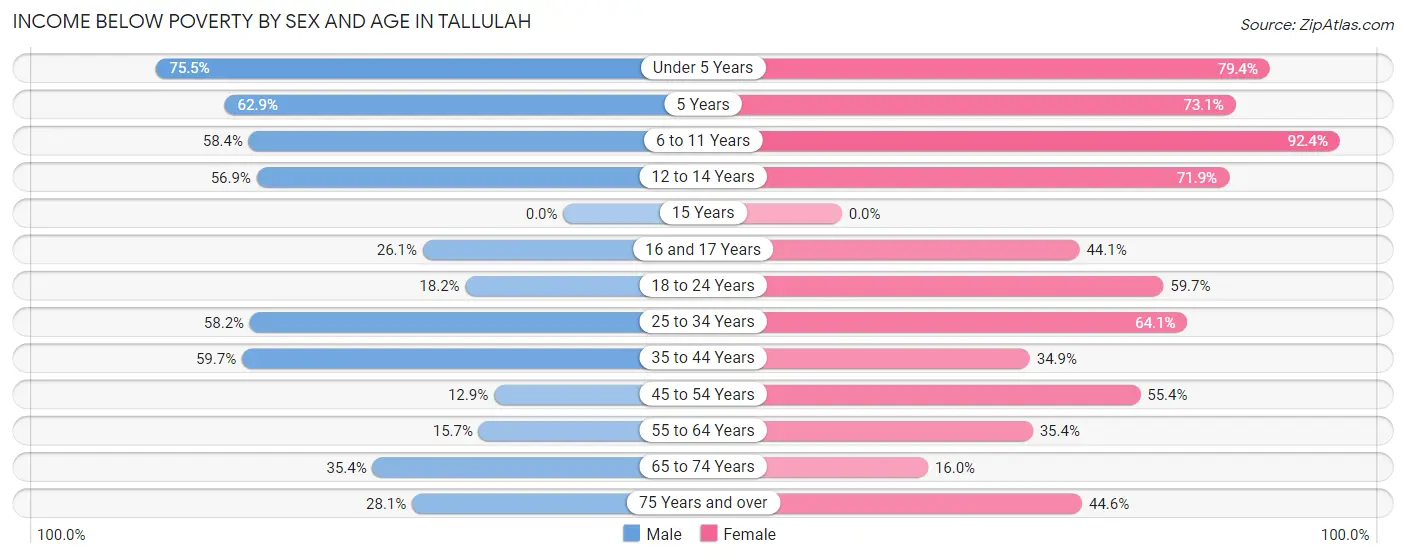
| Age Bracket | Male | Female |
| Under 5 Years | 176 (75.5%) | 228 (79.4%) |
| 5 Years | 66 (62.9%) | 19 (73.1%) |
| 6 to 11 Years | 115 (58.4%) | 232 (92.4%) |
| 12 to 14 Years | 74 (56.9%) | 97 (71.9%) |
| 15 Years | 0 (0.0%) | 0 (0.0%) |
| 16 and 17 Years | 30 (26.1%) | 15 (44.1%) |
| 18 to 24 Years | 42 (18.2%) | 179 (59.7%) |
| 25 to 34 Years | 128 (58.2%) | 245 (64.1%) |
| 35 to 44 Years | 170 (59.7%) | 82 (34.9%) |
| 45 to 54 Years | 26 (12.9%) | 200 (55.4%) |
| 55 to 64 Years | 48 (15.7%) | 168 (35.4%) |
| 65 to 74 Years | 108 (35.4%) | 51 (16.0%) |
| 75 Years and over | 48 (28.1%) | 99 (44.6%) |
| Total | 1,031 (41.1%) | 1,615 (51.9%) |
Income Above Poverty by Sex and Age in Tallulah
According to the poverty statistics in Tallulah, males aged 15 years and females aged 15 years are the age groups that are most secure financially, with 100.0% of males and 100.0% of females in these age groups living above the poverty line.
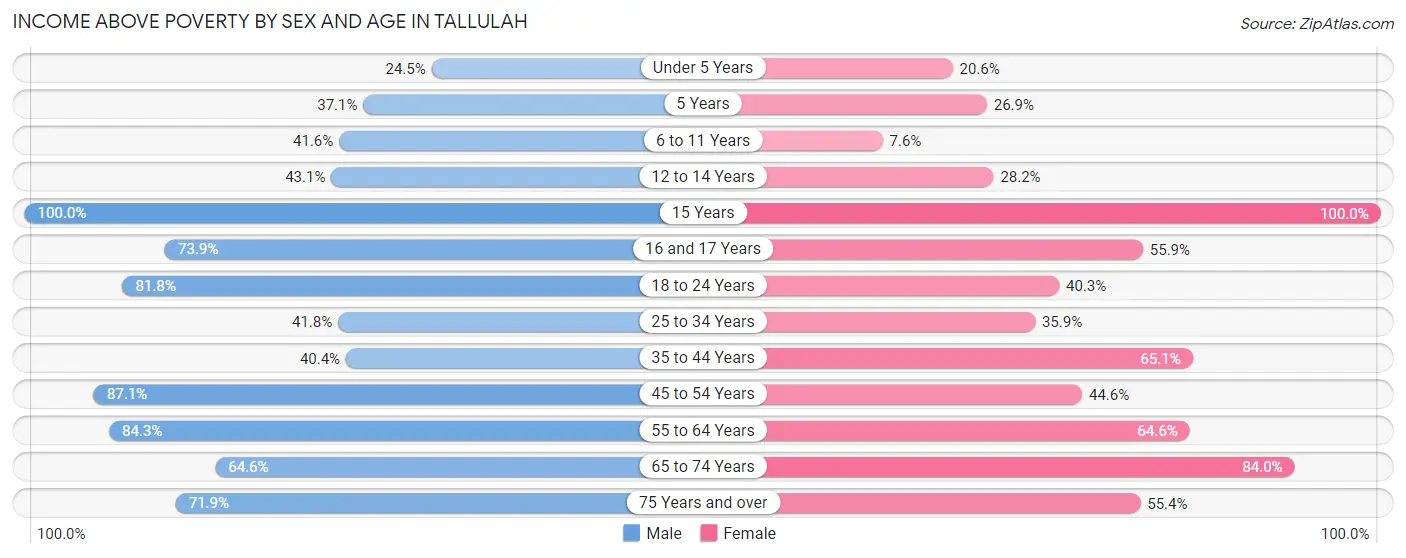
| Age Bracket | Male | Female |
| Under 5 Years | 57 (24.5%) | 59 (20.6%) |
| 5 Years | 39 (37.1%) | 7 (26.9%) |
| 6 to 11 Years | 82 (41.6%) | 19 (7.6%) |
| 12 to 14 Years | 56 (43.1%) | 38 (28.1%) |
| 15 Years | 10 (100.0%) | 87 (100.0%) |
| 16 and 17 Years | 85 (73.9%) | 19 (55.9%) |
| 18 to 24 Years | 189 (81.8%) | 121 (40.3%) |
| 25 to 34 Years | 92 (41.8%) | 137 (35.9%) |
| 35 to 44 Years | 115 (40.4%) | 153 (65.1%) |
| 45 to 54 Years | 176 (87.1%) | 161 (44.6%) |
| 55 to 64 Years | 258 (84.3%) | 306 (64.6%) |
| 65 to 74 Years | 197 (64.6%) | 268 (84.0%) |
| 75 Years and over | 123 (71.9%) | 123 (55.4%) |
| Total | 1,479 (58.9%) | 1,498 (48.1%) |
Income Below Poverty Among Married-Couple Families in Tallulah
The poverty statistics for married-couple families in Tallulah show that 11.8% or 66 of the total 557 families live below the poverty line. Families with 3 or 4 children have the highest poverty rate of 100.0%, comprising of 22 families. On the other hand, families with 5 or more children have the lowest poverty rate of 0.0%, which includes 0 families.
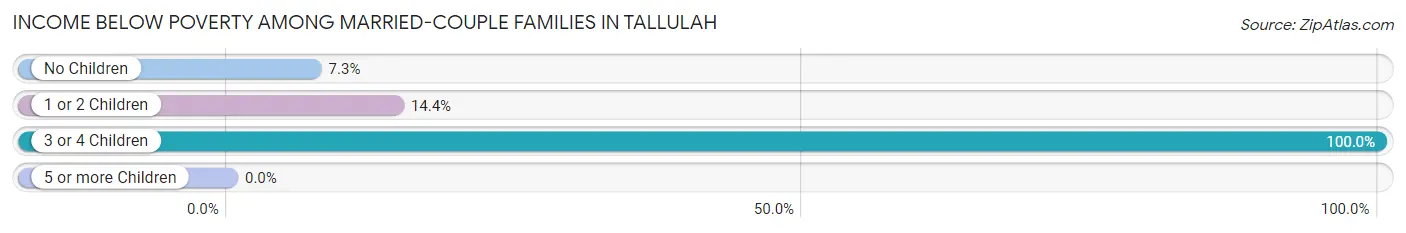
| Children | Above Poverty | Below Poverty |
| No Children | 395 (92.7%) | 31 (7.3%) |
| 1 or 2 Children | 77 (85.6%) | 13 (14.4%) |
| 3 or 4 Children | 0 (0.0%) | 22 (100.0%) |
| 5 or more Children | 19 (100.0%) | 0 (0.0%) |
| Total | 491 (88.1%) | 66 (11.8%) |
Income Below Poverty Among Single-Parent Households in Tallulah
According to the poverty data in Tallulah, 12.2% or 11 single-father households and 51.5% or 385 single-mother households are living below the poverty line. Among single-father households, those with no children have the highest poverty rate, with 11 households (14.5%) experiencing poverty. Likewise, among single-mother households, those with 5 or more children have the highest poverty rate, with 14 households (100.0%) falling below the poverty line.
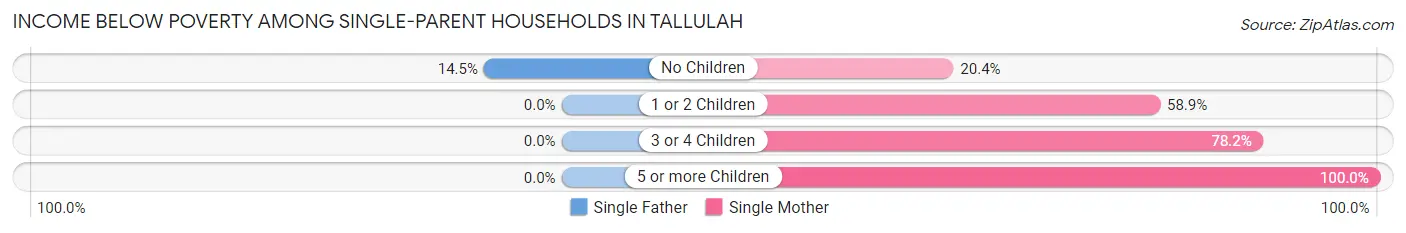
| Children | Single Father | Single Mother |
| No Children | 11 (14.5%) | 46 (20.4%) |
| 1 or 2 Children | 0 (0.0%) | 221 (58.9%) |
| 3 or 4 Children | 0 (0.0%) | 104 (78.2%) |
| 5 or more Children | 0 (0.0%) | 14 (100.0%) |
| Total | 11 (12.2%) | 385 (51.5%) |
Income Below Poverty Among Married-Couple vs Single-Parent Households in Tallulah
The poverty data for Tallulah shows that 66 of the married-couple family households (11.8%) and 396 of the single-parent households (47.3%) are living below the poverty level. Within the married-couple family households, those with 3 or 4 children have the highest poverty rate, with 22 households (100.0%) falling below the poverty line. Among the single-parent households, those with 5 or more children have the highest poverty rate, with 14 household (100.0%) living below poverty.
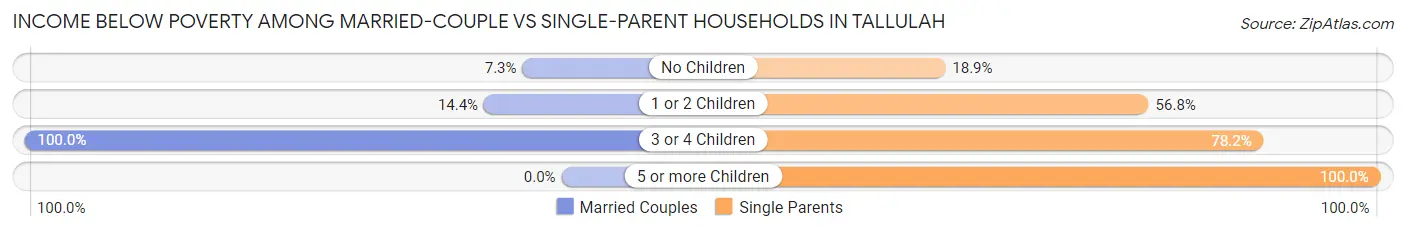
| Children | Married-Couple Families | Single-Parent Households |
| No Children | 31 (7.3%) | 57 (18.9%) |
| 1 or 2 Children | 13 (14.4%) | 221 (56.8%) |
| 3 or 4 Children | 22 (100.0%) | 104 (78.2%) |
| 5 or more Children | 0 (0.0%) | 14 (100.0%) |
| Total | 66 (11.8%) | 396 (47.3%) |
Race in Tallulah
The most populous races in Tallulah are Black / African American (5,096 | 81.0%), White / Caucasian (1,085 | 17.2%), and Two or more Races (103 | 1.6%).
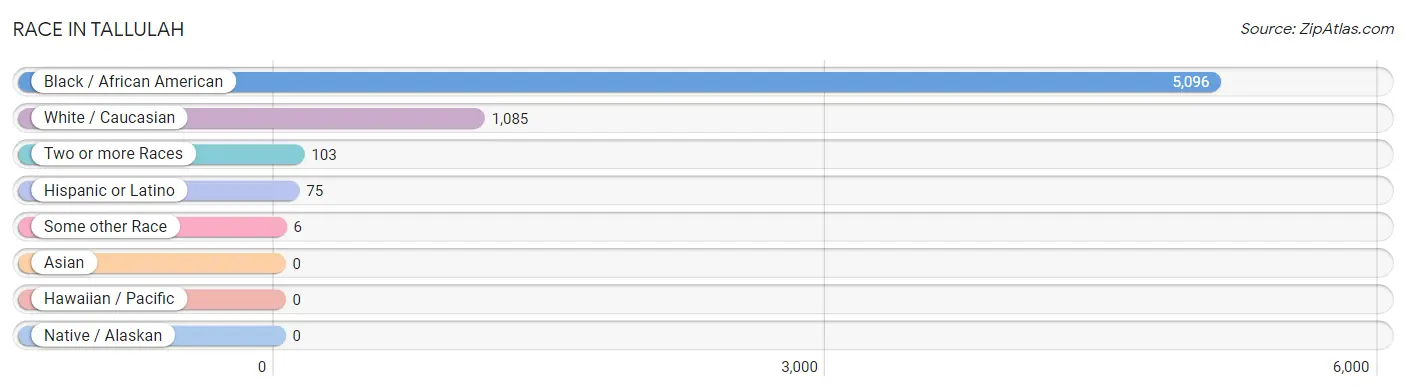
| Race | # Population | % Population |
| Asian | 0 | 0.0% |
| Black / African American | 5,096 | 81.0% |
| Hawaiian / Pacific | 0 | 0.0% |
| Hispanic or Latino | 75 | 1.2% |
| Native / Alaskan | 0 | 0.0% |
| White / Caucasian | 1,085 | 17.2% |
| Two or more Races | 103 | 1.6% |
| Some other Race | 6 | 0.1% |
| Total | 6,290 | 100.0% |
Ancestry in Tallulah
The most populous ancestries reported in Tallulah are American (371 | 5.9%), Irish (93 | 1.5%), Cuban (53 | 0.8%), Italian (48 | 0.8%), and French (45 | 0.7%), together accounting for 9.7% of all Tallulah residents.
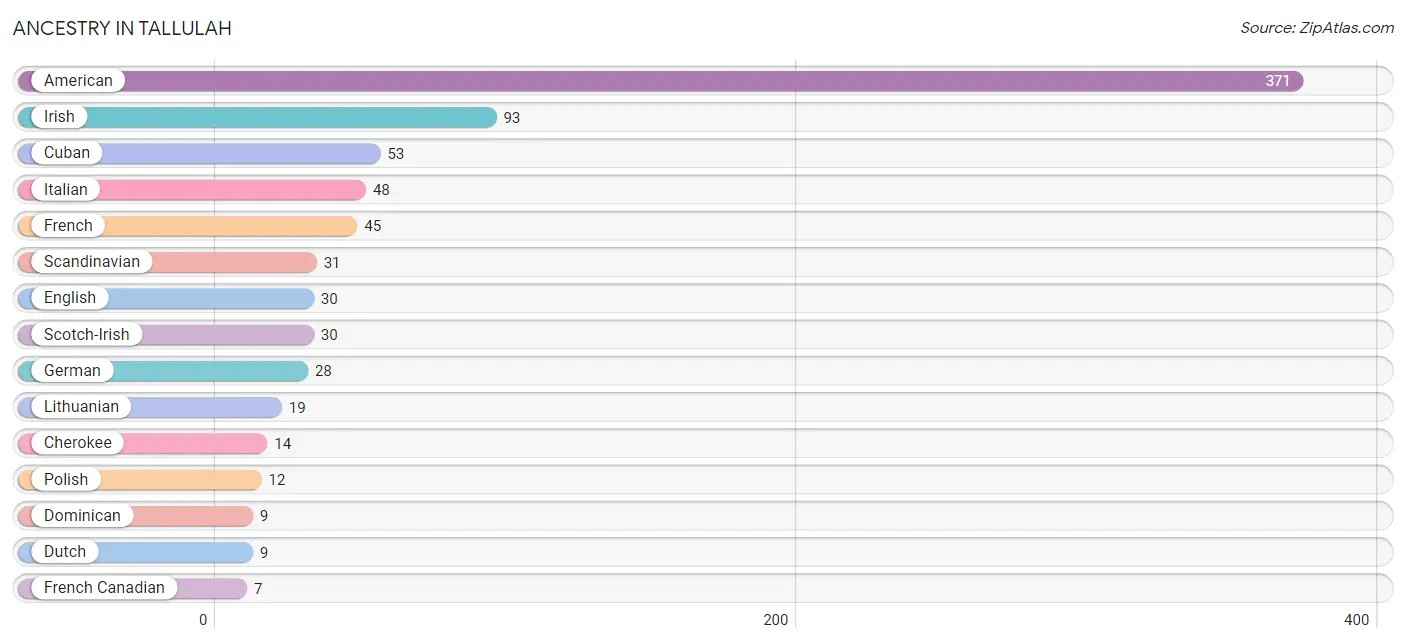
| Ancestry | # Population | % Population |
| American | 371 | 5.9% |
| British | 6 | 0.1% |
| Cajun | 4 | 0.1% |
| Central American | 6 | 0.1% |
| Cherokee | 14 | 0.2% |
| Cuban | 53 | 0.8% |
| Dominican | 9 | 0.1% |
| Dutch | 9 | 0.1% |
| Eastern European | 3 | 0.1% |
| English | 30 | 0.5% |
| European | 5 | 0.1% |
| French | 45 | 0.7% |
| French Canadian | 7 | 0.1% |
| German | 28 | 0.4% |
| Haitian | 5 | 0.1% |
| Honduran | 6 | 0.1% |
| Irish | 93 | 1.5% |
| Israeli | 5 | 0.1% |
| Italian | 48 | 0.8% |
| Lithuanian | 19 | 0.3% |
| Polish | 12 | 0.2% |
| Scandinavian | 31 | 0.5% |
| Scotch-Irish | 30 | 0.5% |
| Spanish | 7 | 0.1% |
| Subsaharan African | 7 | 0.1% |
| West Indian | 6 | 0.1% | View All 26 Rows |
Immigrants in Tallulah
The most numerous immigrant groups reported in Tallulah came from Caribbean (47 | 0.7%), Cuba (47 | 0.7%), Latin America (47 | 0.7%), Europe (13 | 0.2%), and Germany (13 | 0.2%), together accounting for 2.7% of all Tallulah residents.
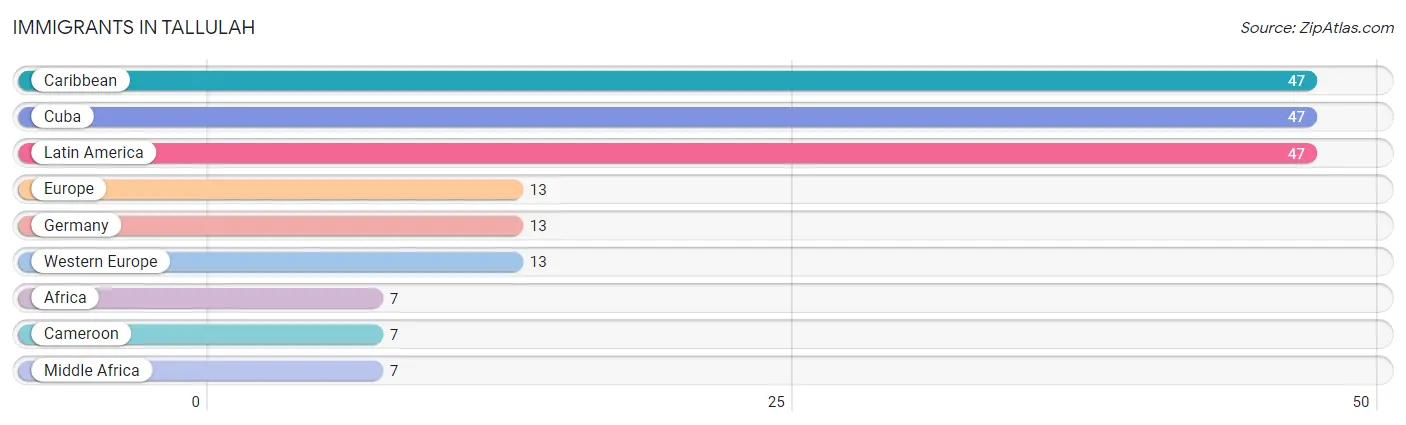
| Immigration Origin | # Population | % Population |
| Africa | 7 | 0.1% |
| Cameroon | 7 | 0.1% |
| Caribbean | 47 | 0.7% |
| Cuba | 47 | 0.7% |
| Europe | 13 | 0.2% |
| Germany | 13 | 0.2% |
| Latin America | 47 | 0.7% |
| Middle Africa | 7 | 0.1% |
| Western Europe | 13 | 0.2% | View All 9 Rows |
Sex and Age in Tallulah
Sex and Age in Tallulah
The most populous age groups in Tallulah are 10 to 14 Years (292 | 11.2%) for men and 30 to 34 Years (350 | 9.5%) for women.
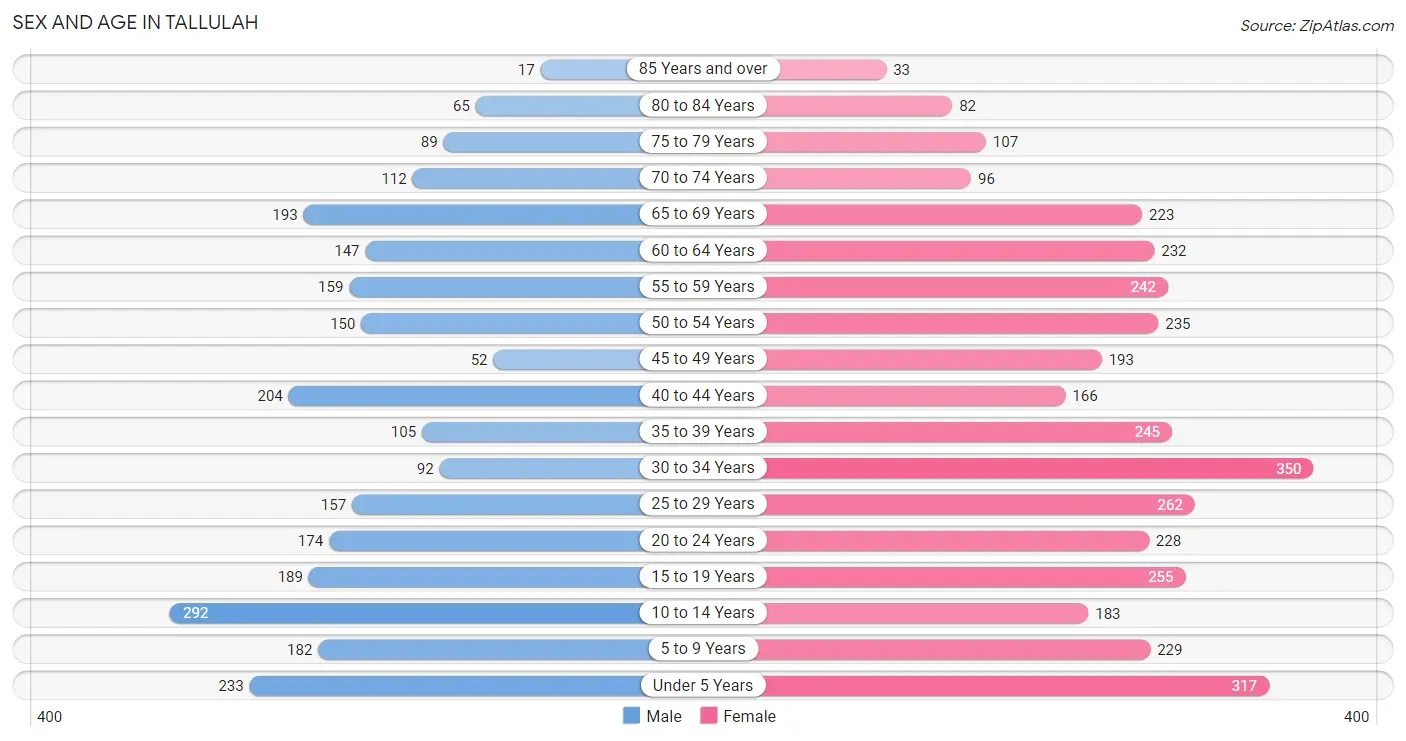
| Age Bracket | Male | Female |
| Under 5 Years | 233 (8.9%) | 317 (8.6%) |
| 5 to 9 Years | 182 (7.0%) | 229 (6.2%) |
| 10 to 14 Years | 292 (11.2%) | 183 (5.0%) |
| 15 to 19 Years | 189 (7.2%) | 255 (6.9%) |
| 20 to 24 Years | 174 (6.7%) | 228 (6.2%) |
| 25 to 29 Years | 157 (6.0%) | 262 (7.1%) |
| 30 to 34 Years | 92 (3.5%) | 350 (9.5%) |
| 35 to 39 Years | 105 (4.0%) | 245 (6.7%) |
| 40 to 44 Years | 204 (7.8%) | 166 (4.5%) |
| 45 to 49 Years | 52 (2.0%) | 193 (5.2%) |
| 50 to 54 Years | 150 (5.7%) | 235 (6.4%) |
| 55 to 59 Years | 159 (6.1%) | 242 (6.6%) |
| 60 to 64 Years | 147 (5.6%) | 232 (6.3%) |
| 65 to 69 Years | 193 (7.4%) | 223 (6.1%) |
| 70 to 74 Years | 112 (4.3%) | 96 (2.6%) |
| 75 to 79 Years | 89 (3.4%) | 107 (2.9%) |
| 80 to 84 Years | 65 (2.5%) | 82 (2.2%) |
| 85 Years and over | 17 (0.6%) | 33 (0.9%) |
| Total | 2,612 (100.0%) | 3,678 (100.0%) |
Families and Households in Tallulah
Median Family Size in Tallulah
The median family size in Tallulah is 3.28 persons per family, with single female/mother families (747 | 53.6%) accounting for the largest median family size of 3.6 persons per family. On the other hand, married-couple families (557 | 40.0%) represent the smallest median family size with 2.86 persons per family.
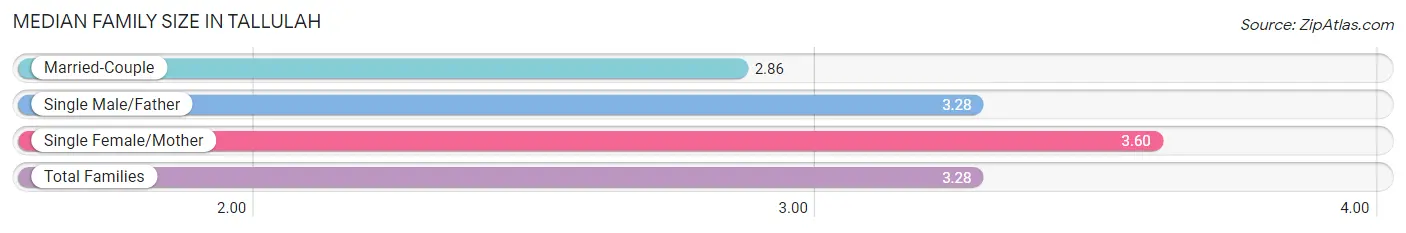
| Family Type | # Families | Family Size |
| Married-Couple | 557 (40.0%) | 2.86 |
| Single Male/Father | 90 (6.5%) | 3.28 |
| Single Female/Mother | 747 (53.6%) | 3.60 |
| Total Families | 1,394 (100.0%) | 3.28 |
Median Household Size in Tallulah
The median household size in Tallulah is 2.67 persons per household, with single female/mother households (747 | 35.0%) accounting for the largest median household size of 3.87 persons per household. non-family households (737 | 34.6%) represent the smallest median household size with 1.18 persons per household.
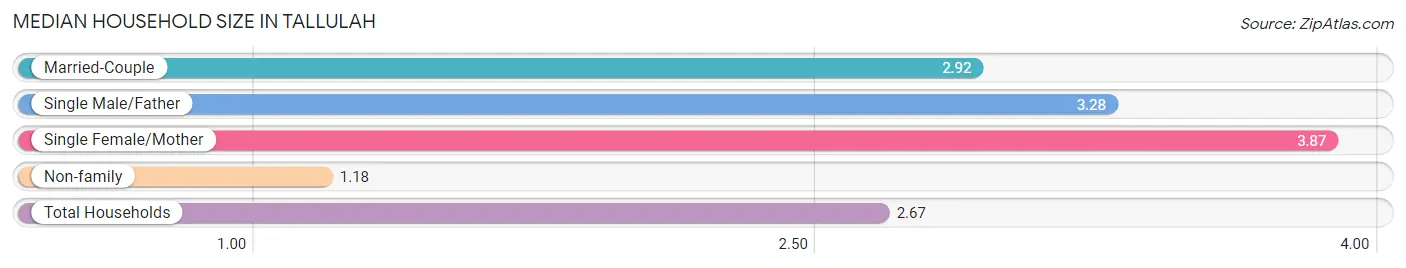
| Household Type | # Households | Household Size |
| Married-Couple | 557 (26.1%) | 2.92 |
| Single Male/Father | 90 (4.2%) | 3.28 |
| Single Female/Mother | 747 (35.0%) | 3.87 |
| Non-family | 737 (34.6%) | 1.18 |
| Total Households | 2,131 (100.0%) | 2.67 |
Household Size by Marriage Status in Tallulah
Out of a total of 2,131 households in Tallulah, 1,394 (65.4%) are family households, while 737 (34.6%) are nonfamily households. The most numerous type of family households are 2-person households, comprising 602, and the most common type of nonfamily households are 1-person households, comprising 669.
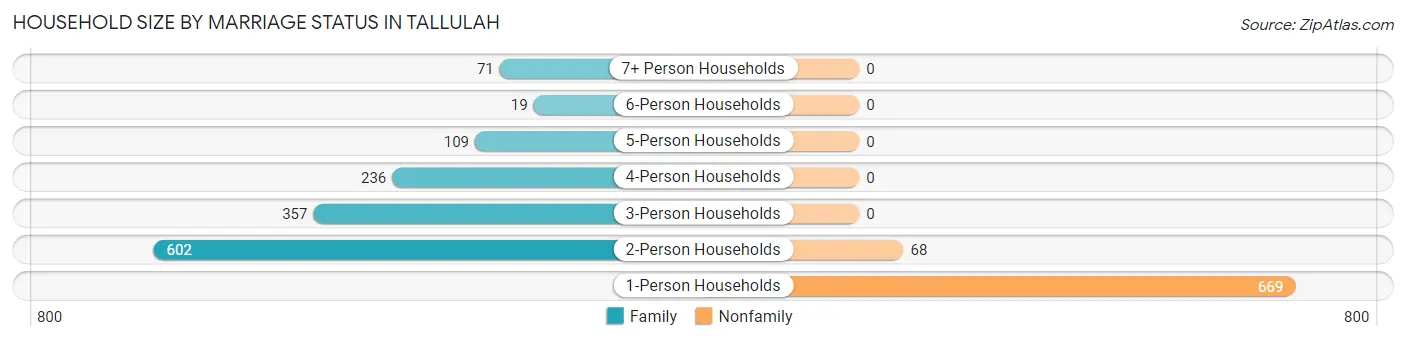
| Household Size | Family Households | Nonfamily Households |
| 1-Person Households | - | 669 (31.4%) |
| 2-Person Households | 602 (28.2%) | 68 (3.2%) |
| 3-Person Households | 357 (16.8%) | 0 (0.0%) |
| 4-Person Households | 236 (11.1%) | 0 (0.0%) |
| 5-Person Households | 109 (5.1%) | 0 (0.0%) |
| 6-Person Households | 19 (0.9%) | 0 (0.0%) |
| 7+ Person Households | 71 (3.3%) | 0 (0.0%) |
| Total | 1,394 (65.4%) | 737 (34.6%) |
Female Fertility in Tallulah
Fertility by Age in Tallulah
Average fertility rate in Tallulah is 55.0 births per 1,000 women. Women in the age bracket of 20 to 34 years have the highest fertility rate with 102.0 births per 1,000 women. Women in the age bracket of 20 to 34 years acount for 88.7% of all women with births.
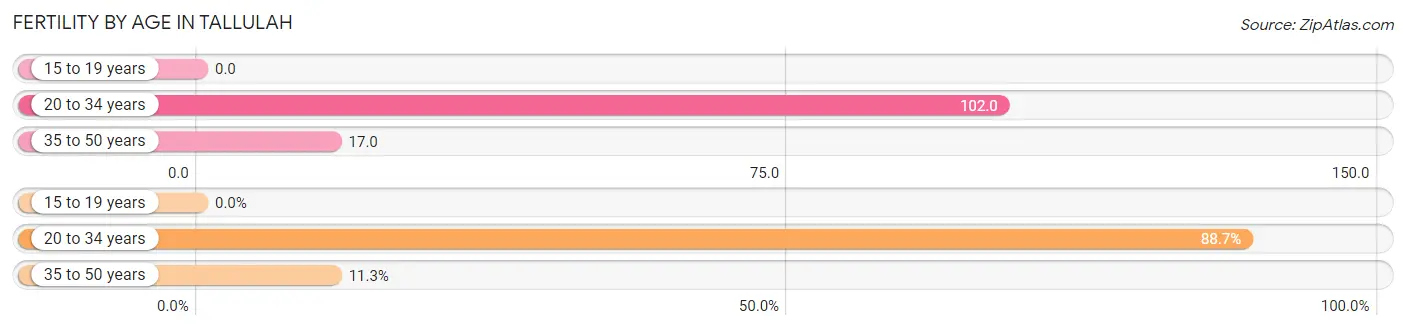
| Age Bracket | Women with Births | Births / 1,000 Women |
| 15 to 19 years | 0 (0.0%) | 0.0 |
| 20 to 34 years | 86 (88.7%) | 102.0 |
| 35 to 50 years | 11 (11.3%) | 17.0 |
| Total | 97 (100.0%) | 55.0 |
Fertility by Age by Marriage Status in Tallulah
22.7% of women with births (97) in Tallulah are married. The highest percentage of unmarried women with births falls into 20 to 34 years age bracket with 81.4% of them unmarried at the time of birth, while the lowest percentage of unmarried women with births belong to 35 to 50 years age bracket with 45.5% of them unmarried.
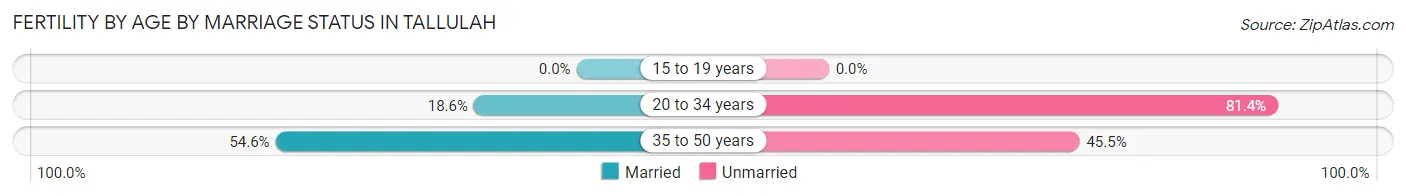
| Age Bracket | Married | Unmarried |
| 15 to 19 years | 0 (0.0%) | 0 (0.0%) |
| 20 to 34 years | 16 (18.6%) | 70 (81.4%) |
| 35 to 50 years | 6 (54.5%) | 5 (45.5%) |
| Total | 22 (22.7%) | 75 (77.3%) |
Fertility by Education in Tallulah
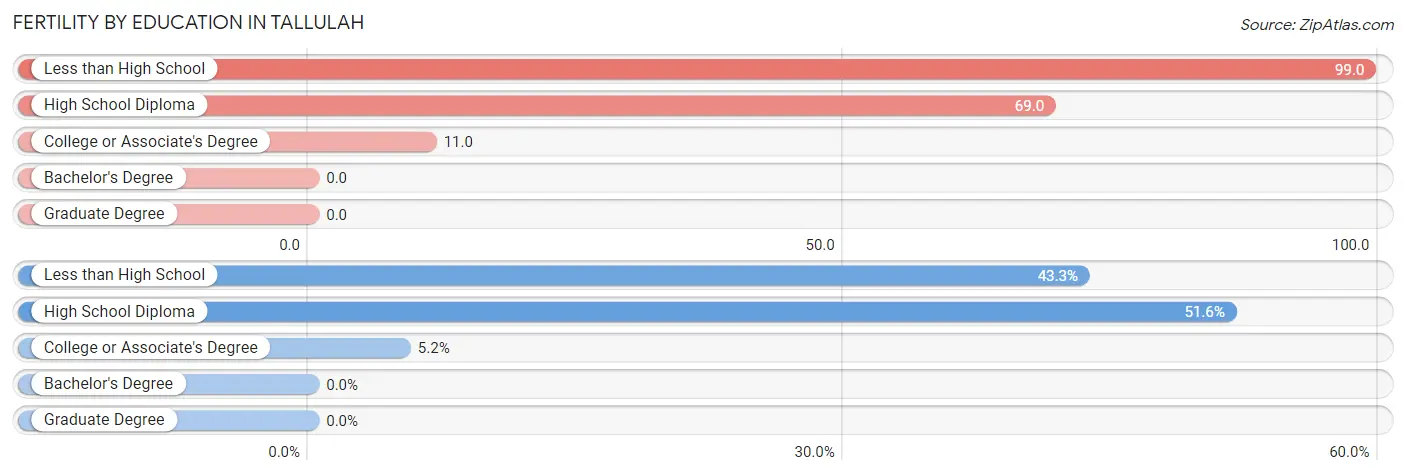
| Educational Attainment | Women with Births | Births / 1,000 Women |
| Less than High School | 42 (43.3%) | 99.0 |
| High School Diploma | 50 (51.5%) | 69.0 |
| College or Associate's Degree | 5 (5.1%) | 11.0 |
| Bachelor's Degree | 0 (0.0%) | 0.0 |
| Graduate Degree | 0 (0.0%) | 0.0 |
| Total | 97 (100.0%) | 55.0 |
Fertility by Education by Marriage Status in Tallulah
77.3% of women with births in Tallulah are unmarried. Women with the educational attainment of less than high school are most likely to be married with 45.2% of them married at childbirth, while women with the educational attainment of college or associate's degree are least likely to be married with 100.0% of them unmarried at childbirth.
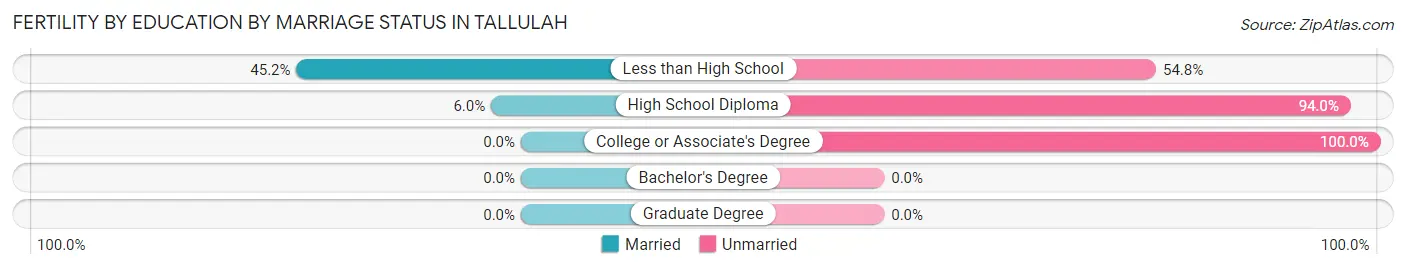
| Educational Attainment | Married | Unmarried |
| Less than High School | 19 (45.2%) | 23 (54.8%) |
| High School Diploma | 3 (6.0%) | 47 (94.0%) |
| College or Associate's Degree | 0 (0.0%) | 5 (100.0%) |
| Bachelor's Degree | 0 (0.0%) | 0 (0.0%) |
| Graduate Degree | 0 (0.0%) | 0 (0.0%) |
| Total | 22 (22.7%) | 75 (77.3%) |
Employment Characteristics in Tallulah
Employment by Class of Employer in Tallulah
Among the 1,803 employed individuals in Tallulah, private company employees (1,031 | 57.2%), local government employees (302 | 16.8%), and state government employees (201 | 11.2%) make up the most common classes of employment.
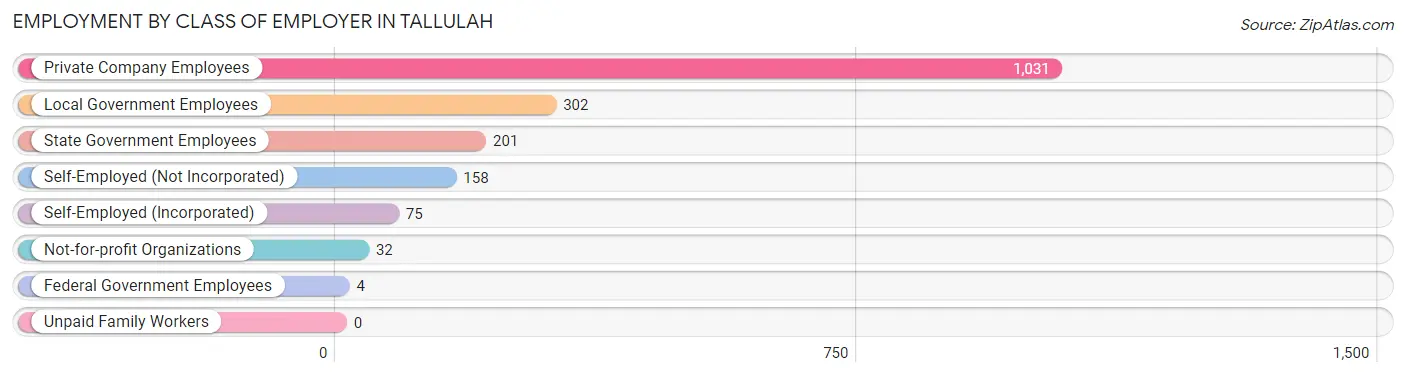
| Employer Class | # Employees | % Employees |
| Private Company Employees | 1,031 | 57.2% |
| Self-Employed (Incorporated) | 75 | 4.2% |
| Self-Employed (Not Incorporated) | 158 | 8.8% |
| Not-for-profit Organizations | 32 | 1.8% |
| Local Government Employees | 302 | 16.8% |
| State Government Employees | 201 | 11.2% |
| Federal Government Employees | 4 | 0.2% |
| Unpaid Family Workers | 0 | 0.0% |
| Total | 1,803 | 100.0% |
Employment Status by Age in Tallulah
According to the labor force statistics for Tallulah, out of the total population over 16 years of age (4,757), 42.0% or 1,998 individuals are in the labor force, with 7.1% or 142 of them unemployed. The age group with the highest labor force participation rate is 55 to 59 years, with 67.8% or 272 individuals in the labor force. Within the labor force, the 25 to 29 years age range has the highest percentage of unemployed individuals, with 25.4% or 43 of them being unemployed.

| Age Bracket | In Labor Force | Unemployed |
| 16 to 19 Years | 103 (29.7%) | 22 (21.4%) |
| 20 to 24 Years | 170 (42.3%) | 31 (18.2%) |
| 25 to 29 Years | 169 (40.3%) | 43 (25.4%) |
| 30 to 34 Years | 164 (37.1%) | 3 (1.8%) |
| 35 to 44 Years | 279 (38.8%) | 20 (7.2%) |
| 45 to 54 Years | 332 (52.7%) | 9 (2.7%) |
| 55 to 59 Years | 272 (67.8%) | 0 (0.0%) |
| 60 to 64 Years | 231 (60.9%) | 14 (6.1%) |
| 65 to 74 Years | 252 (40.4%) | 0 (0.0%) |
| 75 Years and over | 24 (6.1%) | 0 (0.0%) |
| Total | 1,998 (42.0%) | 142 (7.1%) |
Employment Status by Educational Attainment in Tallulah
According to labor force statistics for Tallulah, 48.4% of individuals (1,448) out of the total population between 25 and 64 years of age (2,991) are in the labor force, with 6.2% or 90 of them being unemployed. The group with the highest labor force participation rate are those with the educational attainment of bachelor's degree or higher, with 84.3% or 359 individuals in the labor force. Within the labor force, individuals with bachelor's degree or higher education have the highest percentage of unemployment, with 8.4% or 30 of them being unemployed.
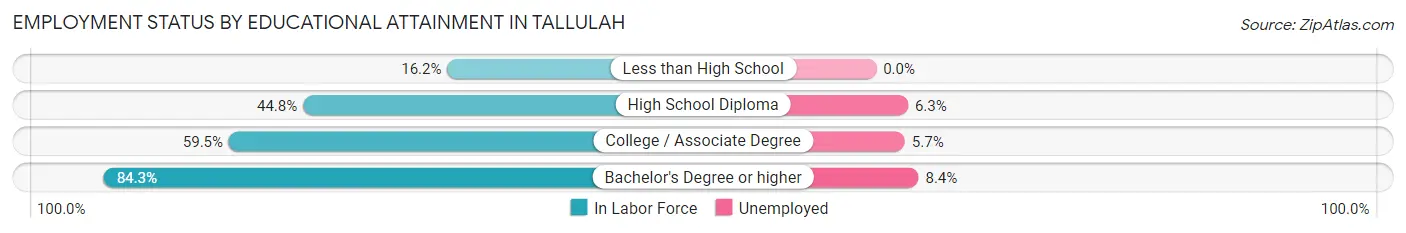
| Educational Attainment | In Labor Force | Unemployed |
| Less than High School | 104 (16.2%) | 0 (0.0%) |
| High School Diploma | 491 (44.8%) | 69 (6.3%) |
| College / Associate Degree | 493 (59.5%) | 47 (5.7%) |
| Bachelor's Degree or higher | 359 (84.3%) | 36 (8.4%) |
| Total | 1,448 (48.4%) | 185 (6.2%) |
Employment Occupations by Sex in Tallulah
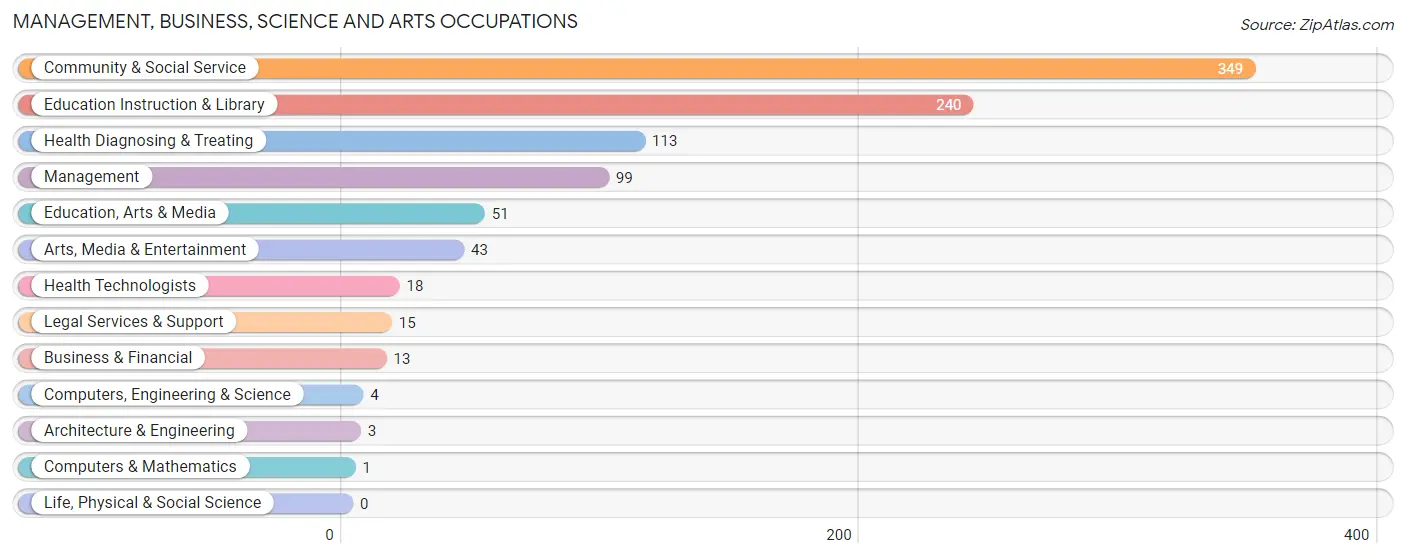
Management, Business, Science and Arts Occupations
The most common Management, Business, Science and Arts occupations in Tallulah are Community & Social Service (349 | 18.8%), Education Instruction & Library (240 | 12.9%), Health Diagnosing & Treating (113 | 6.1%), Management (99 | 5.3%), and Education, Arts & Media (51 | 2.8%).
Management, Business, Science and Arts Occupations by Sex
Within the Management, Business, Science and Arts occupations in Tallulah, the most male-oriented occupations are Computers & Mathematics (100.0%), Management (57.6%), and Education, Arts & Media (43.1%), while the most female-oriented occupations are Business & Financial (100.0%), Architecture & Engineering (100.0%), and Legal Services & Support (100.0%).
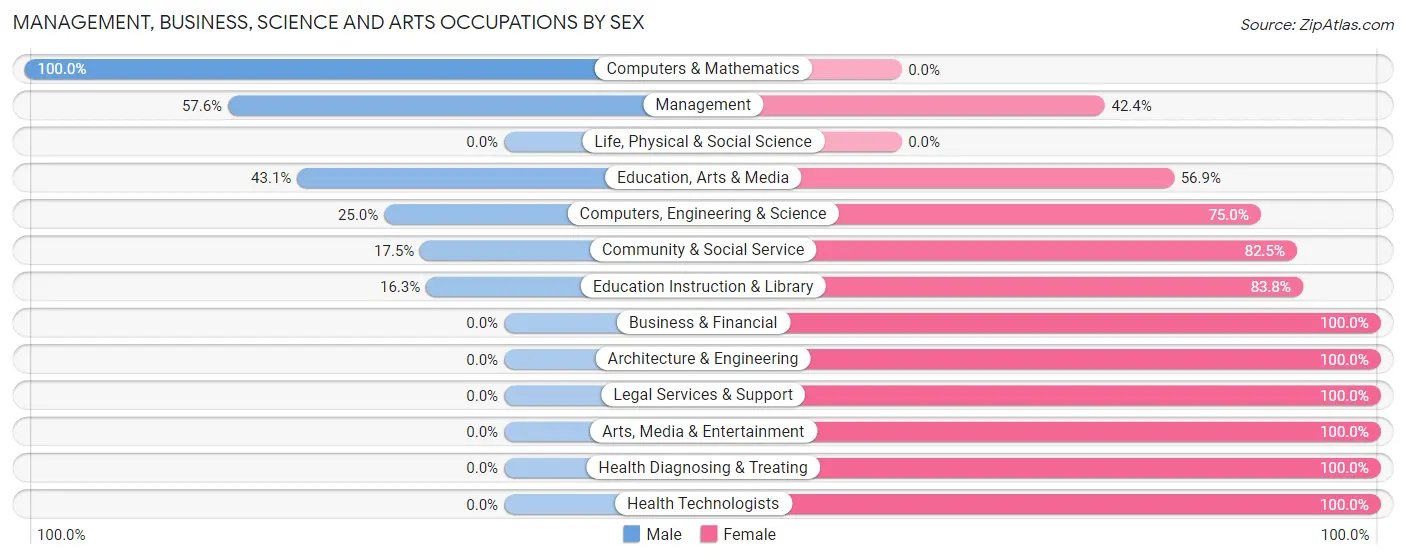
| Occupation | Male | Female |
| Management | 57 (57.6%) | 42 (42.4%) |
| Business & Financial | 0 (0.0%) | 13 (100.0%) |
| Computers, Engineering & Science | 1 (25.0%) | 3 (75.0%) |
| Computers & Mathematics | 1 (100.0%) | 0 (0.0%) |
| Architecture & Engineering | 0 (0.0%) | 3 (100.0%) |
| Life, Physical & Social Science | 0 (0.0%) | 0 (0.0%) |
| Community & Social Service | 61 (17.5%) | 288 (82.5%) |
| Education, Arts & Media | 22 (43.1%) | 29 (56.9%) |
| Legal Services & Support | 0 (0.0%) | 15 (100.0%) |
| Education Instruction & Library | 39 (16.3%) | 201 (83.8%) |
| Arts, Media & Entertainment | 0 (0.0%) | 43 (100.0%) |
| Health Diagnosing & Treating | 0 (0.0%) | 113 (100.0%) |
| Health Technologists | 0 (0.0%) | 18 (100.0%) |
| Total (Category) | 119 (20.6%) | 459 (79.4%) |
| Total (Overall) | 647 (34.9%) | 1,207 (65.1%) |
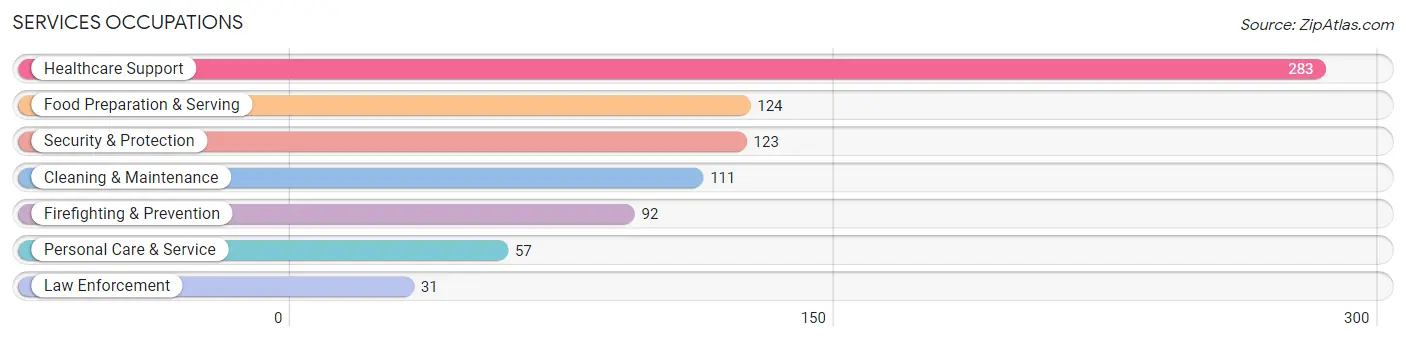
Services Occupations
The most common Services occupations in Tallulah are Healthcare Support (283 | 15.3%), Food Preparation & Serving (124 | 6.7%), Security & Protection (123 | 6.6%), Cleaning & Maintenance (111 | 6.0%), and Firefighting & Prevention (92 | 5.0%).
Services Occupations by Sex
Within the Services occupations in Tallulah, the most male-oriented occupations are Cleaning & Maintenance (67.6%), Firefighting & Prevention (41.3%), and Security & Protection (34.2%), while the most female-oriented occupations are Law Enforcement (87.1%), Food Preparation & Serving (74.2%), and Healthcare Support (73.9%).
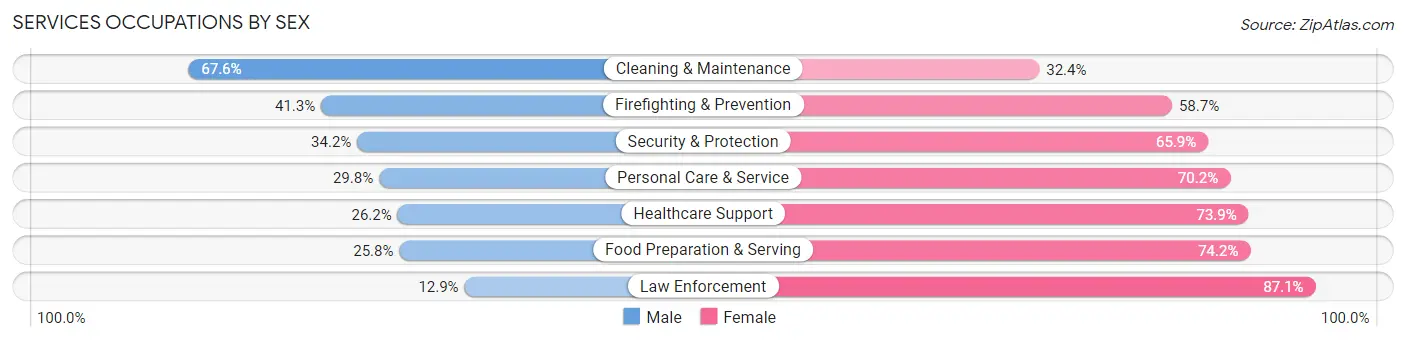
| Occupation | Male | Female |
| Healthcare Support | 74 (26.2%) | 209 (73.9%) |
| Security & Protection | 42 (34.2%) | 81 (65.8%) |
| Firefighting & Prevention | 38 (41.3%) | 54 (58.7%) |
| Law Enforcement | 4 (12.9%) | 27 (87.1%) |
| Food Preparation & Serving | 32 (25.8%) | 92 (74.2%) |
| Cleaning & Maintenance | 75 (67.6%) | 36 (32.4%) |
| Personal Care & Service | 17 (29.8%) | 40 (70.2%) |
| Total (Category) | 240 (34.4%) | 458 (65.6%) |
| Total (Overall) | 647 (34.9%) | 1,207 (65.1%) |
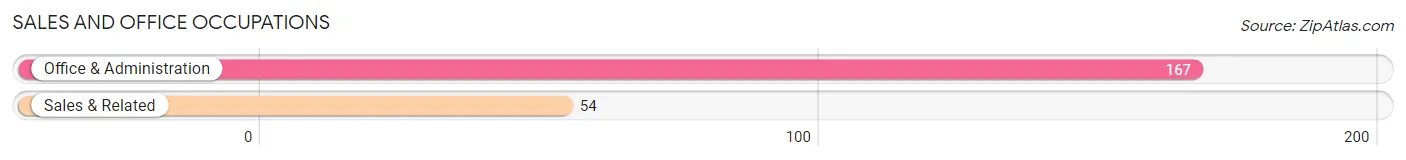
Sales and Office Occupations
The most common Sales and Office occupations in Tallulah are Office & Administration (167 | 9.0%), and Sales & Related (54 | 2.9%).
Sales and Office Occupations by Sex
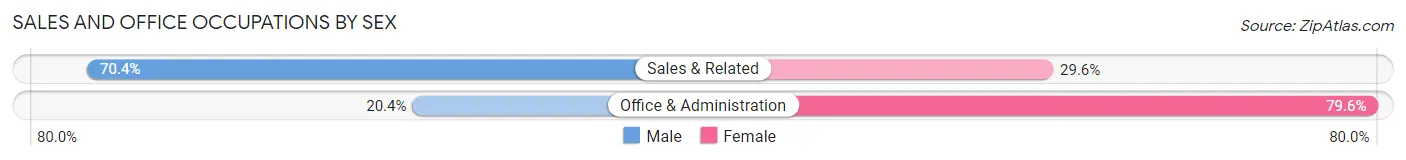
| Occupation | Male | Female |
| Sales & Related | 38 (70.4%) | 16 (29.6%) |
| Office & Administration | 34 (20.4%) | 133 (79.6%) |
| Total (Category) | 72 (32.6%) | 149 (67.4%) |
| Total (Overall) | 647 (34.9%) | 1,207 (65.1%) |
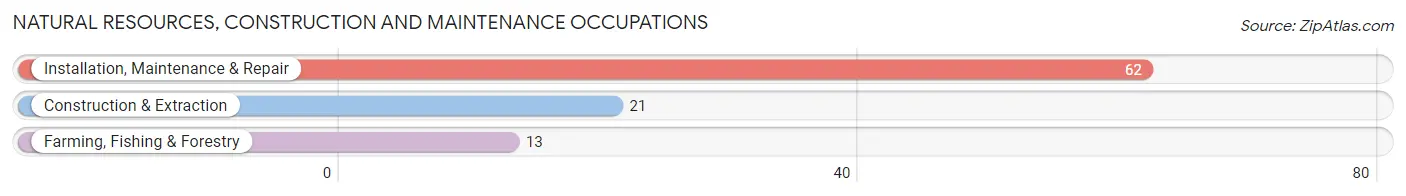
Natural Resources, Construction and Maintenance Occupations
The most common Natural Resources, Construction and Maintenance occupations in Tallulah are Installation, Maintenance & Repair (62 | 3.3%), Construction & Extraction (21 | 1.1%), and Farming, Fishing & Forestry (13 | 0.7%).
Natural Resources, Construction and Maintenance Occupations by Sex
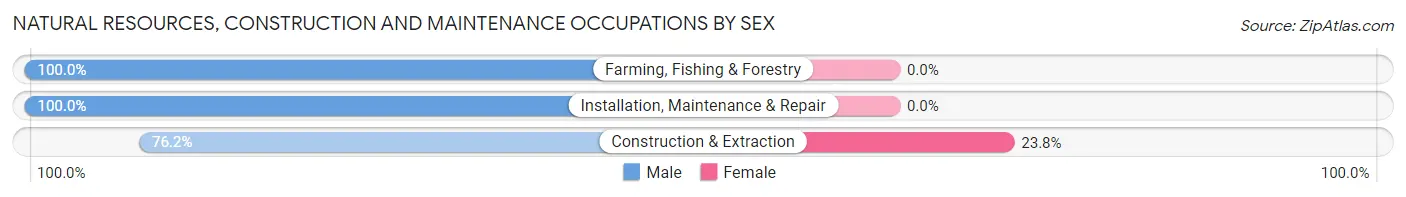
| Occupation | Male | Female |
| Farming, Fishing & Forestry | 13 (100.0%) | 0 (0.0%) |
| Construction & Extraction | 16 (76.2%) | 5 (23.8%) |
| Installation, Maintenance & Repair | 62 (100.0%) | 0 (0.0%) |
| Total (Category) | 91 (94.8%) | 5 (5.2%) |
| Total (Overall) | 647 (34.9%) | 1,207 (65.1%) |
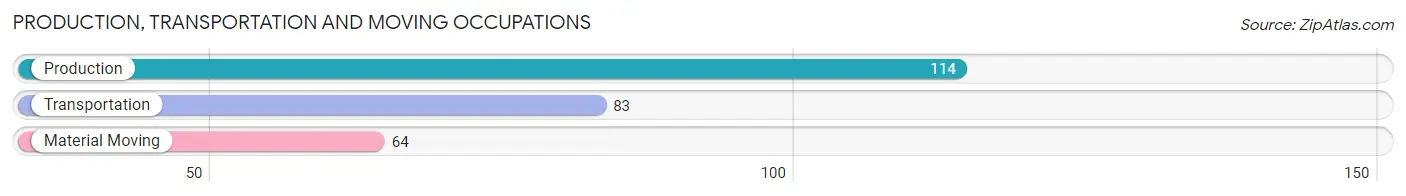
Production, Transportation and Moving Occupations
The most common Production, Transportation and Moving occupations in Tallulah are Production (114 | 6.1%), Transportation (83 | 4.5%), and Material Moving (64 | 3.5%).
Production, Transportation and Moving Occupations by Sex
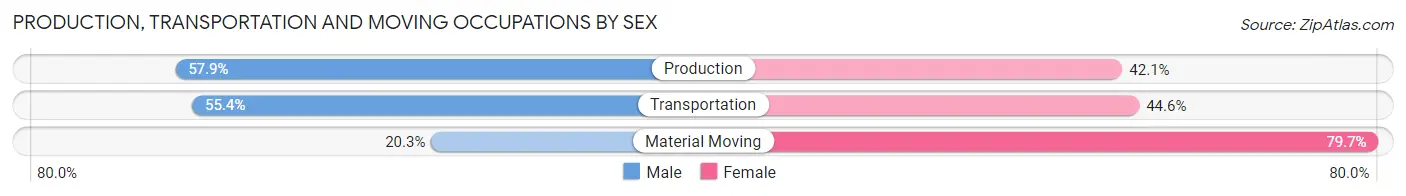
| Occupation | Male | Female |
| Production | 66 (57.9%) | 48 (42.1%) |
| Transportation | 46 (55.4%) | 37 (44.6%) |
| Material Moving | 13 (20.3%) | 51 (79.7%) |
| Total (Category) | 125 (47.9%) | 136 (52.1%) |
| Total (Overall) | 647 (34.9%) | 1,207 (65.1%) |
Employment Industries by Sex in Tallulah
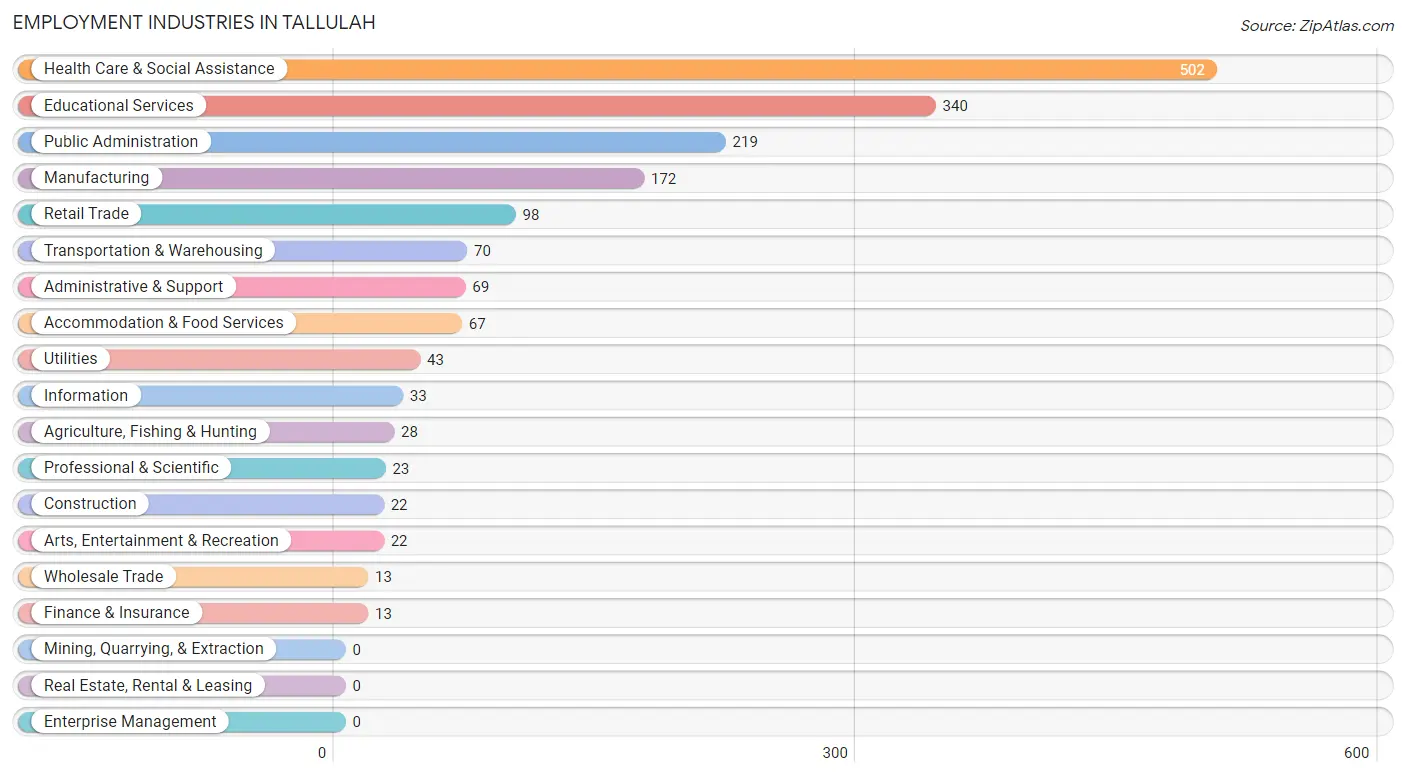
Employment Industries in Tallulah
The major employment industries in Tallulah include Health Care & Social Assistance (502 | 27.1%), Educational Services (340 | 18.3%), Public Administration (219 | 11.8%), Manufacturing (172 | 9.3%), and Retail Trade (98 | 5.3%).
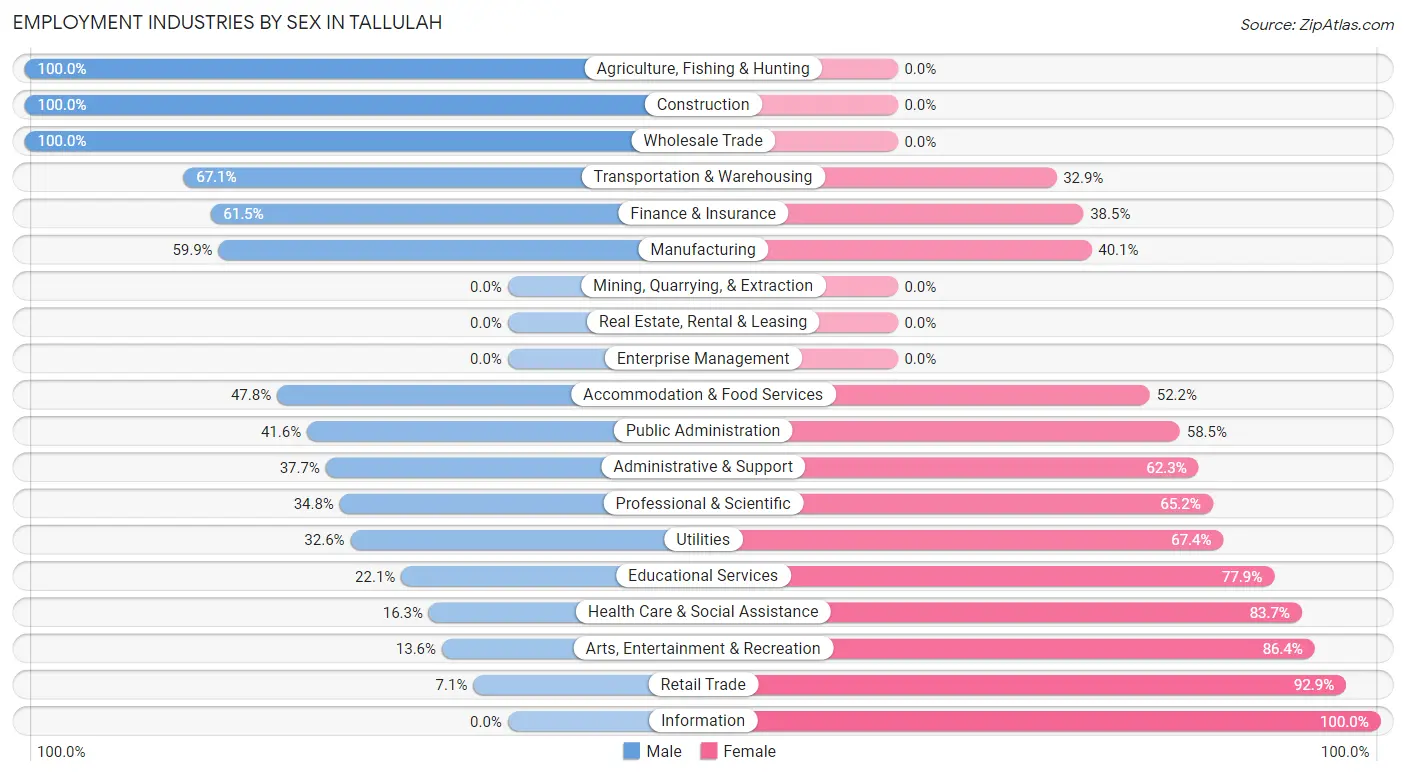
Employment Industries by Sex in Tallulah
The Tallulah industries that see more men than women are Agriculture, Fishing & Hunting (100.0%), Construction (100.0%), and Wholesale Trade (100.0%), whereas the industries that tend to have a higher number of women are Information (100.0%), Retail Trade (92.9%), and Arts, Entertainment & Recreation (86.4%).
| Industry | Male | Female |
| Agriculture, Fishing & Hunting | 28 (100.0%) | 0 (0.0%) |
| Mining, Quarrying, & Extraction | 0 (0.0%) | 0 (0.0%) |
| Construction | 22 (100.0%) | 0 (0.0%) |
| Manufacturing | 103 (59.9%) | 69 (40.1%) |
| Wholesale Trade | 13 (100.0%) | 0 (0.0%) |
| Retail Trade | 7 (7.1%) | 91 (92.9%) |
| Transportation & Warehousing | 47 (67.1%) | 23 (32.9%) |
| Utilities | 14 (32.6%) | 29 (67.4%) |
| Information | 0 (0.0%) | 33 (100.0%) |
| Finance & Insurance | 8 (61.5%) | 5 (38.5%) |
| Real Estate, Rental & Leasing | 0 (0.0%) | 0 (0.0%) |
| Professional & Scientific | 8 (34.8%) | 15 (65.2%) |
| Enterprise Management | 0 (0.0%) | 0 (0.0%) |
| Administrative & Support | 26 (37.7%) | 43 (62.3%) |
| Educational Services | 75 (22.1%) | 265 (77.9%) |
| Health Care & Social Assistance | 82 (16.3%) | 420 (83.7%) |
| Arts, Entertainment & Recreation | 3 (13.6%) | 19 (86.4%) |
| Accommodation & Food Services | 32 (47.8%) | 35 (52.2%) |
| Public Administration | 91 (41.5%) | 128 (58.5%) |
| Total | 647 (34.9%) | 1,207 (65.1%) |
Education in Tallulah
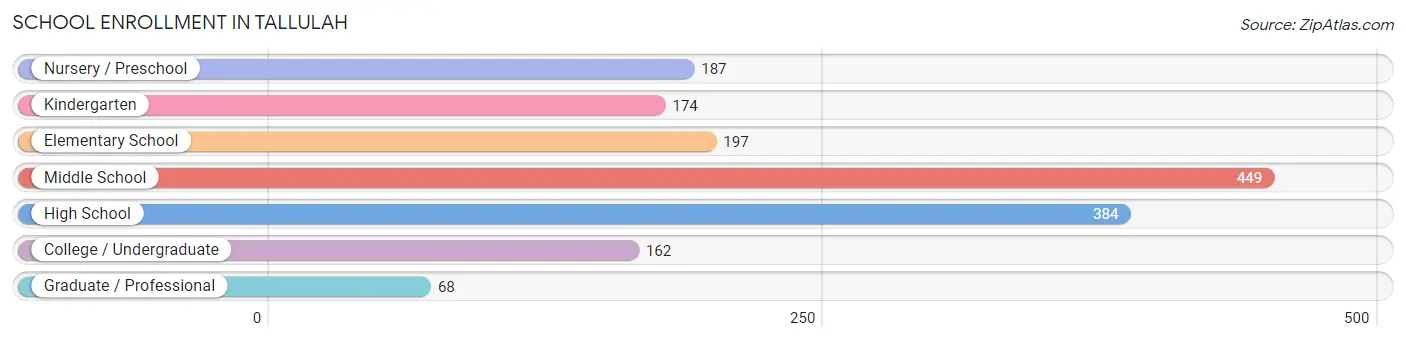
School Enrollment in Tallulah
The most common levels of schooling among the 1,621 students in Tallulah are middle school (449 | 27.7%), high school (384 | 23.7%), and elementary school (197 | 12.1%).
| School Level | # Students | % Students |
| Nursery / Preschool | 187 | 11.5% |
| Kindergarten | 174 | 10.7% |
| Elementary School | 197 | 12.1% |
| Middle School | 449 | 27.7% |
| High School | 384 | 23.7% |
| College / Undergraduate | 162 | 10.0% |
| Graduate / Professional | 68 | 4.2% |
| Total | 1,621 | 100.0% |
School Enrollment by Age by Funding Source in Tallulah
Out of a total of 1,621 students who are enrolled in schools in Tallulah, 242 (14.9%) attend a private institution, while the remaining 1,379 (85.1%) are enrolled in public schools. The age group of 25 to 34 year olds has the highest likelihood of being enrolled in private schools, with 102 (73.4% in the age bracket) enrolled. Conversely, the age group of 3 to 4 year olds has the lowest likelihood of being enrolled in a private school, with 182 (100.0% in the age bracket) attending a public institution.
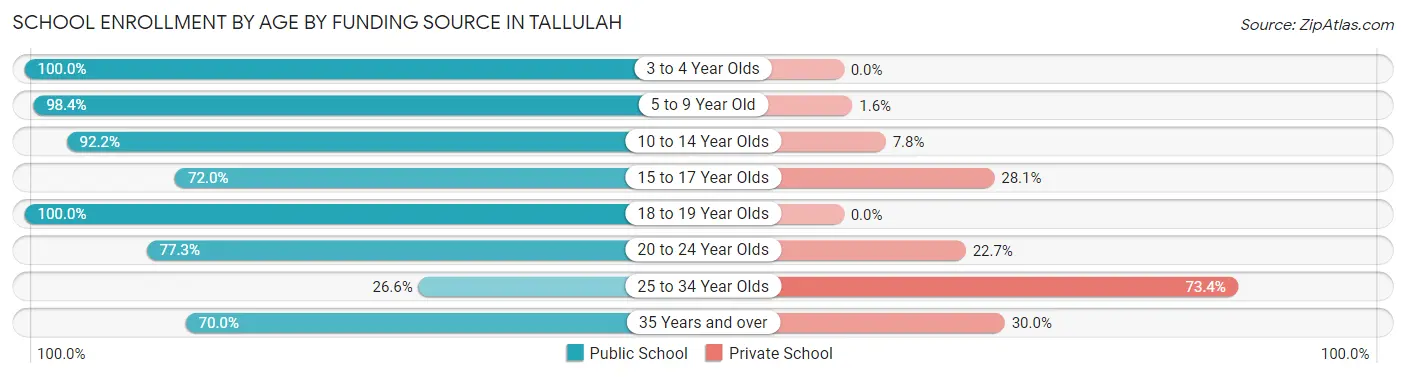
| Age Bracket | Public School | Private School |
| 3 to 4 Year Olds | 182 (100.0%) | 0 (0.0%) |
| 5 to 9 Year Old | 367 (98.4%) | 6 (1.6%) |
| 10 to 14 Year Olds | 424 (92.2%) | 36 (7.8%) |
| 15 to 17 Year Olds | 177 (72.0%) | 69 (28.1%) |
| 18 to 19 Year Olds | 119 (100.0%) | 0 (0.0%) |
| 20 to 24 Year Olds | 17 (77.3%) | 5 (22.7%) |
| 25 to 34 Year Olds | 37 (26.6%) | 102 (73.4%) |
| 35 Years and over | 56 (70.0%) | 24 (30.0%) |
| Total | 1,379 (85.1%) | 242 (14.9%) |
Educational Attainment by Field of Study in Tallulah
Education (125 | 21.1%), business (119 | 20.1%), arts & humanities (82 | 13.9%), communications (60 | 10.2%), and engineering (55 | 9.3%) are the most common fields of study among 591 individuals in Tallulah who have obtained a bachelor's degree or higher.
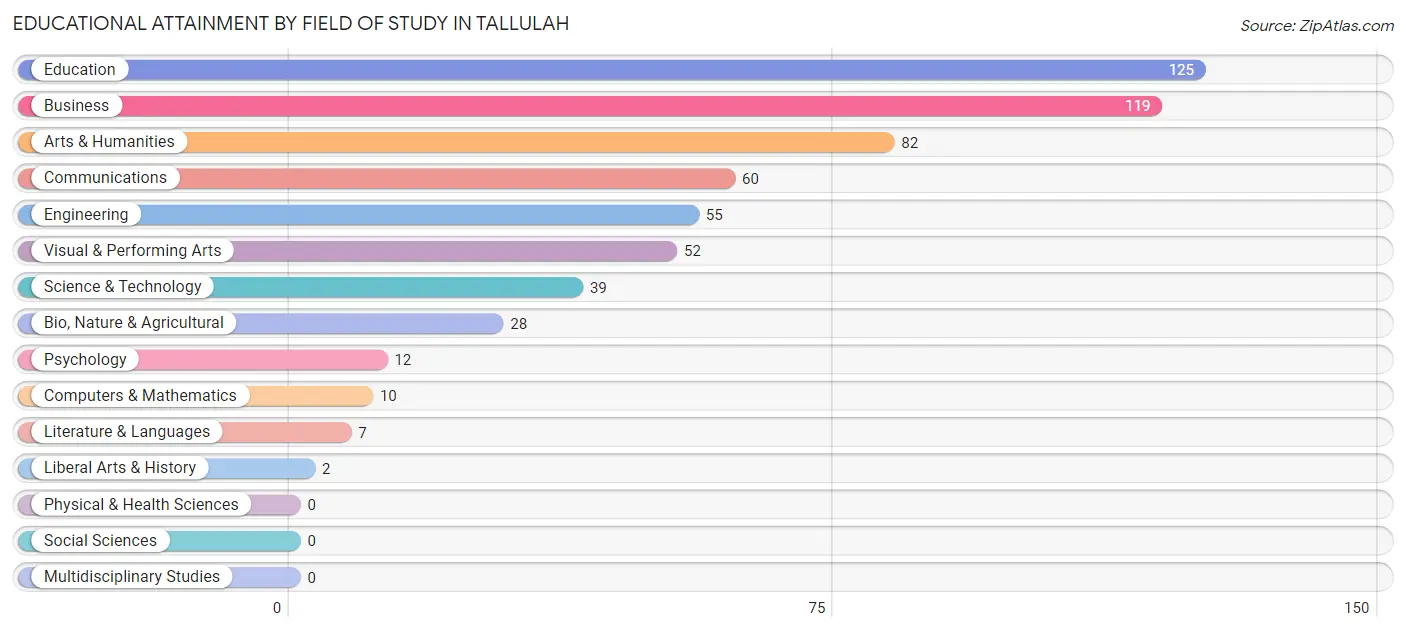
| Field of Study | # Graduates | % Graduates |
| Computers & Mathematics | 10 | 1.7% |
| Bio, Nature & Agricultural | 28 | 4.7% |
| Physical & Health Sciences | 0 | 0.0% |
| Psychology | 12 | 2.0% |
| Social Sciences | 0 | 0.0% |
| Engineering | 55 | 9.3% |
| Multidisciplinary Studies | 0 | 0.0% |
| Science & Technology | 39 | 6.6% |
| Business | 119 | 20.1% |
| Education | 125 | 21.1% |
| Literature & Languages | 7 | 1.2% |
| Liberal Arts & History | 2 | 0.3% |
| Visual & Performing Arts | 52 | 8.8% |
| Communications | 60 | 10.2% |
| Arts & Humanities | 82 | 13.9% |
| Total | 591 | 100.0% |
Transportation & Commute in Tallulah
Vehicle Availability by Sex in Tallulah
The most prevalent vehicle ownership categories in Tallulah are males with 2 vehicles (326, accounting for 53.3%) and females with 2 vehicles (492, making up 27.4%).
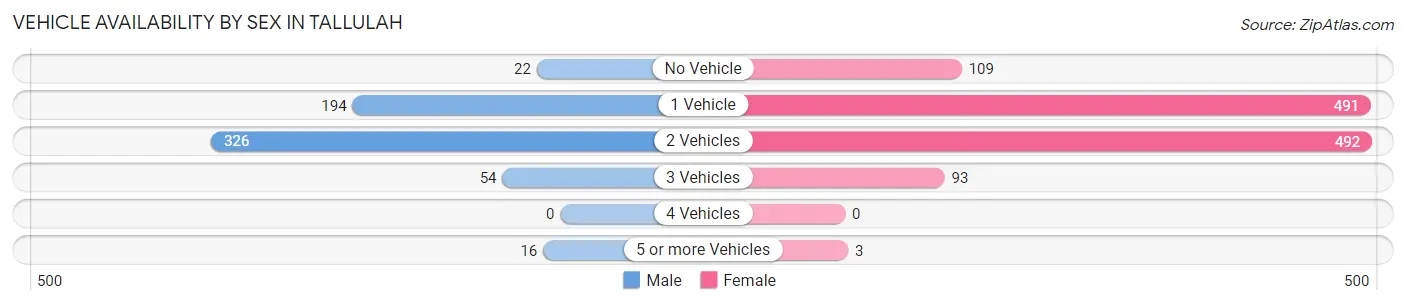
| Vehicles Available | Male | Female |
| No Vehicle | 22 (3.6%) | 109 (9.2%) |
| 1 Vehicle | 194 (31.7%) | 491 (41.3%) |
| 2 Vehicles | 326 (53.3%) | 492 (41.4%) |
| 3 Vehicles | 54 (8.8%) | 93 (7.8%) |
| 4 Vehicles | 0 (0.0%) | 0 (0.0%) |
| 5 or more Vehicles | 16 (2.6%) | 3 (0.3%) |
| Total | 612 (100.0%) | 1,188 (100.0%) |
Commute Time in Tallulah
The most frequently occuring commute durations in Tallulah are 5 to 9 minutes (548 commuters, 30.9%), 10 to 14 minutes (299 commuters, 16.9%), and less than 5 minutes (244 commuters, 13.8%).
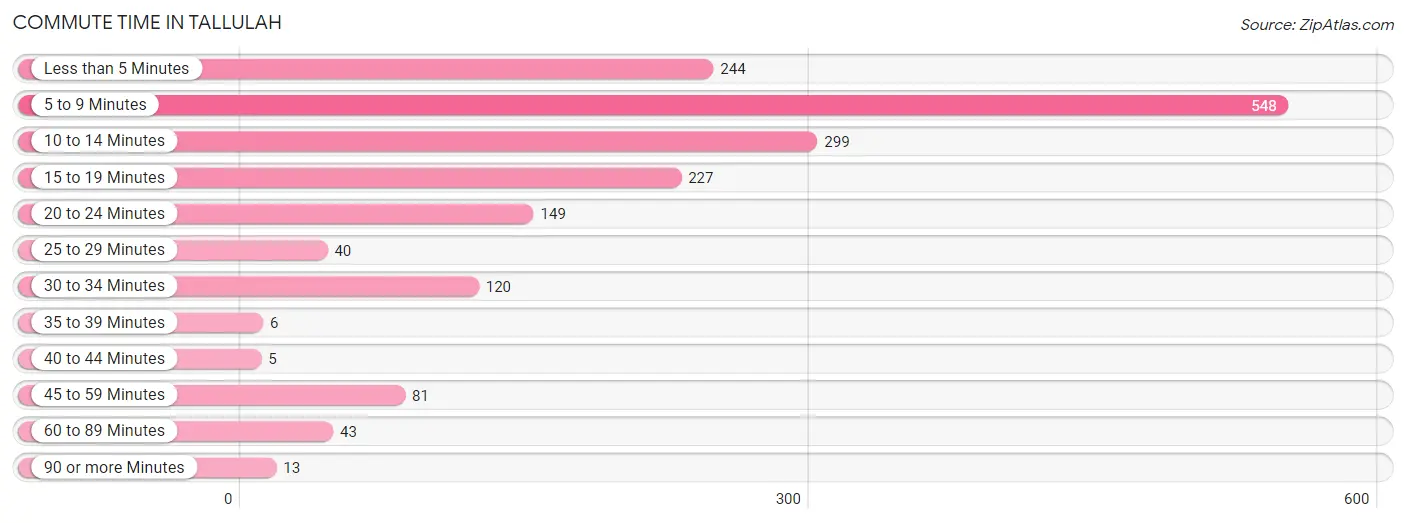
| Commute Time | # Commuters | % Commuters |
| Less than 5 Minutes | 244 | 13.8% |
| 5 to 9 Minutes | 548 | 30.9% |
| 10 to 14 Minutes | 299 | 16.9% |
| 15 to 19 Minutes | 227 | 12.8% |
| 20 to 24 Minutes | 149 | 8.4% |
| 25 to 29 Minutes | 40 | 2.2% |
| 30 to 34 Minutes | 120 | 6.8% |
| 35 to 39 Minutes | 6 | 0.3% |
| 40 to 44 Minutes | 5 | 0.3% |
| 45 to 59 Minutes | 81 | 4.6% |
| 60 to 89 Minutes | 43 | 2.4% |
| 90 or more Minutes | 13 | 0.7% |
Commute Time by Sex in Tallulah
The most common commute times in Tallulah are less than 5 minutes (126 commuters, 20.8%) for males and 5 to 9 minutes (445 commuters, 38.1%) for females.
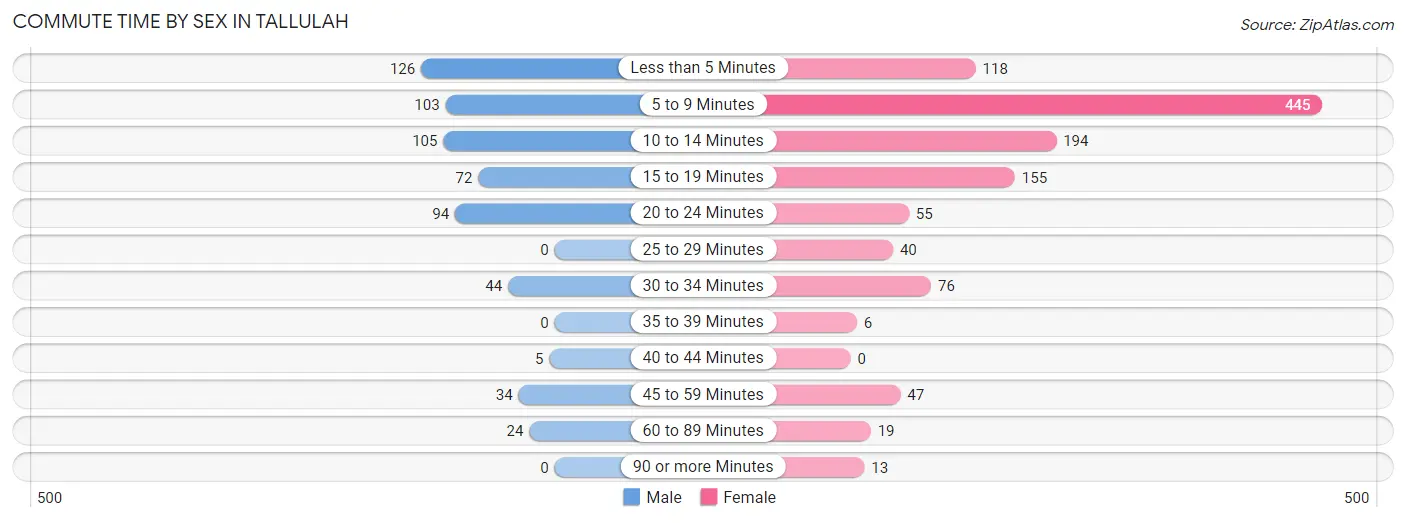
| Commute Time | Male | Female |
| Less than 5 Minutes | 126 (20.8%) | 118 (10.1%) |
| 5 to 9 Minutes | 103 (17.0%) | 445 (38.1%) |
| 10 to 14 Minutes | 105 (17.3%) | 194 (16.6%) |
| 15 to 19 Minutes | 72 (11.9%) | 155 (13.3%) |
| 20 to 24 Minutes | 94 (15.5%) | 55 (4.7%) |
| 25 to 29 Minutes | 0 (0.0%) | 40 (3.4%) |
| 30 to 34 Minutes | 44 (7.2%) | 76 (6.5%) |
| 35 to 39 Minutes | 0 (0.0%) | 6 (0.5%) |
| 40 to 44 Minutes | 5 (0.8%) | 0 (0.0%) |
| 45 to 59 Minutes | 34 (5.6%) | 47 (4.0%) |
| 60 to 89 Minutes | 24 (4.0%) | 19 (1.6%) |
| 90 or more Minutes | 0 (0.0%) | 13 (1.1%) |
Time of Departure to Work by Sex in Tallulah
The most frequent times of departure to work in Tallulah are 7:30 AM to 7:59 AM (119, 19.6%) for males and 7:30 AM to 7:59 AM (314, 26.9%) for females.
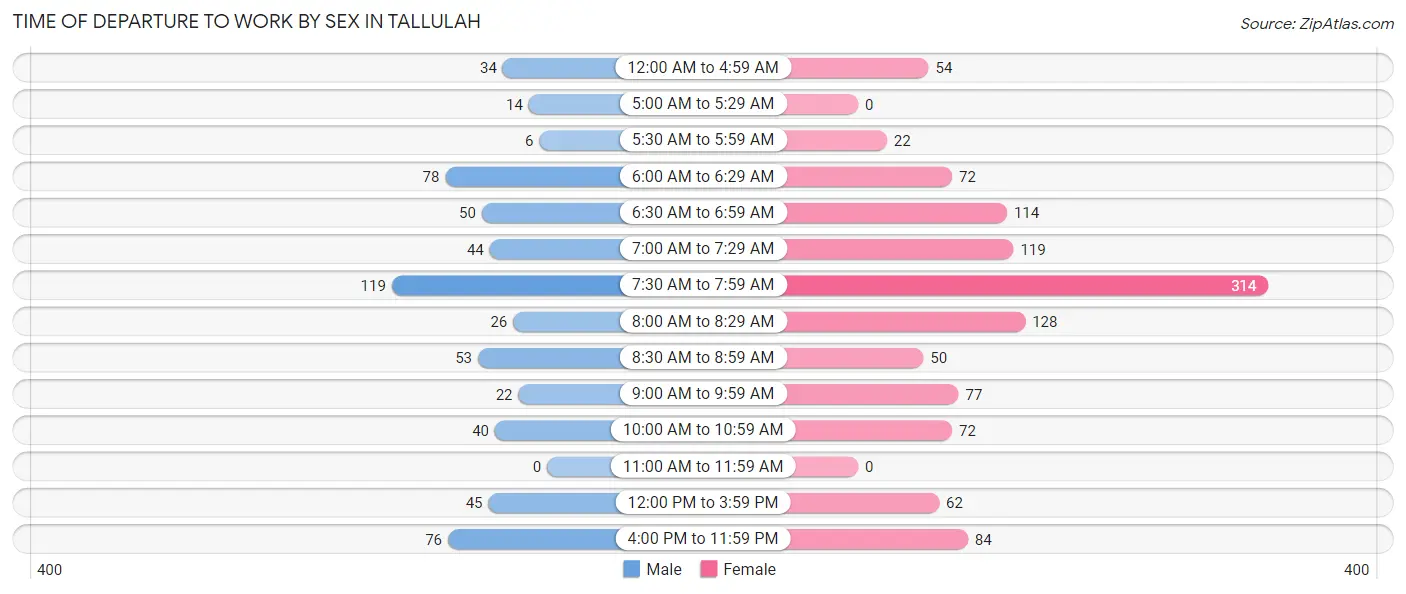
| Time of Departure | Male | Female |
| 12:00 AM to 4:59 AM | 34 (5.6%) | 54 (4.6%) |
| 5:00 AM to 5:29 AM | 14 (2.3%) | 0 (0.0%) |
| 5:30 AM to 5:59 AM | 6 (1.0%) | 22 (1.9%) |
| 6:00 AM to 6:29 AM | 78 (12.9%) | 72 (6.2%) |
| 6:30 AM to 6:59 AM | 50 (8.2%) | 114 (9.8%) |
| 7:00 AM to 7:29 AM | 44 (7.2%) | 119 (10.2%) |
| 7:30 AM to 7:59 AM | 119 (19.6%) | 314 (26.9%) |
| 8:00 AM to 8:29 AM | 26 (4.3%) | 128 (11.0%) |
| 8:30 AM to 8:59 AM | 53 (8.7%) | 50 (4.3%) |
| 9:00 AM to 9:59 AM | 22 (3.6%) | 77 (6.6%) |
| 10:00 AM to 10:59 AM | 40 (6.6%) | 72 (6.2%) |
| 11:00 AM to 11:59 AM | 0 (0.0%) | 0 (0.0%) |
| 12:00 PM to 3:59 PM | 45 (7.4%) | 62 (5.3%) |
| 4:00 PM to 11:59 PM | 76 (12.5%) | 84 (7.2%) |
| Total | 607 (100.0%) | 1,168 (100.0%) |
Housing Occupancy in Tallulah
Occupancy by Ownership in Tallulah
Of the total 2,131 dwellings in Tallulah, owner-occupied units account for 989 (46.4%), while renter-occupied units make up 1,142 (53.6%).
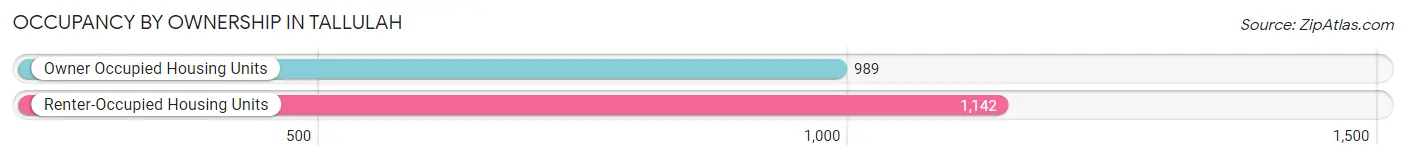
| Occupancy | # Housing Units | % Housing Units |
| Owner Occupied Housing Units | 989 | 46.4% |
| Renter-Occupied Housing Units | 1,142 | 53.6% |
| Total Occupied Housing Units | 2,131 | 100.0% |
Occupancy by Household Size in Tallulah
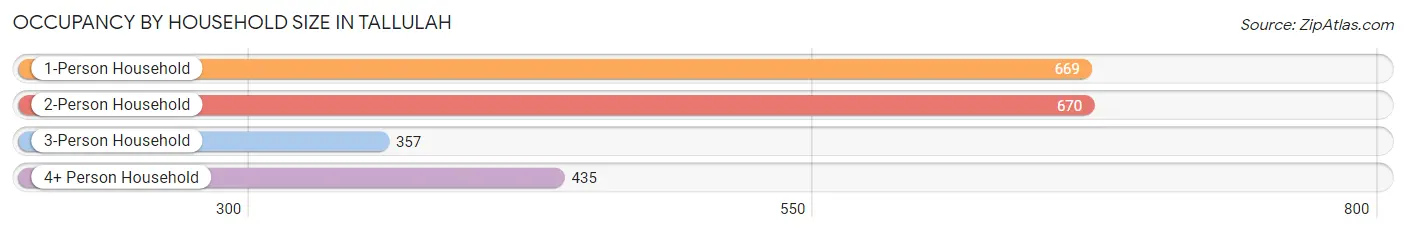
| Household Size | # Housing Units | % Housing Units |
| 1-Person Household | 669 | 31.4% |
| 2-Person Household | 670 | 31.4% |
| 3-Person Household | 357 | 16.8% |
| 4+ Person Household | 435 | 20.4% |
| Total Housing Units | 2,131 | 100.0% |
Occupancy by Ownership by Household Size in Tallulah
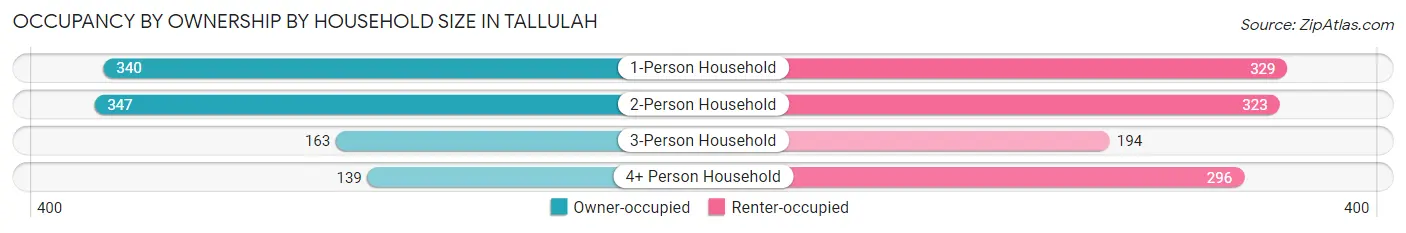
| Household Size | Owner-occupied | Renter-occupied |
| 1-Person Household | 340 (50.8%) | 329 (49.2%) |
| 2-Person Household | 347 (51.8%) | 323 (48.2%) |
| 3-Person Household | 163 (45.7%) | 194 (54.3%) |
| 4+ Person Household | 139 (32.0%) | 296 (68.0%) |
| Total Housing Units | 989 (46.4%) | 1,142 (53.6%) |
Occupancy by Educational Attainment in Tallulah
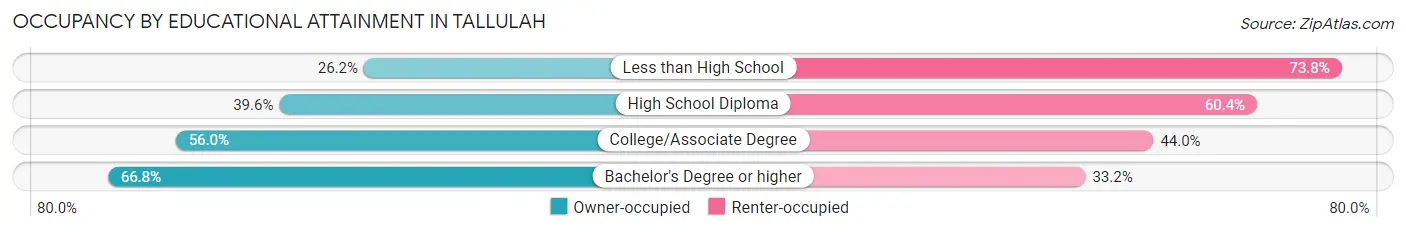
| Household Size | Owner-occupied | Renter-occupied |
| Less than High School | 77 (26.2%) | 217 (73.8%) |
| High School Diploma | 347 (39.6%) | 529 (60.4%) |
| College/Associate Degree | 400 (56.0%) | 314 (44.0%) |
| Bachelor's Degree or higher | 165 (66.8%) | 82 (33.2%) |
Occupancy by Age of Householder in Tallulah
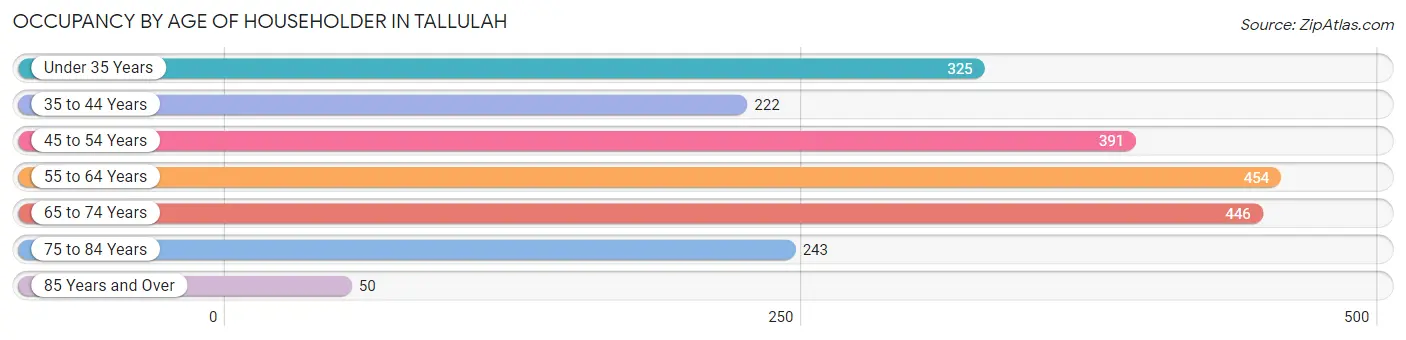
| Age Bracket | # Households | % Households |
| Under 35 Years | 325 | 15.2% |
| 35 to 44 Years | 222 | 10.4% |
| 45 to 54 Years | 391 | 18.3% |
| 55 to 64 Years | 454 | 21.3% |
| 65 to 74 Years | 446 | 20.9% |
| 75 to 84 Years | 243 | 11.4% |
| 85 Years and Over | 50 | 2.4% |
| Total | 2,131 | 100.0% |
Housing Finances in Tallulah
Median Income by Occupancy in Tallulah
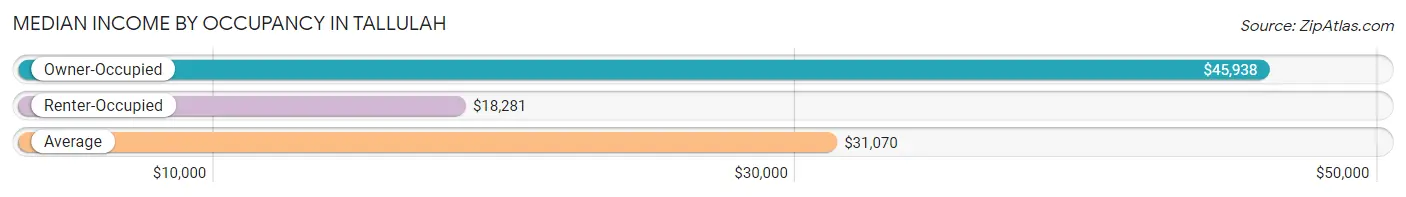
| Occupancy Type | # Households | Median Income |
| Owner-Occupied | 989 (46.4%) | $45,938 |
| Renter-Occupied | 1,142 (53.6%) | $18,281 |
| Average | 2,131 (100.0%) | $31,070 |
Occupancy by Householder Income Bracket in Tallulah
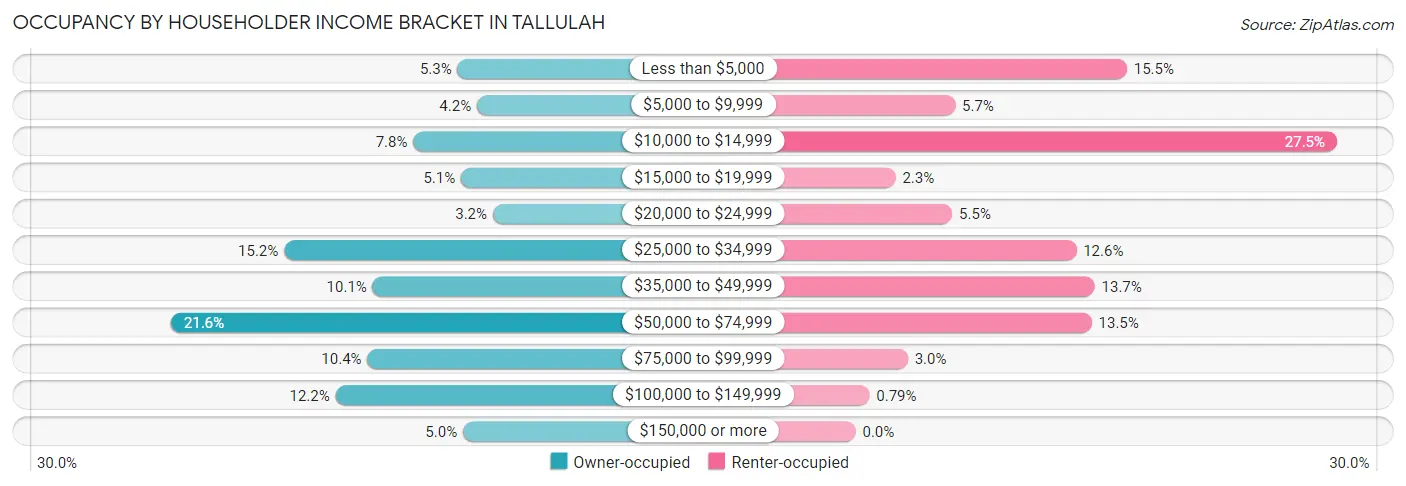
| Income Bracket | Owner-occupied | Renter-occupied |
| Less than $5,000 | 52 (5.3%) | 177 (15.5%) |
| $5,000 to $9,999 | 41 (4.2%) | 65 (5.7%) |
| $10,000 to $14,999 | 77 (7.8%) | 314 (27.5%) |
| $15,000 to $19,999 | 50 (5.1%) | 26 (2.3%) |
| $20,000 to $24,999 | 32 (3.2%) | 63 (5.5%) |
| $25,000 to $34,999 | 150 (15.2%) | 144 (12.6%) |
| $35,000 to $49,999 | 100 (10.1%) | 156 (13.7%) |
| $50,000 to $74,999 | 214 (21.6%) | 154 (13.5%) |
| $75,000 to $99,999 | 103 (10.4%) | 34 (3.0%) |
| $100,000 to $149,999 | 121 (12.2%) | 9 (0.8%) |
| $150,000 or more | 49 (5.0%) | 0 (0.0%) |
| Total | 989 (100.0%) | 1,142 (100.0%) |
Monthly Housing Cost Tiers in Tallulah
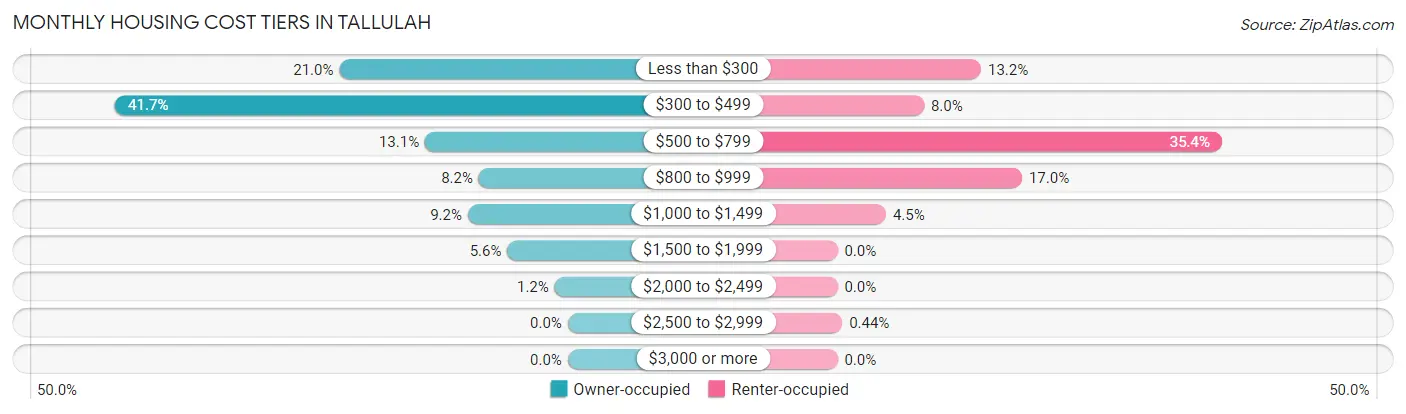
| Monthly Cost | Owner-occupied | Renter-occupied |
| Less than $300 | 208 (21.0%) | 151 (13.2%) |
| $300 to $499 | 412 (41.7%) | 91 (8.0%) |
| $500 to $799 | 130 (13.1%) | 404 (35.4%) |
| $800 to $999 | 81 (8.2%) | 194 (17.0%) |
| $1,000 to $1,499 | 91 (9.2%) | 51 (4.5%) |
| $1,500 to $1,999 | 55 (5.6%) | 0 (0.0%) |
| $2,000 to $2,499 | 12 (1.2%) | 0 (0.0%) |
| $2,500 to $2,999 | 0 (0.0%) | 5 (0.4%) |
| $3,000 or more | 0 (0.0%) | 0 (0.0%) |
| Total | 989 (100.0%) | 1,142 (100.0%) |
Physical Housing Characteristics in Tallulah
Housing Structures in Tallulah
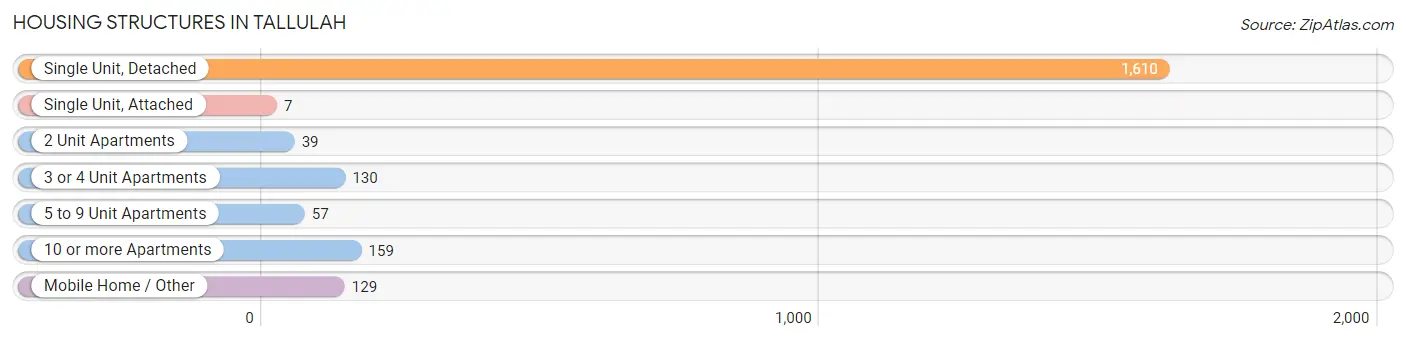
| Structure Type | # Housing Units | % Housing Units |
| Single Unit, Detached | 1,610 | 75.5% |
| Single Unit, Attached | 7 | 0.3% |
| 2 Unit Apartments | 39 | 1.8% |
| 3 or 4 Unit Apartments | 130 | 6.1% |
| 5 to 9 Unit Apartments | 57 | 2.7% |
| 10 or more Apartments | 159 | 7.5% |
| Mobile Home / Other | 129 | 6.0% |
| Total | 2,131 | 100.0% |
Housing Structures by Occupancy in Tallulah
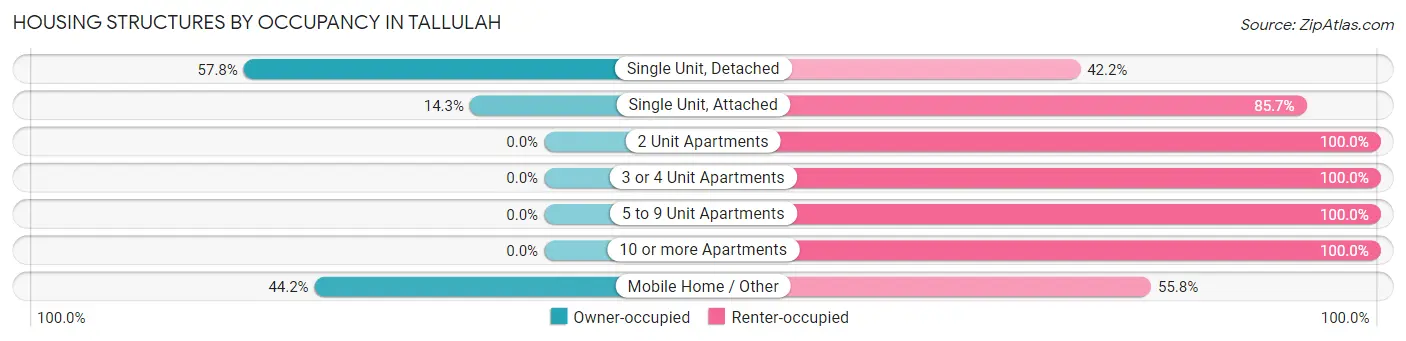
| Structure Type | Owner-occupied | Renter-occupied |
| Single Unit, Detached | 931 (57.8%) | 679 (42.2%) |
| Single Unit, Attached | 1 (14.3%) | 6 (85.7%) |
| 2 Unit Apartments | 0 (0.0%) | 39 (100.0%) |
| 3 or 4 Unit Apartments | 0 (0.0%) | 130 (100.0%) |
| 5 to 9 Unit Apartments | 0 (0.0%) | 57 (100.0%) |
| 10 or more Apartments | 0 (0.0%) | 159 (100.0%) |
| Mobile Home / Other | 57 (44.2%) | 72 (55.8%) |
| Total | 989 (46.4%) | 1,142 (53.6%) |
Housing Structures by Number of Rooms in Tallulah
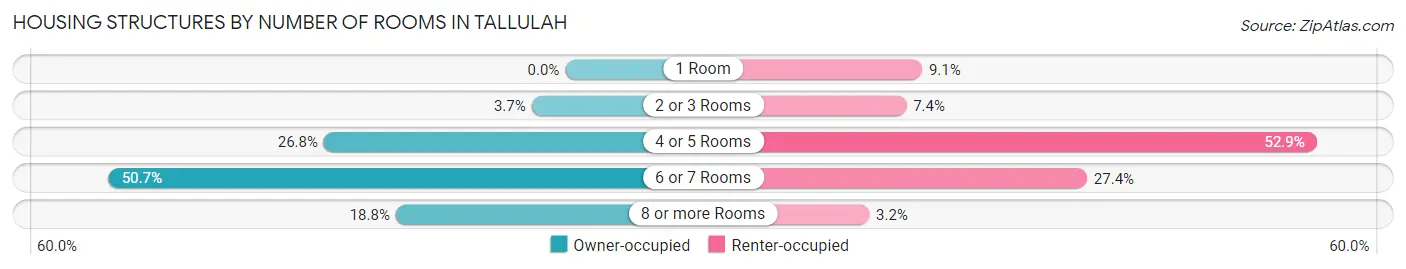
| Number of Rooms | Owner-occupied | Renter-occupied |
| 1 Room | 0 (0.0%) | 104 (9.1%) |
| 2 or 3 Rooms | 37 (3.7%) | 84 (7.4%) |
| 4 or 5 Rooms | 265 (26.8%) | 604 (52.9%) |
| 6 or 7 Rooms | 501 (50.7%) | 313 (27.4%) |
| 8 or more Rooms | 186 (18.8%) | 37 (3.2%) |
| Total | 989 (100.0%) | 1,142 (100.0%) |
Housing Structure by Heating Type in Tallulah
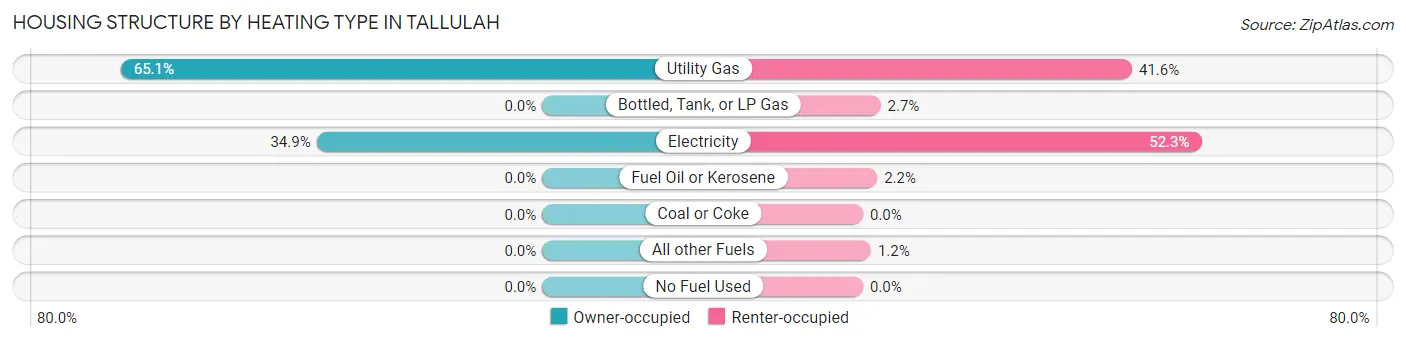
| Heating Type | Owner-occupied | Renter-occupied |
| Utility Gas | 644 (65.1%) | 475 (41.6%) |
| Bottled, Tank, or LP Gas | 0 (0.0%) | 31 (2.7%) |
| Electricity | 345 (34.9%) | 597 (52.3%) |
| Fuel Oil or Kerosene | 0 (0.0%) | 25 (2.2%) |
| Coal or Coke | 0 (0.0%) | 0 (0.0%) |
| All other Fuels | 0 (0.0%) | 14 (1.2%) |
| No Fuel Used | 0 (0.0%) | 0 (0.0%) |
| Total | 989 (100.0%) | 1,142 (100.0%) |
Household Vehicle Usage in Tallulah
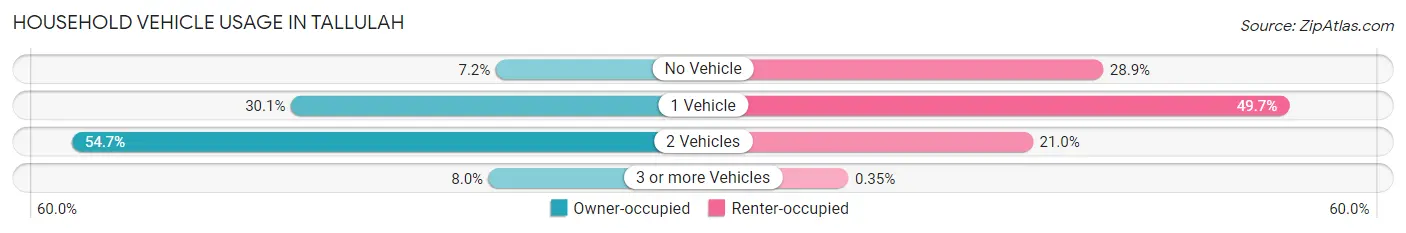
| Vehicles per Household | Owner-occupied | Renter-occupied |
| No Vehicle | 71 (7.2%) | 330 (28.9%) |
| 1 Vehicle | 298 (30.1%) | 568 (49.7%) |
| 2 Vehicles | 541 (54.7%) | 240 (21.0%) |
| 3 or more Vehicles | 79 (8.0%) | 4 (0.4%) |
| Total | 989 (100.0%) | 1,142 (100.0%) |
Real Estate & Mortgages in Tallulah
Real Estate and Mortgage Overview in Tallulah
| Characteristic | Without Mortgage | With Mortgage |
| Housing Units | 731 | 258 |
| Median Property Value | $59,200 | $126,100 |
| Median Household Income | $39,609 | $11 |
| Monthly Housing Costs | $360 | $0 |
| Real Estate Taxes | $199 | $34 |
Property Value by Mortgage Status in Tallulah
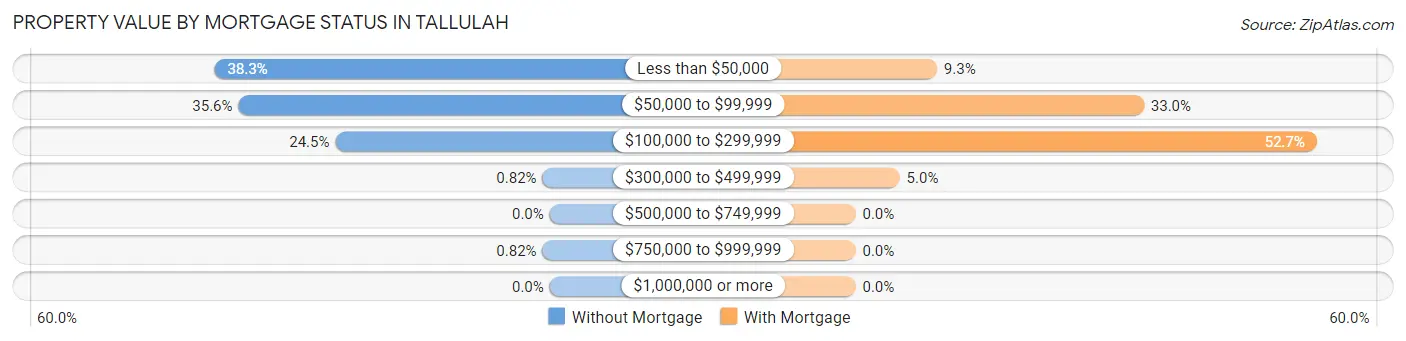
| Property Value | Without Mortgage | With Mortgage |
| Less than $50,000 | 280 (38.3%) | 24 (9.3%) |
| $50,000 to $99,999 | 260 (35.6%) | 85 (33.0%) |
| $100,000 to $299,999 | 179 (24.5%) | 136 (52.7%) |
| $300,000 to $499,999 | 6 (0.8%) | 13 (5.0%) |
| $500,000 to $749,999 | 0 (0.0%) | 0 (0.0%) |
| $750,000 to $999,999 | 6 (0.8%) | 0 (0.0%) |
| $1,000,000 or more | 0 (0.0%) | 0 (0.0%) |
| Total | 731 (100.0%) | 258 (100.0%) |
Household Income by Mortgage Status in Tallulah
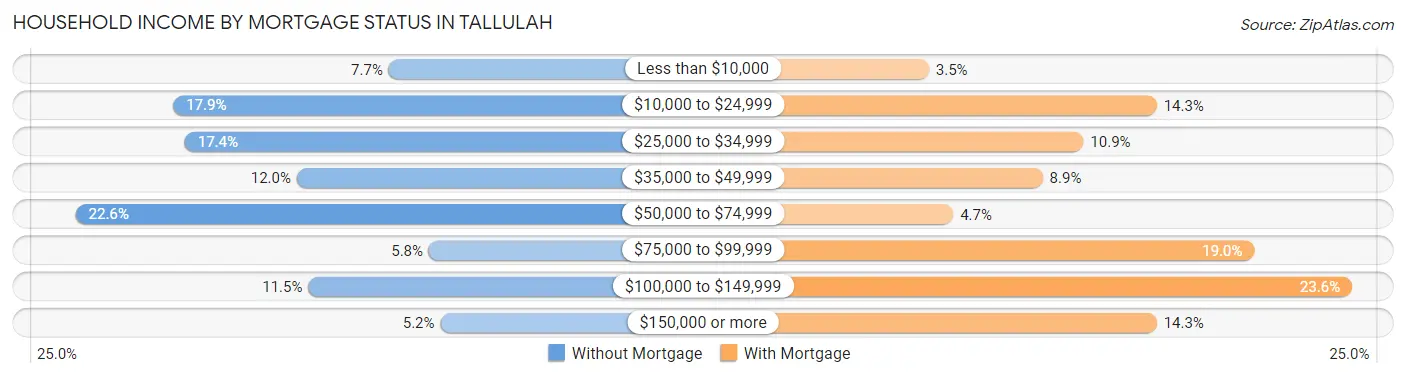
| Household Income | Without Mortgage | With Mortgage |
| Less than $10,000 | 56 (7.7%) | 9 (3.5%) |
| $10,000 to $24,999 | 131 (17.9%) | 37 (14.3%) |
| $25,000 to $34,999 | 127 (17.4%) | 28 (10.8%) |
| $35,000 to $49,999 | 88 (12.0%) | 23 (8.9%) |
| $50,000 to $74,999 | 165 (22.6%) | 12 (4.6%) |
| $75,000 to $99,999 | 42 (5.8%) | 49 (19.0%) |
| $100,000 to $149,999 | 84 (11.5%) | 61 (23.6%) |
| $150,000 or more | 38 (5.2%) | 37 (14.3%) |
| Total | 731 (100.0%) | 258 (100.0%) |
Property Value to Household Income Ratio in Tallulah
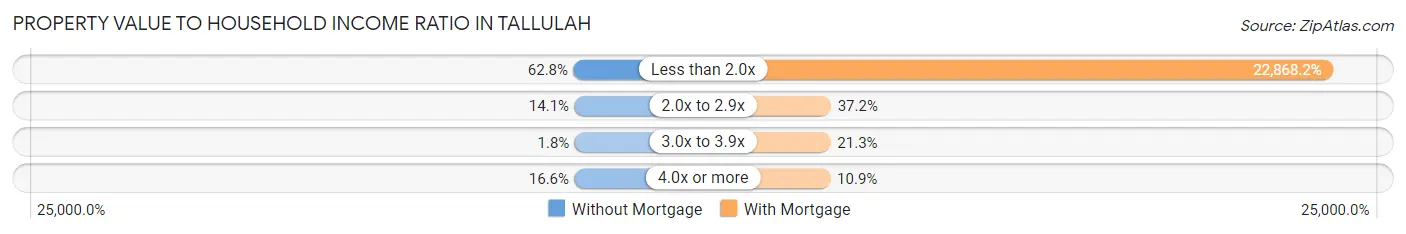
| Value-to-Income Ratio | Without Mortgage | With Mortgage |
| Less than 2.0x | 459 (62.8%) | 59,000 (22,868.2%) |
| 2.0x to 2.9x | 103 (14.1%) | 96 (37.2%) |
| 3.0x to 3.9x | 13 (1.8%) | 55 (21.3%) |
| 4.0x or more | 121 (16.6%) | 28 (10.8%) |
| Total | 731 (100.0%) | 258 (100.0%) |
Real Estate Taxes by Mortgage Status in Tallulah
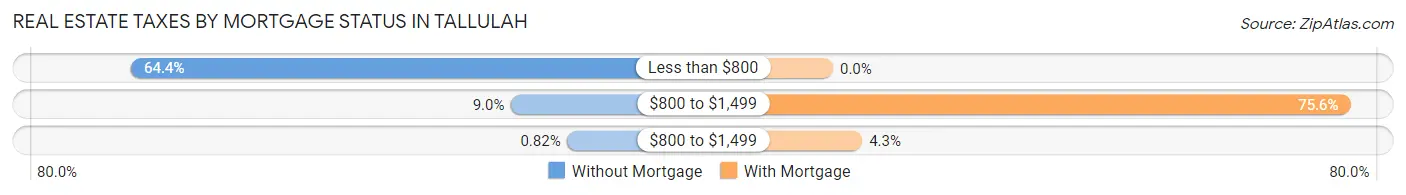
| Property Taxes | Without Mortgage | With Mortgage |
| Less than $800 | 471 (64.4%) | 0 (0.0%) |
| $800 to $1,499 | 66 (9.0%) | 195 (75.6%) |
| $800 to $1,499 | 6 (0.8%) | 11 (4.3%) |
| Total | 731 (100.0%) | 258 (100.0%) |
Health & Disability in Tallulah
Health Insurance Coverage by Age in Tallulah
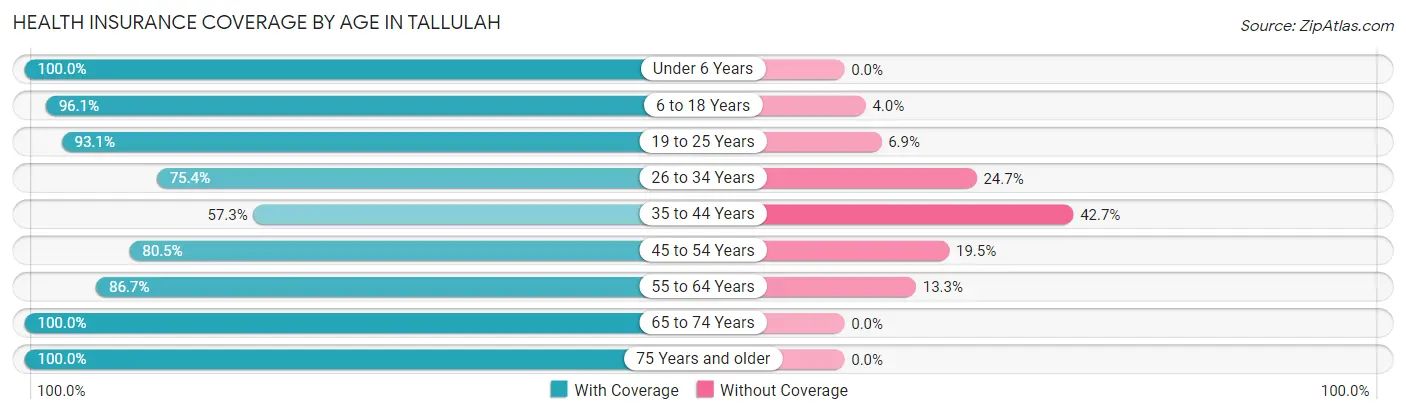
| Age Bracket | With Coverage | Without Coverage |
| Under 6 Years | 681 (100.0%) | 0 (0.0%) |
| 6 to 18 Years | 1,142 (96.1%) | 47 (4.0%) |
| 19 to 25 Years | 419 (93.1%) | 31 (6.9%) |
| 26 to 34 Years | 373 (75.3%) | 122 (24.6%) |
| 35 to 44 Years | 298 (57.3%) | 222 (42.7%) |
| 45 to 54 Years | 453 (80.5%) | 110 (19.5%) |
| 55 to 64 Years | 676 (86.7%) | 104 (13.3%) |
| 65 to 74 Years | 624 (100.0%) | 0 (0.0%) |
| 75 Years and older | 393 (100.0%) | 0 (0.0%) |
| Total | 5,059 (88.8%) | 636 (11.2%) |
Health Insurance Coverage by Citizenship Status in Tallulah
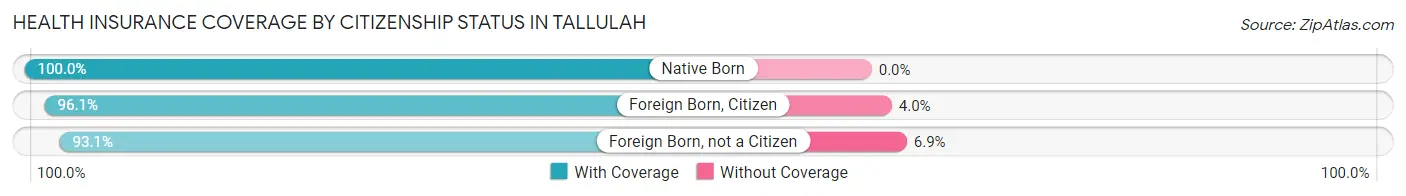
| Citizenship Status | With Coverage | Without Coverage |
| Native Born | 681 (100.0%) | 0 (0.0%) |
| Foreign Born, Citizen | 1,142 (96.1%) | 47 (4.0%) |
| Foreign Born, not a Citizen | 419 (93.1%) | 31 (6.9%) |
Health Insurance Coverage by Household Income in Tallulah
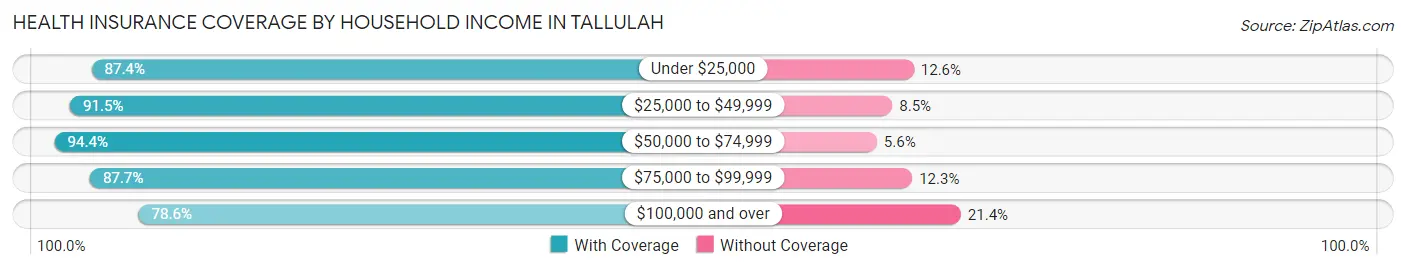
| Household Income | With Coverage | Without Coverage |
| Under $25,000 | 1,935 (87.4%) | 278 (12.6%) |
| $25,000 to $49,999 | 1,531 (91.5%) | 143 (8.5%) |
| $50,000 to $74,999 | 820 (94.4%) | 49 (5.6%) |
| $75,000 to $99,999 | 322 (87.7%) | 45 (12.3%) |
| $100,000 and over | 445 (78.6%) | 121 (21.4%) |
Public vs Private Health Insurance Coverage by Age in Tallulah
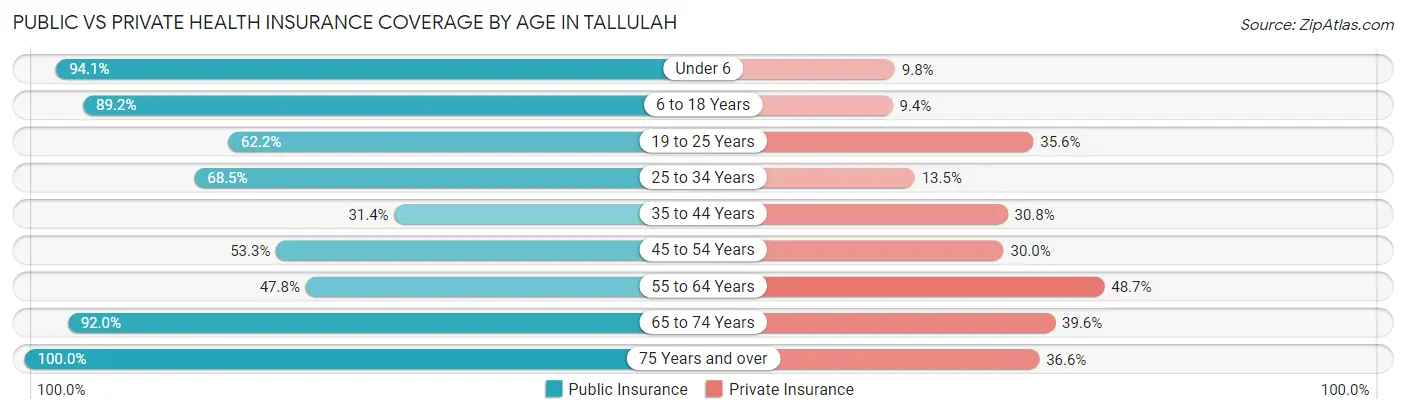
| Age Bracket | Public Insurance | Private Insurance |
| Under 6 | 641 (94.1%) | 67 (9.8%) |
| 6 to 18 Years | 1,060 (89.1%) | 112 (9.4%) |
| 19 to 25 Years | 280 (62.2%) | 160 (35.6%) |
| 25 to 34 Years | 339 (68.5%) | 67 (13.5%) |
| 35 to 44 Years | 163 (31.4%) | 160 (30.8%) |
| 45 to 54 Years | 300 (53.3%) | 169 (30.0%) |
| 55 to 64 Years | 373 (47.8%) | 380 (48.7%) |
| 65 to 74 Years | 574 (92.0%) | 247 (39.6%) |
| 75 Years and over | 393 (100.0%) | 144 (36.6%) |
| Total | 4,123 (72.4%) | 1,506 (26.4%) |
Disability Status by Sex by Age in Tallulah
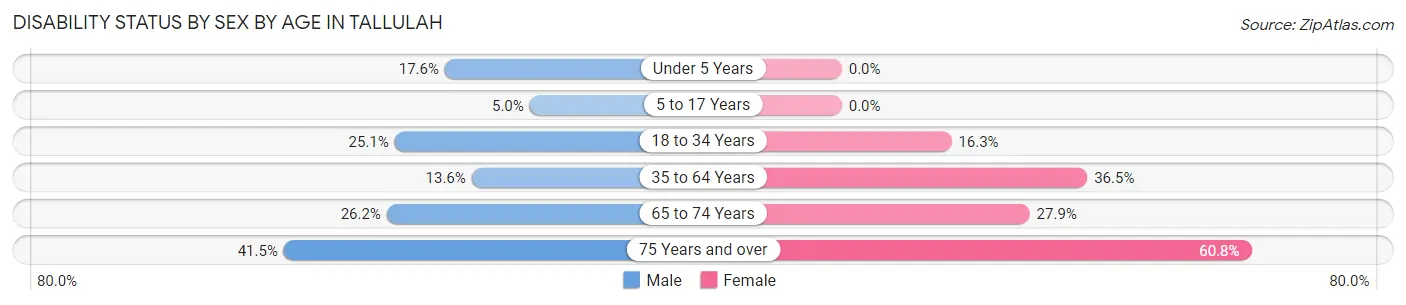
| Age Bracket | Male | Female |
| Under 5 Years | 41 (17.6%) | 0 (0.0%) |
| 5 to 17 Years | 30 (5.0%) | 0 (0.0%) |
| 18 to 34 Years | 113 (25.1%) | 111 (16.3%) |
| 35 to 64 Years | 108 (13.6%) | 390 (36.4%) |
| 65 to 74 Years | 80 (26.2%) | 89 (27.9%) |
| 75 Years and over | 71 (41.5%) | 135 (60.8%) |
Disability Class by Sex by Age in Tallulah
Disability Class: Hearing Difficulty
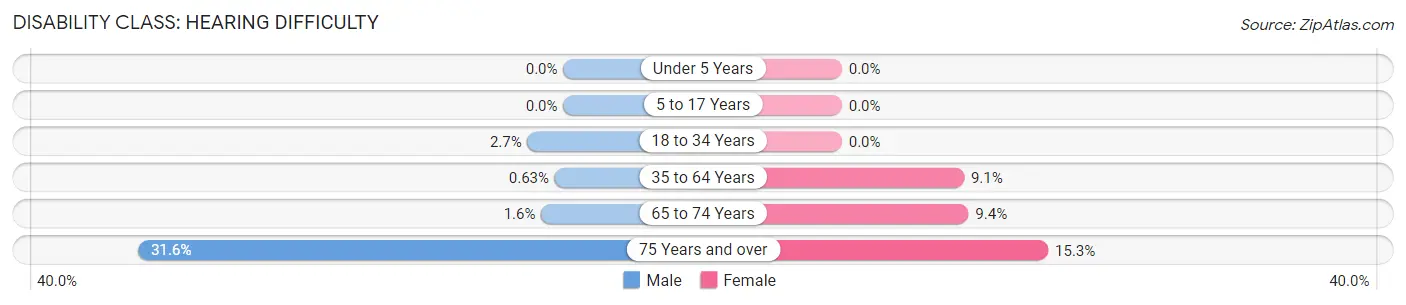
| Age Bracket | Male | Female |
| Under 5 Years | 0 (0.0%) | 0 (0.0%) |
| 5 to 17 Years | 0 (0.0%) | 0 (0.0%) |
| 18 to 34 Years | 12 (2.7%) | 0 (0.0%) |
| 35 to 64 Years | 5 (0.6%) | 97 (9.1%) |
| 65 to 74 Years | 5 (1.6%) | 30 (9.4%) |
| 75 Years and over | 54 (31.6%) | 34 (15.3%) |
Disability Class: Vision Difficulty
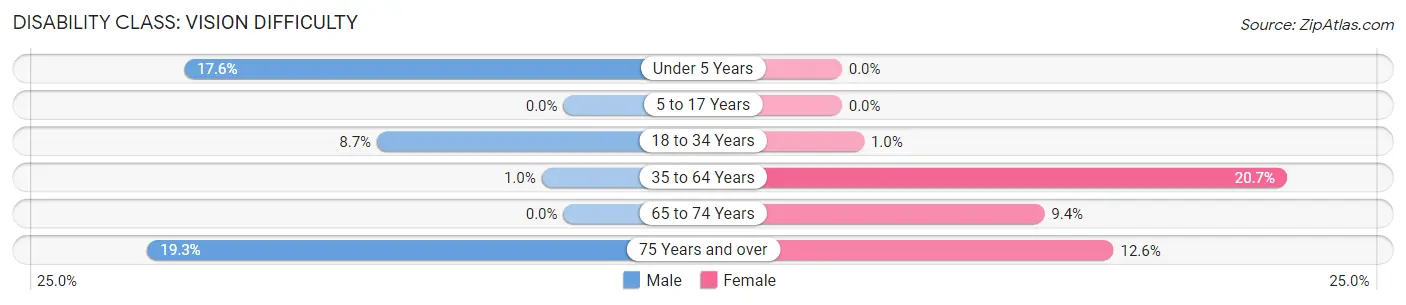
| Age Bracket | Male | Female |
| Under 5 Years | 41 (17.6%) | 0 (0.0%) |
| 5 to 17 Years | 0 (0.0%) | 0 (0.0%) |
| 18 to 34 Years | 39 (8.6%) | 7 (1.0%) |
| 35 to 64 Years | 8 (1.0%) | 221 (20.6%) |
| 65 to 74 Years | 0 (0.0%) | 30 (9.4%) |
| 75 Years and over | 33 (19.3%) | 28 (12.6%) |
Disability Class: Cognitive Difficulty

| Age Bracket | Male | Female |
| 5 to 17 Years | 30 (5.0%) | 0 (0.0%) |
| 18 to 34 Years | 69 (15.3%) | 85 (12.5%) |
| 35 to 64 Years | 48 (6.0%) | 127 (11.9%) |
| 65 to 74 Years | 34 (11.2%) | 51 (16.0%) |
| 75 Years and over | 29 (17.0%) | 76 (34.2%) |
Disability Class: Ambulatory Difficulty
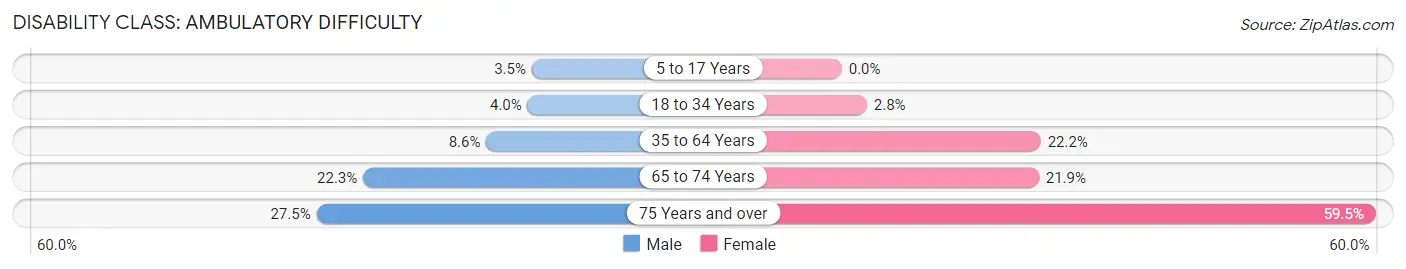
| Age Bracket | Male | Female |
| 5 to 17 Years | 21 (3.5%) | 0 (0.0%) |
| 18 to 34 Years | 18 (4.0%) | 19 (2.8%) |
| 35 to 64 Years | 68 (8.6%) | 237 (22.2%) |
| 65 to 74 Years | 68 (22.3%) | 70 (21.9%) |
| 75 Years and over | 47 (27.5%) | 132 (59.5%) |
Disability Class: Self-Care Difficulty
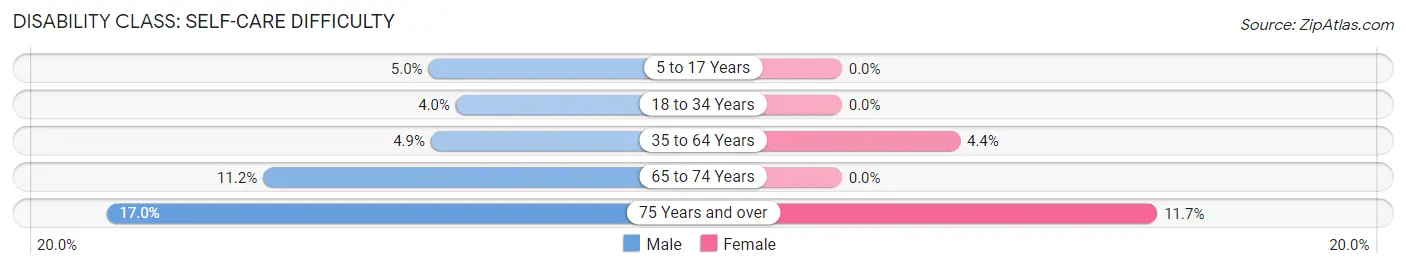
| Age Bracket | Male | Female |
| 5 to 17 Years | 30 (5.0%) | 0 (0.0%) |
| 18 to 34 Years | 18 (4.0%) | 0 (0.0%) |
| 35 to 64 Years | 39 (4.9%) | 47 (4.4%) |
| 65 to 74 Years | 34 (11.2%) | 0 (0.0%) |
| 75 Years and over | 29 (17.0%) | 26 (11.7%) |
Technology Access in Tallulah
Computing Device Access in Tallulah
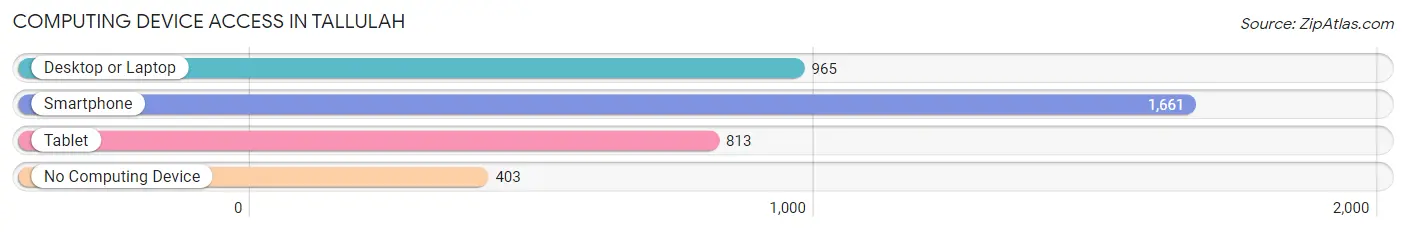
| Device Type | # Households | % Households |
| Desktop or Laptop | 965 | 45.3% |
| Smartphone | 1,661 | 77.9% |
| Tablet | 813 | 38.2% |
| No Computing Device | 403 | 18.9% |
| Total | 2,131 | 100.0% |
Internet Access in Tallulah
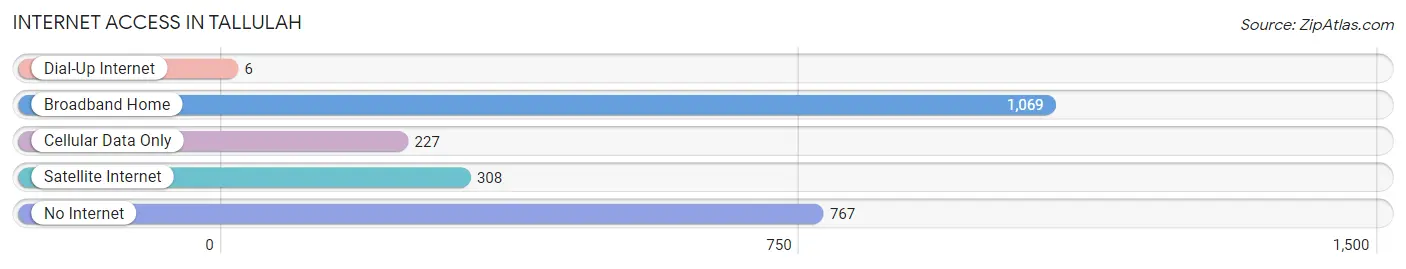
| Internet Type | # Households | % Households |
| Dial-Up Internet | 6 | 0.3% |
| Broadband Home | 1,069 | 50.2% |
| Cellular Data Only | 227 | 10.6% |
| Satellite Internet | 308 | 14.4% |
| No Internet | 767 | 36.0% |
| Total | 2,131 | 100.0% |
Tallulah Summary
Tallulah, Louisiana is a small city located in Madison Parish in the northeastern part of the state. It is situated on the banks of the Mississippi River, about halfway between Vicksburg, Mississippi and Monroe, Louisiana. The city has a population of approximately 7,000 people and is the parish seat of Madison Parish.
Tallulah was founded in 1839 by the Reverend John B. Randolph, a Methodist minister from Virginia. The city was named after his daughter, Tallulah Randolph. The city was incorporated in 1845 and has been the parish seat since 1848.
Geography
Tallulah is located in the northeast corner of Louisiana, about halfway between Vicksburg, Mississippi and Monroe, Louisiana. The city is situated on the banks of the Mississippi River, and is surrounded by the Tensas River to the east and the Ouachita River to the west. The city is located in the flat, alluvial plain of the Mississippi Delta, and is characterized by its low-lying terrain and flat topography.
The climate in Tallulah is humid subtropical, with hot, humid summers and mild winters. The average annual temperature is around 68°F (20°C), and the average annual precipitation is around 48 inches (122 cm).
Economy
Tallulah’s economy is largely based on agriculture and manufacturing. The city is home to several large agricultural operations, including cotton, soybeans, corn, and rice. The city is also home to several manufacturing plants, including a paper mill, a wood products plant, and a chemical plant.
The city is also home to several retail stores, restaurants, and other businesses. The city is served by the Tallulah Municipal Airport, which provides air service to the surrounding area.
Demographics
As of the 2010 census, the population of Tallulah was 7,335. The racial makeup of the city was 57.3% African American, 37.7% White, 0.3% Native American, 0.2% Asian, 0.1% Pacific Islander, and 4.4% from other races. The median household income was $25,945, and the median family income was $31,944.
The city is served by the Madison Parish School District, which includes two elementary schools, one middle school, and one high school. The city is also home to a branch of the Louisiana Technical College.
Conclusion
Tallulah, Louisiana is a small city located in Madison Parish in the northeastern part of the state. It is situated on the banks of the Mississippi River, about halfway between Vicksburg, Mississippi and Monroe, Louisiana. The city has a population of approximately 7,000 people and is the parish seat of Madison Parish. The city’s economy is largely based on agriculture and manufacturing, and the city is served by the Madison Parish School District. The city is also home to several retail stores, restaurants, and other businesses. Tallulah is a small city with a rich history and a bright future.
Common Questions
What is Per Capita Income in Tallulah?
Per Capita income in Tallulah is $14,718.
What is the Median Family Income in Tallulah?
Median Family Income in Tallulah is $38,007.
What is the Median Household income in Tallulah?
Median Household Income in Tallulah is $31,070.
What is Income or Wage Gap in Tallulah?
Income or Wage Gap in Tallulah is 8.5%.
Women in Tallulah earn 91.5 cents for every dollar earned by a man.
What is Inequality or Gini Index in Tallulah?
Inequality or Gini Index in Tallulah is 0.48.
What is the Total Population of Tallulah?
Total Population of Tallulah is 6,290.
What is the Total Male Population of Tallulah?
Total Male Population of Tallulah is 2,612.
What is the Total Female Population of Tallulah?
Total Female Population of Tallulah is 3,678.
What is the Ratio of Males per 100 Females in Tallulah?
There are 71.02 Males per 100 Females in Tallulah.
What is the Ratio of Females per 100 Males in Tallulah?
There are 140.81 Females per 100 Males in Tallulah.
What is the Median Population Age in Tallulah?
Median Population Age in Tallulah is 35.1 Years.
What is the Average Family Size in Tallulah
Average Family Size in Tallulah is 3.3 People.
What is the Average Household Size in Tallulah
Average Household Size in Tallulah is 2.7 People.
How Large is the Labor Force in Tallulah?
There are 1,998 People in the Labor Forcein in Tallulah.
What is the Percentage of People in the Labor Force in Tallulah?
42.0% of People are in the Labor Force in Tallulah.
What is the Unemployment Rate in Tallulah?
Unemployment Rate in Tallulah is 7.1%.