Stonewall, LA Map & Demographics
Stonewall Map
Stonewall Overview
$40,780
PER CAPITA INCOME
$91,000
AVG FAMILY INCOME
$66,667
AVG HOUSEHOLD INCOME
29.4%
WAGE / INCOME GAP [ % ]
70.6¢/ $1
WAGE / INCOME GAP [ $ ]
0.50
INEQUALITY / GINI INDEX
2,334
TOTAL POPULATION
1,159
MALE POPULATION
1,175
FEMALE POPULATION
98.64
MALES / 100 FEMALES
101.38
FEMALES / 100 MALES
47.5
MEDIAN AGE
3.0
AVG FAMILY SIZE
2.5
AVG HOUSEHOLD SIZE
1,192
LABOR FORCE [ PEOPLE ]
62.3%
PERCENT IN LABOR FORCE
0.8%
UNEMPLOYMENT RATE
Stonewall Zip Codes
Stonewall Area Codes
Income in Stonewall
Income Overview in Stonewall
Per Capita Income in Stonewall is $40,780, while median incomes of families and households are $91,000 and $66,667 respectively.
| Characteristic | Number | Measure |
| Per Capita Income | 2,334 | $40,780 |
| Median Family Income | 674 | $91,000 |
| Mean Family Income | 674 | $109,139 |
| Median Household Income | 930 | $66,667 |
| Mean Household Income | 930 | $95,169 |
| Income Deficit | 674 | $0 |
| Wage / Income Gap (%) | 2,334 | 29.38% |
| Wage / Income Gap ($) | 2,334 | 70.62¢ per $1 |
| Gini / Inequality Index | 2,334 | 0.50 |
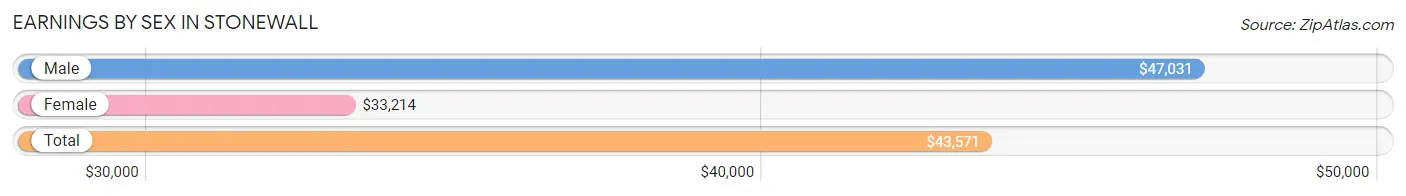
Earnings by Sex in Stonewall
Average Earnings in Stonewall are $43,571, $47,031 for men and $33,214 for women, a difference of 29.4%.
| Sex | Number | Average Earnings |
| Male | 622 (48.1%) | $47,031 |
| Female | 670 (51.9%) | $33,214 |
| Total | 1,292 (100.0%) | $43,571 |
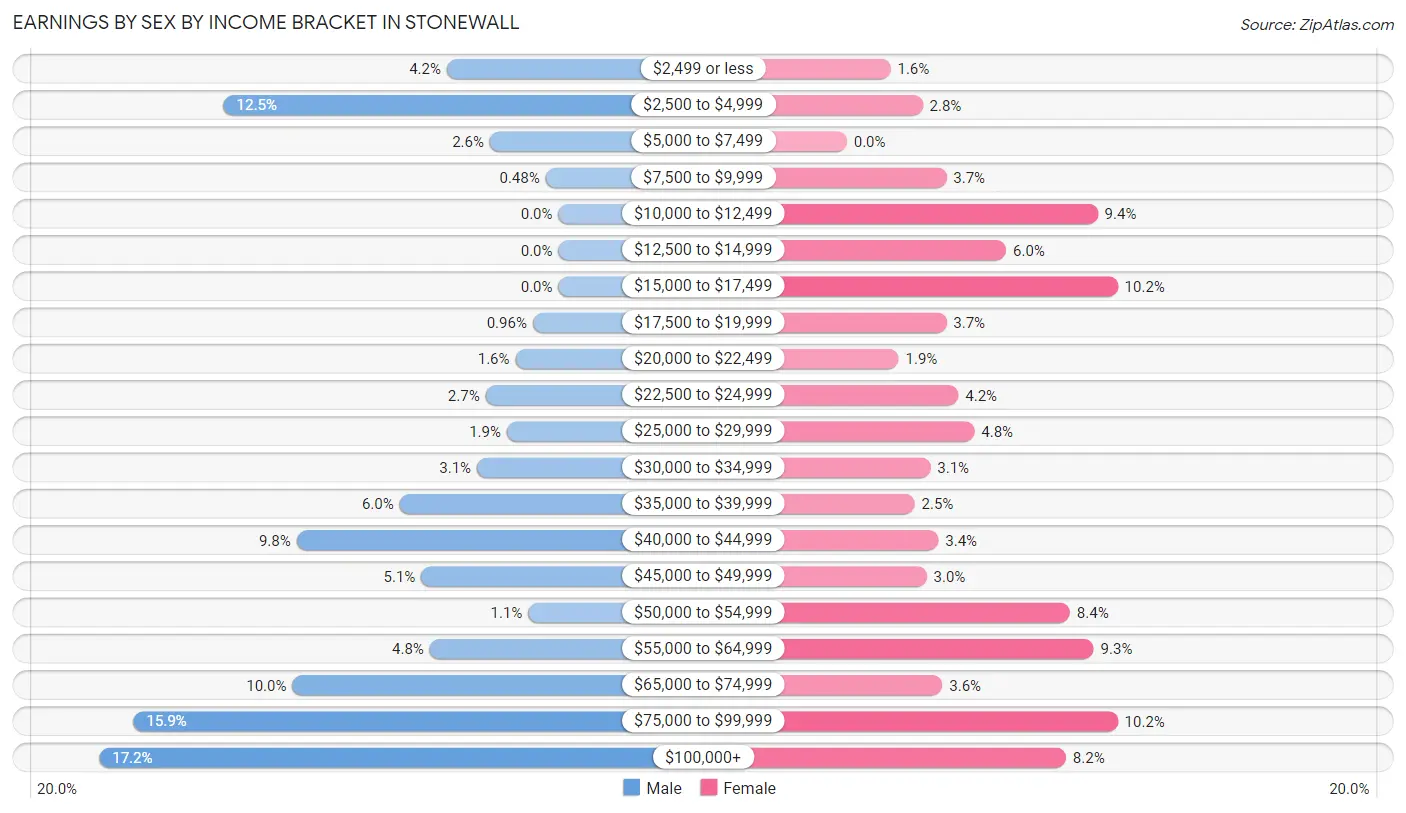
Earnings by Sex by Income Bracket in Stonewall
The most common earnings brackets in Stonewall are $100,000+ for men (107 | 17.2%) and $15,000 to $17,499 for women (68 | 10.2%).
| Income | Male | Female |
| $2,499 or less | 26 (4.2%) | 11 (1.6%) |
| $2,500 to $4,999 | 78 (12.5%) | 19 (2.8%) |
| $5,000 to $7,499 | 16 (2.6%) | 0 (0.0%) |
| $7,500 to $9,999 | 3 (0.5%) | 25 (3.7%) |
| $10,000 to $12,499 | 0 (0.0%) | 63 (9.4%) |
| $12,500 to $14,999 | 0 (0.0%) | 40 (6.0%) |
| $15,000 to $17,499 | 0 (0.0%) | 68 (10.2%) |
| $17,500 to $19,999 | 6 (1.0%) | 25 (3.7%) |
| $20,000 to $22,499 | 10 (1.6%) | 13 (1.9%) |
| $22,500 to $24,999 | 17 (2.7%) | 28 (4.2%) |
| $25,000 to $29,999 | 12 (1.9%) | 32 (4.8%) |
| $30,000 to $34,999 | 19 (3.0%) | 21 (3.1%) |
| $35,000 to $39,999 | 37 (5.9%) | 17 (2.5%) |
| $40,000 to $44,999 | 61 (9.8%) | 23 (3.4%) |
| $45,000 to $49,999 | 32 (5.1%) | 20 (3.0%) |
| $50,000 to $54,999 | 7 (1.1%) | 56 (8.4%) |
| $55,000 to $64,999 | 30 (4.8%) | 62 (9.2%) |
| $65,000 to $74,999 | 62 (10.0%) | 24 (3.6%) |
| $75,000 to $99,999 | 99 (15.9%) | 68 (10.2%) |
| $100,000+ | 107 (17.2%) | 55 (8.2%) |
| Total | 622 (100.0%) | 670 (100.0%) |
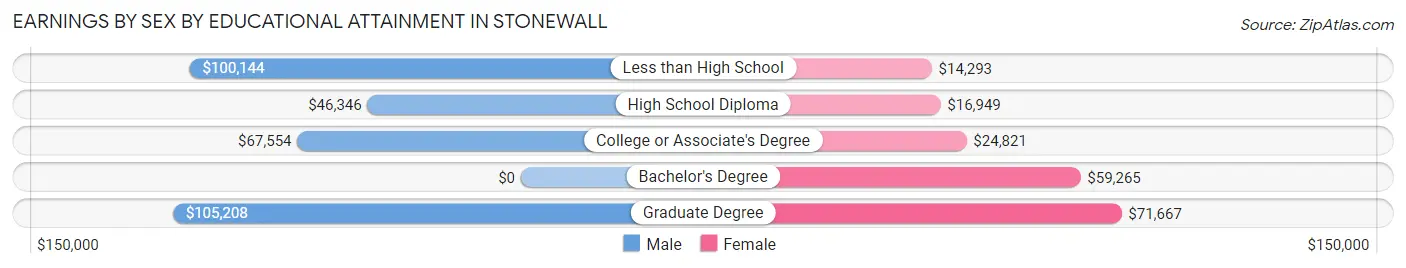
Earnings by Sex by Educational Attainment in Stonewall
Average earnings in Stonewall are $61,023 for men and $34,018 for women, a difference of 44.3%. Men with an educational attainment of graduate degree enjoy the highest average annual earnings of $105,208, while those with high school diploma education earn the least with $46,346. Women with an educational attainment of graduate degree earn the most with the average annual earnings of $71,667, while those with less than high school education have the smallest earnings of $14,293.
| Educational Attainment | Male Income | Female Income |
| Less than High School | $100,144 | $14,293 |
| High School Diploma | $46,346 | $16,949 |
| College or Associate's Degree | $67,554 | $24,821 |
| Bachelor's Degree | - | - |
| Graduate Degree | $105,208 | $71,667 |
| Total | $61,023 | $34,018 |
Family Income in Stonewall
Family Income Brackets in Stonewall
According to the Stonewall family income data, there are 189 families falling into the $100,000 to $149,999 income range, which is the most common income bracket and makes up 28.0% of all families.
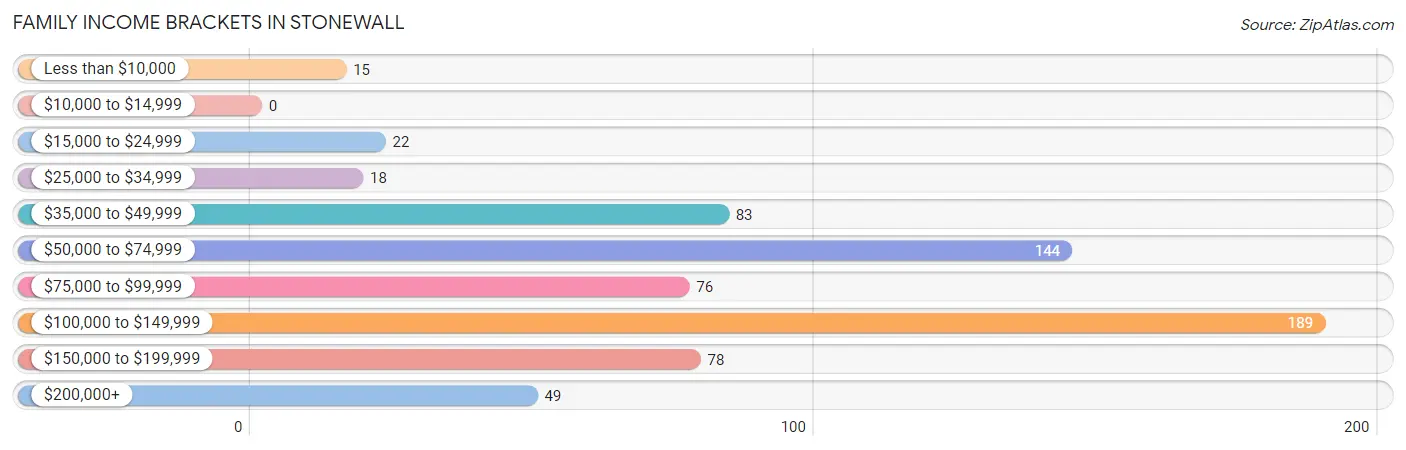
| Income Bracket | # Families | % Families |
| Less than $10,000 | 15 | 2.2% |
| $10,000 to $14,999 | 0 | 0.0% |
| $15,000 to $24,999 | 22 | 3.3% |
| $25,000 to $34,999 | 18 | 2.7% |
| $35,000 to $49,999 | 83 | 12.3% |
| $50,000 to $74,999 | 144 | 21.4% |
| $75,000 to $99,999 | 76 | 11.3% |
| $100,000 to $149,999 | 189 | 28.0% |
| $150,000 to $199,999 | 78 | 11.6% |
| $200,000+ | 49 | 7.3% |
Family Income by Famaliy Size in Stonewall
4-person families (122 | 18.1%) account for the highest median family income in Stonewall with $143,393 per family, while 3-person families (139 | 20.6%) have the highest median income of $40,319 per family member.
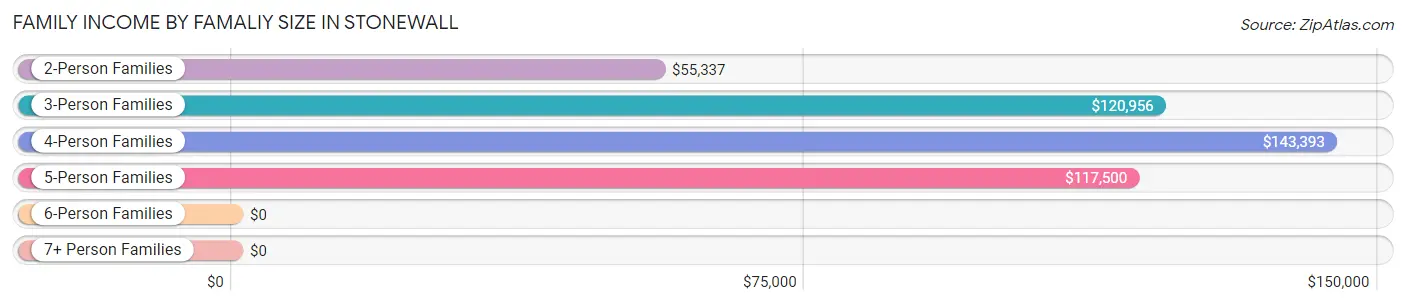
| Income Bracket | # Families | Median Income |
| 2-Person Families | 389 (57.7%) | $55,337 |
| 3-Person Families | 139 (20.6%) | $120,956 |
| 4-Person Families | 122 (18.1%) | $143,393 |
| 5-Person Families | 20 (3.0%) | $117,500 |
| 6-Person Families | 4 (0.6%) | $0 |
| 7+ Person Families | 0 (0.0%) | $0 |
| Total | 674 (100.0%) | $91,000 |
Family Income by Number of Earners in Stonewall
The median family income in Stonewall is $91,000, with families comprising 3+ earners (53) having the highest median family income of $188,375, while families with no earners (117) have the lowest median family income of $51,484, accounting for 7.9% and 17.4% of families, respectively.
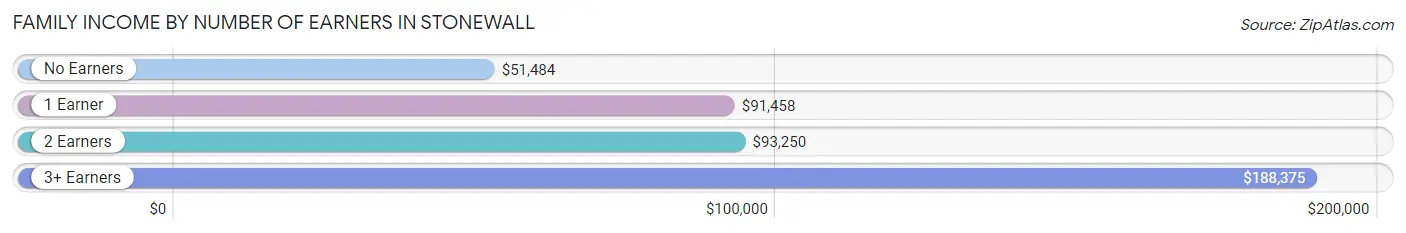
| Number of Earners | # Families | Median Income |
| No Earners | 117 (17.4%) | $51,484 |
| 1 Earner | 125 (18.5%) | $91,458 |
| 2 Earners | 379 (56.2%) | $93,250 |
| 3+ Earners | 53 (7.9%) | $188,375 |
| Total | 674 (100.0%) | $91,000 |
Household Income in Stonewall
Household Income Brackets in Stonewall
With 196 households falling in the category, the $100,000 to $149,999 income range is the most frequent in Stonewall, accounting for 21.1% of all households. In contrast, only 24 households (2.6%) fall into the $10,000 to $14,999 income bracket, making it the least populous group.
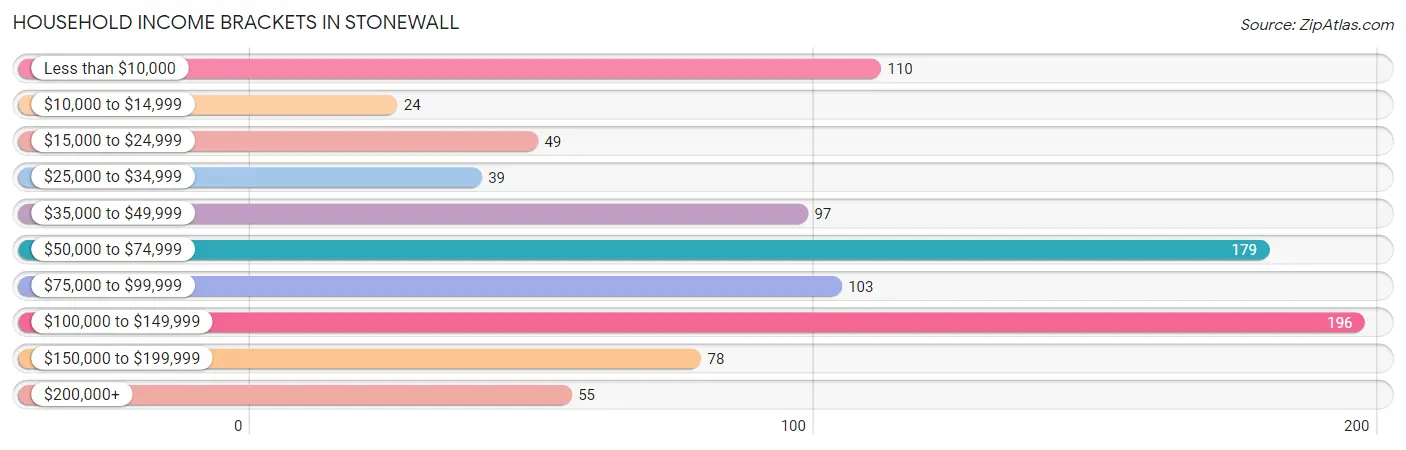
| Income Bracket | # Households | % Households |
| Less than $10,000 | 110 | 11.8% |
| $10,000 to $14,999 | 24 | 2.6% |
| $15,000 to $24,999 | 49 | 5.3% |
| $25,000 to $34,999 | 39 | 4.2% |
| $35,000 to $49,999 | 97 | 10.4% |
| $50,000 to $74,999 | 179 | 19.2% |
| $75,000 to $99,999 | 103 | 11.1% |
| $100,000 to $149,999 | 196 | 21.1% |
| $150,000 to $199,999 | 78 | 8.4% |
| $200,000+ | 55 | 5.9% |
Household Income by Householder Age in Stonewall
The median household income in Stonewall is $66,667, with the highest median household income of $96,875 found in the 25 to 44 years age bracket for the primary householder. A total of 220 households (23.7%) fall into this category. Meanwhile, the 15 to 24 years age bracket for the primary householder has the lowest median household income of $0, with 4 households (0.4%) in this group.
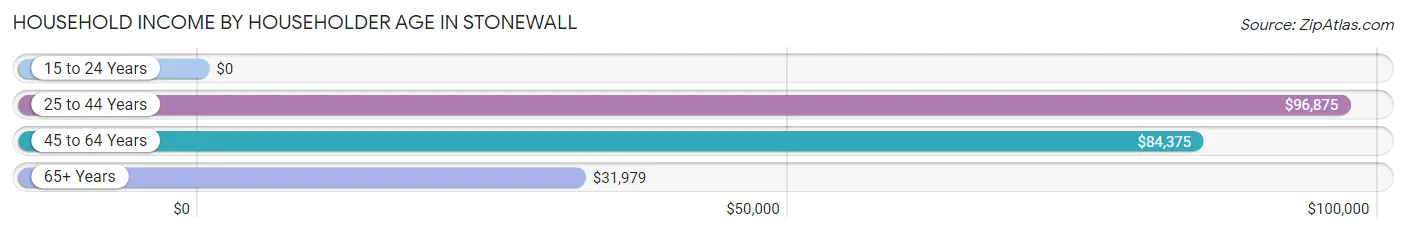
| Income Bracket | # Households | Median Income |
| 15 to 24 Years | 4 (0.4%) | $0 |
| 25 to 44 Years | 220 (23.7%) | $96,875 |
| 45 to 64 Years | 385 (41.4%) | $84,375 |
| 65+ Years | 321 (34.5%) | $31,979 |
| Total | 930 (100.0%) | $66,667 |
Poverty in Stonewall
Income Below Poverty by Sex and Age in Stonewall
With 5.1% poverty level for males and 11.2% for females among the residents of Stonewall, 65 to 74 year old males and 75 year old and over females are the most vulnerable to poverty, with 43 males (28.5%) and 40 females (39.6%) in their respective age groups living below the poverty level.
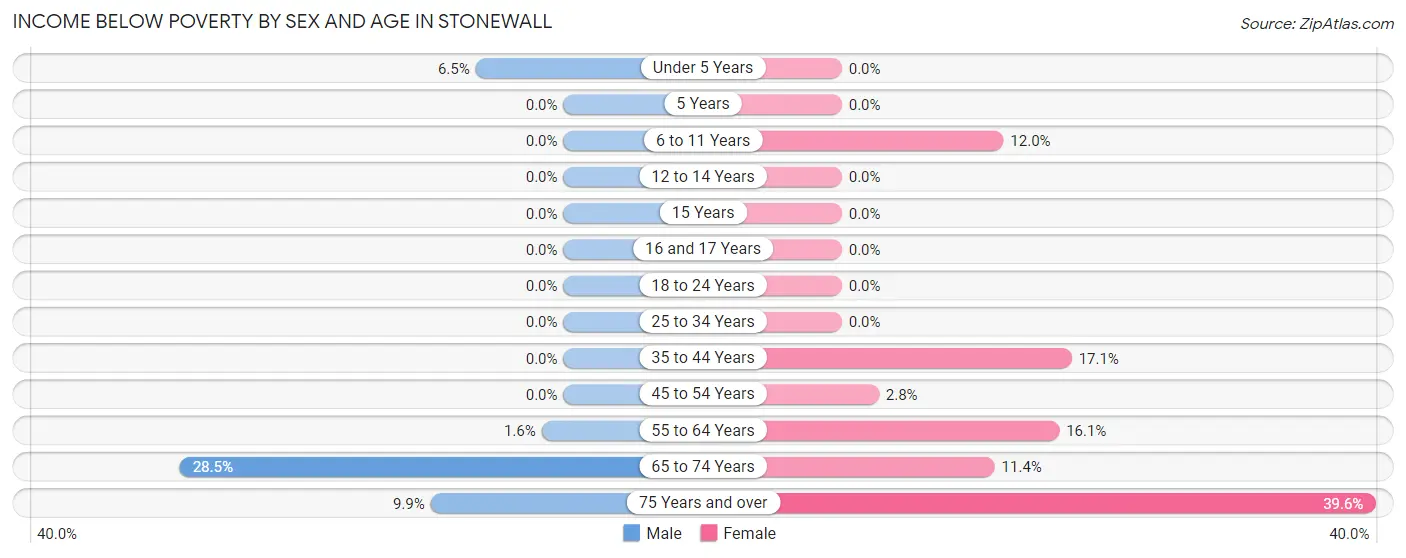
| Age Bracket | Male | Female |
| Under 5 Years | 6 (6.5%) | 0 (0.0%) |
| 5 Years | 0 (0.0%) | 0 (0.0%) |
| 6 to 11 Years | 0 (0.0%) | 6 (12.0%) |
| 12 to 14 Years | 0 (0.0%) | 0 (0.0%) |
| 15 Years | 0 (0.0%) | 0 (0.0%) |
| 16 and 17 Years | 0 (0.0%) | 0 (0.0%) |
| 18 to 24 Years | 0 (0.0%) | 0 (0.0%) |
| 25 to 34 Years | 0 (0.0%) | 0 (0.0%) |
| 35 to 44 Years | 0 (0.0%) | 28 (17.1%) |
| 45 to 54 Years | 0 (0.0%) | 5 (2.8%) |
| 55 to 64 Years | 3 (1.6%) | 36 (16.1%) |
| 65 to 74 Years | 43 (28.5%) | 16 (11.4%) |
| 75 Years and over | 7 (9.9%) | 40 (39.6%) |
| Total | 59 (5.1%) | 131 (11.2%) |
Income Above Poverty by Sex and Age in Stonewall
According to the poverty statistics in Stonewall, males aged 5 years and females aged under 5 years are the age groups that are most secure financially, with 100.0% of males and 100.0% of females in these age groups living above the poverty line.
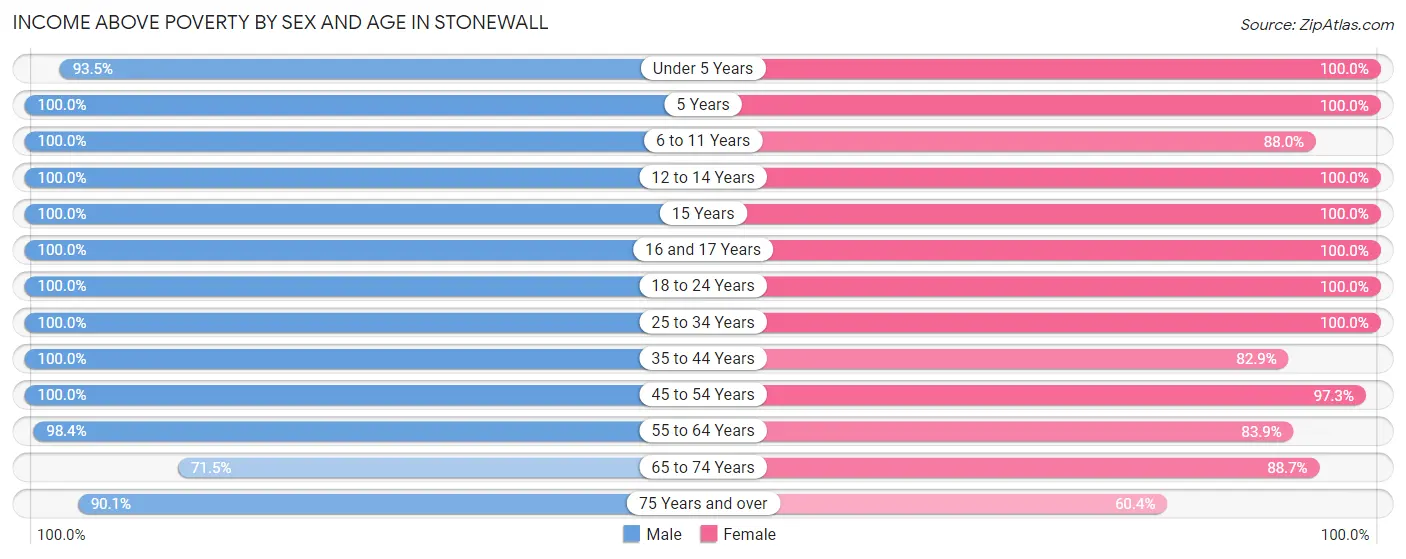
| Age Bracket | Male | Female |
| Under 5 Years | 86 (93.5%) | 26 (100.0%) |
| 5 Years | 7 (100.0%) | 14 (100.0%) |
| 6 to 11 Years | 129 (100.0%) | 44 (88.0%) |
| 12 to 14 Years | 36 (100.0%) | 42 (100.0%) |
| 15 Years | 10 (100.0%) | 14 (100.0%) |
| 16 and 17 Years | 23 (100.0%) | 21 (100.0%) |
| 18 to 24 Years | 87 (100.0%) | 33 (100.0%) |
| 25 to 34 Years | 117 (100.0%) | 155 (100.0%) |
| 35 to 44 Years | 87 (100.0%) | 136 (82.9%) |
| 45 to 54 Years | 155 (100.0%) | 177 (97.3%) |
| 55 to 64 Years | 182 (98.4%) | 187 (83.9%) |
| 65 to 74 Years | 108 (71.5%) | 125 (88.6%) |
| 75 Years and over | 64 (90.1%) | 61 (60.4%) |
| Total | 1,091 (94.9%) | 1,035 (88.8%) |
Income Below Poverty Among Married-Couple Families in Stonewall
The poverty statistics for married-couple families in Stonewall show that 1.0% or 6 of the total 606 families live below the poverty line. Families with no children have the highest poverty rate of 1.5%, comprising of 6 families. On the other hand, families with 1 or 2 children have the lowest poverty rate of 0.0%, which includes 0 families.
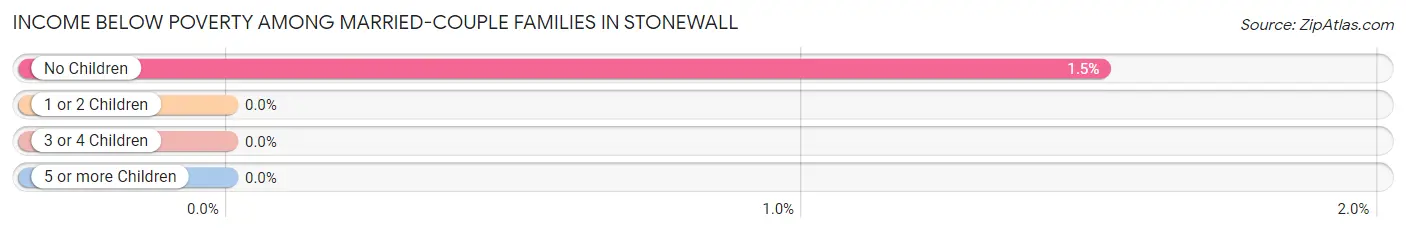
| Children | Above Poverty | Below Poverty |
| No Children | 390 (98.5%) | 6 (1.5%) |
| 1 or 2 Children | 190 (100.0%) | 0 (0.0%) |
| 3 or 4 Children | 20 (100.0%) | 0 (0.0%) |
| 5 or more Children | 0 (0.0%) | 0 (0.0%) |
| Total | 600 (99.0%) | 6 (1.0%) |
Income Below Poverty Among Single-Parent Households in Stonewall
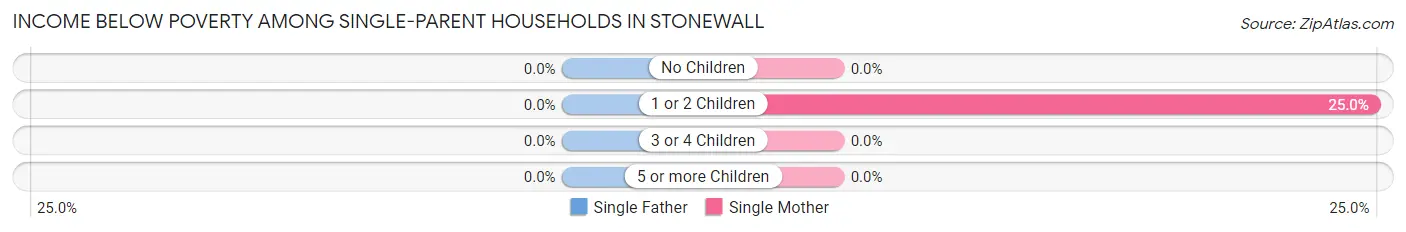
| Children | Single Father | Single Mother |
| No Children | 0 (0.0%) | 0 (0.0%) |
| 1 or 2 Children | 0 (0.0%) | 12 (25.0%) |
| 3 or 4 Children | 0 (0.0%) | 0 (0.0%) |
| 5 or more Children | 0 (0.0%) | 0 (0.0%) |
| Total | 0 (0.0%) | 12 (21.4%) |
Income Below Poverty Among Married-Couple vs Single-Parent Households in Stonewall
The poverty data for Stonewall shows that 6 of the married-couple family households (1.0%) and 12 of the single-parent households (17.6%) are living below the poverty level. Within the married-couple family households, those with no children have the highest poverty rate, with 6 households (1.5%) falling below the poverty line. Among the single-parent households, those with 1 or 2 children have the highest poverty rate, with 12 household (23.1%) living below poverty.
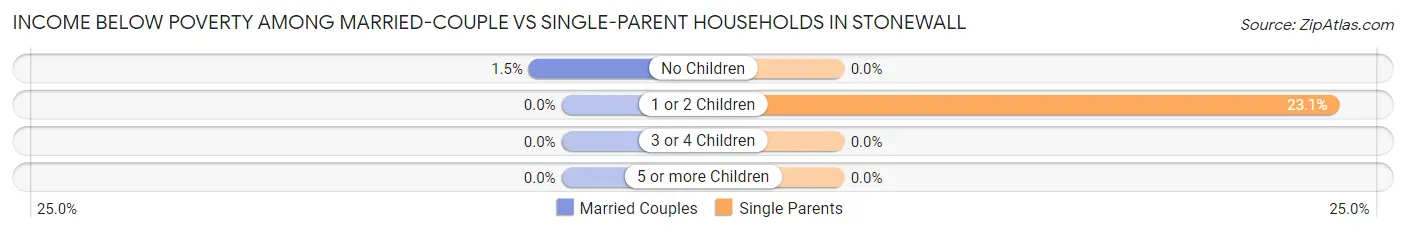
| Children | Married-Couple Families | Single-Parent Households |
| No Children | 6 (1.5%) | 0 (0.0%) |
| 1 or 2 Children | 0 (0.0%) | 12 (23.1%) |
| 3 or 4 Children | 0 (0.0%) | 0 (0.0%) |
| 5 or more Children | 0 (0.0%) | 0 (0.0%) |
| Total | 6 (1.0%) | 12 (17.6%) |
Race in Stonewall
The most populous races in Stonewall are White / Caucasian (1,951 | 83.6%), Black / African American (259 | 11.1%), and Native / Alaskan (66 | 2.8%).
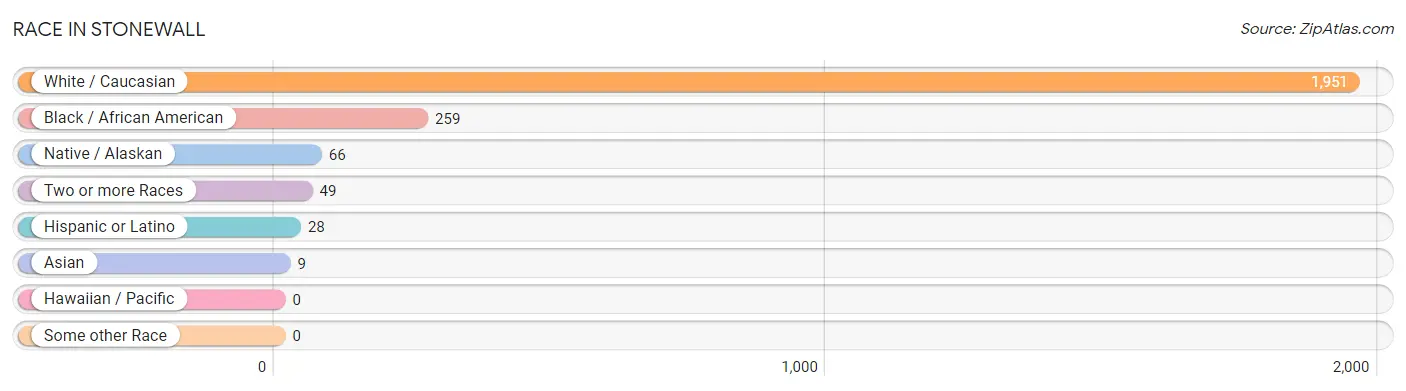
| Race | # Population | % Population |
| Asian | 9 | 0.4% |
| Black / African American | 259 | 11.1% |
| Hawaiian / Pacific | 0 | 0.0% |
| Hispanic or Latino | 28 | 1.2% |
| Native / Alaskan | 66 | 2.8% |
| White / Caucasian | 1,951 | 83.6% |
| Two or more Races | 49 | 2.1% |
| Some other Race | 0 | 0.0% |
| Total | 2,334 | 100.0% |
Ancestry in Stonewall
The most populous ancestries reported in Stonewall are Irish (327 | 14.0%), English (287 | 12.3%), German (219 | 9.4%), American (194 | 8.3%), and French (142 | 6.1%), together accounting for 50.1% of all Stonewall residents.
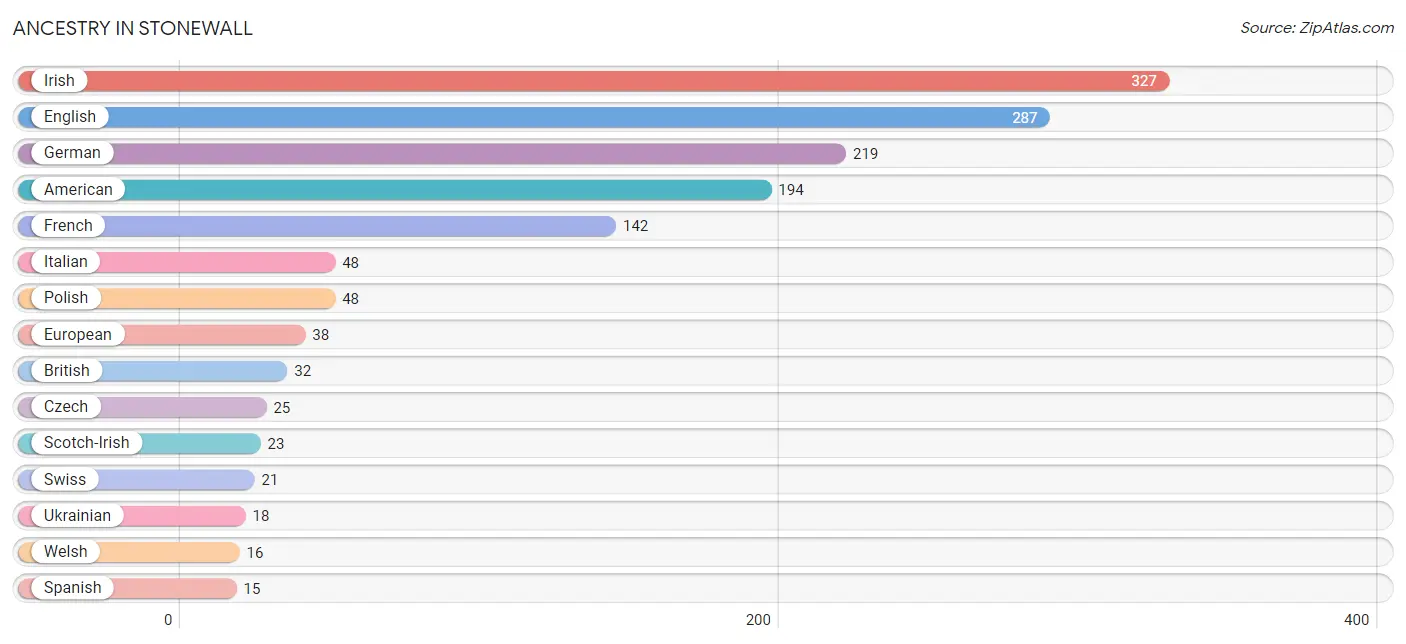
| Ancestry | # Population | % Population |
| American | 194 | 8.3% |
| Belgian | 6 | 0.3% |
| British | 32 | 1.4% |
| Burmese | 5 | 0.2% |
| Cajun | 3 | 0.1% |
| Cherokee | 2 | 0.1% |
| Czech | 25 | 1.1% |
| Czechoslovakian | 5 | 0.2% |
| English | 287 | 12.3% |
| European | 38 | 1.6% |
| French | 142 | 6.1% |
| French Canadian | 13 | 0.6% |
| German | 219 | 9.4% |
| Indian (Asian) | 5 | 0.2% |
| Irish | 327 | 14.0% |
| Italian | 48 | 2.1% |
| Korean | 9 | 0.4% |
| Mexican | 13 | 0.6% |
| Norwegian | 11 | 0.5% |
| Polish | 48 | 2.1% |
| Scandinavian | 5 | 0.2% |
| Scotch-Irish | 23 | 1.0% |
| Scottish | 12 | 0.5% |
| Spanish | 15 | 0.6% |
| Swiss | 21 | 0.9% |
| Ukrainian | 18 | 0.8% |
| Welsh | 16 | 0.7% | View All 27 Rows |
Immigrants in Stonewall
The most numerous immigrant groups reported in Stonewall came from Eastern Europe (18 | 0.8%), Europe (18 | 0.8%), Ukraine (18 | 0.8%), Asia (9 | 0.4%), and China (5 | 0.2%), together accounting for 2.9% of all Stonewall residents.
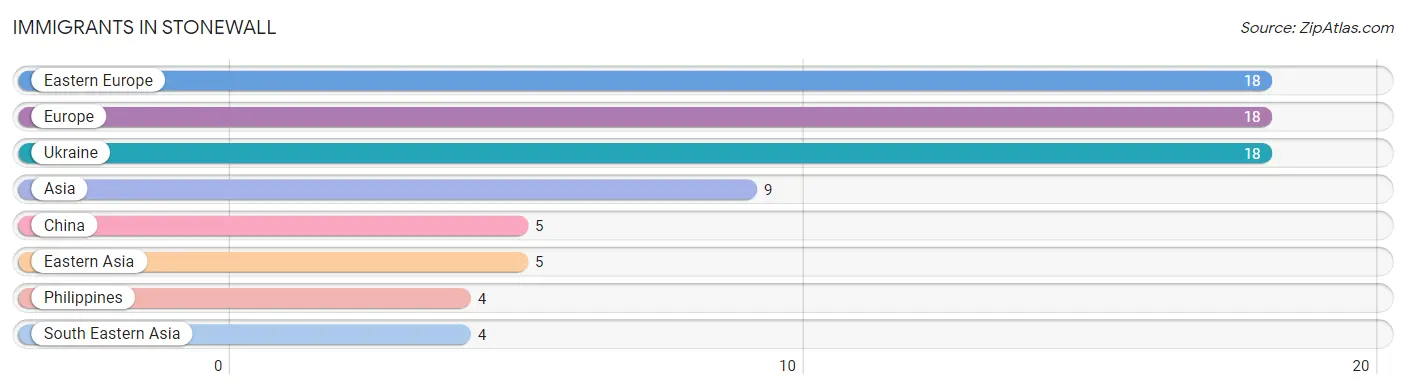
| Immigration Origin | # Population | % Population |
| Asia | 9 | 0.4% |
| China | 5 | 0.2% |
| Eastern Asia | 5 | 0.2% |
| Eastern Europe | 18 | 0.8% |
| Europe | 18 | 0.8% |
| Philippines | 4 | 0.2% |
| South Eastern Asia | 4 | 0.2% |
| Ukraine | 18 | 0.8% | View All 8 Rows |
Sex and Age in Stonewall
Sex and Age in Stonewall
The most populous age groups in Stonewall are 60 to 64 Years (110 | 9.5%) for men and 50 to 54 Years (134 | 11.4%) for women.
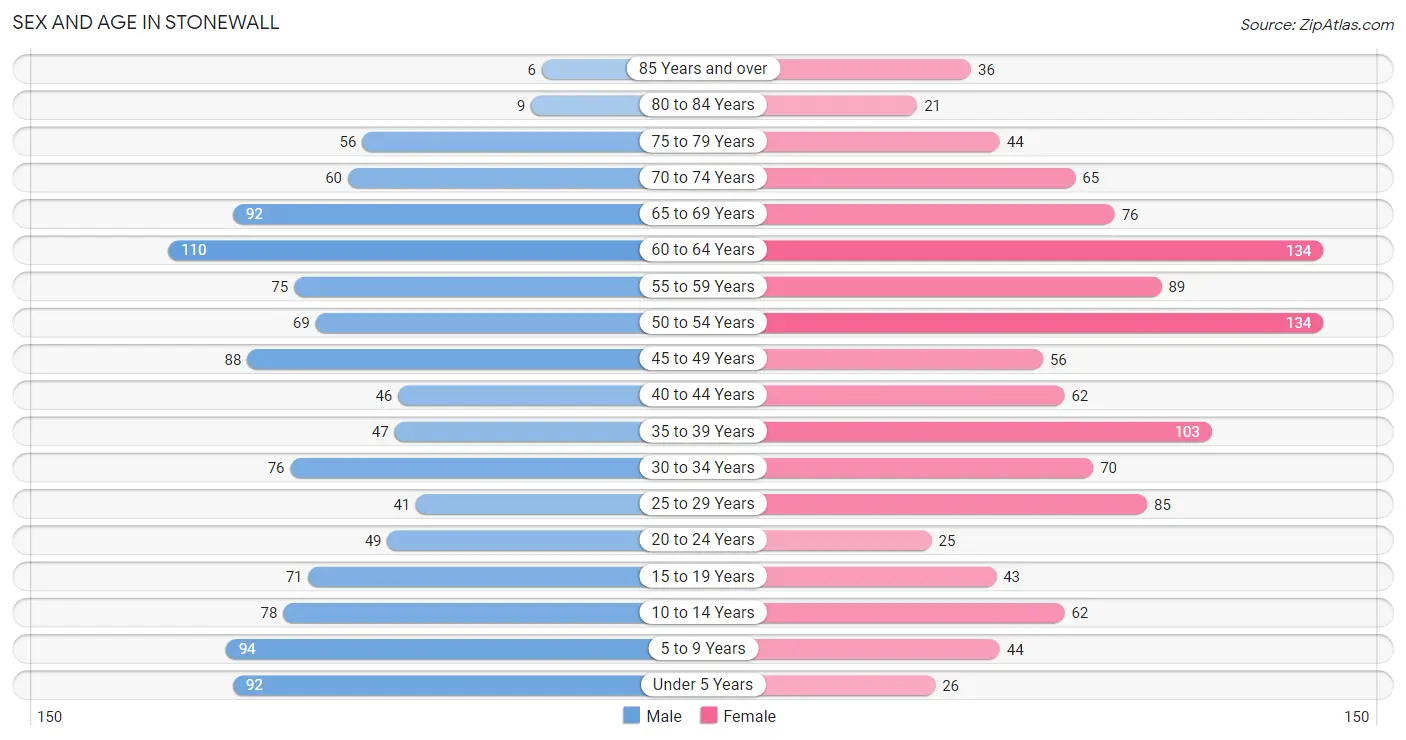
| Age Bracket | Male | Female |
| Under 5 Years | 92 (7.9%) | 26 (2.2%) |
| 5 to 9 Years | 94 (8.1%) | 44 (3.7%) |
| 10 to 14 Years | 78 (6.7%) | 62 (5.3%) |
| 15 to 19 Years | 71 (6.1%) | 43 (3.7%) |
| 20 to 24 Years | 49 (4.2%) | 25 (2.1%) |
| 25 to 29 Years | 41 (3.5%) | 85 (7.2%) |
| 30 to 34 Years | 76 (6.6%) | 70 (6.0%) |
| 35 to 39 Years | 47 (4.1%) | 103 (8.8%) |
| 40 to 44 Years | 46 (4.0%) | 62 (5.3%) |
| 45 to 49 Years | 88 (7.6%) | 56 (4.8%) |
| 50 to 54 Years | 69 (5.9%) | 134 (11.4%) |
| 55 to 59 Years | 75 (6.5%) | 89 (7.6%) |
| 60 to 64 Years | 110 (9.5%) | 134 (11.4%) |
| 65 to 69 Years | 92 (7.9%) | 76 (6.5%) |
| 70 to 74 Years | 60 (5.2%) | 65 (5.5%) |
| 75 to 79 Years | 56 (4.8%) | 44 (3.7%) |
| 80 to 84 Years | 9 (0.8%) | 21 (1.8%) |
| 85 Years and over | 6 (0.5%) | 36 (3.1%) |
| Total | 1,159 (100.0%) | 1,175 (100.0%) |
Families and Households in Stonewall
Median Family Size in Stonewall
The median family size in Stonewall is 3.02 persons per family, with married-couple families (606 | 89.9%) accounting for the largest median family size of 3.06 persons per family. On the other hand, single male/father families (12 | 1.8%) represent the smallest median family size with 2.50 persons per family.
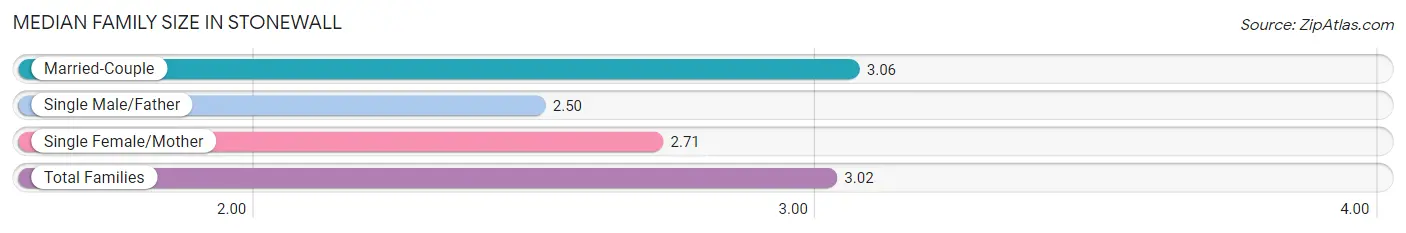
| Family Type | # Families | Family Size |
| Married-Couple | 606 (89.9%) | 3.06 |
| Single Male/Father | 12 (1.8%) | 2.50 |
| Single Female/Mother | 56 (8.3%) | 2.71 |
| Total Families | 674 (100.0%) | 3.02 |
Median Household Size in Stonewall
The median household size in Stonewall is 2.49 persons per household, with married-couple households (606 | 65.2%) accounting for the largest median household size of 3.06 persons per household. non-family households (256 | 27.5%) represent the smallest median household size with 1.10 persons per household.
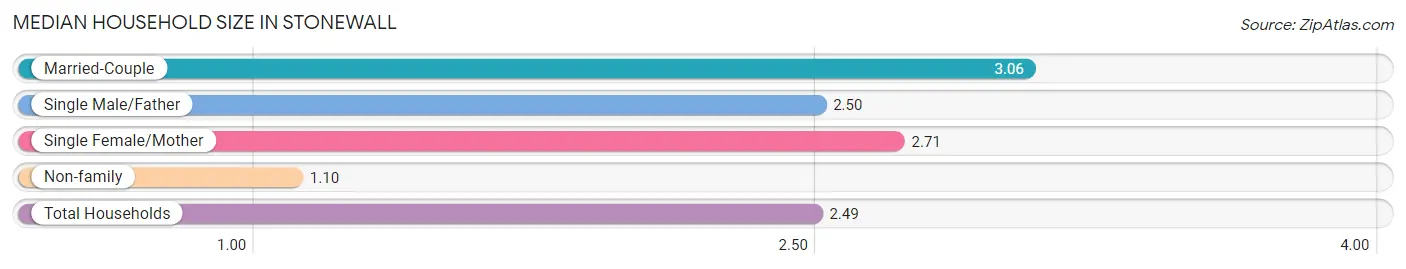
| Household Type | # Households | Household Size |
| Married-Couple | 606 (65.2%) | 3.06 |
| Single Male/Father | 12 (1.3%) | 2.50 |
| Single Female/Mother | 56 (6.0%) | 2.71 |
| Non-family | 256 (27.5%) | 1.10 |
| Total Households | 930 (100.0%) | 2.49 |
Household Size by Marriage Status in Stonewall
Out of a total of 930 households in Stonewall, 674 (72.5%) are family households, while 256 (27.5%) are nonfamily households. The most numerous type of family households are 2-person households, comprising 389, and the most common type of nonfamily households are 1-person households, comprising 240.
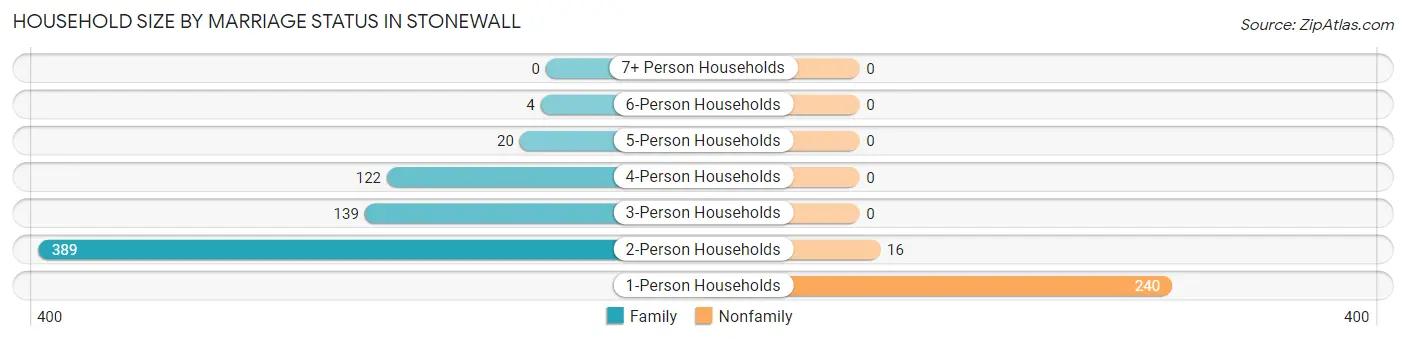
| Household Size | Family Households | Nonfamily Households |
| 1-Person Households | - | 240 (25.8%) |
| 2-Person Households | 389 (41.8%) | 16 (1.7%) |
| 3-Person Households | 139 (14.9%) | 0 (0.0%) |
| 4-Person Households | 122 (13.1%) | 0 (0.0%) |
| 5-Person Households | 20 (2.1%) | 0 (0.0%) |
| 6-Person Households | 4 (0.4%) | 0 (0.0%) |
| 7+ Person Households | 0 (0.0%) | 0 (0.0%) |
| Total | 674 (72.5%) | 256 (27.5%) |
Female Fertility in Stonewall
Fertility by Age in Stonewall
Average fertility rate in Stonewall is 8.0 births per 1,000 women. Women in the age bracket of 20 to 34 years have the highest fertility rate with 22.0 births per 1,000 women. Women in the age bracket of 20 to 34 years acount for 100.0% of all women with births.
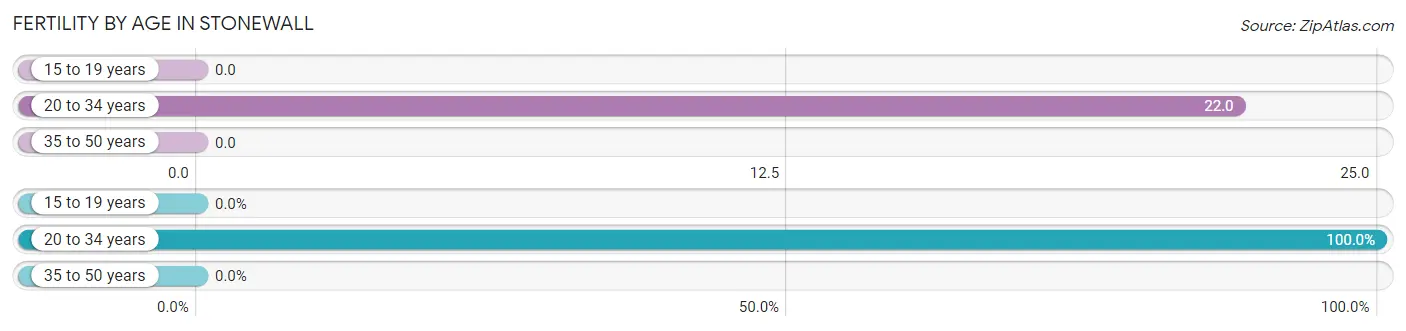
| Age Bracket | Women with Births | Births / 1,000 Women |
| 15 to 19 years | 0 (0.0%) | 0.0 |
| 20 to 34 years | 4 (100.0%) | 22.0 |
| 35 to 50 years | 0 (0.0%) | 0.0 |
| Total | 4 (100.0%) | 8.0 |
Fertility by Age by Marriage Status in Stonewall
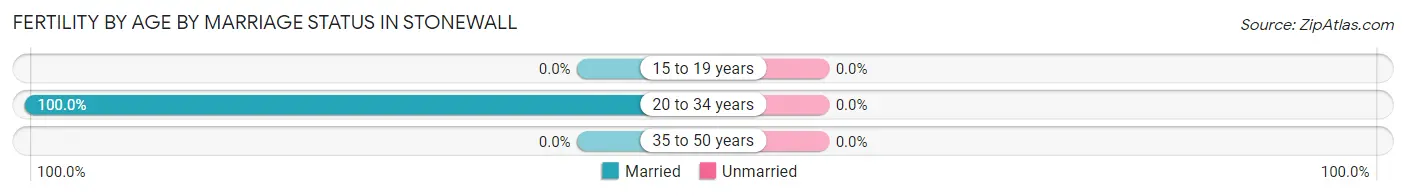
| Age Bracket | Married | Unmarried |
| 15 to 19 years | 0 (0.0%) | 0 (0.0%) |
| 20 to 34 years | 4 (100.0%) | 0 (0.0%) |
| 35 to 50 years | 0 (0.0%) | 0 (0.0%) |
| Total | 4 (100.0%) | 0 (0.0%) |
Fertility by Education in Stonewall
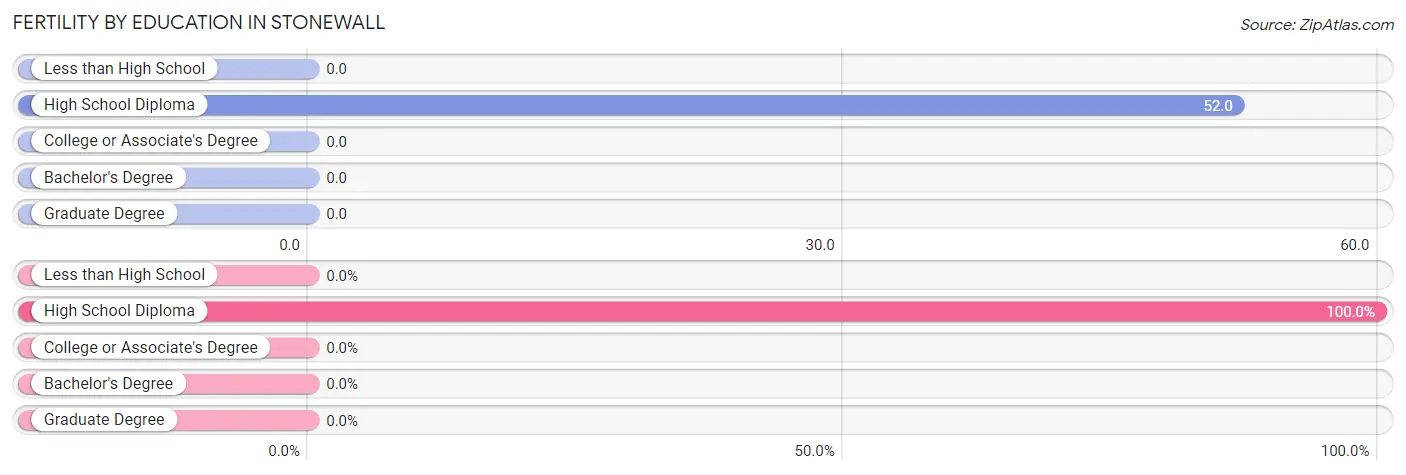
| Educational Attainment | Women with Births | Births / 1,000 Women |
| Less than High School | 0 (0.0%) | 0.0 |
| High School Diploma | 4 (100.0%) | 52.0 |
| College or Associate's Degree | 0 (0.0%) | 0.0 |
| Bachelor's Degree | 0 (0.0%) | 0.0 |
| Graduate Degree | 0 (0.0%) | 0.0 |
| Total | 4 (100.0%) | 8.0 |
Fertility by Education by Marriage Status in Stonewall
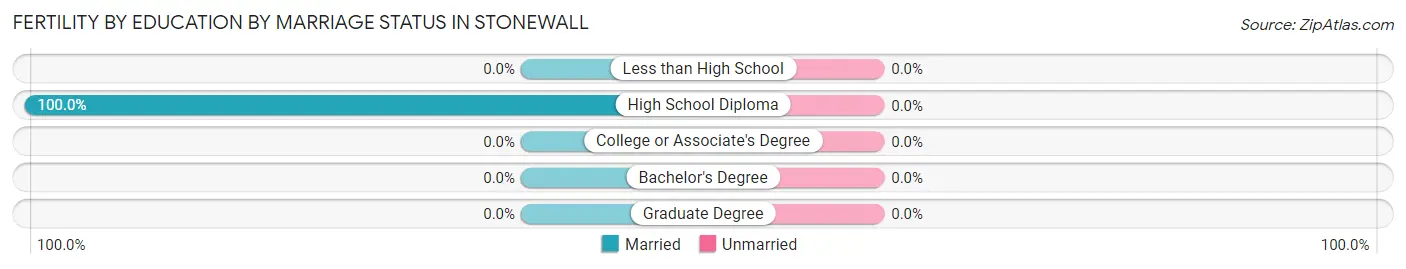
| Educational Attainment | Married | Unmarried |
| Less than High School | 0 (0.0%) | 0 (0.0%) |
| High School Diploma | 4 (100.0%) | 0 (0.0%) |
| College or Associate's Degree | 0 (0.0%) | 0 (0.0%) |
| Bachelor's Degree | 0 (0.0%) | 0 (0.0%) |
| Graduate Degree | 0 (0.0%) | 0 (0.0%) |
| Total | 4 (100.0%) | 0 (0.0%) |
Employment Characteristics in Stonewall
Employment by Class of Employer in Stonewall
Among the 1,151 employed individuals in Stonewall, private company employees (756 | 65.7%), local government employees (125 | 10.9%), and self-employed (not incorporated) (88 | 7.6%) make up the most common classes of employment.
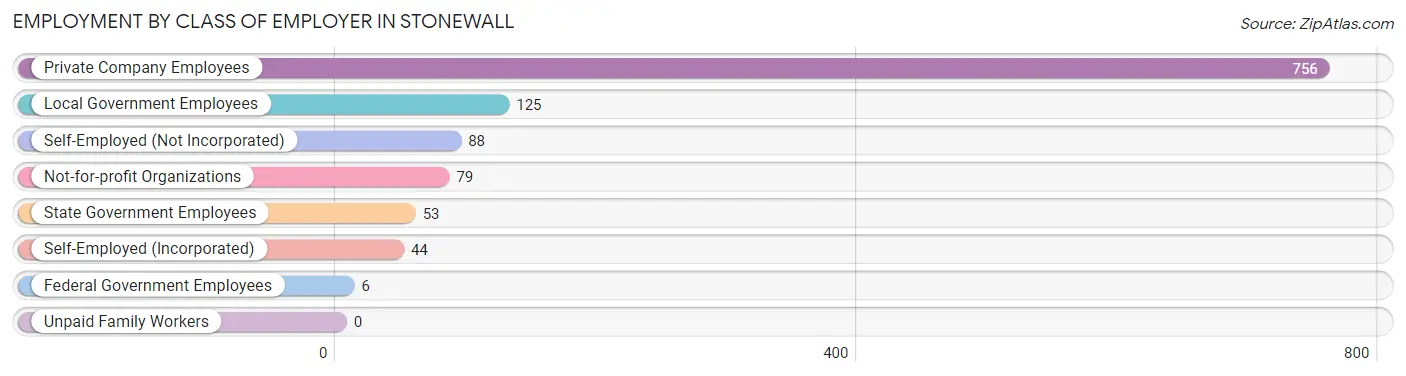
| Employer Class | # Employees | % Employees |
| Private Company Employees | 756 | 65.7% |
| Self-Employed (Incorporated) | 44 | 3.8% |
| Self-Employed (Not Incorporated) | 88 | 7.6% |
| Not-for-profit Organizations | 79 | 6.9% |
| Local Government Employees | 125 | 10.9% |
| State Government Employees | 53 | 4.6% |
| Federal Government Employees | 6 | 0.5% |
| Unpaid Family Workers | 0 | 0.0% |
| Total | 1,151 | 100.0% |
Employment Status by Age in Stonewall
According to the labor force statistics for Stonewall, out of the total population over 16 years of age (1,914), 62.3% or 1,192 individuals are in the labor force, with 0.8% or 10 of them unemployed. The age group with the highest labor force participation rate is 30 to 34 years, with 91.8% or 134 individuals in the labor force. Within the labor force, the 65 to 74 years age range has the highest percentage of unemployed individuals, with 4.1% or 2 of them being unemployed.
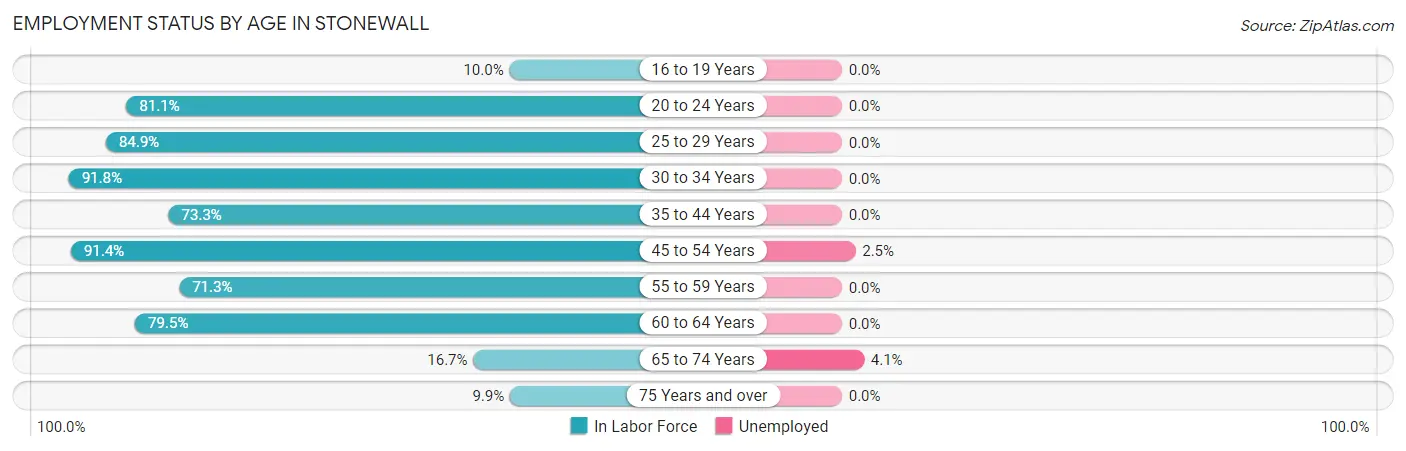
| Age Bracket | In Labor Force | Unemployed |
| 16 to 19 Years | 9 (10.0%) | 0 (0.0%) |
| 20 to 24 Years | 60 (81.1%) | 0 (0.0%) |
| 25 to 29 Years | 107 (84.9%) | 0 (0.0%) |
| 30 to 34 Years | 134 (91.8%) | 0 (0.0%) |
| 35 to 44 Years | 189 (73.3%) | 0 (0.0%) |
| 45 to 54 Years | 317 (91.4%) | 8 (2.5%) |
| 55 to 59 Years | 117 (71.3%) | 0 (0.0%) |
| 60 to 64 Years | 194 (79.5%) | 0 (0.0%) |
| 65 to 74 Years | 49 (16.7%) | 2 (4.1%) |
| 75 Years and over | 17 (9.9%) | 0 (0.0%) |
| Total | 1,192 (62.3%) | 10 (0.8%) |
Employment Status by Educational Attainment in Stonewall
According to labor force statistics for Stonewall, 82.3% of individuals (1,058) out of the total population between 25 and 64 years of age (1,285) are in the labor force, with 0.8% or 8 of them being unemployed. The group with the highest labor force participation rate are those with the educational attainment of bachelor's degree or higher, with 92.6% or 301 individuals in the labor force. Within the labor force, individuals with high school diploma education have the highest percentage of unemployment, with 1.4% or 5 of them being unemployed.
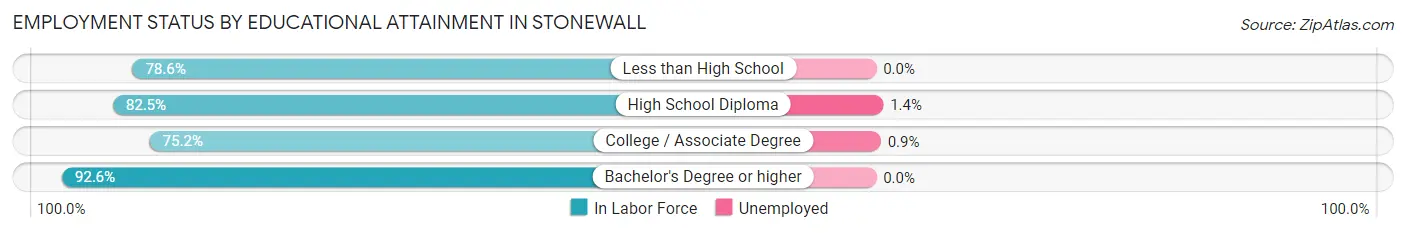
| Educational Attainment | In Labor Force | Unemployed |
| Less than High School | 88 (78.6%) | 0 (0.0%) |
| High School Diploma | 350 (82.5%) | 6 (1.4%) |
| College / Associate Degree | 319 (75.2%) | 4 (0.9%) |
| Bachelor's Degree or higher | 301 (92.6%) | 0 (0.0%) |
| Total | 1,058 (82.3%) | 10 (0.8%) |
Employment Occupations by Sex in Stonewall
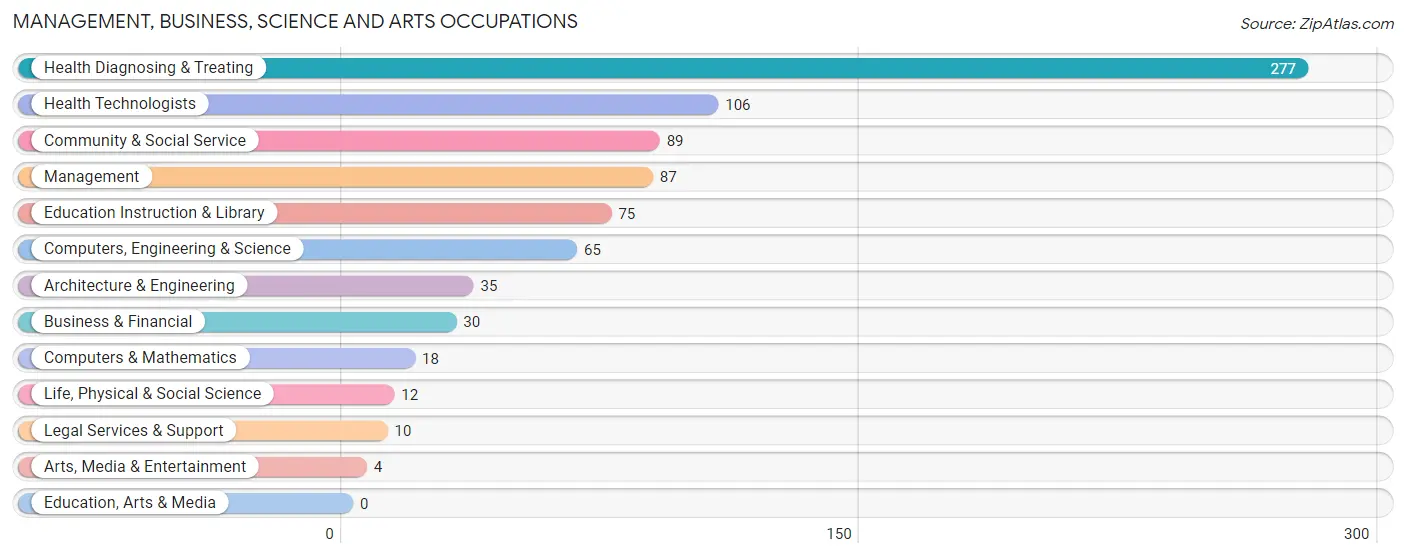
Management, Business, Science and Arts Occupations
The most common Management, Business, Science and Arts occupations in Stonewall are Health Diagnosing & Treating (277 | 23.4%), Health Technologists (106 | 9.0%), Community & Social Service (89 | 7.5%), Management (87 | 7.3%), and Education Instruction & Library (75 | 6.3%).
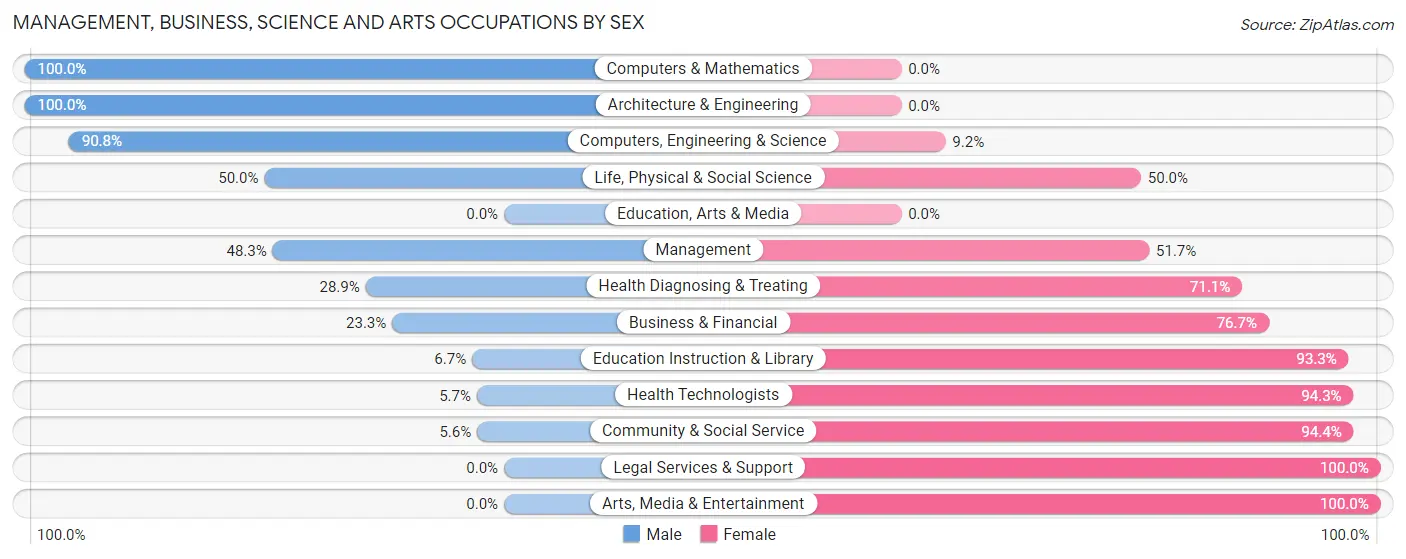
Management, Business, Science and Arts Occupations by Sex
Within the Management, Business, Science and Arts occupations in Stonewall, the most male-oriented occupations are Computers & Mathematics (100.0%), Architecture & Engineering (100.0%), and Computers, Engineering & Science (90.8%), while the most female-oriented occupations are Legal Services & Support (100.0%), Arts, Media & Entertainment (100.0%), and Community & Social Service (94.4%).
| Occupation | Male | Female |
| Management | 42 (48.3%) | 45 (51.7%) |
| Business & Financial | 7 (23.3%) | 23 (76.7%) |
| Computers, Engineering & Science | 59 (90.8%) | 6 (9.2%) |
| Computers & Mathematics | 18 (100.0%) | 0 (0.0%) |
| Architecture & Engineering | 35 (100.0%) | 0 (0.0%) |
| Life, Physical & Social Science | 6 (50.0%) | 6 (50.0%) |
| Community & Social Service | 5 (5.6%) | 84 (94.4%) |
| Education, Arts & Media | 0 (0.0%) | 0 (0.0%) |
| Legal Services & Support | 0 (0.0%) | 10 (100.0%) |
| Education Instruction & Library | 5 (6.7%) | 70 (93.3%) |
| Arts, Media & Entertainment | 0 (0.0%) | 4 (100.0%) |
| Health Diagnosing & Treating | 80 (28.9%) | 197 (71.1%) |
| Health Technologists | 6 (5.7%) | 100 (94.3%) |
| Total (Category) | 193 (35.2%) | 355 (64.8%) |
| Total (Overall) | 582 (49.2%) | 601 (50.8%) |
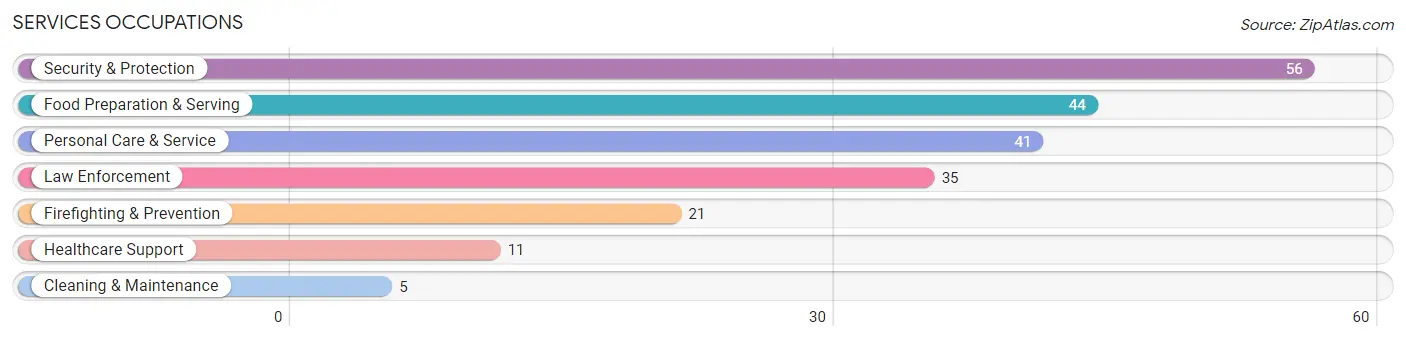
Services Occupations
The most common Services occupations in Stonewall are Security & Protection (56 | 4.7%), Food Preparation & Serving (44 | 3.7%), Personal Care & Service (41 | 3.5%), Law Enforcement (35 | 3.0%), and Firefighting & Prevention (21 | 1.8%).
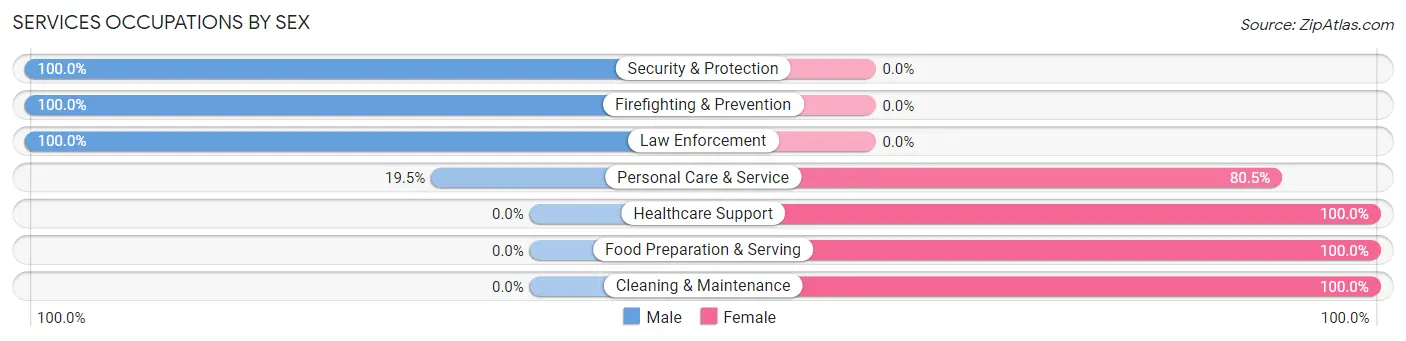
Services Occupations by Sex
Within the Services occupations in Stonewall, the most male-oriented occupations are Security & Protection (100.0%), Firefighting & Prevention (100.0%), and Law Enforcement (100.0%), while the most female-oriented occupations are Healthcare Support (100.0%), Food Preparation & Serving (100.0%), and Cleaning & Maintenance (100.0%).
| Occupation | Male | Female |
| Healthcare Support | 0 (0.0%) | 11 (100.0%) |
| Security & Protection | 56 (100.0%) | 0 (0.0%) |
| Firefighting & Prevention | 21 (100.0%) | 0 (0.0%) |
| Law Enforcement | 35 (100.0%) | 0 (0.0%) |
| Food Preparation & Serving | 0 (0.0%) | 44 (100.0%) |
| Cleaning & Maintenance | 0 (0.0%) | 5 (100.0%) |
| Personal Care & Service | 8 (19.5%) | 33 (80.5%) |
| Total (Category) | 64 (40.8%) | 93 (59.2%) |
| Total (Overall) | 582 (49.2%) | 601 (50.8%) |
Sales and Office Occupations
The most common Sales and Office occupations in Stonewall are Sales & Related (111 | 9.4%), and Office & Administration (105 | 8.9%).
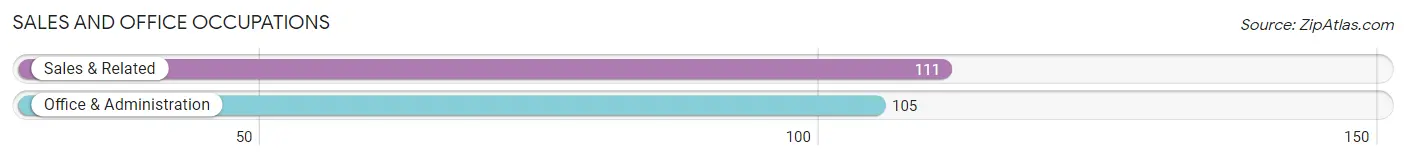
Sales and Office Occupations by Sex
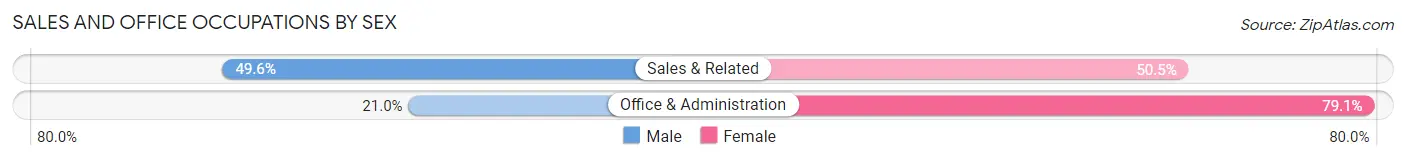
| Occupation | Male | Female |
| Sales & Related | 55 (49.5%) | 56 (50.4%) |
| Office & Administration | 22 (20.9%) | 83 (79.0%) |
| Total (Category) | 77 (35.6%) | 139 (64.3%) |
| Total (Overall) | 582 (49.2%) | 601 (50.8%) |
Natural Resources, Construction and Maintenance Occupations
The most common Natural Resources, Construction and Maintenance occupations in Stonewall are Construction & Extraction (96 | 8.1%), and Installation, Maintenance & Repair (58 | 4.9%).
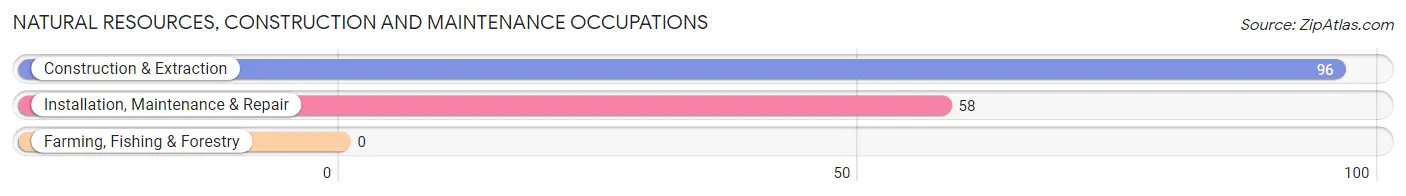
Natural Resources, Construction and Maintenance Occupations by Sex
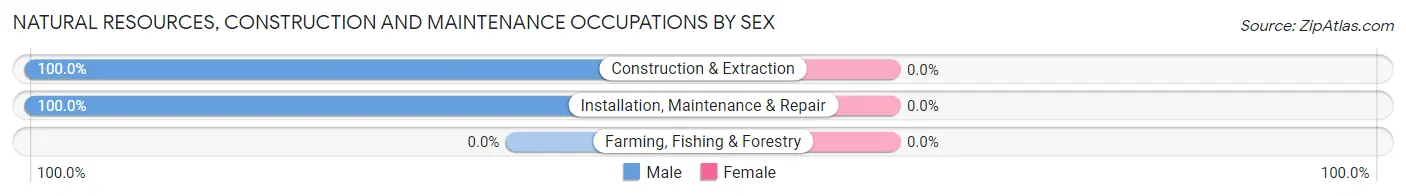
| Occupation | Male | Female |
| Farming, Fishing & Forestry | 0 (0.0%) | 0 (0.0%) |
| Construction & Extraction | 96 (100.0%) | 0 (0.0%) |
| Installation, Maintenance & Repair | 58 (100.0%) | 0 (0.0%) |
| Total (Category) | 154 (100.0%) | 0 (0.0%) |
| Total (Overall) | 582 (49.2%) | 601 (50.8%) |
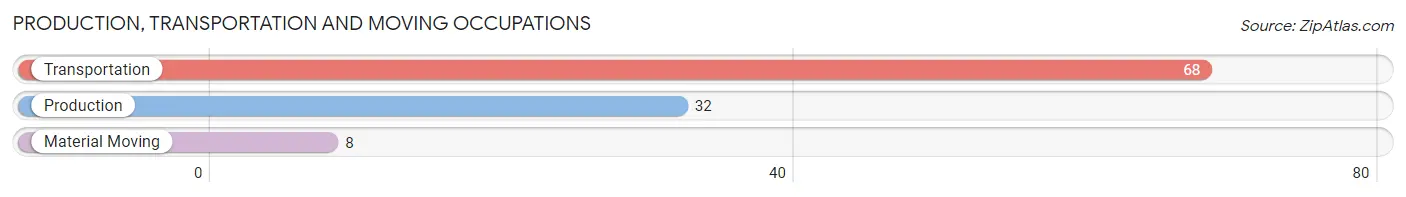
Production, Transportation and Moving Occupations
The most common Production, Transportation and Moving occupations in Stonewall are Transportation (68 | 5.8%), Production (32 | 2.7%), and Material Moving (8 | 0.7%).
Production, Transportation and Moving Occupations by Sex
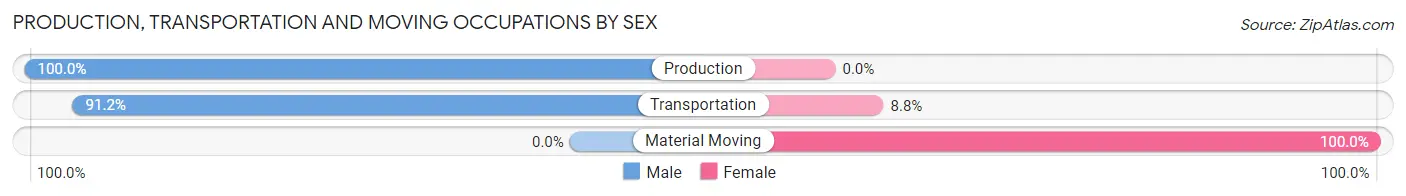
| Occupation | Male | Female |
| Production | 32 (100.0%) | 0 (0.0%) |
| Transportation | 62 (91.2%) | 6 (8.8%) |
| Material Moving | 0 (0.0%) | 8 (100.0%) |
| Total (Category) | 94 (87.0%) | 14 (13.0%) |
| Total (Overall) | 582 (49.2%) | 601 (50.8%) |
Employment Industries by Sex in Stonewall
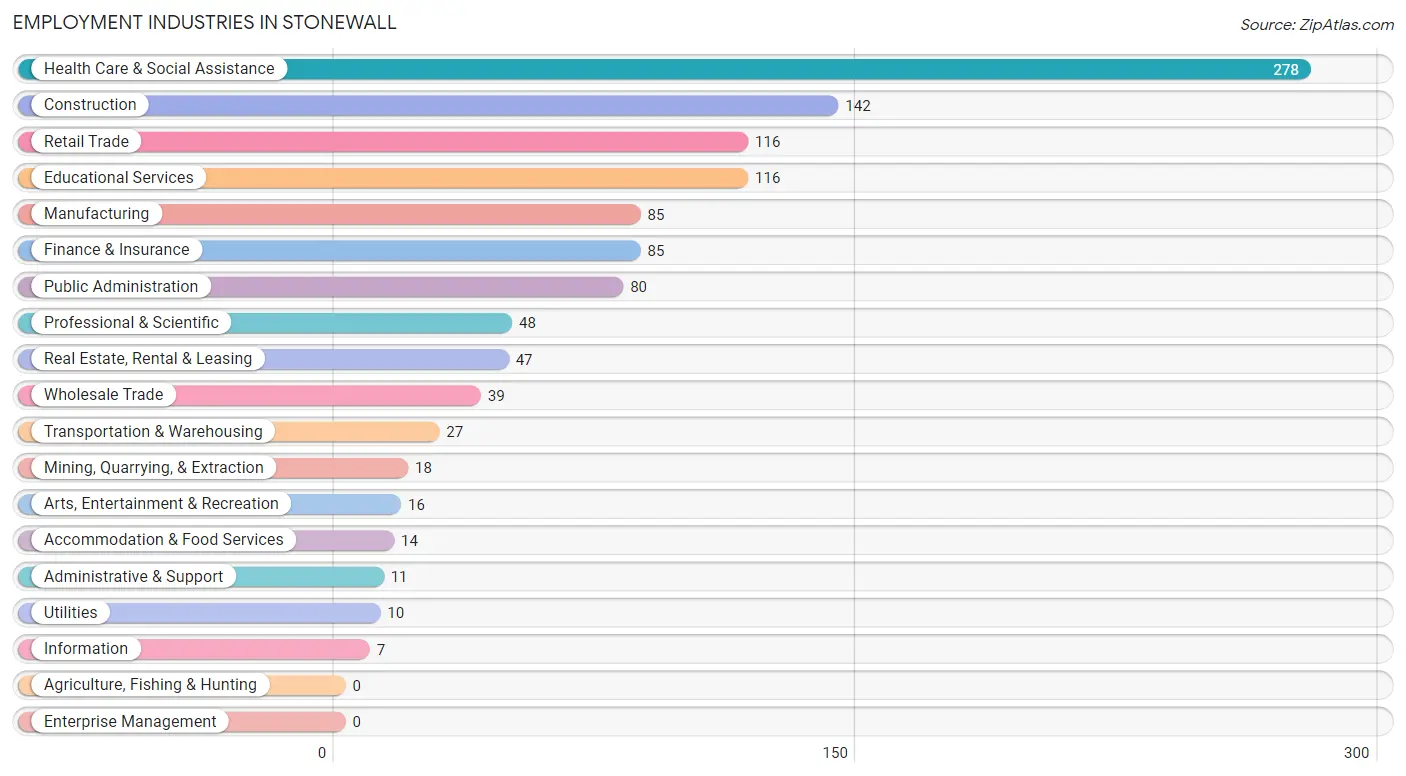
Employment Industries in Stonewall
The major employment industries in Stonewall include Health Care & Social Assistance (278 | 23.5%), Construction (142 | 12.0%), Retail Trade (116 | 9.8%), Educational Services (116 | 9.8%), and Manufacturing (85 | 7.2%).
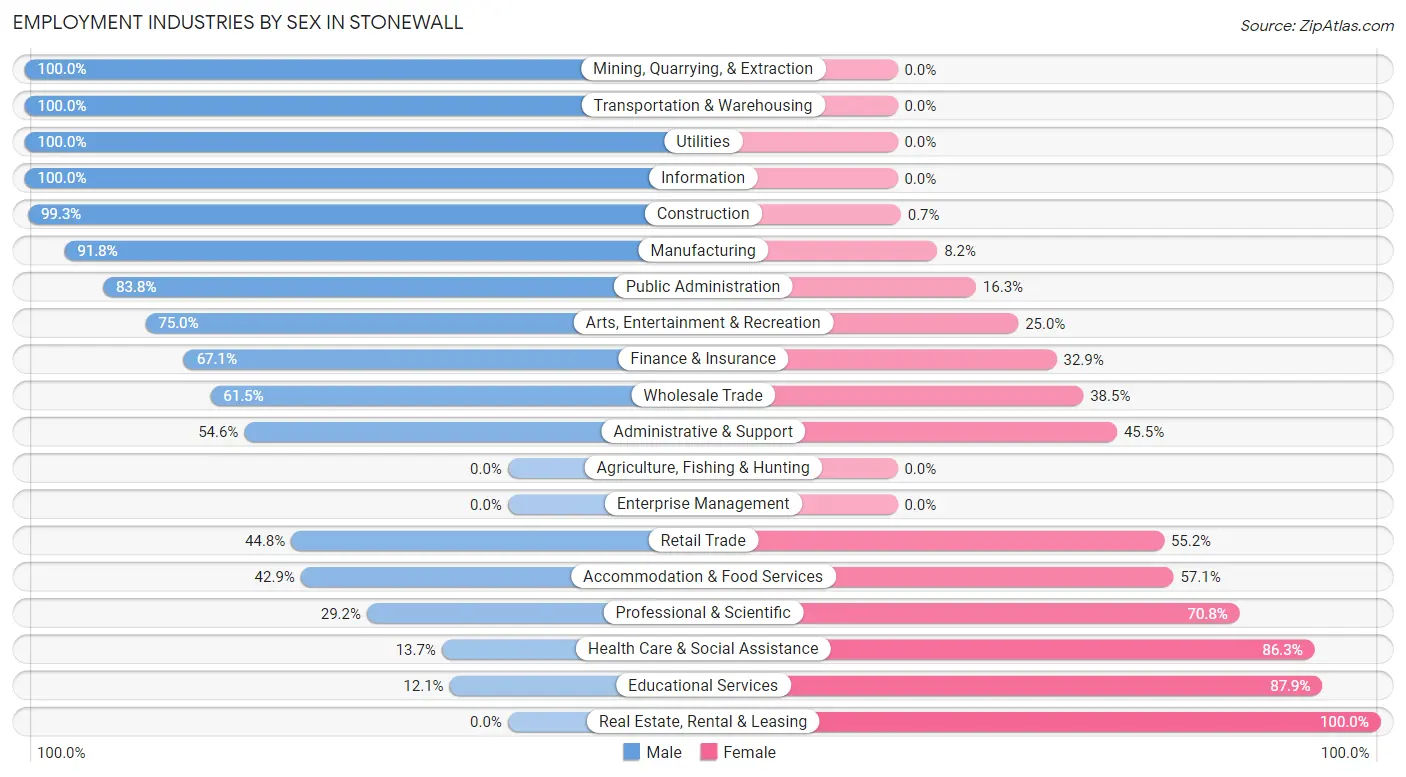
Employment Industries by Sex in Stonewall
The Stonewall industries that see more men than women are Mining, Quarrying, & Extraction (100.0%), Transportation & Warehousing (100.0%), and Utilities (100.0%), whereas the industries that tend to have a higher number of women are Real Estate, Rental & Leasing (100.0%), Educational Services (87.9%), and Health Care & Social Assistance (86.3%).
| Industry | Male | Female |
| Agriculture, Fishing & Hunting | 0 (0.0%) | 0 (0.0%) |
| Mining, Quarrying, & Extraction | 18 (100.0%) | 0 (0.0%) |
| Construction | 141 (99.3%) | 1 (0.7%) |
| Manufacturing | 78 (91.8%) | 7 (8.2%) |
| Wholesale Trade | 24 (61.5%) | 15 (38.5%) |
| Retail Trade | 52 (44.8%) | 64 (55.2%) |
| Transportation & Warehousing | 27 (100.0%) | 0 (0.0%) |
| Utilities | 10 (100.0%) | 0 (0.0%) |
| Information | 7 (100.0%) | 0 (0.0%) |
| Finance & Insurance | 57 (67.1%) | 28 (32.9%) |
| Real Estate, Rental & Leasing | 0 (0.0%) | 47 (100.0%) |
| Professional & Scientific | 14 (29.2%) | 34 (70.8%) |
| Enterprise Management | 0 (0.0%) | 0 (0.0%) |
| Administrative & Support | 6 (54.5%) | 5 (45.5%) |
| Educational Services | 14 (12.1%) | 102 (87.9%) |
| Health Care & Social Assistance | 38 (13.7%) | 240 (86.3%) |
| Arts, Entertainment & Recreation | 12 (75.0%) | 4 (25.0%) |
| Accommodation & Food Services | 6 (42.9%) | 8 (57.1%) |
| Public Administration | 67 (83.8%) | 13 (16.3%) |
| Total | 582 (49.2%) | 601 (50.8%) |
Education in Stonewall
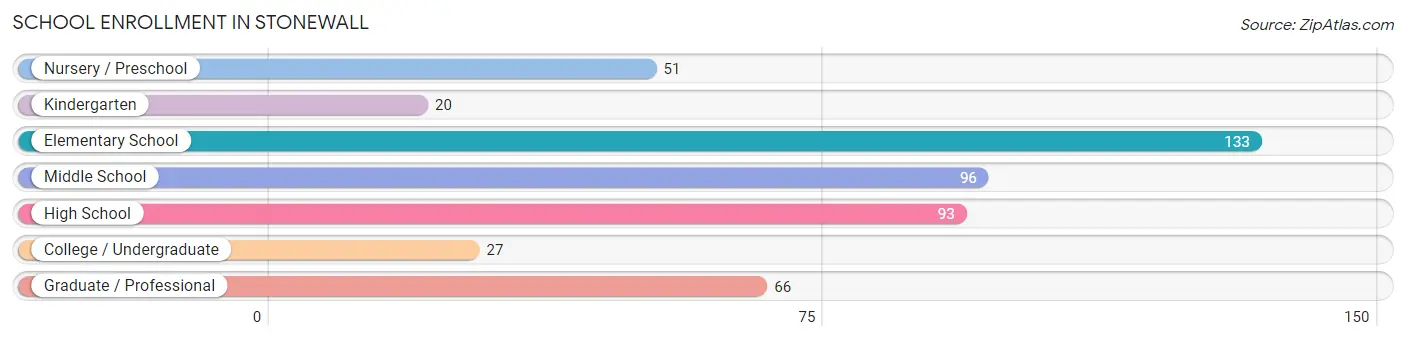
School Enrollment in Stonewall
The most common levels of schooling among the 486 students in Stonewall are elementary school (133 | 27.4%), middle school (96 | 19.8%), and high school (93 | 19.1%).
| School Level | # Students | % Students |
| Nursery / Preschool | 51 | 10.5% |
| Kindergarten | 20 | 4.1% |
| Elementary School | 133 | 27.4% |
| Middle School | 96 | 19.8% |
| High School | 93 | 19.1% |
| College / Undergraduate | 27 | 5.6% |
| Graduate / Professional | 66 | 13.6% |
| Total | 486 | 100.0% |
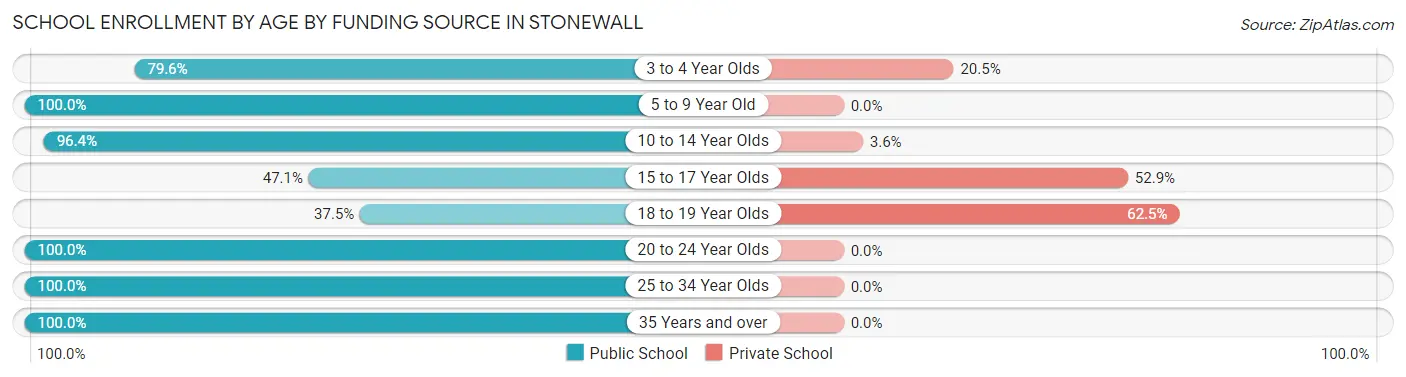
School Enrollment by Age by Funding Source in Stonewall
Out of a total of 486 students who are enrolled in schools in Stonewall, 55 (11.3%) attend a private institution, while the remaining 431 (88.7%) are enrolled in public schools. The age group of 18 to 19 year olds has the highest likelihood of being enrolled in private schools, with 5 (62.5% in the age bracket) enrolled. Conversely, the age group of 5 to 9 year old has the lowest likelihood of being enrolled in a private school, with 138 (100.0% in the age bracket) attending a public institution.
| Age Bracket | Public School | Private School |
| 3 to 4 Year Olds | 35 (79.5%) | 9 (20.4%) |
| 5 to 9 Year Old | 138 (100.0%) | 0 (0.0%) |
| 10 to 14 Year Olds | 135 (96.4%) | 5 (3.6%) |
| 15 to 17 Year Olds | 32 (47.1%) | 36 (52.9%) |
| 18 to 19 Year Olds | 3 (37.5%) | 5 (62.5%) |
| 20 to 24 Year Olds | 29 (100.0%) | 0 (0.0%) |
| 25 to 34 Year Olds | 21 (100.0%) | 0 (0.0%) |
| 35 Years and over | 38 (100.0%) | 0 (0.0%) |
| Total | 431 (88.7%) | 55 (11.3%) |
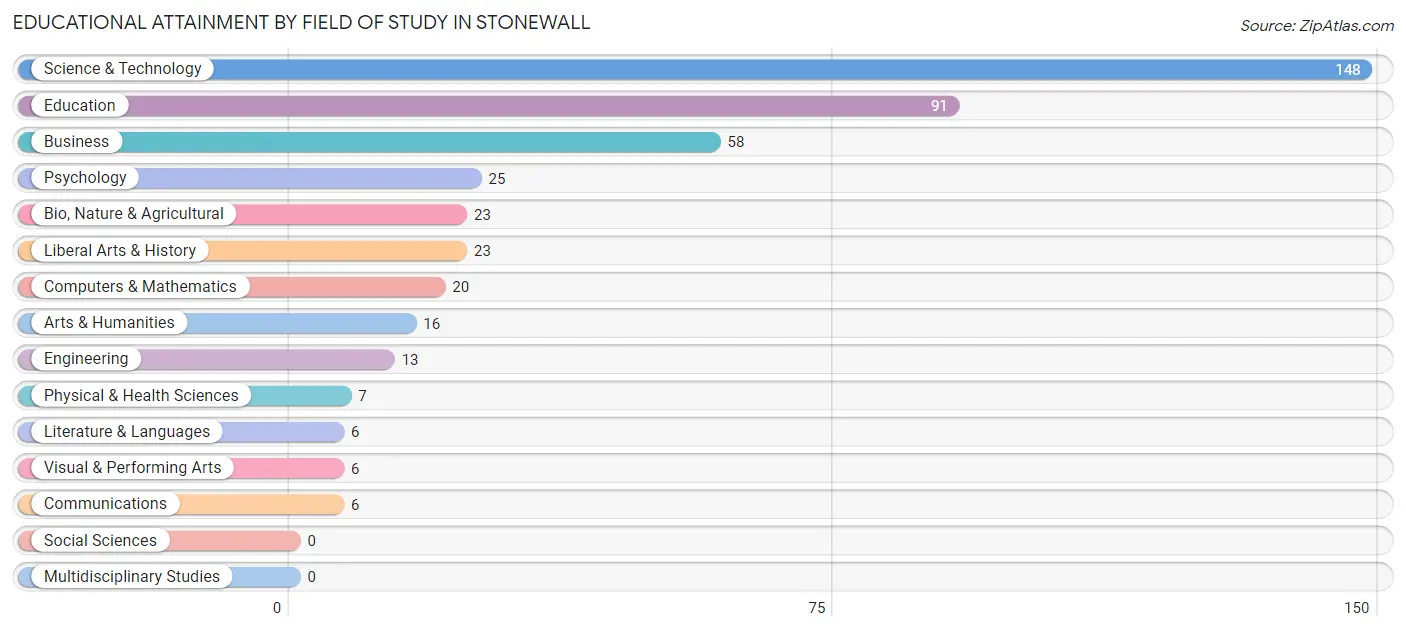
Educational Attainment by Field of Study in Stonewall
Science & technology (148 | 33.5%), education (91 | 20.6%), business (58 | 13.1%), psychology (25 | 5.7%), and bio, nature & agricultural (23 | 5.2%) are the most common fields of study among 442 individuals in Stonewall who have obtained a bachelor's degree or higher.
| Field of Study | # Graduates | % Graduates |
| Computers & Mathematics | 20 | 4.5% |
| Bio, Nature & Agricultural | 23 | 5.2% |
| Physical & Health Sciences | 7 | 1.6% |
| Psychology | 25 | 5.7% |
| Social Sciences | 0 | 0.0% |
| Engineering | 13 | 2.9% |
| Multidisciplinary Studies | 0 | 0.0% |
| Science & Technology | 148 | 33.5% |
| Business | 58 | 13.1% |
| Education | 91 | 20.6% |
| Literature & Languages | 6 | 1.4% |
| Liberal Arts & History | 23 | 5.2% |
| Visual & Performing Arts | 6 | 1.4% |
| Communications | 6 | 1.4% |
| Arts & Humanities | 16 | 3.6% |
| Total | 442 | 100.0% |
Transportation & Commute in Stonewall
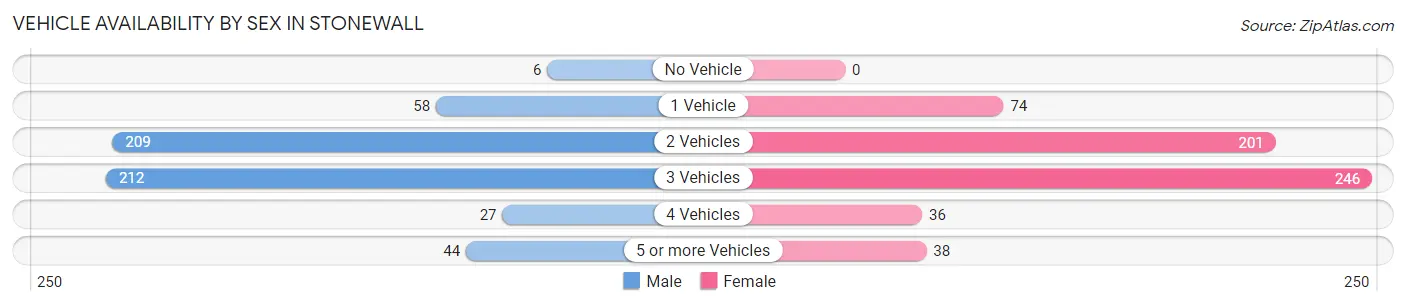
Vehicle Availability by Sex in Stonewall
The most prevalent vehicle ownership categories in Stonewall are males with 3 vehicles (212, accounting for 38.1%) and females with 3 vehicles (246, making up 35.6%).
| Vehicles Available | Male | Female |
| No Vehicle | 6 (1.1%) | 0 (0.0%) |
| 1 Vehicle | 58 (10.4%) | 74 (12.4%) |
| 2 Vehicles | 209 (37.6%) | 201 (33.8%) |
| 3 Vehicles | 212 (38.1%) | 246 (41.3%) |
| 4 Vehicles | 27 (4.9%) | 36 (6.0%) |
| 5 or more Vehicles | 44 (7.9%) | 38 (6.4%) |
| Total | 556 (100.0%) | 595 (100.0%) |
Commute Time in Stonewall
The most frequently occuring commute durations in Stonewall are 20 to 24 minutes (269 commuters, 23.7%), 30 to 34 minutes (234 commuters, 20.6%), and 25 to 29 minutes (185 commuters, 16.3%).
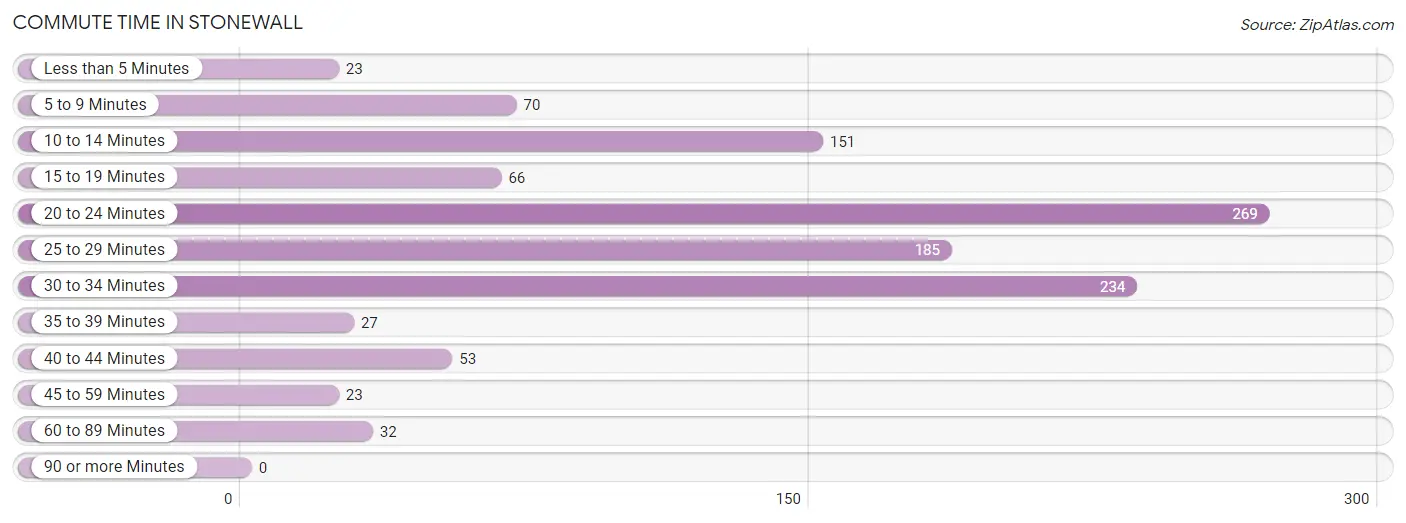
| Commute Time | # Commuters | % Commuters |
| Less than 5 Minutes | 23 | 2.0% |
| 5 to 9 Minutes | 70 | 6.2% |
| 10 to 14 Minutes | 151 | 13.3% |
| 15 to 19 Minutes | 66 | 5.8% |
| 20 to 24 Minutes | 269 | 23.7% |
| 25 to 29 Minutes | 185 | 16.3% |
| 30 to 34 Minutes | 234 | 20.6% |
| 35 to 39 Minutes | 27 | 2.4% |
| 40 to 44 Minutes | 53 | 4.7% |
| 45 to 59 Minutes | 23 | 2.0% |
| 60 to 89 Minutes | 32 | 2.8% |
| 90 or more Minutes | 0 | 0.0% |
Commute Time by Sex in Stonewall
The most common commute times in Stonewall are 20 to 24 minutes (128 commuters, 23.2%) for males and 20 to 24 minutes (141 commuters, 24.3%) for females.
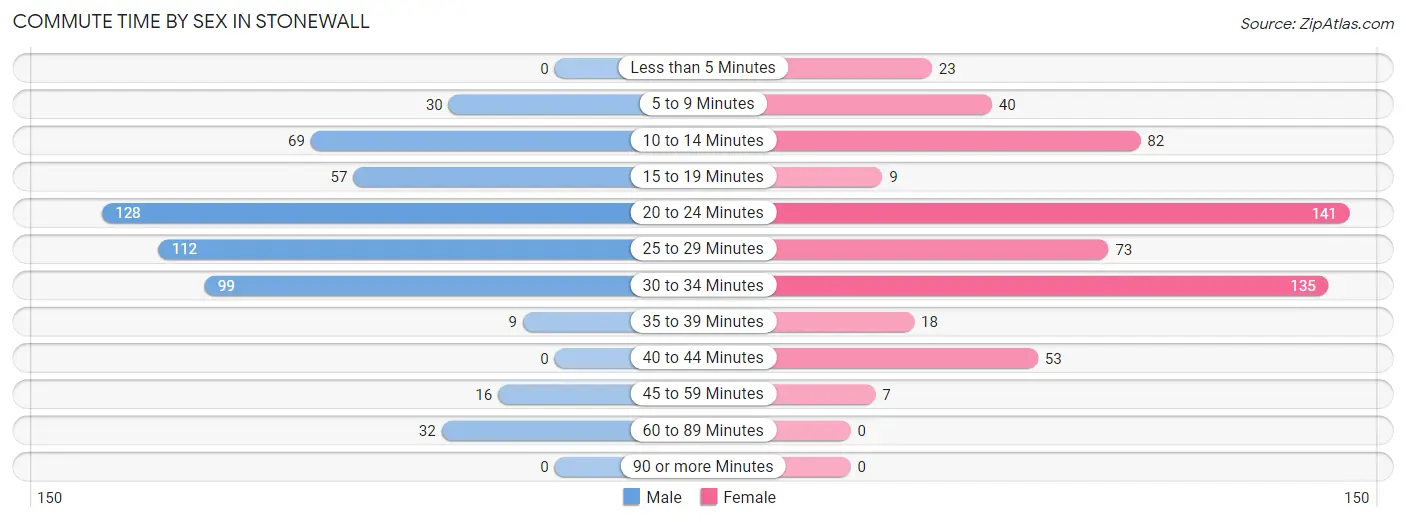
| Commute Time | Male | Female |
| Less than 5 Minutes | 0 (0.0%) | 23 (4.0%) |
| 5 to 9 Minutes | 30 (5.4%) | 40 (6.9%) |
| 10 to 14 Minutes | 69 (12.5%) | 82 (14.1%) |
| 15 to 19 Minutes | 57 (10.3%) | 9 (1.5%) |
| 20 to 24 Minutes | 128 (23.2%) | 141 (24.3%) |
| 25 to 29 Minutes | 112 (20.3%) | 73 (12.6%) |
| 30 to 34 Minutes | 99 (17.9%) | 135 (23.2%) |
| 35 to 39 Minutes | 9 (1.6%) | 18 (3.1%) |
| 40 to 44 Minutes | 0 (0.0%) | 53 (9.1%) |
| 45 to 59 Minutes | 16 (2.9%) | 7 (1.2%) |
| 60 to 89 Minutes | 32 (5.8%) | 0 (0.0%) |
| 90 or more Minutes | 0 (0.0%) | 0 (0.0%) |
Time of Departure to Work by Sex in Stonewall
The most frequent times of departure to work in Stonewall are 7:00 AM to 7:29 AM (100, 18.1%) for males and 7:30 AM to 7:59 AM (139, 23.9%) for females.
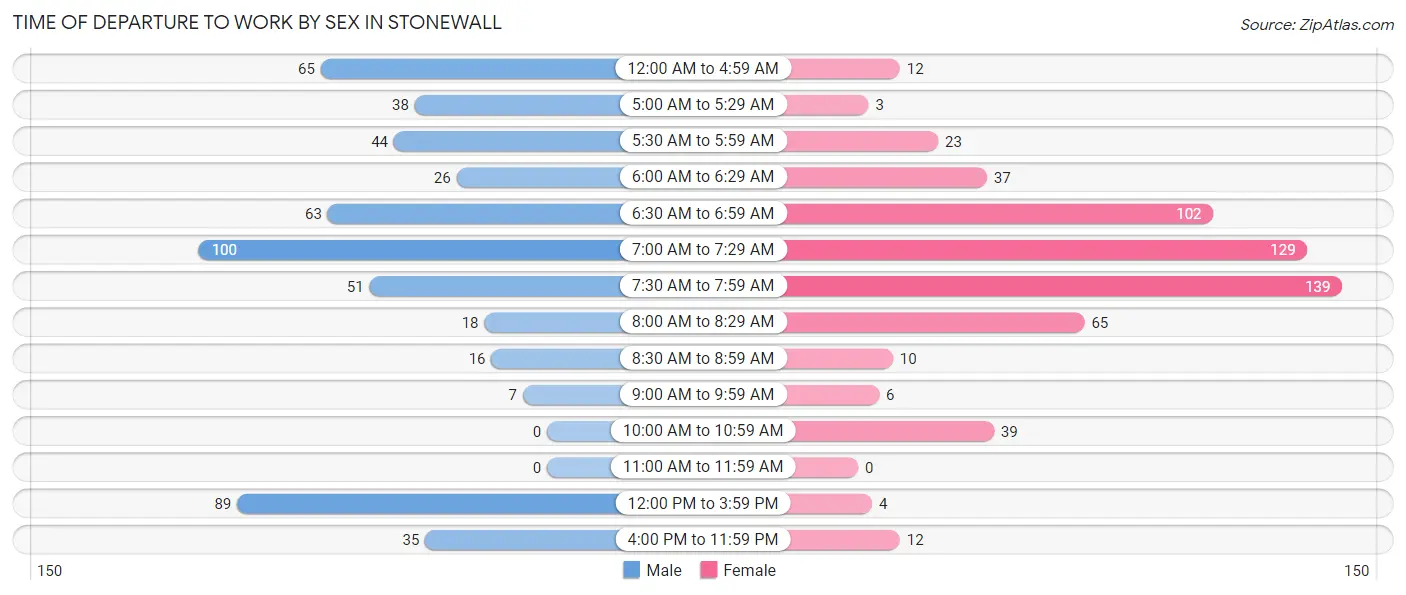
| Time of Departure | Male | Female |
| 12:00 AM to 4:59 AM | 65 (11.8%) | 12 (2.1%) |
| 5:00 AM to 5:29 AM | 38 (6.9%) | 3 (0.5%) |
| 5:30 AM to 5:59 AM | 44 (8.0%) | 23 (4.0%) |
| 6:00 AM to 6:29 AM | 26 (4.7%) | 37 (6.4%) |
| 6:30 AM to 6:59 AM | 63 (11.4%) | 102 (17.6%) |
| 7:00 AM to 7:29 AM | 100 (18.1%) | 129 (22.2%) |
| 7:30 AM to 7:59 AM | 51 (9.2%) | 139 (23.9%) |
| 8:00 AM to 8:29 AM | 18 (3.3%) | 65 (11.2%) |
| 8:30 AM to 8:59 AM | 16 (2.9%) | 10 (1.7%) |
| 9:00 AM to 9:59 AM | 7 (1.3%) | 6 (1.0%) |
| 10:00 AM to 10:59 AM | 0 (0.0%) | 39 (6.7%) |
| 11:00 AM to 11:59 AM | 0 (0.0%) | 0 (0.0%) |
| 12:00 PM to 3:59 PM | 89 (16.1%) | 4 (0.7%) |
| 4:00 PM to 11:59 PM | 35 (6.3%) | 12 (2.1%) |
| Total | 552 (100.0%) | 581 (100.0%) |
Housing Occupancy in Stonewall
Occupancy by Ownership in Stonewall
Of the total 930 dwellings in Stonewall, owner-occupied units account for 798 (85.8%), while renter-occupied units make up 132 (14.2%).
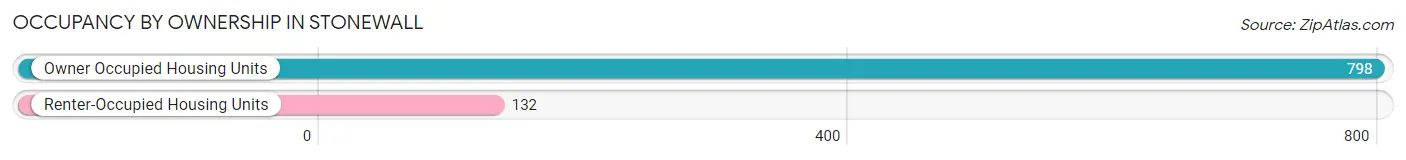
| Occupancy | # Housing Units | % Housing Units |
| Owner Occupied Housing Units | 798 | 85.8% |
| Renter-Occupied Housing Units | 132 | 14.2% |
| Total Occupied Housing Units | 930 | 100.0% |
Occupancy by Household Size in Stonewall
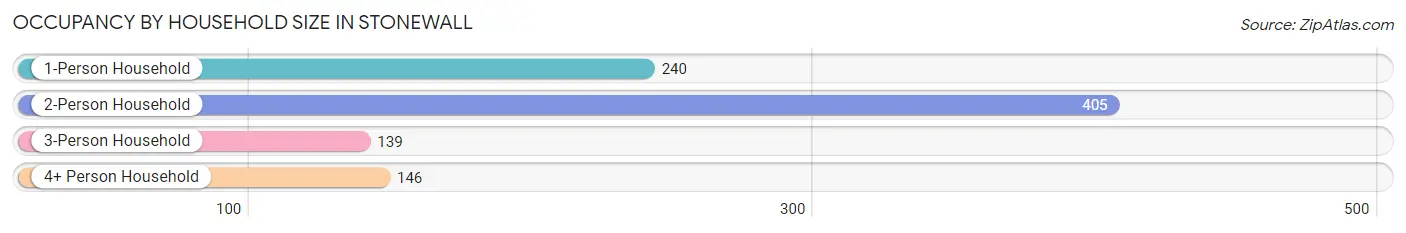
| Household Size | # Housing Units | % Housing Units |
| 1-Person Household | 240 | 25.8% |
| 2-Person Household | 405 | 43.5% |
| 3-Person Household | 139 | 14.9% |
| 4+ Person Household | 146 | 15.7% |
| Total Housing Units | 930 | 100.0% |
Occupancy by Ownership by Household Size in Stonewall
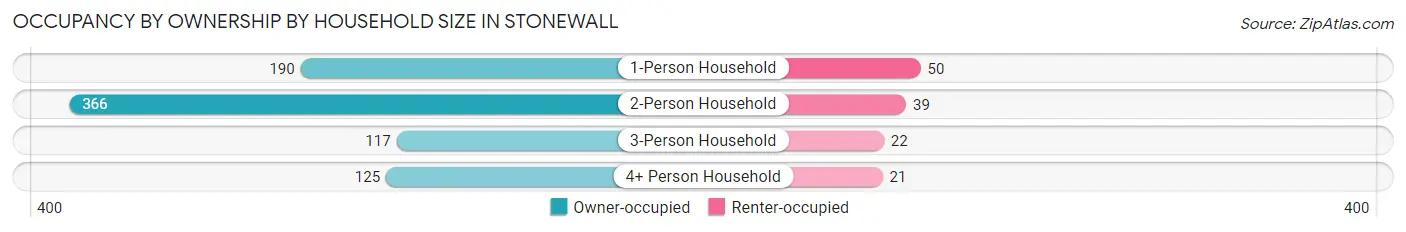
| Household Size | Owner-occupied | Renter-occupied |
| 1-Person Household | 190 (79.2%) | 50 (20.8%) |
| 2-Person Household | 366 (90.4%) | 39 (9.6%) |
| 3-Person Household | 117 (84.2%) | 22 (15.8%) |
| 4+ Person Household | 125 (85.6%) | 21 (14.4%) |
| Total Housing Units | 798 (85.8%) | 132 (14.2%) |
Occupancy by Educational Attainment in Stonewall
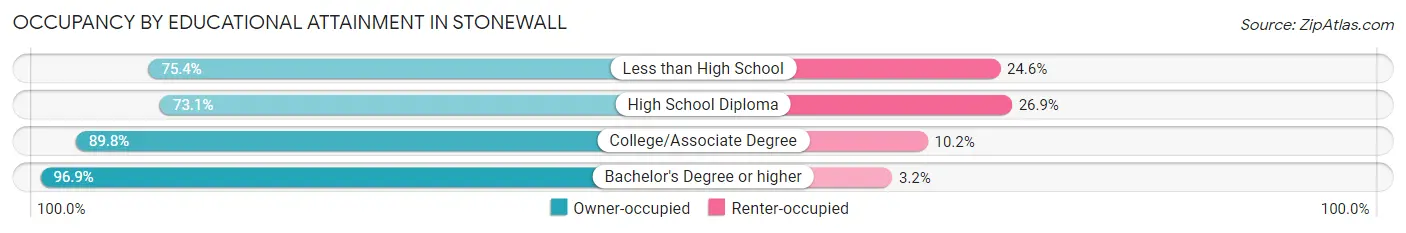
| Household Size | Owner-occupied | Renter-occupied |
| Less than High School | 43 (75.4%) | 14 (24.6%) |
| High School Diploma | 196 (73.1%) | 72 (26.9%) |
| College/Associate Degree | 344 (89.8%) | 39 (10.2%) |
| Bachelor's Degree or higher | 215 (96.9%) | 7 (3.2%) |
Occupancy by Age of Householder in Stonewall
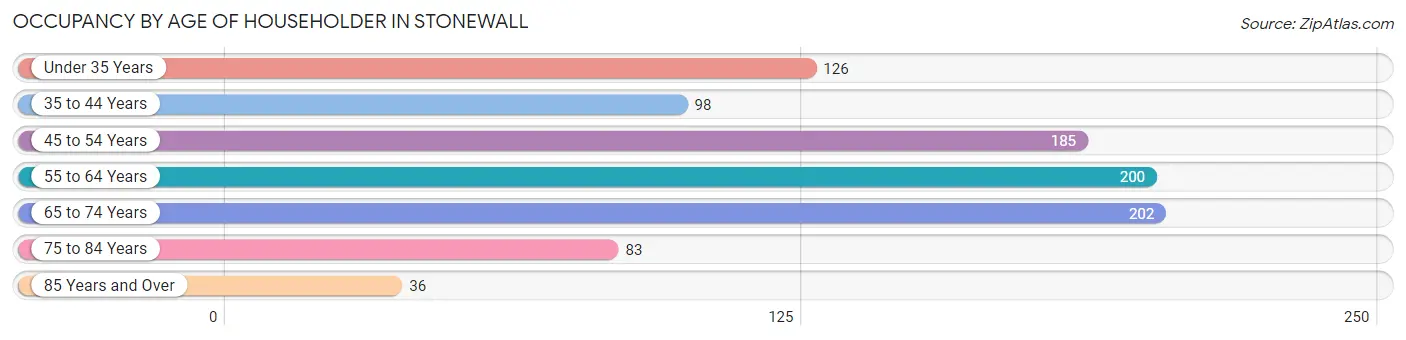
| Age Bracket | # Households | % Households |
| Under 35 Years | 126 | 13.6% |
| 35 to 44 Years | 98 | 10.5% |
| 45 to 54 Years | 185 | 19.9% |
| 55 to 64 Years | 200 | 21.5% |
| 65 to 74 Years | 202 | 21.7% |
| 75 to 84 Years | 83 | 8.9% |
| 85 Years and Over | 36 | 3.9% |
| Total | 930 | 100.0% |
Housing Finances in Stonewall
Median Income by Occupancy in Stonewall
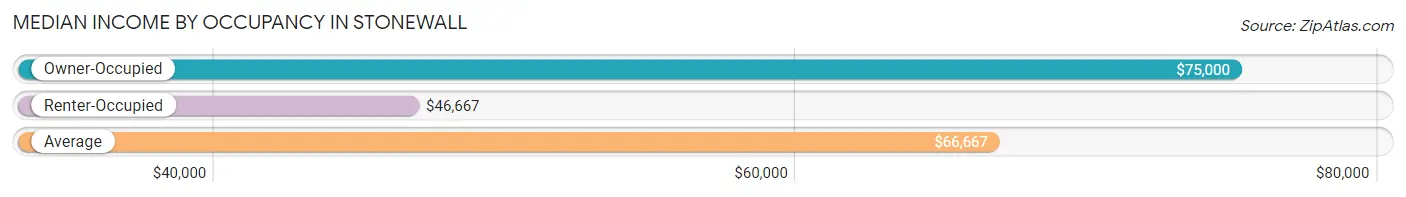
| Occupancy Type | # Households | Median Income |
| Owner-Occupied | 798 (85.8%) | $75,000 |
| Renter-Occupied | 132 (14.2%) | $46,667 |
| Average | 930 (100.0%) | $66,667 |
Occupancy by Householder Income Bracket in Stonewall
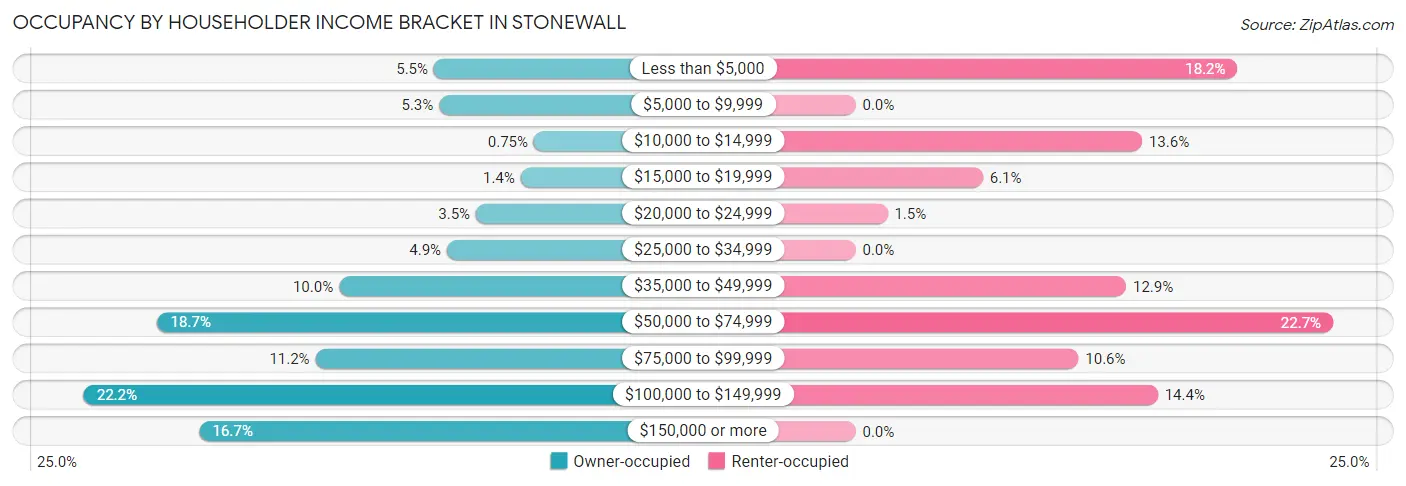
| Income Bracket | Owner-occupied | Renter-occupied |
| Less than $5,000 | 44 (5.5%) | 24 (18.2%) |
| $5,000 to $9,999 | 42 (5.3%) | 0 (0.0%) |
| $10,000 to $14,999 | 6 (0.7%) | 18 (13.6%) |
| $15,000 to $19,999 | 11 (1.4%) | 8 (6.1%) |
| $20,000 to $24,999 | 28 (3.5%) | 2 (1.5%) |
| $25,000 to $34,999 | 39 (4.9%) | 0 (0.0%) |
| $35,000 to $49,999 | 80 (10.0%) | 17 (12.9%) |
| $50,000 to $74,999 | 149 (18.7%) | 30 (22.7%) |
| $75,000 to $99,999 | 89 (11.2%) | 14 (10.6%) |
| $100,000 to $149,999 | 177 (22.2%) | 19 (14.4%) |
| $150,000 or more | 133 (16.7%) | 0 (0.0%) |
| Total | 798 (100.0%) | 132 (100.0%) |
Monthly Housing Cost Tiers in Stonewall
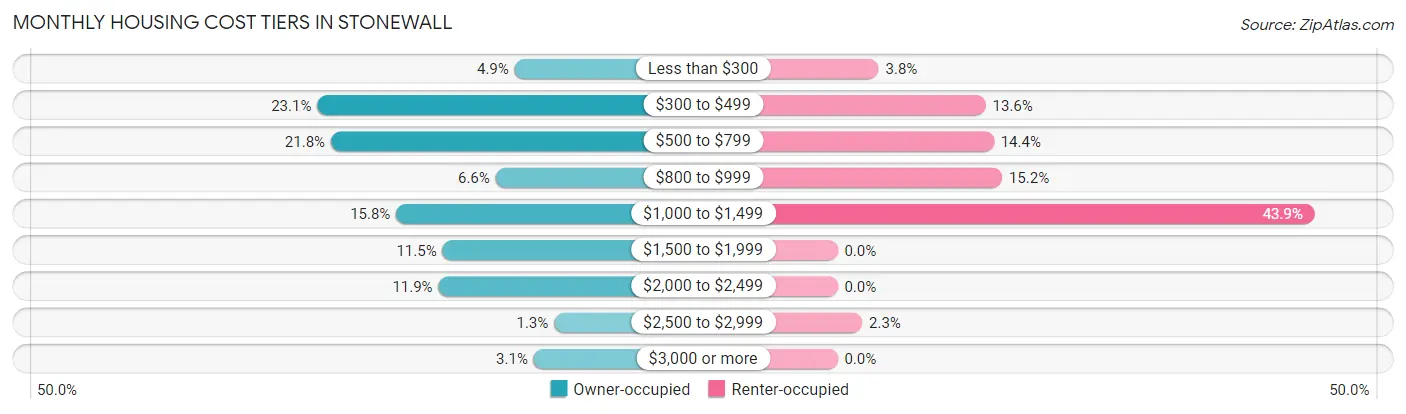
| Monthly Cost | Owner-occupied | Renter-occupied |
| Less than $300 | 39 (4.9%) | 5 (3.8%) |
| $300 to $499 | 184 (23.1%) | 18 (13.6%) |
| $500 to $799 | 174 (21.8%) | 19 (14.4%) |
| $800 to $999 | 53 (6.6%) | 20 (15.1%) |
| $1,000 to $1,499 | 126 (15.8%) | 58 (43.9%) |
| $1,500 to $1,999 | 92 (11.5%) | 0 (0.0%) |
| $2,000 to $2,499 | 95 (11.9%) | 0 (0.0%) |
| $2,500 to $2,999 | 10 (1.3%) | 3 (2.3%) |
| $3,000 or more | 25 (3.1%) | 0 (0.0%) |
| Total | 798 (100.0%) | 132 (100.0%) |
Physical Housing Characteristics in Stonewall
Housing Structures in Stonewall
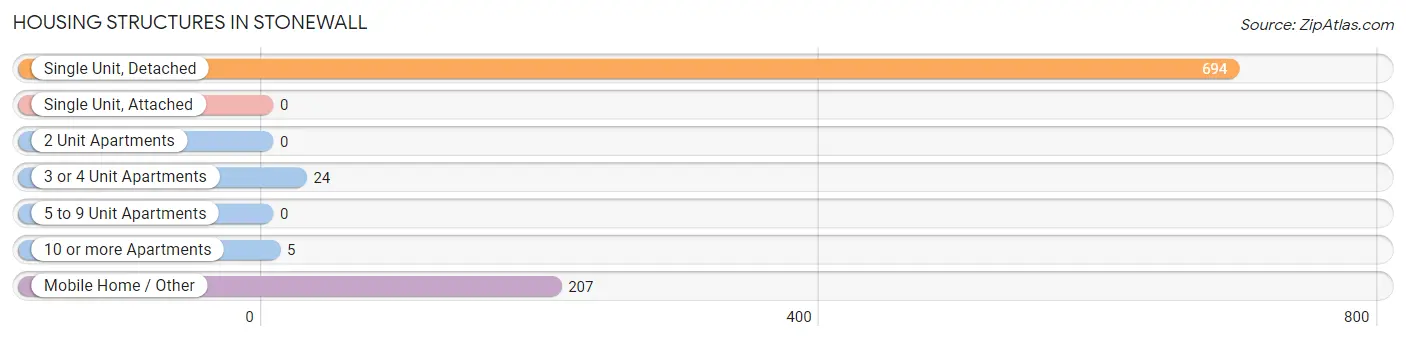
| Structure Type | # Housing Units | % Housing Units |
| Single Unit, Detached | 694 | 74.6% |
| Single Unit, Attached | 0 | 0.0% |
| 2 Unit Apartments | 0 | 0.0% |
| 3 or 4 Unit Apartments | 24 | 2.6% |
| 5 to 9 Unit Apartments | 0 | 0.0% |
| 10 or more Apartments | 5 | 0.5% |
| Mobile Home / Other | 207 | 22.3% |
| Total | 930 | 100.0% |
Housing Structures by Occupancy in Stonewall
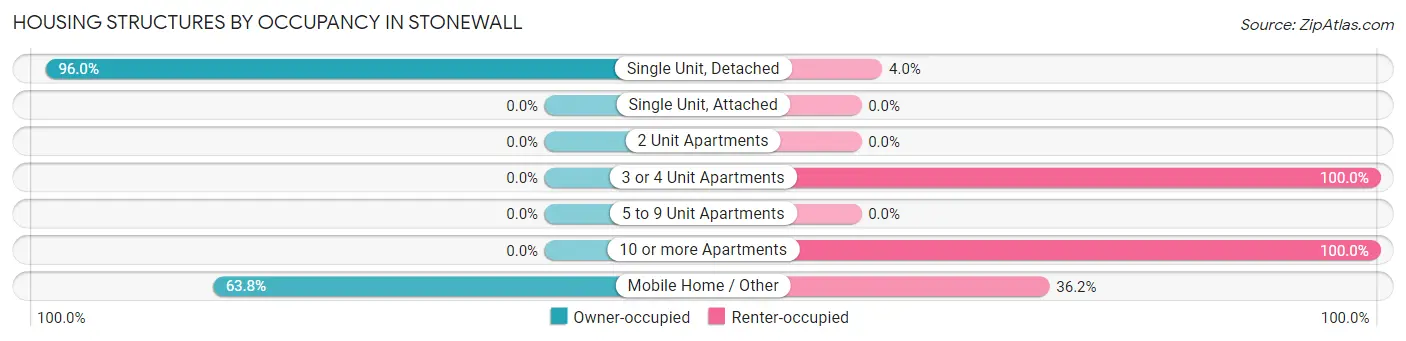
| Structure Type | Owner-occupied | Renter-occupied |
| Single Unit, Detached | 666 (96.0%) | 28 (4.0%) |
| Single Unit, Attached | 0 (0.0%) | 0 (0.0%) |
| 2 Unit Apartments | 0 (0.0%) | 0 (0.0%) |
| 3 or 4 Unit Apartments | 0 (0.0%) | 24 (100.0%) |
| 5 to 9 Unit Apartments | 0 (0.0%) | 0 (0.0%) |
| 10 or more Apartments | 0 (0.0%) | 5 (100.0%) |
| Mobile Home / Other | 132 (63.8%) | 75 (36.2%) |
| Total | 798 (85.8%) | 132 (14.2%) |
Housing Structures by Number of Rooms in Stonewall
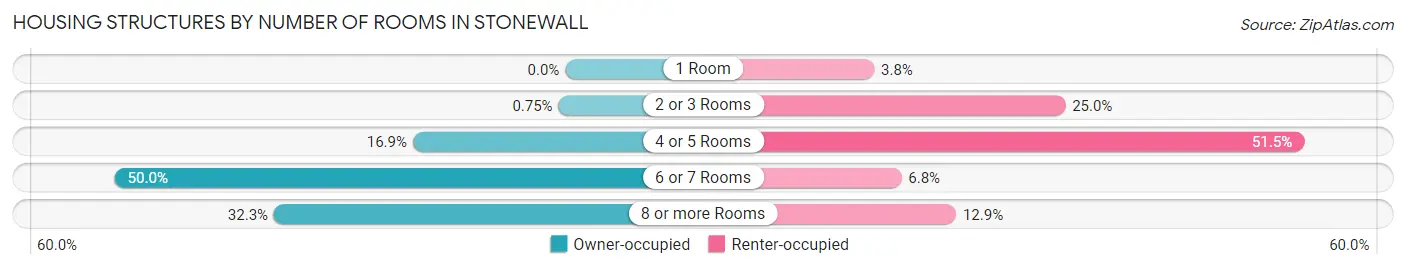
| Number of Rooms | Owner-occupied | Renter-occupied |
| 1 Room | 0 (0.0%) | 5 (3.8%) |
| 2 or 3 Rooms | 6 (0.7%) | 33 (25.0%) |
| 4 or 5 Rooms | 135 (16.9%) | 68 (51.5%) |
| 6 or 7 Rooms | 399 (50.0%) | 9 (6.8%) |
| 8 or more Rooms | 258 (32.3%) | 17 (12.9%) |
| Total | 798 (100.0%) | 132 (100.0%) |
Housing Structure by Heating Type in Stonewall
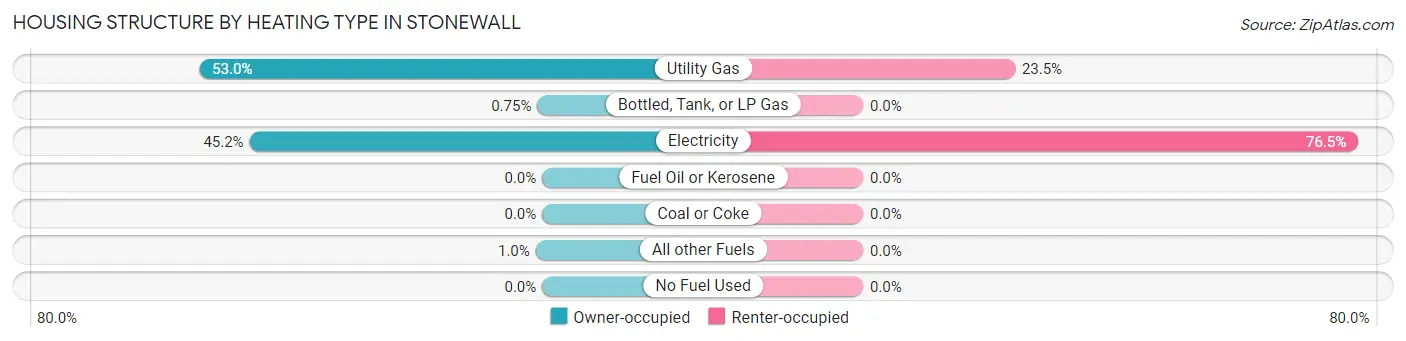
| Heating Type | Owner-occupied | Renter-occupied |
| Utility Gas | 423 (53.0%) | 31 (23.5%) |
| Bottled, Tank, or LP Gas | 6 (0.7%) | 0 (0.0%) |
| Electricity | 361 (45.2%) | 101 (76.5%) |
| Fuel Oil or Kerosene | 0 (0.0%) | 0 (0.0%) |
| Coal or Coke | 0 (0.0%) | 0 (0.0%) |
| All other Fuels | 8 (1.0%) | 0 (0.0%) |
| No Fuel Used | 0 (0.0%) | 0 (0.0%) |
| Total | 798 (100.0%) | 132 (100.0%) |
Household Vehicle Usage in Stonewall
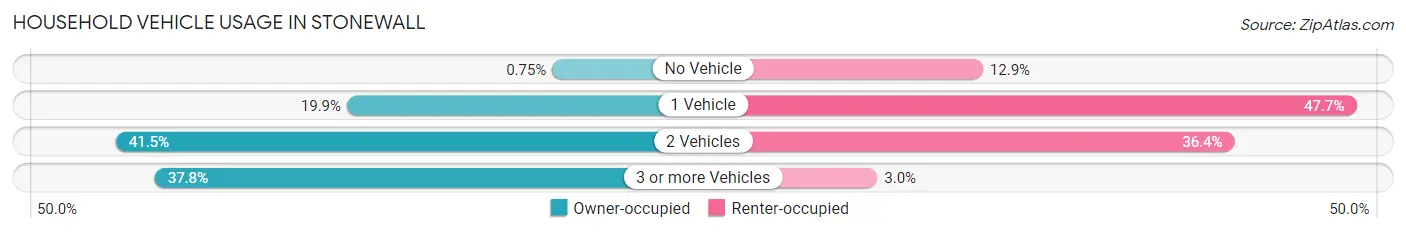
| Vehicles per Household | Owner-occupied | Renter-occupied |
| No Vehicle | 6 (0.7%) | 17 (12.9%) |
| 1 Vehicle | 159 (19.9%) | 63 (47.7%) |
| 2 Vehicles | 331 (41.5%) | 48 (36.4%) |
| 3 or more Vehicles | 302 (37.8%) | 4 (3.0%) |
| Total | 798 (100.0%) | 132 (100.0%) |
Real Estate & Mortgages in Stonewall
Real Estate and Mortgage Overview in Stonewall
| Characteristic | Without Mortgage | With Mortgage |
| Housing Units | 361 | 437 |
| Median Property Value | $209,200 | $260,000 |
| Median Household Income | $50,219 | $98 |
| Monthly Housing Costs | $452 | $25 |
| Real Estate Taxes | $900 | $77 |
Property Value by Mortgage Status in Stonewall
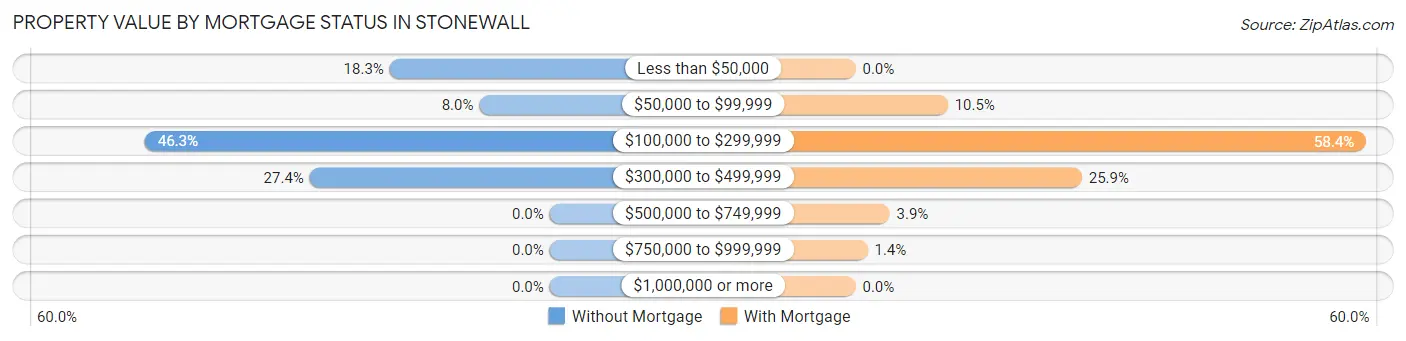
| Property Value | Without Mortgage | With Mortgage |
| Less than $50,000 | 66 (18.3%) | 0 (0.0%) |
| $50,000 to $99,999 | 29 (8.0%) | 46 (10.5%) |
| $100,000 to $299,999 | 167 (46.3%) | 255 (58.4%) |
| $300,000 to $499,999 | 99 (27.4%) | 113 (25.9%) |
| $500,000 to $749,999 | 0 (0.0%) | 17 (3.9%) |
| $750,000 to $999,999 | 0 (0.0%) | 6 (1.4%) |
| $1,000,000 or more | 0 (0.0%) | 0 (0.0%) |
| Total | 361 (100.0%) | 437 (100.0%) |
Household Income by Mortgage Status in Stonewall
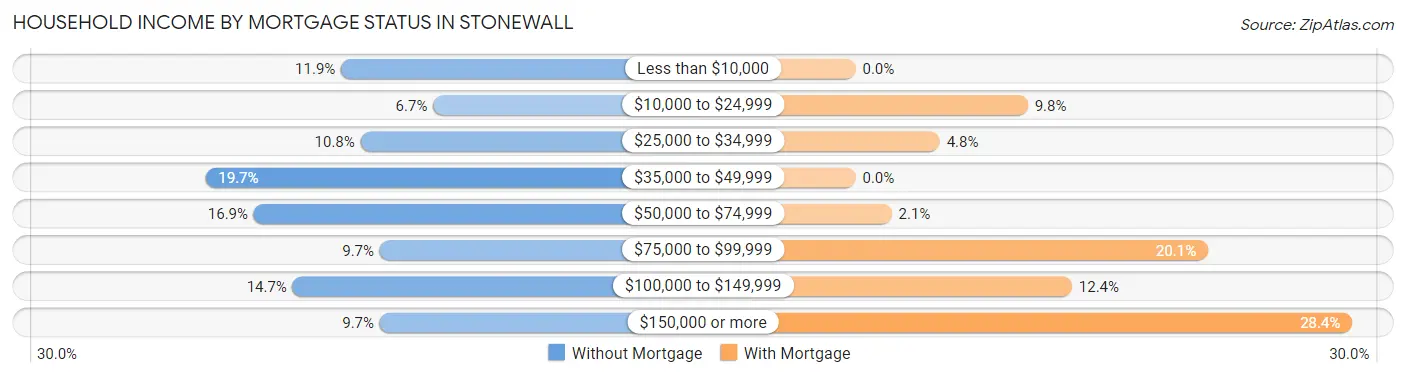
| Household Income | Without Mortgage | With Mortgage |
| Less than $10,000 | 43 (11.9%) | 0 (0.0%) |
| $10,000 to $24,999 | 24 (6.7%) | 43 (9.8%) |
| $25,000 to $34,999 | 39 (10.8%) | 21 (4.8%) |
| $35,000 to $49,999 | 71 (19.7%) | 0 (0.0%) |
| $50,000 to $74,999 | 61 (16.9%) | 9 (2.1%) |
| $75,000 to $99,999 | 35 (9.7%) | 88 (20.1%) |
| $100,000 to $149,999 | 53 (14.7%) | 54 (12.4%) |
| $150,000 or more | 35 (9.7%) | 124 (28.4%) |
| Total | 361 (100.0%) | 437 (100.0%) |
Property Value to Household Income Ratio in Stonewall
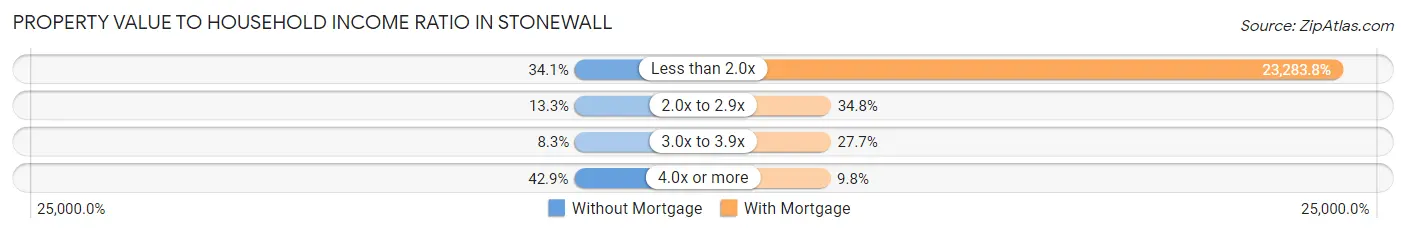
| Value-to-Income Ratio | Without Mortgage | With Mortgage |
| Less than 2.0x | 123 (34.1%) | 101,750 (23,283.8%) |
| 2.0x to 2.9x | 48 (13.3%) | 152 (34.8%) |
| 3.0x to 3.9x | 30 (8.3%) | 121 (27.7%) |
| 4.0x or more | 155 (42.9%) | 43 (9.8%) |
| Total | 361 (100.0%) | 437 (100.0%) |
Real Estate Taxes by Mortgage Status in Stonewall
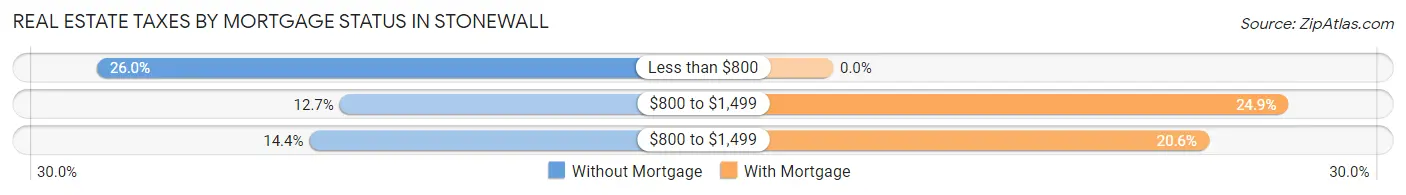
| Property Taxes | Without Mortgage | With Mortgage |
| Less than $800 | 94 (26.0%) | 0 (0.0%) |
| $800 to $1,499 | 46 (12.7%) | 109 (24.9%) |
| $800 to $1,499 | 52 (14.4%) | 90 (20.6%) |
| Total | 361 (100.0%) | 437 (100.0%) |
Health & Disability in Stonewall
Health Insurance Coverage by Age in Stonewall
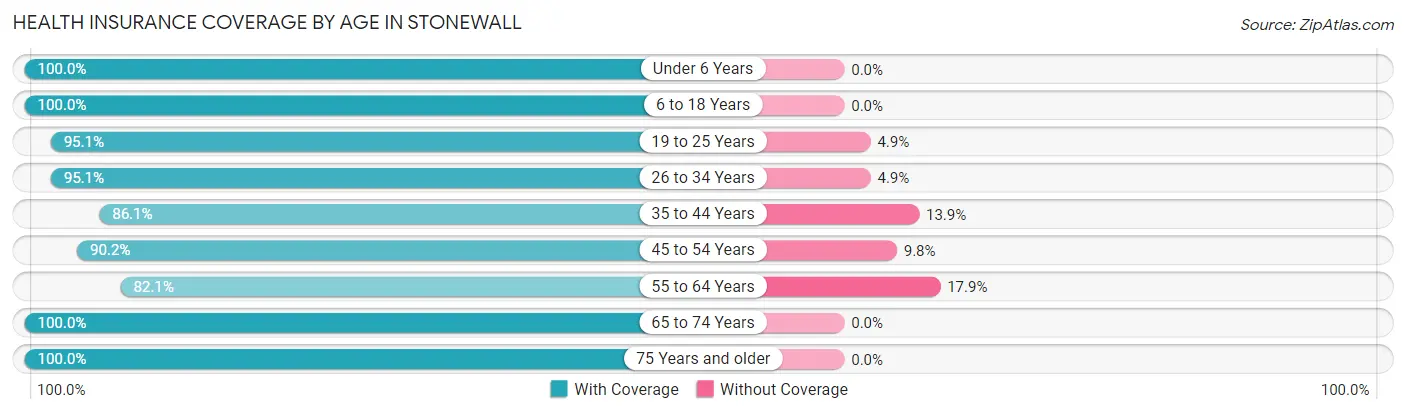
| Age Bracket | With Coverage | Without Coverage |
| Under 6 Years | 139 (100.0%) | 0 (0.0%) |
| 6 to 18 Years | 328 (100.0%) | 0 (0.0%) |
| 19 to 25 Years | 117 (95.1%) | 6 (4.9%) |
| 26 to 34 Years | 253 (95.1%) | 13 (4.9%) |
| 35 to 44 Years | 216 (86.1%) | 35 (13.9%) |
| 45 to 54 Years | 304 (90.2%) | 33 (9.8%) |
| 55 to 64 Years | 335 (82.1%) | 73 (17.9%) |
| 65 to 74 Years | 292 (100.0%) | 0 (0.0%) |
| 75 Years and older | 172 (100.0%) | 0 (0.0%) |
| Total | 2,156 (93.1%) | 160 (6.9%) |
Health Insurance Coverage by Citizenship Status in Stonewall
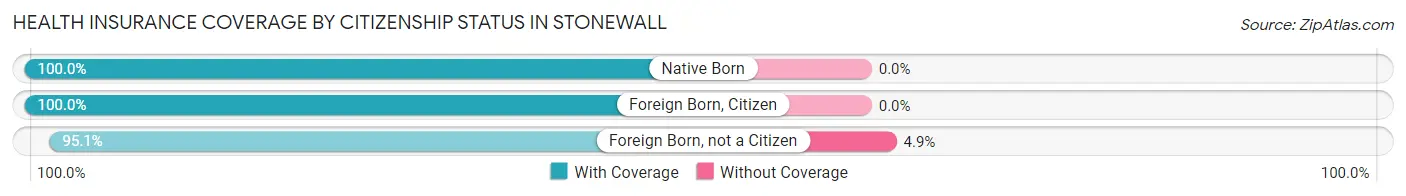
| Citizenship Status | With Coverage | Without Coverage |
| Native Born | 139 (100.0%) | 0 (0.0%) |
| Foreign Born, Citizen | 328 (100.0%) | 0 (0.0%) |
| Foreign Born, not a Citizen | 117 (95.1%) | 6 (4.9%) |
Health Insurance Coverage by Household Income in Stonewall
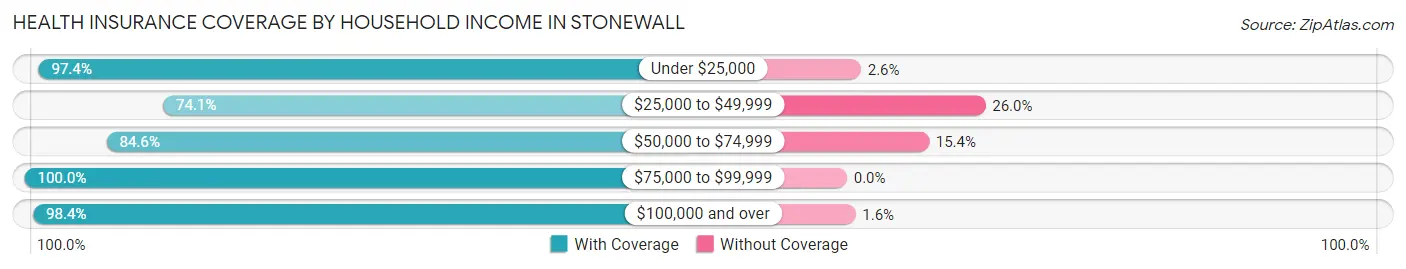
| Household Income | With Coverage | Without Coverage |
| Under $25,000 | 223 (97.4%) | 6 (2.6%) |
| $25,000 to $49,999 | 234 (74.1%) | 82 (26.0%) |
| $50,000 to $74,999 | 292 (84.6%) | 53 (15.4%) |
| $75,000 to $99,999 | 247 (100.0%) | 0 (0.0%) |
| $100,000 and over | 1,160 (98.4%) | 19 (1.6%) |
Public vs Private Health Insurance Coverage by Age in Stonewall
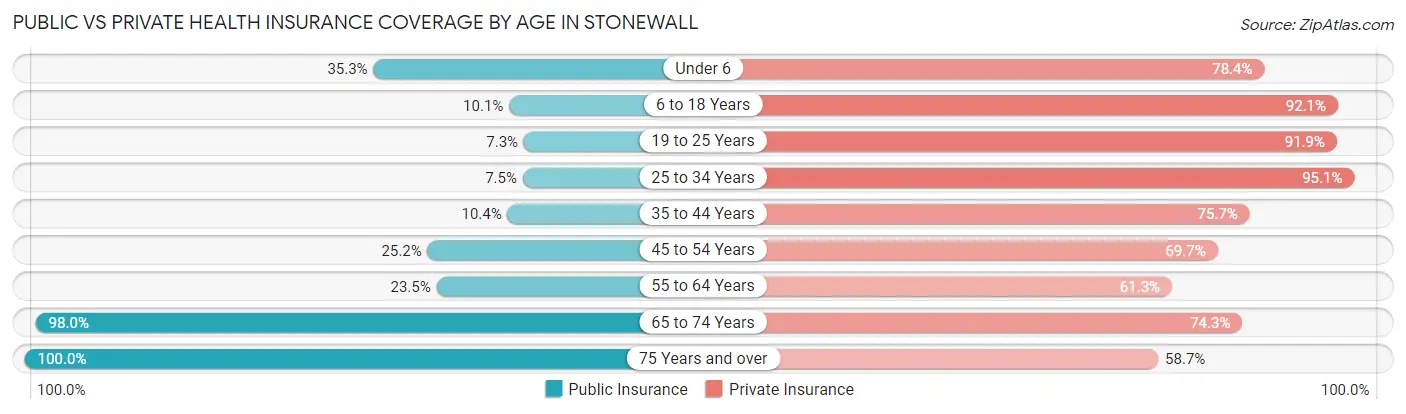
| Age Bracket | Public Insurance | Private Insurance |
| Under 6 | 49 (35.2%) | 109 (78.4%) |
| 6 to 18 Years | 33 (10.1%) | 302 (92.1%) |
| 19 to 25 Years | 9 (7.3%) | 113 (91.9%) |
| 25 to 34 Years | 20 (7.5%) | 253 (95.1%) |
| 35 to 44 Years | 26 (10.4%) | 190 (75.7%) |
| 45 to 54 Years | 85 (25.2%) | 235 (69.7%) |
| 55 to 64 Years | 96 (23.5%) | 250 (61.3%) |
| 65 to 74 Years | 286 (98.0%) | 217 (74.3%) |
| 75 Years and over | 172 (100.0%) | 101 (58.7%) |
| Total | 776 (33.5%) | 1,770 (76.4%) |
Disability Status by Sex by Age in Stonewall
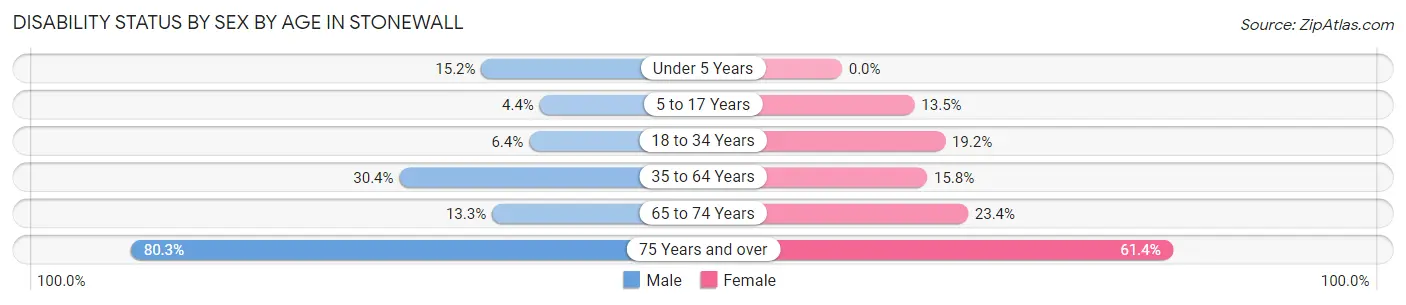
| Age Bracket | Male | Female |
| Under 5 Years | 14 (15.2%) | 0 (0.0%) |
| 5 to 17 Years | 9 (4.4%) | 19 (13.5%) |
| 18 to 34 Years | 13 (6.4%) | 36 (19.2%) |
| 35 to 64 Years | 130 (30.4%) | 90 (15.8%) |
| 65 to 74 Years | 20 (13.3%) | 33 (23.4%) |
| 75 Years and over | 57 (80.3%) | 62 (61.4%) |
Disability Class by Sex by Age in Stonewall
Disability Class: Hearing Difficulty
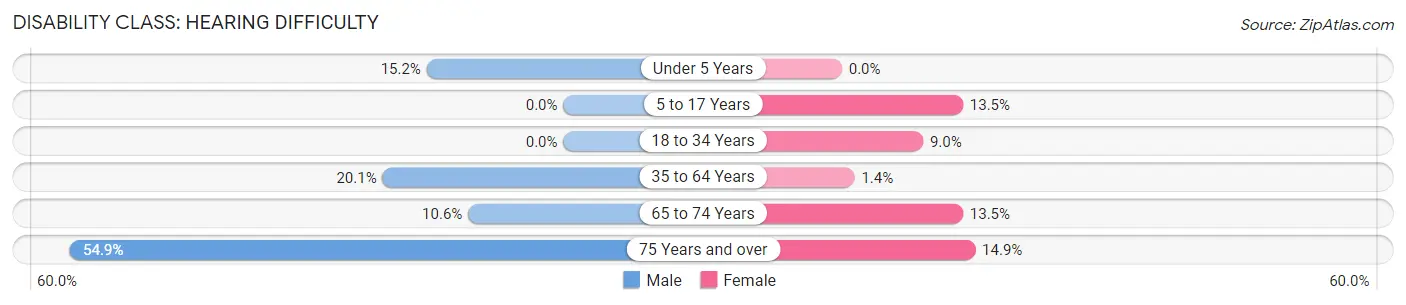
| Age Bracket | Male | Female |
| Under 5 Years | 14 (15.2%) | 0 (0.0%) |
| 5 to 17 Years | 0 (0.0%) | 19 (13.5%) |
| 18 to 34 Years | 0 (0.0%) | 17 (9.0%) |
| 35 to 64 Years | 86 (20.1%) | 8 (1.4%) |
| 65 to 74 Years | 16 (10.6%) | 19 (13.5%) |
| 75 Years and over | 39 (54.9%) | 15 (14.8%) |
Disability Class: Vision Difficulty
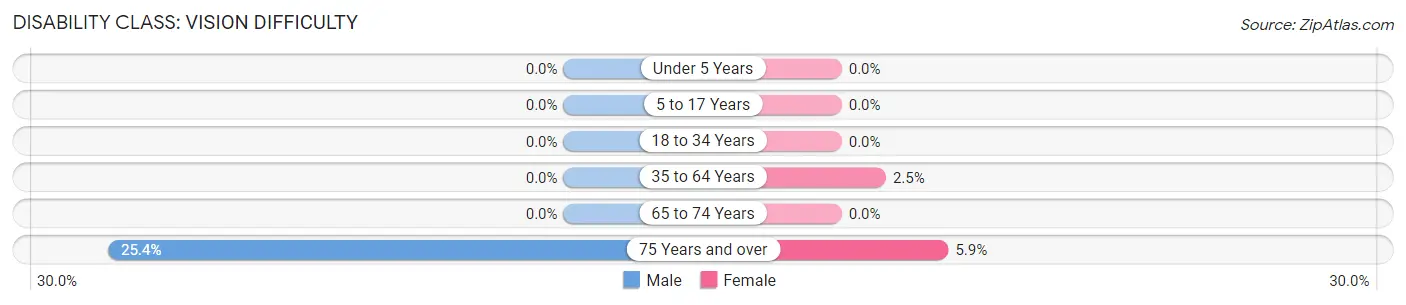
| Age Bracket | Male | Female |
| Under 5 Years | 0 (0.0%) | 0 (0.0%) |
| 5 to 17 Years | 0 (0.0%) | 0 (0.0%) |
| 18 to 34 Years | 0 (0.0%) | 0 (0.0%) |
| 35 to 64 Years | 0 (0.0%) | 14 (2.5%) |
| 65 to 74 Years | 0 (0.0%) | 0 (0.0%) |
| 75 Years and over | 18 (25.4%) | 6 (5.9%) |
Disability Class: Cognitive Difficulty
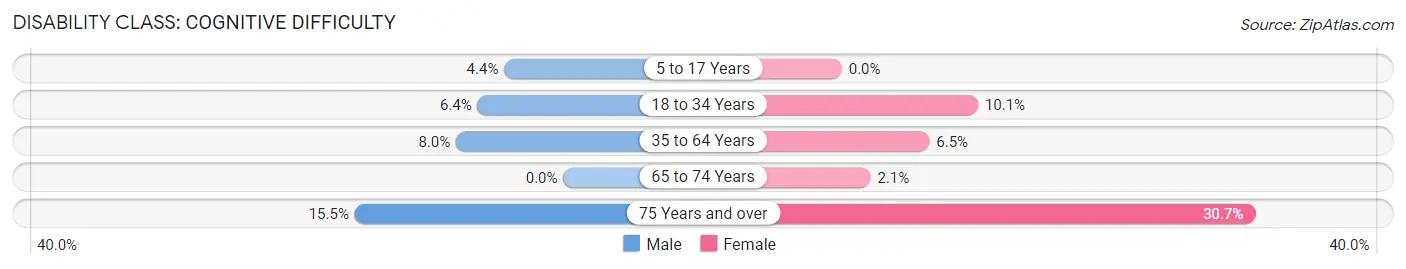
| Age Bracket | Male | Female |
| 5 to 17 Years | 9 (4.4%) | 0 (0.0%) |
| 18 to 34 Years | 13 (6.4%) | 19 (10.1%) |
| 35 to 64 Years | 34 (8.0%) | 37 (6.5%) |
| 65 to 74 Years | 0 (0.0%) | 3 (2.1%) |
| 75 Years and over | 11 (15.5%) | 31 (30.7%) |
Disability Class: Ambulatory Difficulty
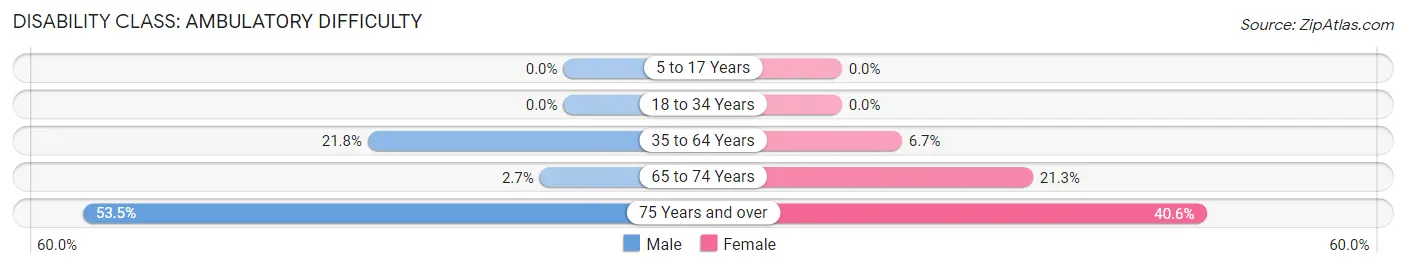
| Age Bracket | Male | Female |
| 5 to 17 Years | 0 (0.0%) | 0 (0.0%) |
| 18 to 34 Years | 0 (0.0%) | 0 (0.0%) |
| 35 to 64 Years | 93 (21.8%) | 38 (6.7%) |
| 65 to 74 Years | 4 (2.6%) | 30 (21.3%) |
| 75 Years and over | 38 (53.5%) | 41 (40.6%) |
Disability Class: Self-Care Difficulty
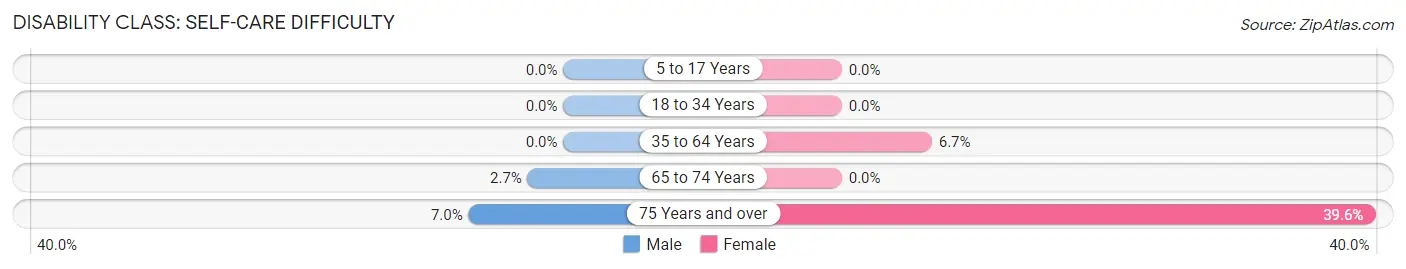
| Age Bracket | Male | Female |
| 5 to 17 Years | 0 (0.0%) | 0 (0.0%) |
| 18 to 34 Years | 0 (0.0%) | 0 (0.0%) |
| 35 to 64 Years | 0 (0.0%) | 38 (6.7%) |
| 65 to 74 Years | 4 (2.6%) | 0 (0.0%) |
| 75 Years and over | 5 (7.0%) | 40 (39.6%) |
Technology Access in Stonewall
Computing Device Access in Stonewall
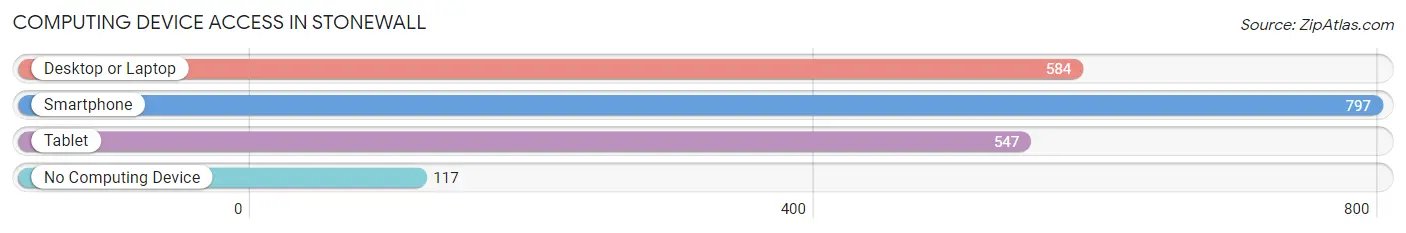
| Device Type | # Households | % Households |
| Desktop or Laptop | 584 | 62.8% |
| Smartphone | 797 | 85.7% |
| Tablet | 547 | 58.8% |
| No Computing Device | 117 | 12.6% |
| Total | 930 | 100.0% |
Internet Access in Stonewall
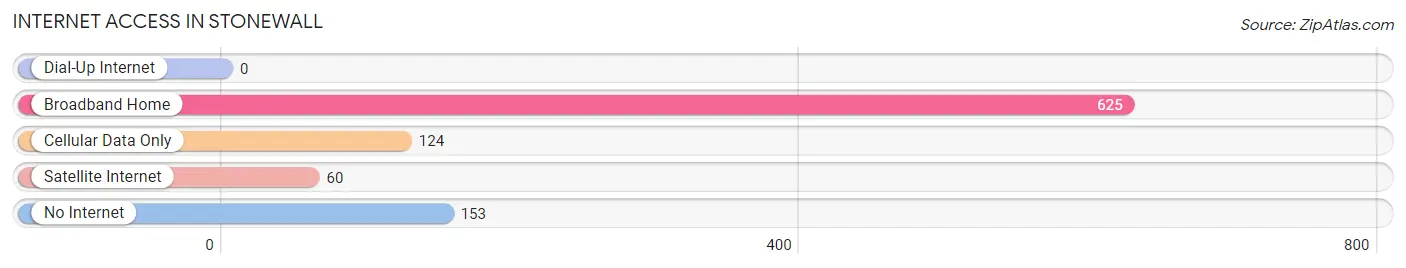
| Internet Type | # Households | % Households |
| Dial-Up Internet | 0 | 0.0% |
| Broadband Home | 625 | 67.2% |
| Cellular Data Only | 124 | 13.3% |
| Satellite Internet | 60 | 6.5% |
| No Internet | 153 | 16.5% |
| Total | 930 | 100.0% |
Stonewall Summary
Stonewall, Louisiana is a small town located in the northern part of the state, in DeSoto Parish. It is situated on the banks of the Red River, and is home to a population of just over 1,000 people. The town was founded in 1845, and has a rich history that is deeply rooted in the culture of the area.
Geography
Stonewall is located in the northern part of DeSoto Parish, in the northwest corner of Louisiana. It is situated on the banks of the Red River, and is surrounded by rolling hills and forests. The town is located about 30 miles south of Shreveport, and is part of the Shreveport-Bossier City metropolitan area. The town is located at an elevation of about 200 feet above sea level.
Economy
Stonewall’s economy is largely based on agriculture and timber production. The town is home to several farms, and the surrounding area is known for its production of cotton, soybeans, and other crops. The town is also home to several timber companies, which harvest and process timber for use in construction and other industries.
In addition to agriculture and timber production, Stonewall is home to several small businesses, including restaurants, retail stores, and other services. The town is also home to a small manufacturing plant, which produces a variety of products.
Demographics
As of the 2010 census, the population of Stonewall was 1,068. The racial makeup of the town was 79.3% White, 17.2% African American, 0.3% Native American, 0.2% Asian, 0.1% Pacific Islander, and 2.9% from other races. The median household income was $31,250, and the median family income was $37,500.
The town is served by the DeSoto Parish School District, which includes two elementary schools, one middle school, and one high school. The town is also home to a branch of the DeSoto Parish Library.
Conclusion
Stonewall, Louisiana is a small town located in the northern part of the state, in DeSoto Parish. It is situated on the banks of the Red River, and is home to a population of just over 1,000 people. The town was founded in 1845, and has a rich history that is deeply rooted in the culture of the area. The town’s economy is largely based on agriculture and timber production, and it is also home to several small businesses. The population of Stonewall is 79.3% White, 17.2% African American, 0.3% Native American, 0.2% Asian, 0.1% Pacific Islander, and 2.9% from other races. The town is served by the DeSoto Parish School District, and is home to a branch of the DeSoto Parish Library.
Common Questions
What is Per Capita Income in Stonewall?
Per Capita income in Stonewall is $40,780.
What is the Median Family Income in Stonewall?
Median Family Income in Stonewall is $91,000.
What is the Median Household income in Stonewall?
Median Household Income in Stonewall is $66,667.
What is Income or Wage Gap in Stonewall?
Income or Wage Gap in Stonewall is 29.4%.
Women in Stonewall earn 70.6 cents for every dollar earned by a man.
What is Inequality or Gini Index in Stonewall?
Inequality or Gini Index in Stonewall is 0.50.
What is the Total Population of Stonewall?
Total Population of Stonewall is 2,334.
What is the Total Male Population of Stonewall?
Total Male Population of Stonewall is 1,159.
What is the Total Female Population of Stonewall?
Total Female Population of Stonewall is 1,175.
What is the Ratio of Males per 100 Females in Stonewall?
There are 98.64 Males per 100 Females in Stonewall.
What is the Ratio of Females per 100 Males in Stonewall?
There are 101.38 Females per 100 Males in Stonewall.
What is the Median Population Age in Stonewall?
Median Population Age in Stonewall is 47.5 Years.
What is the Average Family Size in Stonewall
Average Family Size in Stonewall is 3.0 People.
What is the Average Household Size in Stonewall
Average Household Size in Stonewall is 2.5 People.
How Large is the Labor Force in Stonewall?
There are 1,192 People in the Labor Forcein in Stonewall.
What is the Percentage of People in the Labor Force in Stonewall?
62.3% of People are in the Labor Force in Stonewall.
What is the Unemployment Rate in Stonewall?
Unemployment Rate in Stonewall is 0.8%.