Springhill, LA Map & Demographics
Springhill Map
Springhill Overview
$15,942
PER CAPITA INCOME
$38,304
AVG FAMILY INCOME
$27,868
AVG HOUSEHOLD INCOME
50.9%
WAGE / INCOME GAP [ % ]
49.1¢/ $1
WAGE / INCOME GAP [ $ ]
0.49
INEQUALITY / GINI INDEX
4,740
TOTAL POPULATION
2,197
MALE POPULATION
2,543
FEMALE POPULATION
86.39
MALES / 100 FEMALES
115.75
FEMALES / 100 MALES
46.1
MEDIAN AGE
3.0
AVG FAMILY SIZE
2.4
AVG HOUSEHOLD SIZE
1,085
LABOR FORCE [ PEOPLE ]
29.5%
PERCENT IN LABOR FORCE
10.7%
UNEMPLOYMENT RATE
Springhill Zip Codes
Springhill Area Codes
Income in Springhill
Income Overview in Springhill
Per Capita Income in Springhill is $15,942, while median incomes of families and households are $38,304 and $27,868 respectively.
| Characteristic | Number | Measure |
| Per Capita Income | 4,740 | $15,942 |
| Median Family Income | 1,265 | $38,304 |
| Mean Family Income | 1,265 | $48,519 |
| Median Household Income | 1,960 | $27,868 |
| Mean Household Income | 1,960 | $37,547 |
| Income Deficit | 1,265 | $0 |
| Wage / Income Gap (%) | 4,740 | 50.89% |
| Wage / Income Gap ($) | 4,740 | 49.11¢ per $1 |
| Gini / Inequality Index | 4,740 | 0.49 |
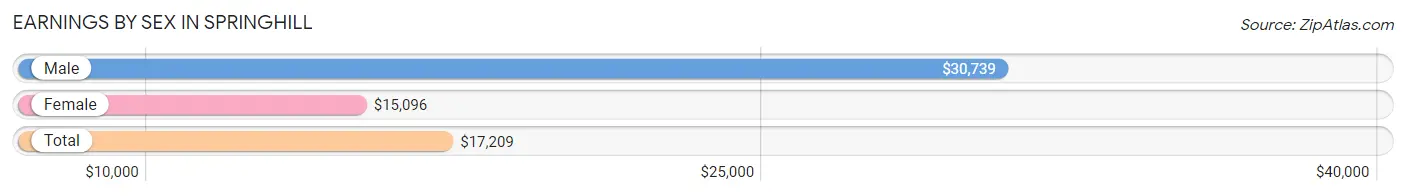
Earnings by Sex in Springhill
Average Earnings in Springhill are $17,209, $30,739 for men and $15,096 for women, a difference of 50.9%.
| Sex | Number | Average Earnings |
| Male | 494 (42.6%) | $30,739 |
| Female | 665 (57.4%) | $15,096 |
| Total | 1,159 (100.0%) | $17,209 |
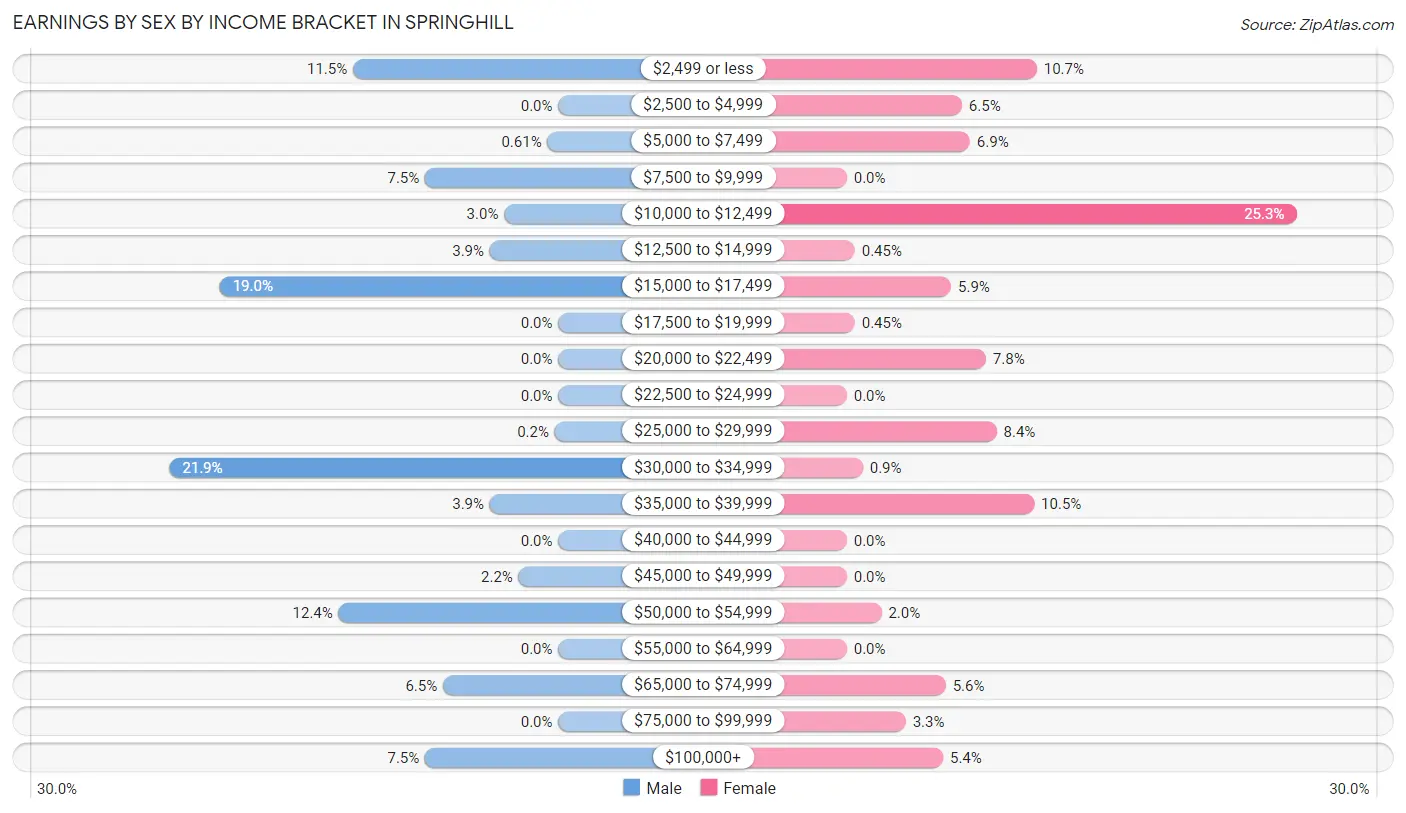
Earnings by Sex by Income Bracket in Springhill
The most common earnings brackets in Springhill are $30,000 to $34,999 for men (108 | 21.9%) and $10,000 to $12,499 for women (168 | 25.3%).
| Income | Male | Female |
| $2,499 or less | 57 (11.5%) | 71 (10.7%) |
| $2,500 to $4,999 | 0 (0.0%) | 43 (6.5%) |
| $5,000 to $7,499 | 3 (0.6%) | 46 (6.9%) |
| $7,500 to $9,999 | 37 (7.5%) | 0 (0.0%) |
| $10,000 to $12,499 | 15 (3.0%) | 168 (25.3%) |
| $12,500 to $14,999 | 19 (3.8%) | 3 (0.4%) |
| $15,000 to $17,499 | 94 (19.0%) | 39 (5.9%) |
| $17,500 to $19,999 | 0 (0.0%) | 3 (0.4%) |
| $20,000 to $22,499 | 0 (0.0%) | 52 (7.8%) |
| $22,500 to $24,999 | 0 (0.0%) | 0 (0.0%) |
| $25,000 to $29,999 | 1 (0.2%) | 56 (8.4%) |
| $30,000 to $34,999 | 108 (21.9%) | 6 (0.9%) |
| $35,000 to $39,999 | 19 (3.8%) | 70 (10.5%) |
| $40,000 to $44,999 | 0 (0.0%) | 0 (0.0%) |
| $45,000 to $49,999 | 11 (2.2%) | 0 (0.0%) |
| $50,000 to $54,999 | 61 (12.3%) | 13 (1.9%) |
| $55,000 to $64,999 | 0 (0.0%) | 0 (0.0%) |
| $65,000 to $74,999 | 32 (6.5%) | 37 (5.6%) |
| $75,000 to $99,999 | 0 (0.0%) | 22 (3.3%) |
| $100,000+ | 37 (7.5%) | 36 (5.4%) |
| Total | 494 (100.0%) | 665 (100.0%) |
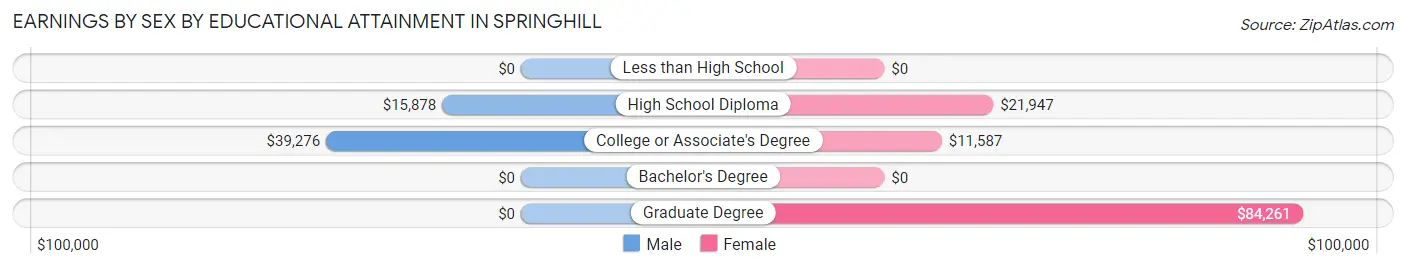
Earnings by Sex by Educational Attainment in Springhill
Average earnings in Springhill are $30,370 for men and $15,865 for women, a difference of 47.8%. Men with an educational attainment of college or associate's degree enjoy the highest average annual earnings of $39,276, while those with high school diploma education earn the least with $15,878. Women with an educational attainment of graduate degree earn the most with the average annual earnings of $84,261, while those with college or associate's degree education have the smallest earnings of $11,587.
| Educational Attainment | Male Income | Female Income |
| Less than High School | - | - |
| High School Diploma | $15,878 | $21,947 |
| College or Associate's Degree | $39,276 | $11,587 |
| Bachelor's Degree | - | - |
| Graduate Degree | - | - |
| Total | $30,370 | $15,865 |
Family Income in Springhill
Family Income Brackets in Springhill
According to the Springhill family income data, there are 382 families falling into the $35,000 to $49,999 income range, which is the most common income bracket and makes up 30.2% of all families. Conversely, the $75,000 to $99,999 income bracket is the least frequent group with only 23 families (1.8%) belonging to this category.
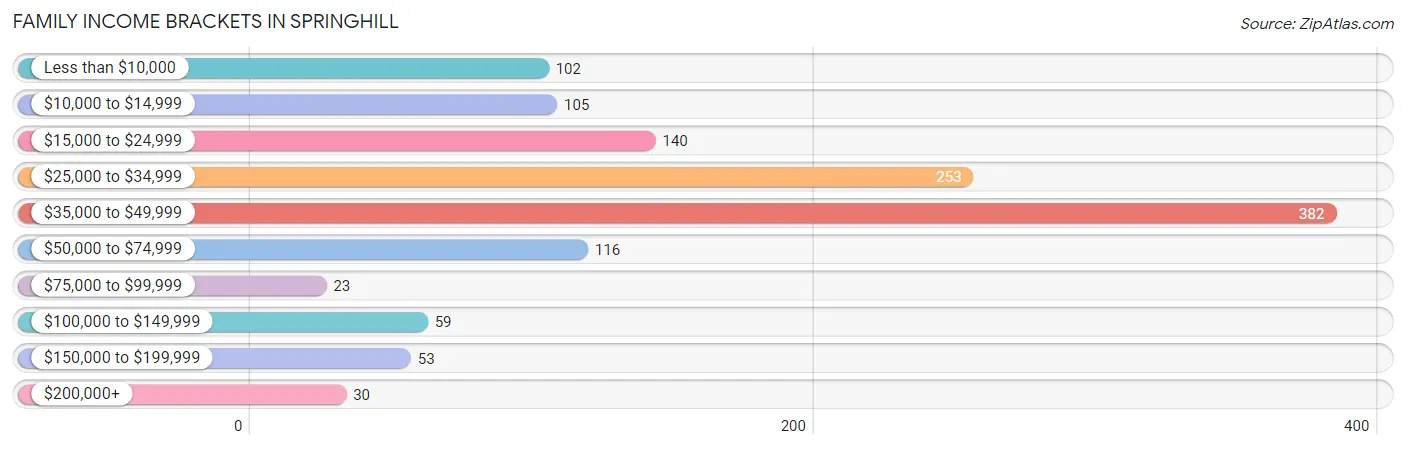
| Income Bracket | # Families | % Families |
| Less than $10,000 | 102 | 8.1% |
| $10,000 to $14,999 | 105 | 8.3% |
| $15,000 to $24,999 | 140 | 11.1% |
| $25,000 to $34,999 | 253 | 20.0% |
| $35,000 to $49,999 | 382 | 30.2% |
| $50,000 to $74,999 | 116 | 9.2% |
| $75,000 to $99,999 | 23 | 1.8% |
| $100,000 to $149,999 | 59 | 4.7% |
| $150,000 to $199,999 | 53 | 4.2% |
| $200,000+ | 30 | 2.4% |
Family Income by Famaliy Size in Springhill
2-person families (528 | 41.7%) account for the highest median family income in Springhill with $37,361 per family, while 2-person families (528 | 41.7%) have the highest median income of $18,680 per family member.
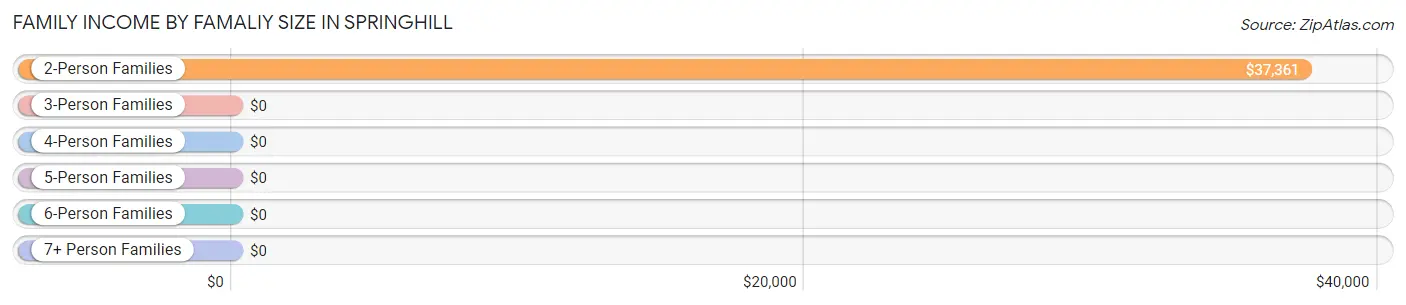
| Income Bracket | # Families | Median Income |
| 2-Person Families | 528 (41.7%) | $37,361 |
| 3-Person Families | 268 (21.2%) | $0 |
| 4-Person Families | 208 (16.4%) | $0 |
| 5-Person Families | 167 (13.2%) | $0 |
| 6-Person Families | 94 (7.4%) | $0 |
| 7+ Person Families | 0 (0.0%) | $0 |
| Total | 1,265 (100.0%) | $38,304 |
Family Income by Number of Earners in Springhill
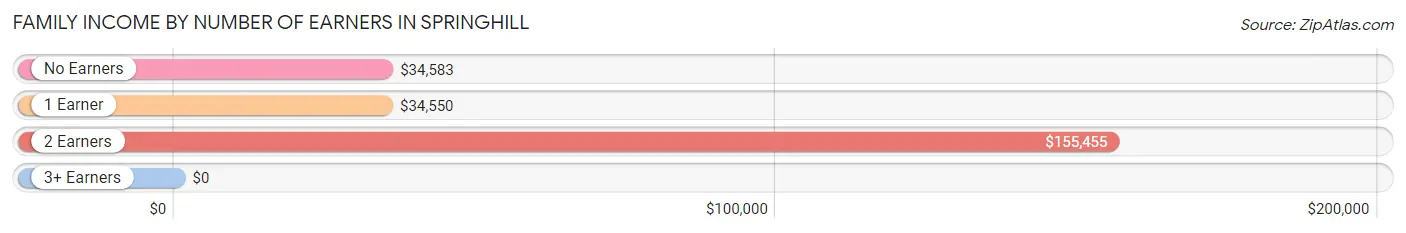
| Number of Earners | # Families | Median Income |
| No Earners | 441 (34.9%) | $34,583 |
| 1 Earner | 715 (56.5%) | $34,550 |
| 2 Earners | 80 (6.3%) | $155,455 |
| 3+ Earners | 29 (2.3%) | $0 |
| Total | 1,265 (100.0%) | $38,304 |
Household Income in Springhill
Household Income Brackets in Springhill
With 402 households falling in the category, the $35,000 to $49,999 income range is the most frequent in Springhill, accounting for 20.5% of all households. In contrast, only 29 households (1.5%) fall into the $200,000+ income bracket, making it the least populous group.
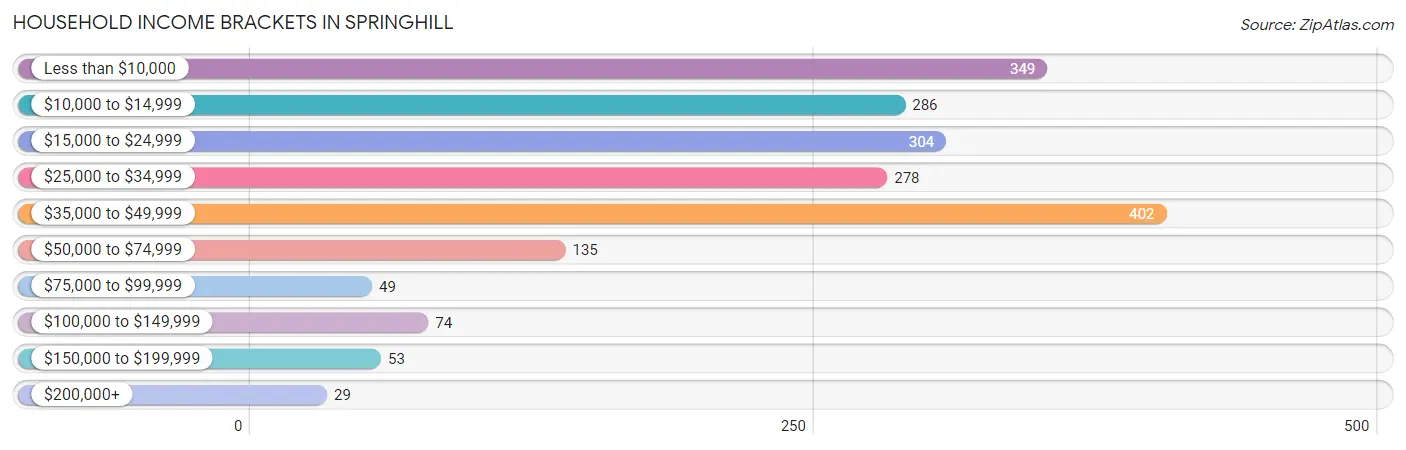
| Income Bracket | # Households | % Households |
| Less than $10,000 | 349 | 17.8% |
| $10,000 to $14,999 | 286 | 14.6% |
| $15,000 to $24,999 | 304 | 15.5% |
| $25,000 to $34,999 | 278 | 14.2% |
| $35,000 to $49,999 | 402 | 20.5% |
| $50,000 to $74,999 | 135 | 6.9% |
| $75,000 to $99,999 | 49 | 2.5% |
| $100,000 to $149,999 | 74 | 3.8% |
| $150,000 to $199,999 | 53 | 2.7% |
| $200,000+ | 29 | 1.5% |
Household Income by Householder Age in Springhill
The median household income in Springhill is $27,868, with the highest median household income of $34,560 found in the 45 to 64 years age bracket for the primary householder. A total of 840 households (42.9%) fall into this category. Meanwhile, the 15 to 24 years age bracket for the primary householder has the lowest median household income of $6,578, with 178 households (9.1%) in this group.
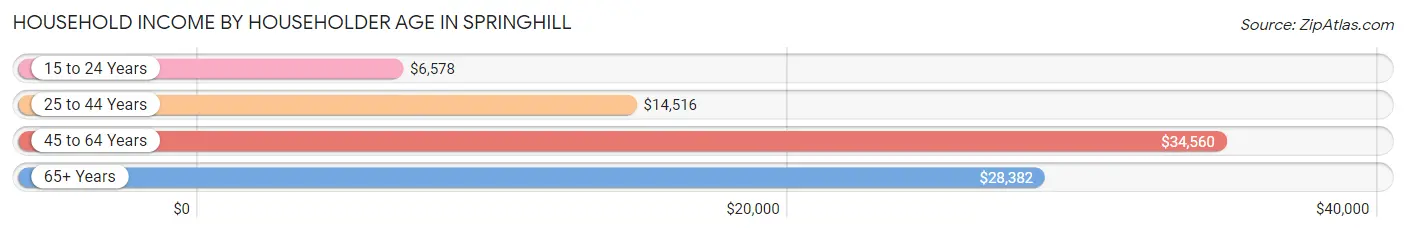
| Income Bracket | # Households | Median Income |
| 15 to 24 Years | 178 (9.1%) | $6,578 |
| 25 to 44 Years | 330 (16.8%) | $14,516 |
| 45 to 64 Years | 840 (42.9%) | $34,560 |
| 65+ Years | 612 (31.2%) | $28,382 |
| Total | 1,960 (100.0%) | $27,868 |
Poverty in Springhill
Income Below Poverty by Sex and Age in Springhill
With 32.2% poverty level for males and 39.0% for females among the residents of Springhill, under 5 year old males and 5 year old females are the most vulnerable to poverty, with 101 males (100.0%) and 30 females (100.0%) in their respective age groups living below the poverty level.
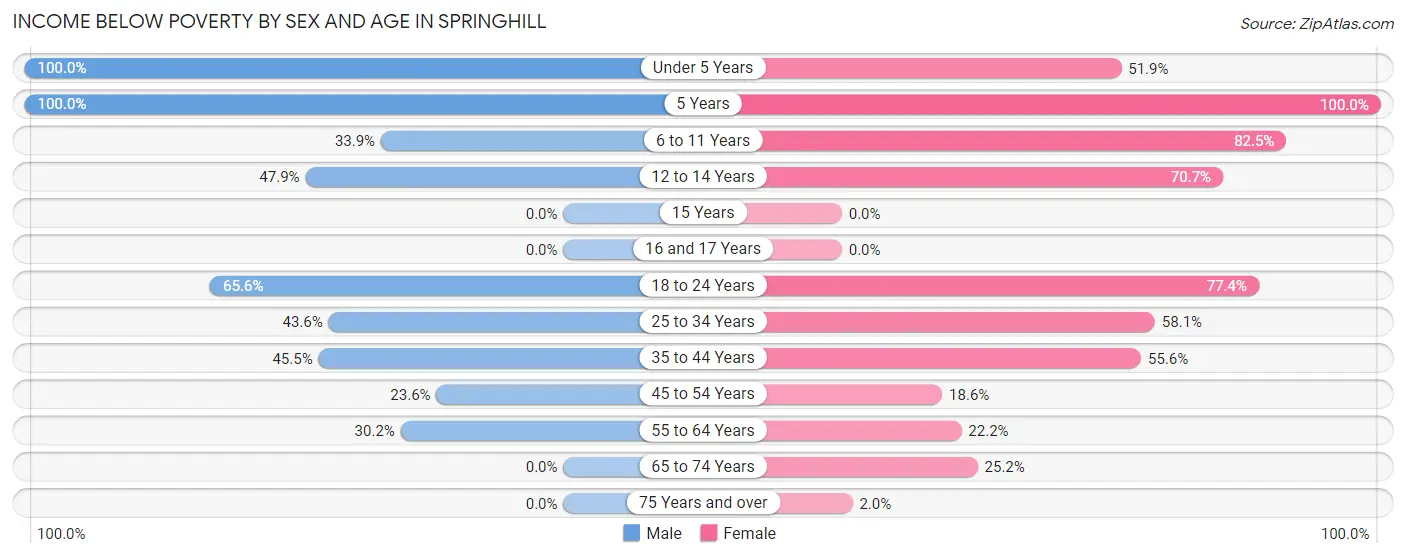
| Age Bracket | Male | Female |
| Under 5 Years | 101 (100.0%) | 69 (51.9%) |
| 5 Years | 22 (100.0%) | 30 (100.0%) |
| 6 to 11 Years | 107 (33.9%) | 113 (82.5%) |
| 12 to 14 Years | 113 (47.9%) | 29 (70.7%) |
| 15 Years | 0 (0.0%) | 0 (0.0%) |
| 16 and 17 Years | 0 (0.0%) | 0 (0.0%) |
| 18 to 24 Years | 99 (65.6%) | 202 (77.4%) |
| 25 to 34 Years | 17 (43.6%) | 111 (58.1%) |
| 35 to 44 Years | 55 (45.5%) | 195 (55.6%) |
| 45 to 54 Years | 102 (23.6%) | 57 (18.6%) |
| 55 to 64 Years | 74 (30.2%) | 95 (22.2%) |
| 65 to 74 Years | 0 (0.0%) | 59 (25.2%) |
| 75 Years and over | 0 (0.0%) | 7 (2.0%) |
| Total | 690 (32.2%) | 967 (39.0%) |
Income Above Poverty by Sex and Age in Springhill
According to the poverty statistics in Springhill, males aged 15 years and females aged 16 and 17 years are the age groups that are most secure financially, with 100.0% of males and 100.0% of females in these age groups living above the poverty line.
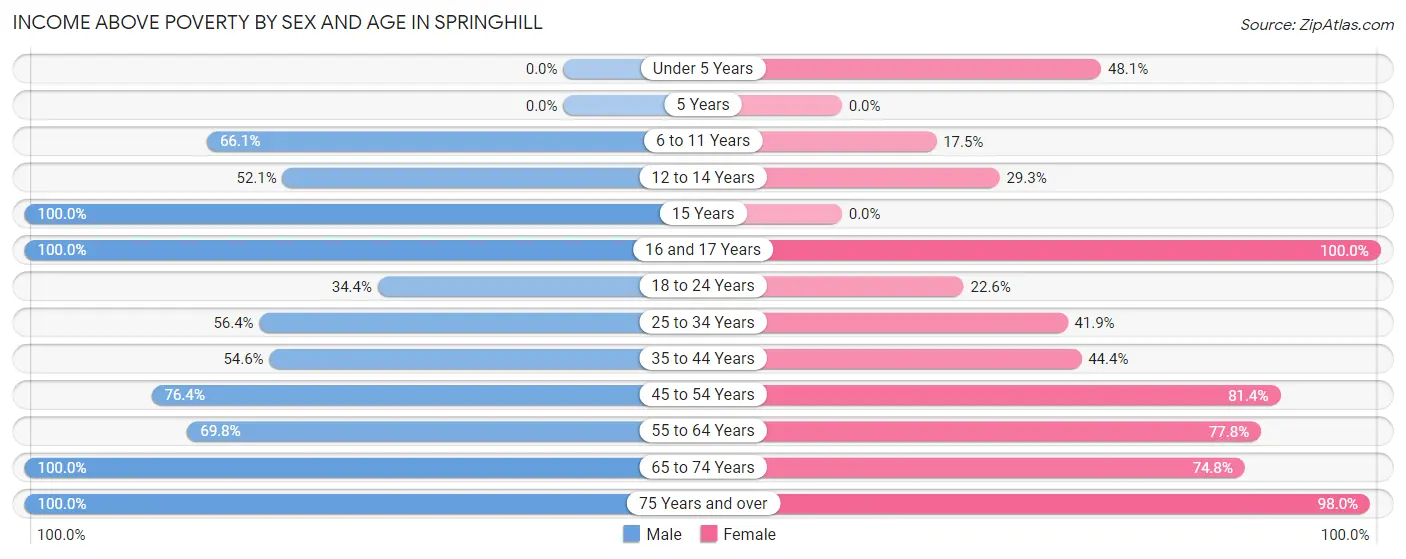
| Age Bracket | Male | Female |
| Under 5 Years | 0 (0.0%) | 64 (48.1%) |
| 5 Years | 0 (0.0%) | 0 (0.0%) |
| 6 to 11 Years | 209 (66.1%) | 24 (17.5%) |
| 12 to 14 Years | 123 (52.1%) | 12 (29.3%) |
| 15 Years | 15 (100.0%) | 0 (0.0%) |
| 16 and 17 Years | 58 (100.0%) | 13 (100.0%) |
| 18 to 24 Years | 52 (34.4%) | 59 (22.6%) |
| 25 to 34 Years | 22 (56.4%) | 80 (41.9%) |
| 35 to 44 Years | 66 (54.5%) | 156 (44.4%) |
| 45 to 54 Years | 331 (76.4%) | 249 (81.4%) |
| 55 to 64 Years | 171 (69.8%) | 333 (77.8%) |
| 65 to 74 Years | 180 (100.0%) | 175 (74.8%) |
| 75 Years and over | 228 (100.0%) | 346 (98.0%) |
| Total | 1,455 (67.8%) | 1,511 (61.0%) |
Income Below Poverty Among Married-Couple Families in Springhill
The poverty statistics for married-couple families in Springhill show that 16.2% or 123 of the total 761 families live below the poverty line. Families with 3 or 4 children have the highest poverty rate of 75.5%, comprising of 71 families. On the other hand, families with no children have the lowest poverty rate of 0.0%, which includes 0 families.
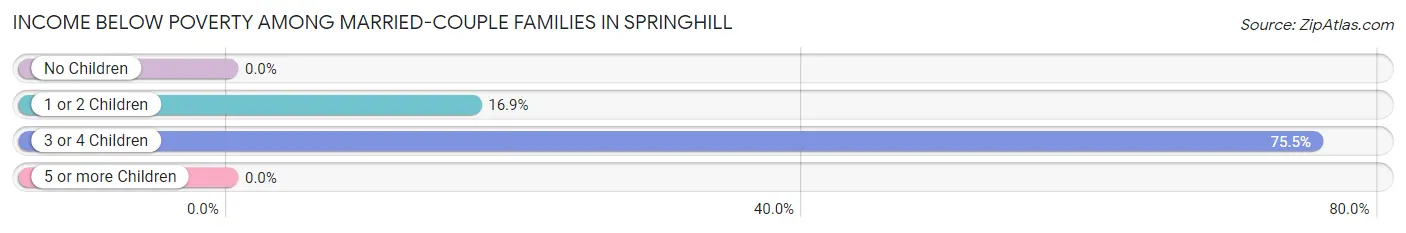
| Children | Above Poverty | Below Poverty |
| No Children | 360 (100.0%) | 0 (0.0%) |
| 1 or 2 Children | 255 (83.1%) | 52 (16.9%) |
| 3 or 4 Children | 23 (24.5%) | 71 (75.5%) |
| 5 or more Children | 0 (0.0%) | 0 (0.0%) |
| Total | 638 (83.8%) | 123 (16.2%) |
Income Below Poverty Among Single-Parent Households in Springhill
According to the poverty data in Springhill, 24.8% or 31 single-father households and 51.2% or 194 single-mother households are living below the poverty line. Among single-father households, those with 1 or 2 children have the highest poverty rate, with 31 households (100.0%) experiencing poverty. Likewise, among single-mother households, those with 3 or 4 children have the highest poverty rate, with 50 households (86.2%) falling below the poverty line.
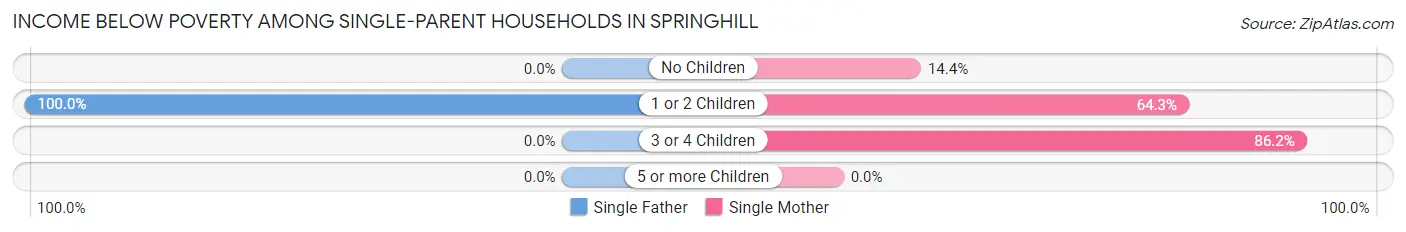
| Children | Single Father | Single Mother |
| No Children | 0 (0.0%) | 18 (14.4%) |
| 1 or 2 Children | 31 (100.0%) | 126 (64.3%) |
| 3 or 4 Children | 0 (0.0%) | 50 (86.2%) |
| 5 or more Children | 0 (0.0%) | 0 (0.0%) |
| Total | 31 (24.8%) | 194 (51.2%) |
Income Below Poverty Among Married-Couple vs Single-Parent Households in Springhill
The poverty data for Springhill shows that 123 of the married-couple family households (16.2%) and 225 of the single-parent households (44.6%) are living below the poverty level. Within the married-couple family households, those with 3 or 4 children have the highest poverty rate, with 71 households (75.5%) falling below the poverty line. Among the single-parent households, those with 3 or 4 children have the highest poverty rate, with 50 household (86.2%) living below poverty.
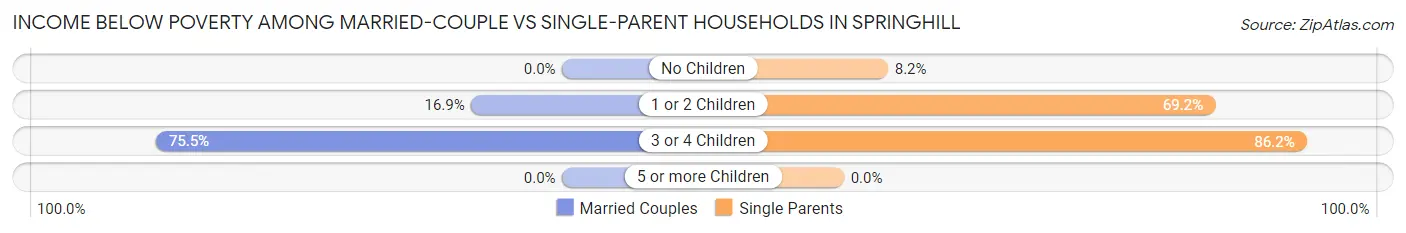
| Children | Married-Couple Families | Single-Parent Households |
| No Children | 0 (0.0%) | 18 (8.2%) |
| 1 or 2 Children | 52 (16.9%) | 157 (69.2%) |
| 3 or 4 Children | 71 (75.5%) | 50 (86.2%) |
| 5 or more Children | 0 (0.0%) | 0 (0.0%) |
| Total | 123 (16.2%) | 225 (44.6%) |
Race in Springhill
The most populous races in Springhill are White / Caucasian (3,038 | 64.1%), Black / African American (1,545 | 32.6%), and Hispanic or Latino (387 | 8.2%).
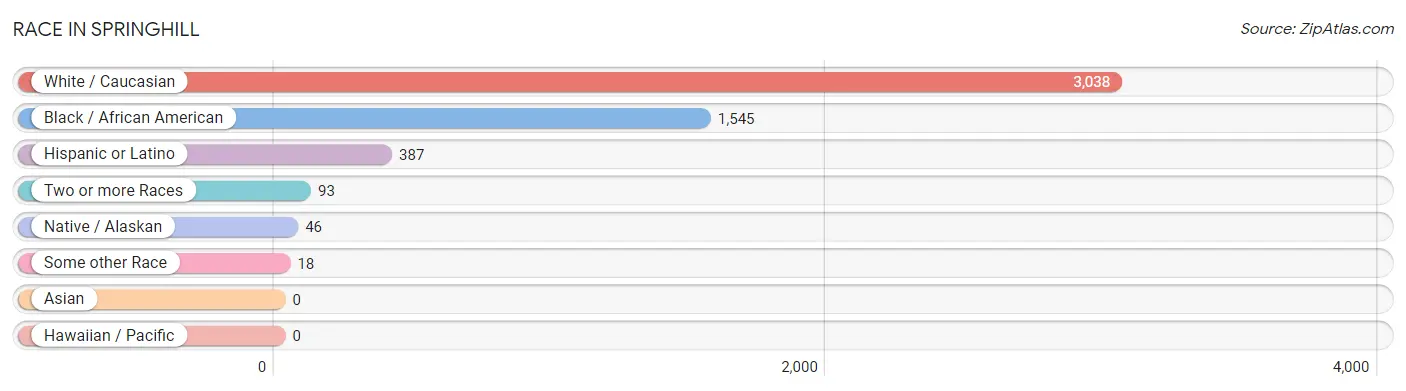
| Race | # Population | % Population |
| Asian | 0 | 0.0% |
| Black / African American | 1,545 | 32.6% |
| Hawaiian / Pacific | 0 | 0.0% |
| Hispanic or Latino | 387 | 8.2% |
| Native / Alaskan | 46 | 1.0% |
| White / Caucasian | 3,038 | 64.1% |
| Two or more Races | 93 | 2.0% |
| Some other Race | 18 | 0.4% |
| Total | 4,740 | 100.0% |
Ancestry in Springhill
The most populous ancestries reported in Springhill are American (672 | 14.2%), German (327 | 6.9%), Mexican (300 | 6.3%), Irish (247 | 5.2%), and English (243 | 5.1%), together accounting for 37.8% of all Springhill residents.
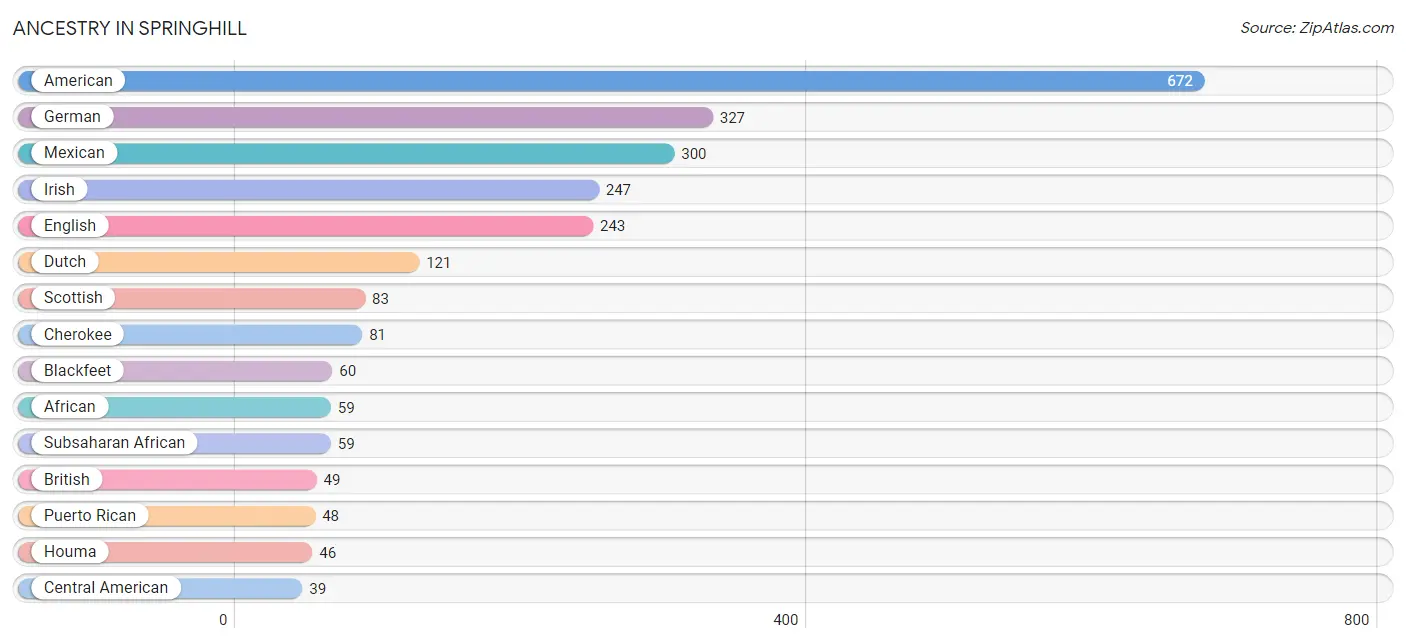
| Ancestry | # Population | % Population |
| African | 59 | 1.2% |
| American | 672 | 14.2% |
| Bhutanese | 26 | 0.5% |
| Blackfeet | 60 | 1.3% |
| British | 49 | 1.0% |
| Central American | 39 | 0.8% |
| Cherokee | 81 | 1.7% |
| Dutch | 121 | 2.5% |
| English | 243 | 5.1% |
| European | 33 | 0.7% |
| French | 19 | 0.4% |
| French Canadian | 34 | 0.7% |
| German | 327 | 6.9% |
| Houma | 46 | 1.0% |
| Irish | 247 | 5.2% |
| Mexican | 300 | 6.3% |
| Nicaraguan | 39 | 0.8% |
| Puerto Rican | 48 | 1.0% |
| Scotch-Irish | 33 | 0.7% |
| Scottish | 83 | 1.8% |
| Subsaharan African | 59 | 1.2% | View All 21 Rows |
Immigrants in Springhill
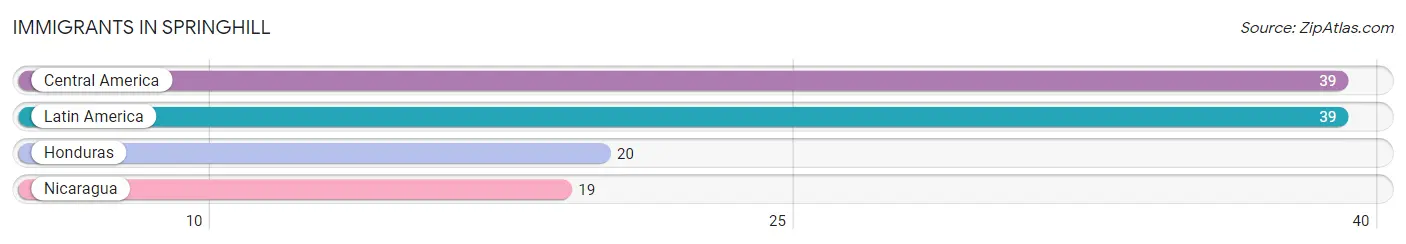
The most numerous immigrant groups reported in Springhill came from Central America (39 | 0.8%), Latin America (39 | 0.8%), Honduras (20 | 0.4%), and Nicaragua (19 | 0.4%), together accounting for 2.5% of all Springhill residents.
| Immigration Origin | # Population | % Population |
| Central America | 39 | 0.8% |
| Honduras | 20 | 0.4% |
| Latin America | 39 | 0.8% |
| Nicaragua | 19 | 0.4% | View All 4 Rows |
Sex and Age in Springhill
Sex and Age in Springhill
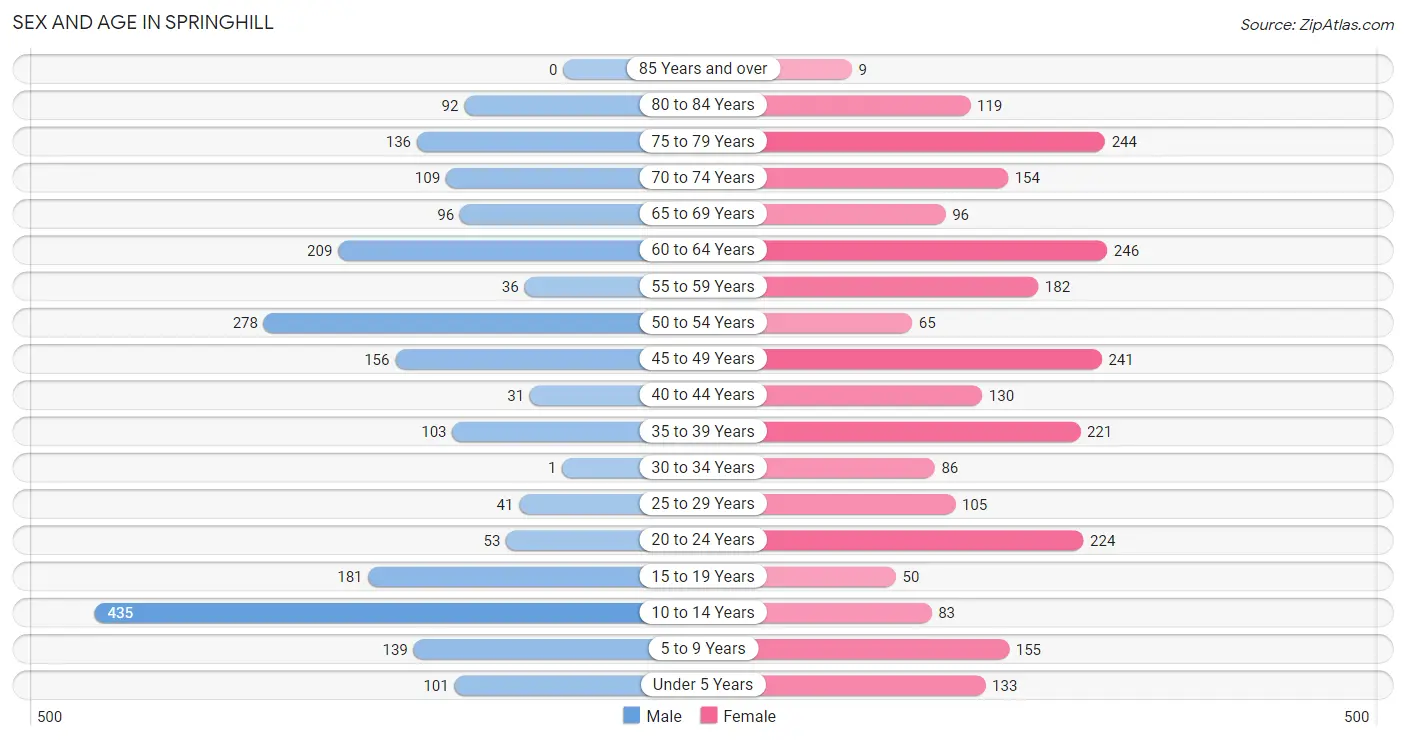
The most populous age groups in Springhill are 10 to 14 Years (435 | 19.8%) for men and 60 to 64 Years (246 | 9.7%) for women.
| Age Bracket | Male | Female |
| Under 5 Years | 101 (4.6%) | 133 (5.2%) |
| 5 to 9 Years | 139 (6.3%) | 155 (6.1%) |
| 10 to 14 Years | 435 (19.8%) | 83 (3.3%) |
| 15 to 19 Years | 181 (8.2%) | 50 (2.0%) |
| 20 to 24 Years | 53 (2.4%) | 224 (8.8%) |
| 25 to 29 Years | 41 (1.9%) | 105 (4.1%) |
| 30 to 34 Years | 1 (0.1%) | 86 (3.4%) |
| 35 to 39 Years | 103 (4.7%) | 221 (8.7%) |
| 40 to 44 Years | 31 (1.4%) | 130 (5.1%) |
| 45 to 49 Years | 156 (7.1%) | 241 (9.5%) |
| 50 to 54 Years | 278 (12.7%) | 65 (2.6%) |
| 55 to 59 Years | 36 (1.6%) | 182 (7.2%) |
| 60 to 64 Years | 209 (9.5%) | 246 (9.7%) |
| 65 to 69 Years | 96 (4.4%) | 96 (3.8%) |
| 70 to 74 Years | 109 (5.0%) | 154 (6.1%) |
| 75 to 79 Years | 136 (6.2%) | 244 (9.6%) |
| 80 to 84 Years | 92 (4.2%) | 119 (4.7%) |
| 85 Years and over | 0 (0.0%) | 9 (0.4%) |
| Total | 2,197 (100.0%) | 2,543 (100.0%) |
Families and Households in Springhill
Median Family Size in Springhill
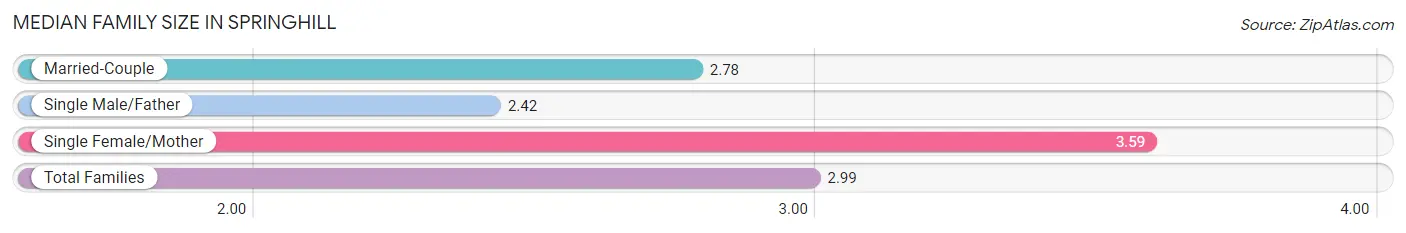
The median family size in Springhill is 2.99 persons per family, with single female/mother families (379 | 30.0%) accounting for the largest median family size of 3.59 persons per family. On the other hand, single male/father families (125 | 9.9%) represent the smallest median family size with 2.42 persons per family.
| Family Type | # Families | Family Size |
| Married-Couple | 761 (60.2%) | 2.78 |
| Single Male/Father | 125 (9.9%) | 2.42 |
| Single Female/Mother | 379 (30.0%) | 3.59 |
| Total Families | 1,265 (100.0%) | 2.99 |
Median Household Size in Springhill
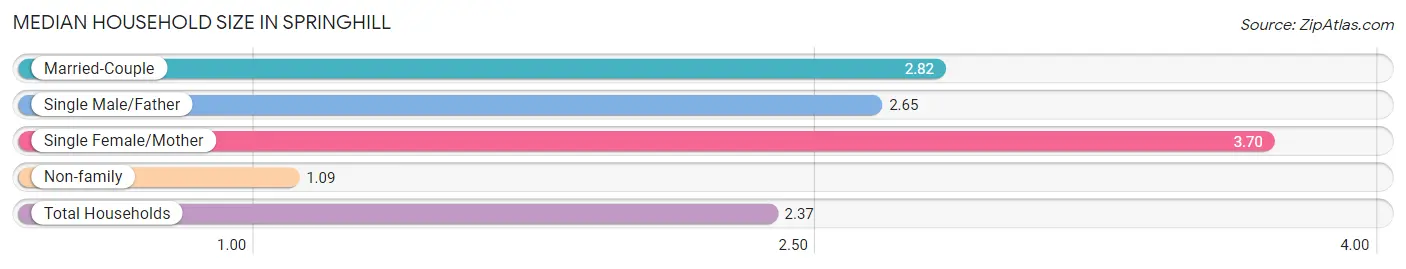
The median household size in Springhill is 2.37 persons per household, with single female/mother households (379 | 19.3%) accounting for the largest median household size of 3.7 persons per household. non-family households (695 | 35.5%) represent the smallest median household size with 1.09 persons per household.
| Household Type | # Households | Household Size |
| Married-Couple | 761 (38.8%) | 2.82 |
| Single Male/Father | 125 (6.4%) | 2.65 |
| Single Female/Mother | 379 (19.3%) | 3.70 |
| Non-family | 695 (35.5%) | 1.09 |
| Total Households | 1,960 (100.0%) | 2.37 |
Household Size by Marriage Status in Springhill
Out of a total of 1,960 households in Springhill, 1,265 (64.5%) are family households, while 695 (35.5%) are nonfamily households. The most numerous type of family households are 2-person households, comprising 478, and the most common type of nonfamily households are 1-person households, comprising 631.
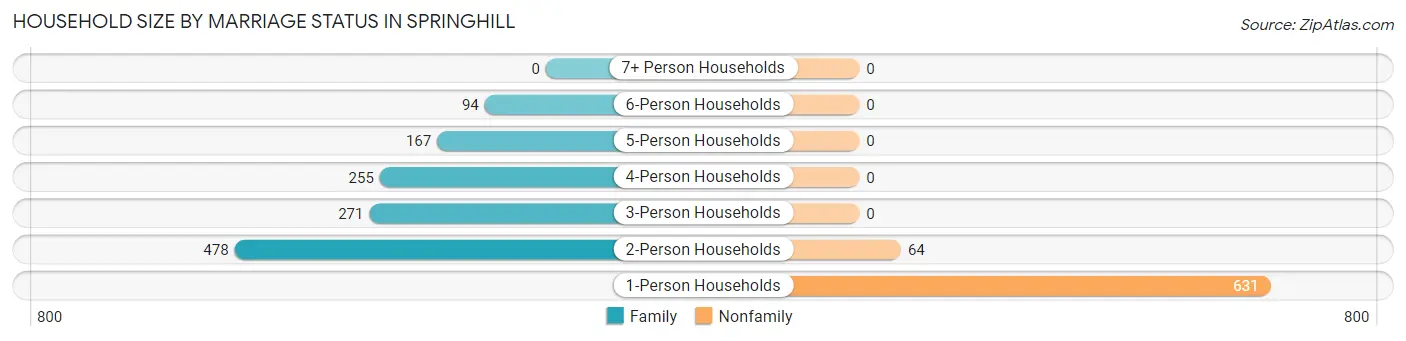
| Household Size | Family Households | Nonfamily Households |
| 1-Person Households | - | 631 (32.2%) |
| 2-Person Households | 478 (24.4%) | 64 (3.3%) |
| 3-Person Households | 271 (13.8%) | 0 (0.0%) |
| 4-Person Households | 255 (13.0%) | 0 (0.0%) |
| 5-Person Households | 167 (8.5%) | 0 (0.0%) |
| 6-Person Households | 94 (4.8%) | 0 (0.0%) |
| 7+ Person Households | 0 (0.0%) | 0 (0.0%) |
| Total | 1,265 (64.5%) | 695 (35.5%) |
Female Fertility in Springhill
Fertility by Age in Springhill
Average fertility rate in Springhill is 109.0 births per 1,000 women. Women in the age bracket of 20 to 34 years have the highest fertility rate with 210.0 births per 1,000 women. Women in the age bracket of 20 to 34 years acount for 74.4% of all women with births.
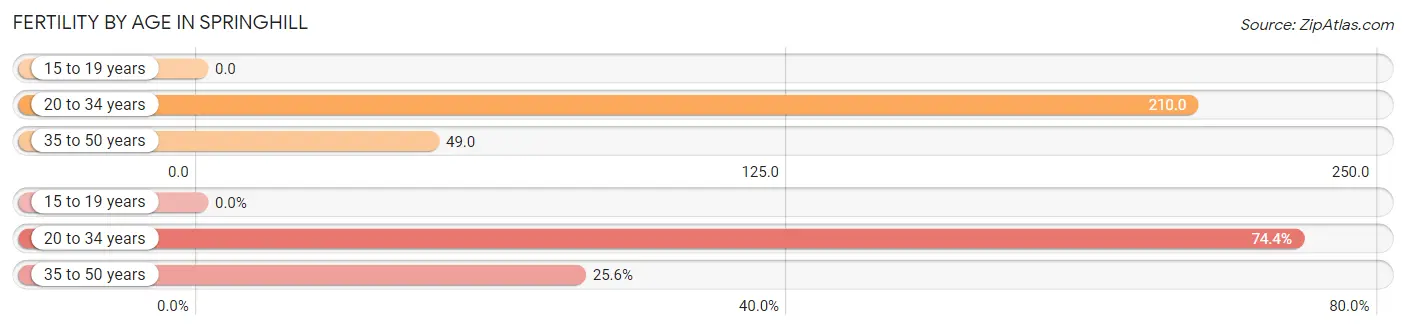
| Age Bracket | Women with Births | Births / 1,000 Women |
| 15 to 19 years | 0 (0.0%) | 0.0 |
| 20 to 34 years | 87 (74.4%) | 210.0 |
| 35 to 50 years | 30 (25.6%) | 49.0 |
| Total | 117 (100.0%) | 109.0 |
Fertility by Age by Marriage Status in Springhill
28.2% of women with births (117) in Springhill are married. The highest percentage of unmarried women with births falls into 20 to 34 years age bracket with 77.0% of them unmarried at the time of birth, while the lowest percentage of unmarried women with births belong to 35 to 50 years age bracket with 56.7% of them unmarried.
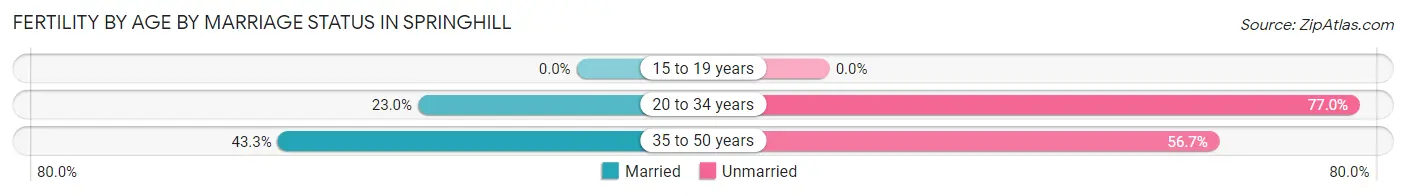
| Age Bracket | Married | Unmarried |
| 15 to 19 years | 0 (0.0%) | 0 (0.0%) |
| 20 to 34 years | 20 (23.0%) | 67 (77.0%) |
| 35 to 50 years | 13 (43.3%) | 17 (56.7%) |
| Total | 33 (28.2%) | 84 (71.8%) |
Fertility by Education in Springhill
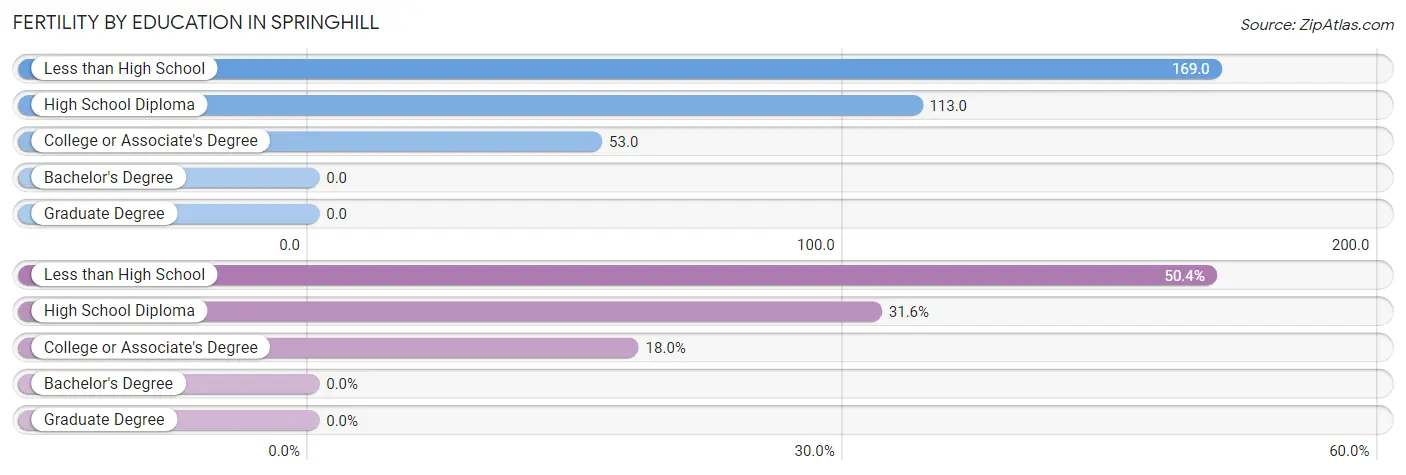
| Educational Attainment | Women with Births | Births / 1,000 Women |
| Less than High School | 59 (50.4%) | 169.0 |
| High School Diploma | 37 (31.6%) | 113.0 |
| College or Associate's Degree | 21 (17.9%) | 53.0 |
| Bachelor's Degree | 0 (0.0%) | 0.0 |
| Graduate Degree | 0 (0.0%) | 0.0 |
| Total | 117 (100.0%) | 109.0 |
Fertility by Education by Marriage Status in Springhill
71.8% of women with births in Springhill are unmarried. Women with the educational attainment of college or associate's degree are most likely to be married with 61.9% of them married at childbirth, while women with the educational attainment of less than high school are least likely to be married with 100.0% of them unmarried at childbirth.
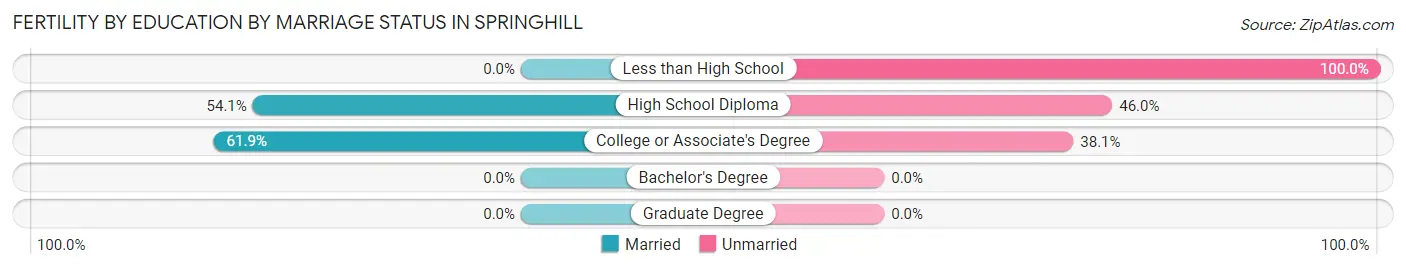
| Educational Attainment | Married | Unmarried |
| Less than High School | 0 (0.0%) | 59 (100.0%) |
| High School Diploma | 20 (54.0%) | 17 (46.0%) |
| College or Associate's Degree | 13 (61.9%) | 8 (38.1%) |
| Bachelor's Degree | 0 (0.0%) | 0 (0.0%) |
| Graduate Degree | 0 (0.0%) | 0 (0.0%) |
| Total | 33 (28.2%) | 84 (71.8%) |
Employment Characteristics in Springhill
Employment by Class of Employer in Springhill
Among the 942 employed individuals in Springhill, private company employees (444 | 47.1%), self-employed (not incorporated) (176 | 18.7%), and state government employees (152 | 16.1%) make up the most common classes of employment.
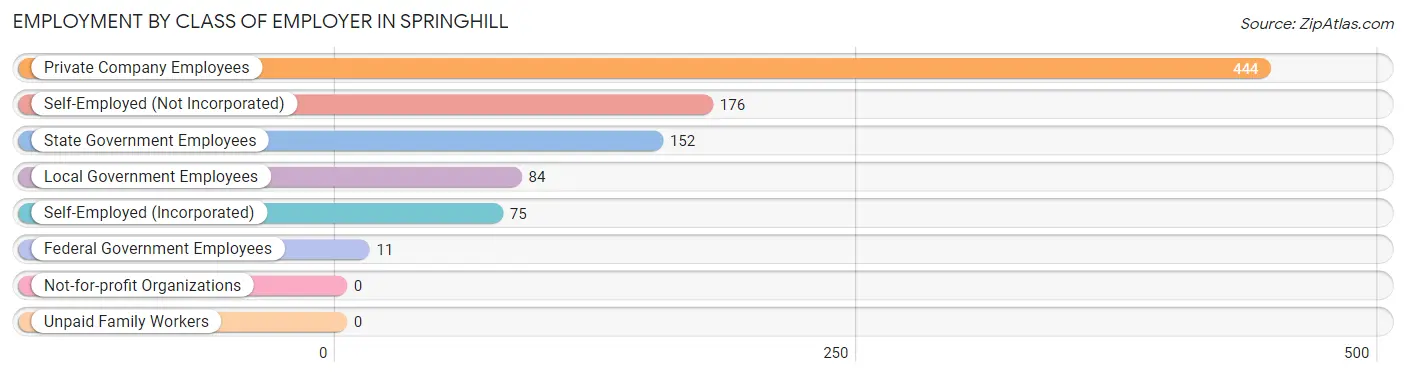
| Employer Class | # Employees | % Employees |
| Private Company Employees | 444 | 47.1% |
| Self-Employed (Incorporated) | 75 | 8.0% |
| Self-Employed (Not Incorporated) | 176 | 18.7% |
| Not-for-profit Organizations | 0 | 0.0% |
| Local Government Employees | 84 | 8.9% |
| State Government Employees | 152 | 16.1% |
| Federal Government Employees | 11 | 1.2% |
| Unpaid Family Workers | 0 | 0.0% |
| Total | 942 | 100.0% |
Employment Status by Age in Springhill
According to the labor force statistics for Springhill, out of the total population over 16 years of age (3,679), 29.5% or 1,085 individuals are in the labor force, with 10.7% or 116 of them unemployed. The age group with the highest labor force participation rate is 30 to 34 years, with 69.0% or 60 individuals in the labor force. Within the labor force, the 30 to 34 years age range has the highest percentage of unemployed individuals, with 86.7% or 52 of them being unemployed.
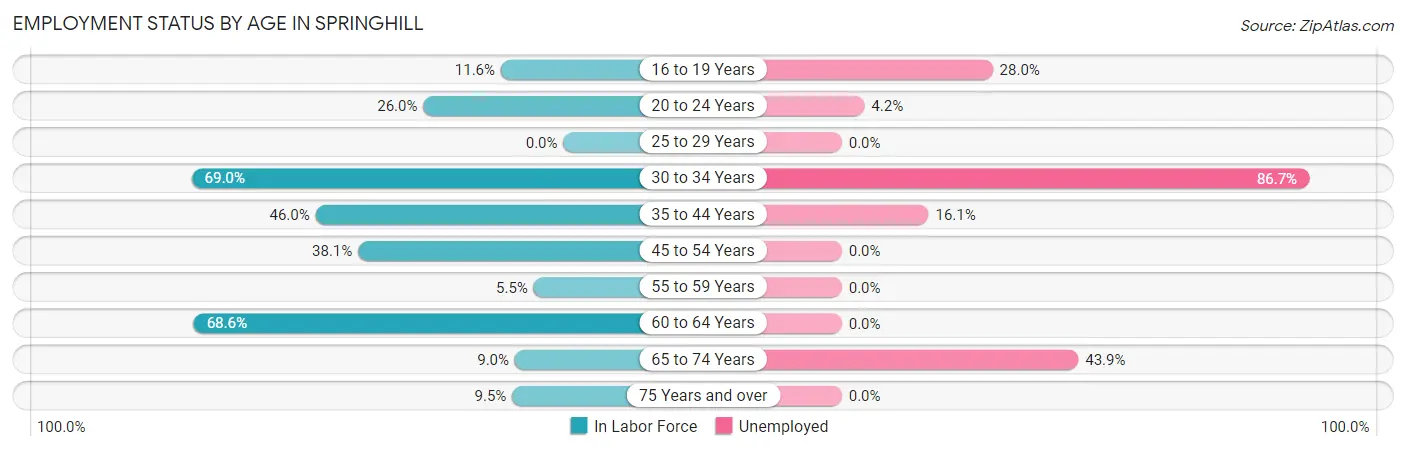
| Age Bracket | In Labor Force | Unemployed |
| 16 to 19 Years | 25 (11.6%) | 7 (28.0%) |
| 20 to 24 Years | 72 (26.0%) | 3 (4.2%) |
| 25 to 29 Years | 0 (0.0%) | 0 (0.0%) |
| 30 to 34 Years | 60 (69.0%) | 52 (86.7%) |
| 35 to 44 Years | 223 (46.0%) | 36 (16.1%) |
| 45 to 54 Years | 282 (38.1%) | 0 (0.0%) |
| 55 to 59 Years | 12 (5.5%) | 0 (0.0%) |
| 60 to 64 Years | 312 (68.6%) | 0 (0.0%) |
| 65 to 74 Years | 41 (9.0%) | 18 (43.9%) |
| 75 Years and over | 57 (9.5%) | 0 (0.0%) |
| Total | 1,085 (29.5%) | 116 (10.7%) |
Employment Status by Educational Attainment in Springhill
According to labor force statistics for Springhill, 41.7% of individuals (889) out of the total population between 25 and 64 years of age (2,131) are in the labor force, with 9.9% or 88 of them being unemployed. The group with the highest labor force participation rate are those with the educational attainment of college / associate degree, with 63.2% or 430 individuals in the labor force. Within the labor force, individuals with less than high school education have the highest percentage of unemployment, with 34.8% or 23 of them being unemployed.
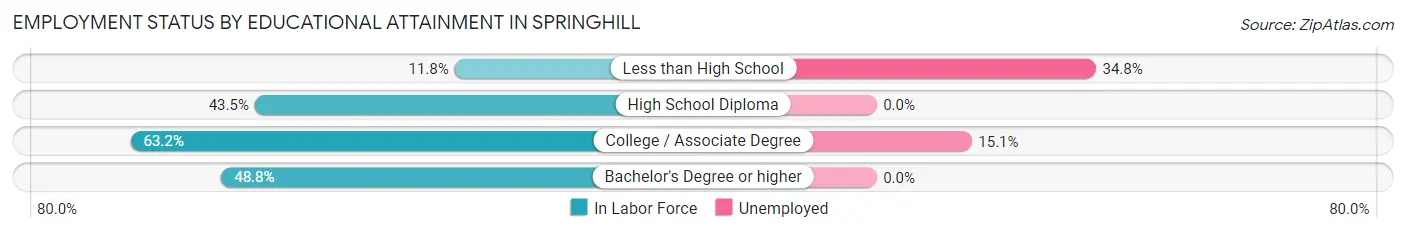
| Educational Attainment | In Labor Force | Unemployed |
| Less than High School | 66 (11.8%) | 194 (34.8%) |
| High School Diploma | 354 (43.5%) | 0 (0.0%) |
| College / Associate Degree | 430 (63.2%) | 103 (15.1%) |
| Bachelor's Degree or higher | 39 (48.8%) | 0 (0.0%) |
| Total | 889 (41.7%) | 211 (9.9%) |
Employment Occupations by Sex in Springhill
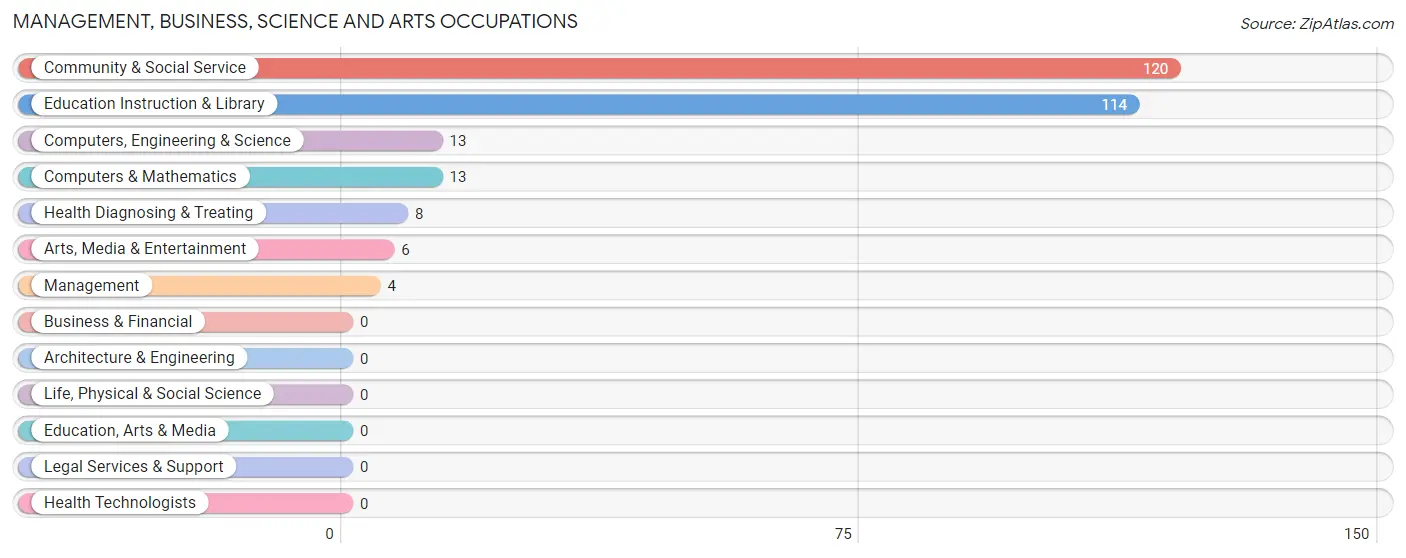
Management, Business, Science and Arts Occupations
The most common Management, Business, Science and Arts occupations in Springhill are Community & Social Service (120 | 12.4%), Education Instruction & Library (114 | 11.8%), Computers, Engineering & Science (13 | 1.3%), Computers & Mathematics (13 | 1.3%), and Health Diagnosing & Treating (8 | 0.8%).
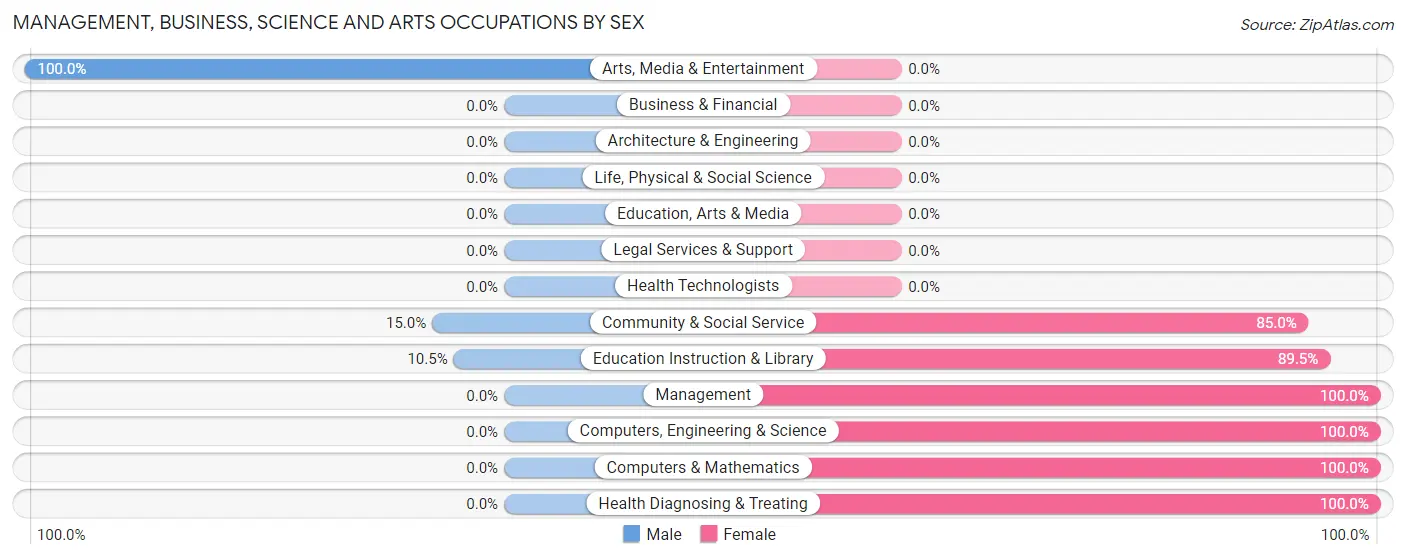
Management, Business, Science and Arts Occupations by Sex
Within the Management, Business, Science and Arts occupations in Springhill, the most male-oriented occupations are Arts, Media & Entertainment (100.0%), Community & Social Service (15.0%), and Education Instruction & Library (10.5%), while the most female-oriented occupations are Management (100.0%), Computers, Engineering & Science (100.0%), and Computers & Mathematics (100.0%).
| Occupation | Male | Female |
| Management | 0 (0.0%) | 4 (100.0%) |
| Business & Financial | 0 (0.0%) | 0 (0.0%) |
| Computers, Engineering & Science | 0 (0.0%) | 13 (100.0%) |
| Computers & Mathematics | 0 (0.0%) | 13 (100.0%) |
| Architecture & Engineering | 0 (0.0%) | 0 (0.0%) |
| Life, Physical & Social Science | 0 (0.0%) | 0 (0.0%) |
| Community & Social Service | 18 (15.0%) | 102 (85.0%) |
| Education, Arts & Media | 0 (0.0%) | 0 (0.0%) |
| Legal Services & Support | 0 (0.0%) | 0 (0.0%) |
| Education Instruction & Library | 12 (10.5%) | 102 (89.5%) |
| Arts, Media & Entertainment | 6 (100.0%) | 0 (0.0%) |
| Health Diagnosing & Treating | 0 (0.0%) | 8 (100.0%) |
| Health Technologists | 0 (0.0%) | 0 (0.0%) |
| Total (Category) | 18 (12.4%) | 127 (87.6%) |
| Total (Overall) | 492 (50.8%) | 476 (49.2%) |
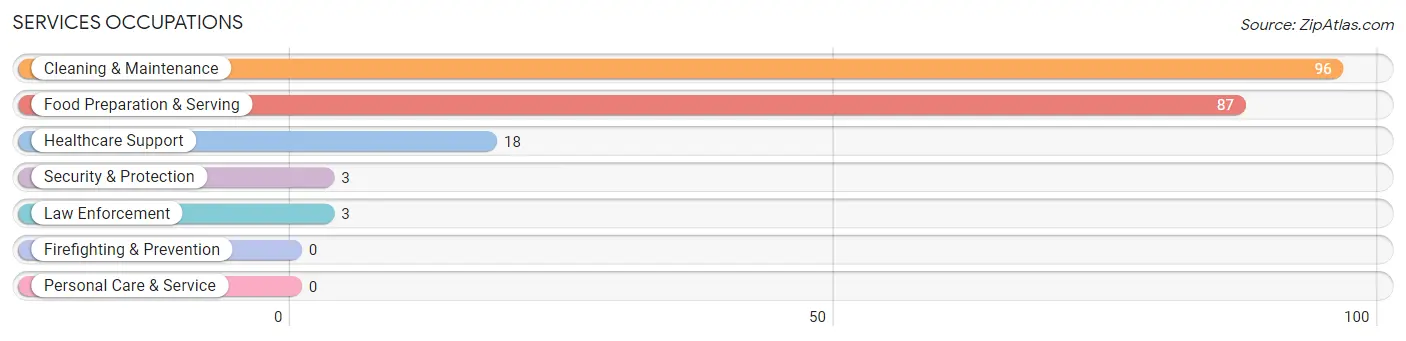
Services Occupations
The most common Services occupations in Springhill are Cleaning & Maintenance (96 | 9.9%), Food Preparation & Serving (87 | 9.0%), Healthcare Support (18 | 1.9%), Security & Protection (3 | 0.3%), and Law Enforcement (3 | 0.3%).
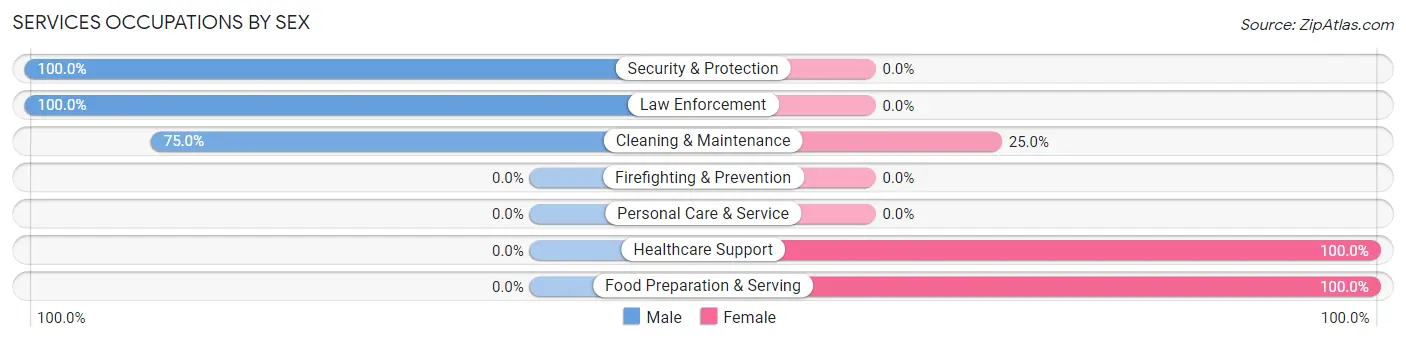
Services Occupations by Sex
Within the Services occupations in Springhill, the most male-oriented occupations are Security & Protection (100.0%), Law Enforcement (100.0%), and Cleaning & Maintenance (75.0%), while the most female-oriented occupations are Healthcare Support (100.0%), Food Preparation & Serving (100.0%), and Cleaning & Maintenance (25.0%).
| Occupation | Male | Female |
| Healthcare Support | 0 (0.0%) | 18 (100.0%) |
| Security & Protection | 3 (100.0%) | 0 (0.0%) |
| Firefighting & Prevention | 0 (0.0%) | 0 (0.0%) |
| Law Enforcement | 3 (100.0%) | 0 (0.0%) |
| Food Preparation & Serving | 0 (0.0%) | 87 (100.0%) |
| Cleaning & Maintenance | 72 (75.0%) | 24 (25.0%) |
| Personal Care & Service | 0 (0.0%) | 0 (0.0%) |
| Total (Category) | 75 (36.8%) | 129 (63.2%) |
| Total (Overall) | 492 (50.8%) | 476 (49.2%) |
Sales and Office Occupations
The most common Sales and Office occupations in Springhill are Office & Administration (127 | 13.1%), and Sales & Related (78 | 8.1%).
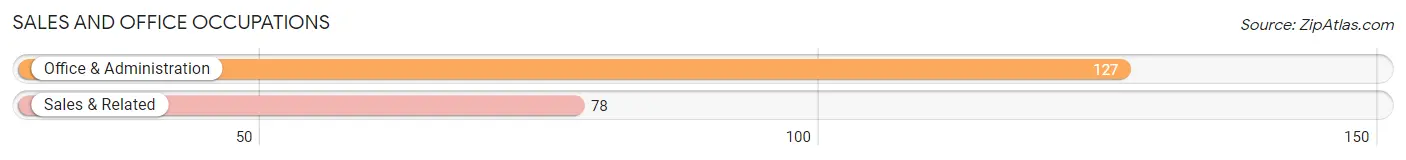
Sales and Office Occupations by Sex
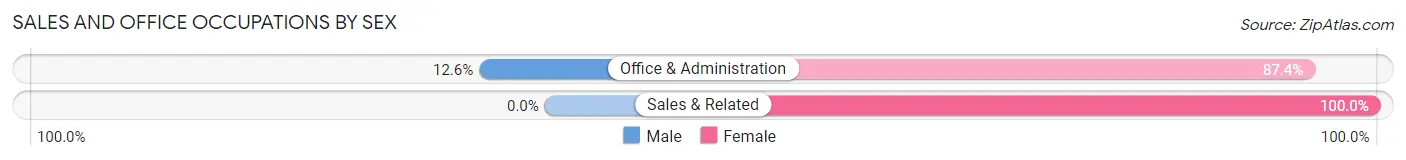
| Occupation | Male | Female |
| Sales & Related | 0 (0.0%) | 78 (100.0%) |
| Office & Administration | 16 (12.6%) | 111 (87.4%) |
| Total (Category) | 16 (7.8%) | 189 (92.2%) |
| Total (Overall) | 492 (50.8%) | 476 (49.2%) |
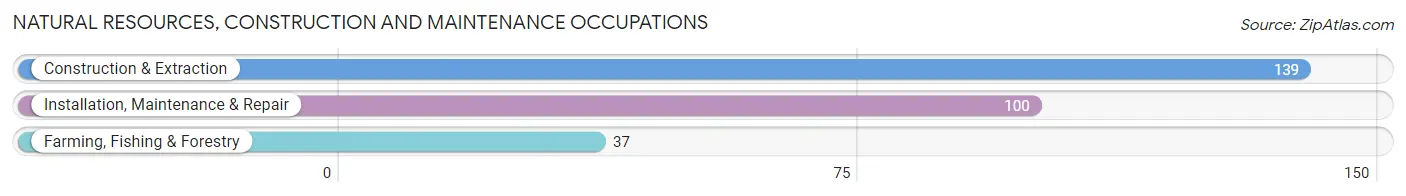
Natural Resources, Construction and Maintenance Occupations
The most common Natural Resources, Construction and Maintenance occupations in Springhill are Construction & Extraction (139 | 14.4%), Installation, Maintenance & Repair (100 | 10.3%), and Farming, Fishing & Forestry (37 | 3.8%).
Natural Resources, Construction and Maintenance Occupations by Sex
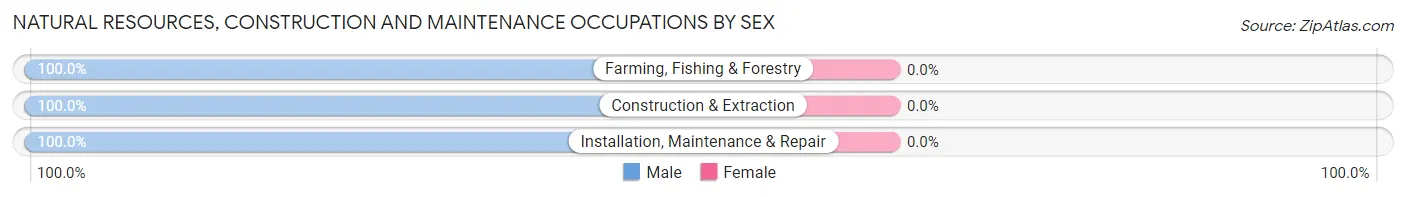
| Occupation | Male | Female |
| Farming, Fishing & Forestry | 37 (100.0%) | 0 (0.0%) |
| Construction & Extraction | 139 (100.0%) | 0 (0.0%) |
| Installation, Maintenance & Repair | 100 (100.0%) | 0 (0.0%) |
| Total (Category) | 276 (100.0%) | 0 (0.0%) |
| Total (Overall) | 492 (50.8%) | 476 (49.2%) |
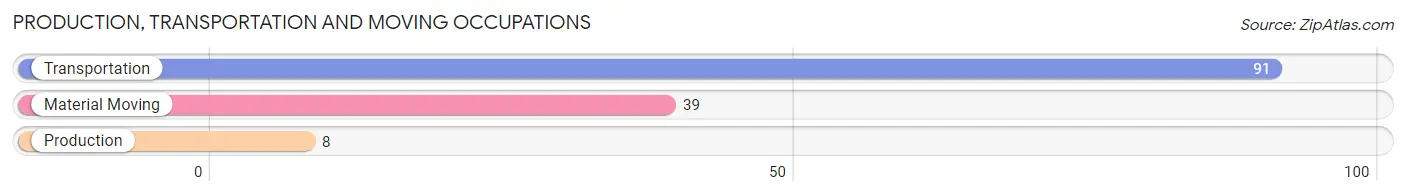
Production, Transportation and Moving Occupations
The most common Production, Transportation and Moving occupations in Springhill are Transportation (91 | 9.4%), Material Moving (39 | 4.0%), and Production (8 | 0.8%).
Production, Transportation and Moving Occupations by Sex
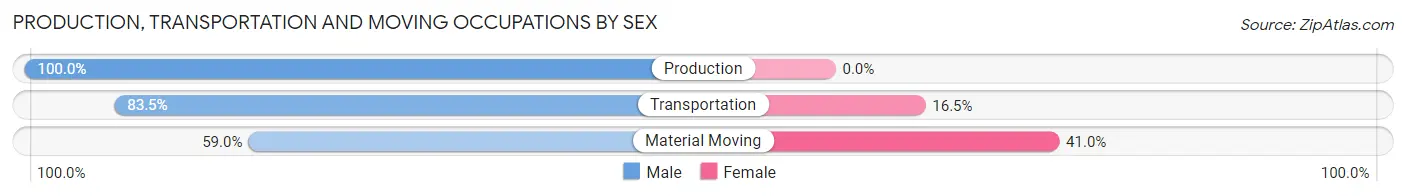
| Occupation | Male | Female |
| Production | 8 (100.0%) | 0 (0.0%) |
| Transportation | 76 (83.5%) | 15 (16.5%) |
| Material Moving | 23 (59.0%) | 16 (41.0%) |
| Total (Category) | 107 (77.5%) | 31 (22.5%) |
| Total (Overall) | 492 (50.8%) | 476 (49.2%) |
Employment Industries by Sex in Springhill
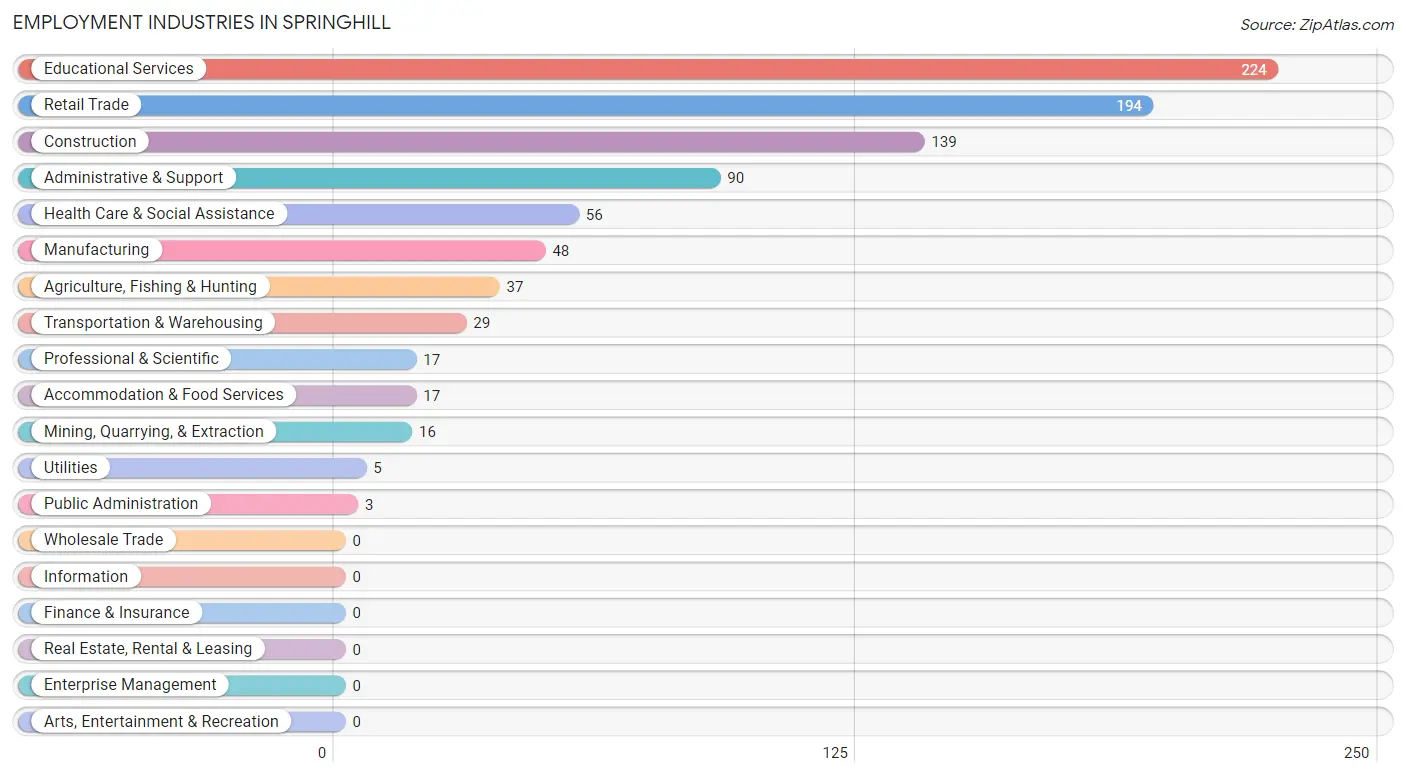
Employment Industries in Springhill
The major employment industries in Springhill include Educational Services (224 | 23.1%), Retail Trade (194 | 20.0%), Construction (139 | 14.4%), Administrative & Support (90 | 9.3%), and Health Care & Social Assistance (56 | 5.8%).
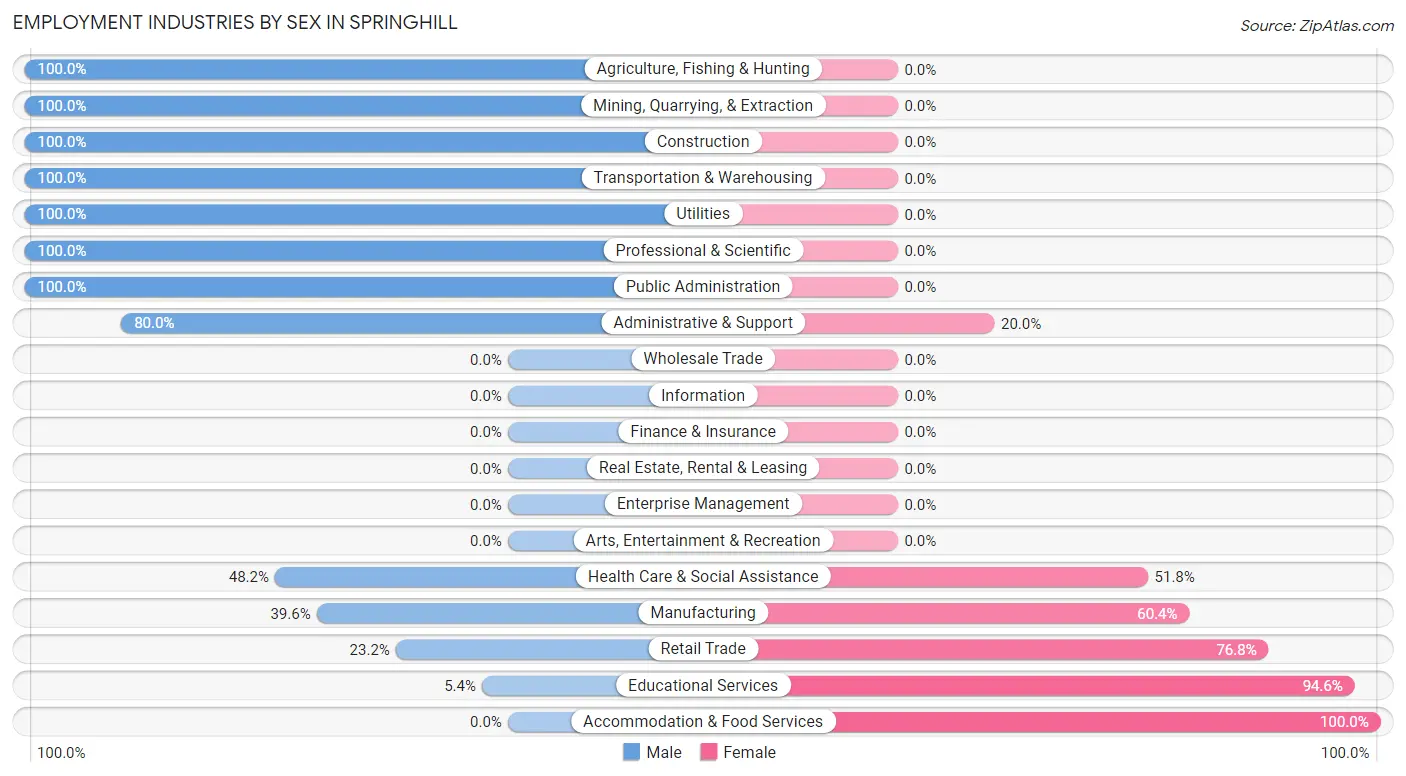
Employment Industries by Sex in Springhill
The Springhill industries that see more men than women are Agriculture, Fishing & Hunting (100.0%), Mining, Quarrying, & Extraction (100.0%), and Construction (100.0%), whereas the industries that tend to have a higher number of women are Accommodation & Food Services (100.0%), Educational Services (94.6%), and Retail Trade (76.8%).
| Industry | Male | Female |
| Agriculture, Fishing & Hunting | 37 (100.0%) | 0 (0.0%) |
| Mining, Quarrying, & Extraction | 16 (100.0%) | 0 (0.0%) |
| Construction | 139 (100.0%) | 0 (0.0%) |
| Manufacturing | 19 (39.6%) | 29 (60.4%) |
| Wholesale Trade | 0 (0.0%) | 0 (0.0%) |
| Retail Trade | 45 (23.2%) | 149 (76.8%) |
| Transportation & Warehousing | 29 (100.0%) | 0 (0.0%) |
| Utilities | 5 (100.0%) | 0 (0.0%) |
| Information | 0 (0.0%) | 0 (0.0%) |
| Finance & Insurance | 0 (0.0%) | 0 (0.0%) |
| Real Estate, Rental & Leasing | 0 (0.0%) | 0 (0.0%) |
| Professional & Scientific | 17 (100.0%) | 0 (0.0%) |
| Enterprise Management | 0 (0.0%) | 0 (0.0%) |
| Administrative & Support | 72 (80.0%) | 18 (20.0%) |
| Educational Services | 12 (5.4%) | 212 (94.6%) |
| Health Care & Social Assistance | 27 (48.2%) | 29 (51.8%) |
| Arts, Entertainment & Recreation | 0 (0.0%) | 0 (0.0%) |
| Accommodation & Food Services | 0 (0.0%) | 17 (100.0%) |
| Public Administration | 3 (100.0%) | 0 (0.0%) |
| Total | 492 (50.8%) | 476 (49.2%) |
Education in Springhill
School Enrollment in Springhill
The most common levels of schooling among the 1,102 students in Springhill are elementary school (370 | 33.6%), middle school (288 | 26.1%), and college / undergraduate (204 | 18.5%).
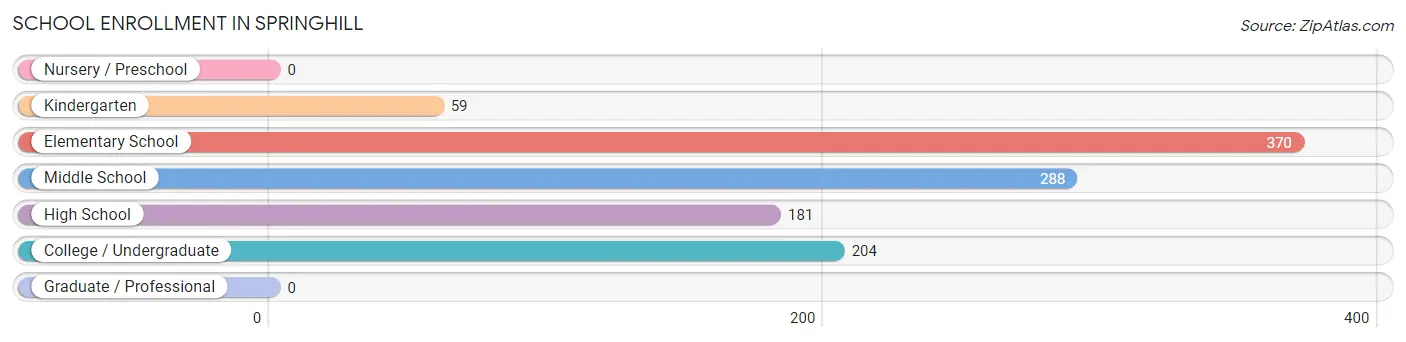
| School Level | # Students | % Students |
| Nursery / Preschool | 0 | 0.0% |
| Kindergarten | 59 | 5.3% |
| Elementary School | 370 | 33.6% |
| Middle School | 288 | 26.1% |
| High School | 181 | 16.4% |
| College / Undergraduate | 204 | 18.5% |
| Graduate / Professional | 0 | 0.0% |
| Total | 1,102 | 100.0% |
School Enrollment by Age by Funding Source in Springhill
Out of a total of 1,102 students who are enrolled in schools in Springhill, 130 (11.8%) attend a private institution, while the remaining 972 (88.2%) are enrolled in public schools. The age group of 35 years and over has the highest likelihood of being enrolled in private schools, with 16 (94.1% in the age bracket) enrolled. Conversely, the age group of 5 to 9 year old has the lowest likelihood of being enrolled in a private school, with 294 (100.0% in the age bracket) attending a public institution.
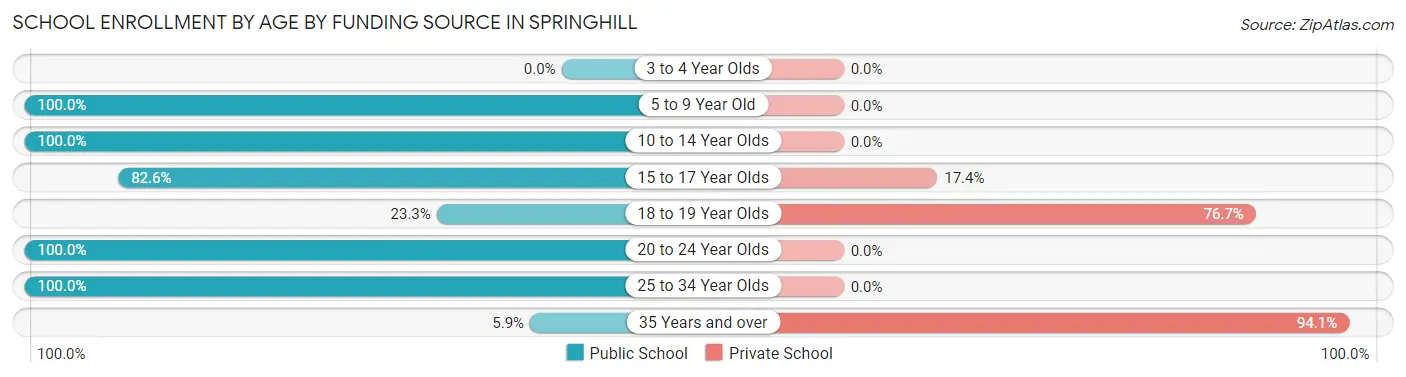
| Age Bracket | Public School | Private School |
| 3 to 4 Year Olds | 0 (0.0%) | 0 (0.0%) |
| 5 to 9 Year Old | 294 (100.0%) | 0 (0.0%) |
| 10 to 14 Year Olds | 518 (100.0%) | 0 (0.0%) |
| 15 to 17 Year Olds | 71 (82.6%) | 15 (17.4%) |
| 18 to 19 Year Olds | 30 (23.3%) | 99 (76.7%) |
| 20 to 24 Year Olds | 17 (100.0%) | 0 (0.0%) |
| 25 to 34 Year Olds | 41 (100.0%) | 0 (0.0%) |
| 35 Years and over | 1 (5.9%) | 16 (94.1%) |
| Total | 972 (88.2%) | 130 (11.8%) |
Educational Attainment by Field of Study in Springhill
Education (175 | 63.2%), business (31 | 11.2%), arts & humanities (20 | 7.2%), social sciences (19 | 6.9%), and engineering (15 | 5.4%) are the most common fields of study among 277 individuals in Springhill who have obtained a bachelor's degree or higher.
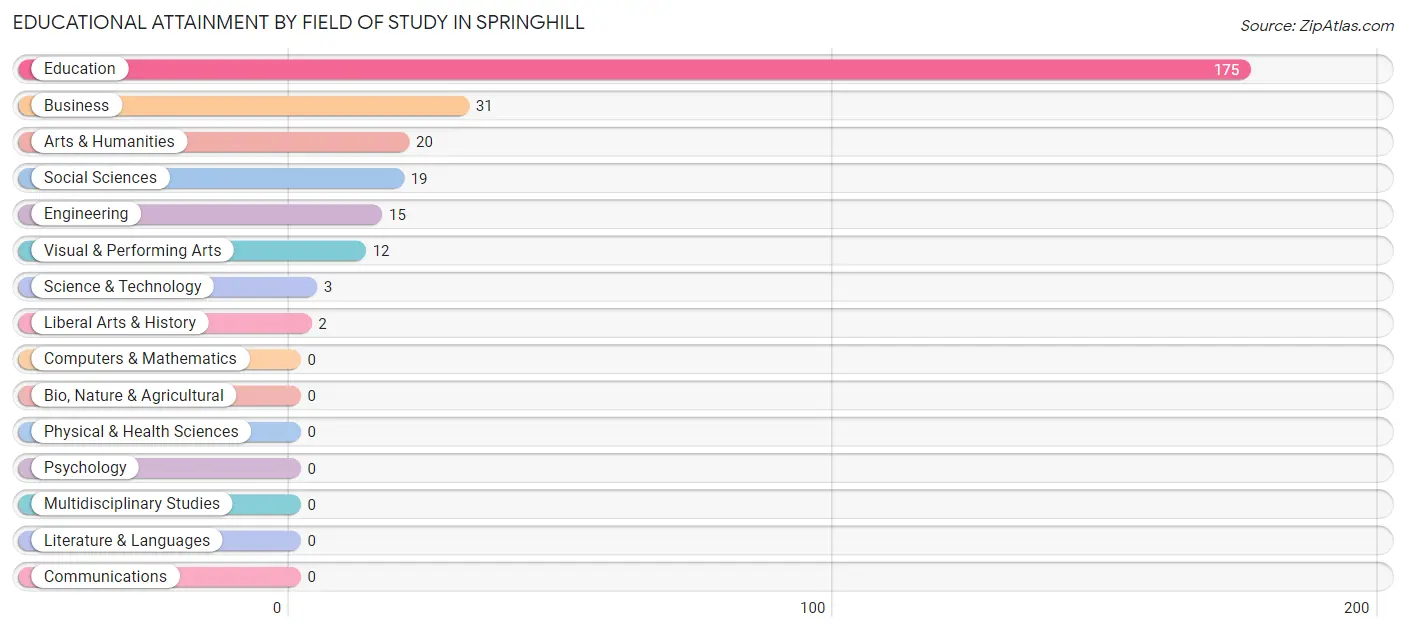
| Field of Study | # Graduates | % Graduates |
| Computers & Mathematics | 0 | 0.0% |
| Bio, Nature & Agricultural | 0 | 0.0% |
| Physical & Health Sciences | 0 | 0.0% |
| Psychology | 0 | 0.0% |
| Social Sciences | 19 | 6.9% |
| Engineering | 15 | 5.4% |
| Multidisciplinary Studies | 0 | 0.0% |
| Science & Technology | 3 | 1.1% |
| Business | 31 | 11.2% |
| Education | 175 | 63.2% |
| Literature & Languages | 0 | 0.0% |
| Liberal Arts & History | 2 | 0.7% |
| Visual & Performing Arts | 12 | 4.3% |
| Communications | 0 | 0.0% |
| Arts & Humanities | 20 | 7.2% |
| Total | 277 | 100.0% |
Transportation & Commute in Springhill
Vehicle Availability by Sex in Springhill
The most prevalent vehicle ownership categories in Springhill are males with 1 vehicle (221, accounting for 44.9%) and females with 1 vehicle (39, making up 49.1%).
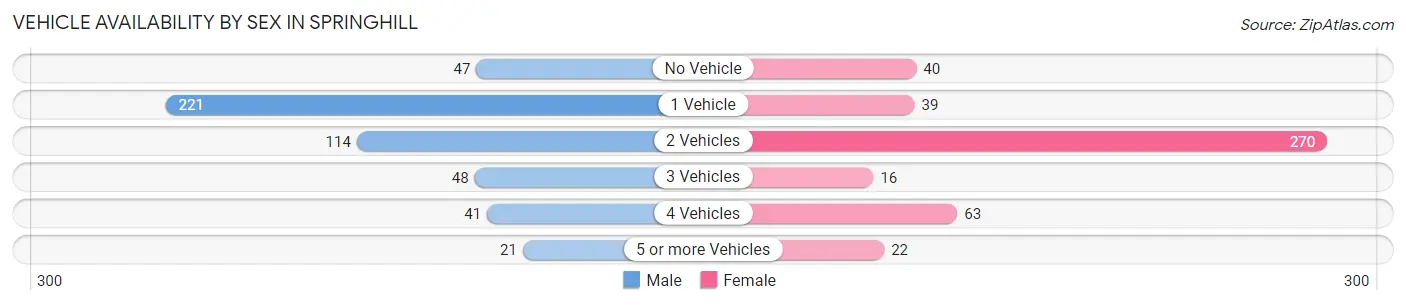
| Vehicles Available | Male | Female |
| No Vehicle | 47 (9.6%) | 40 (8.9%) |
| 1 Vehicle | 221 (44.9%) | 39 (8.7%) |
| 2 Vehicles | 114 (23.2%) | 270 (60.0%) |
| 3 Vehicles | 48 (9.8%) | 16 (3.6%) |
| 4 Vehicles | 41 (8.3%) | 63 (14.0%) |
| 5 or more Vehicles | 21 (4.3%) | 22 (4.9%) |
| Total | 492 (100.0%) | 450 (100.0%) |
Commute Time in Springhill
The most frequently occuring commute durations in Springhill are 10 to 14 minutes (214 commuters, 25.6%), 5 to 9 minutes (190 commuters, 22.8%), and 30 to 34 minutes (134 commuters, 16.1%).
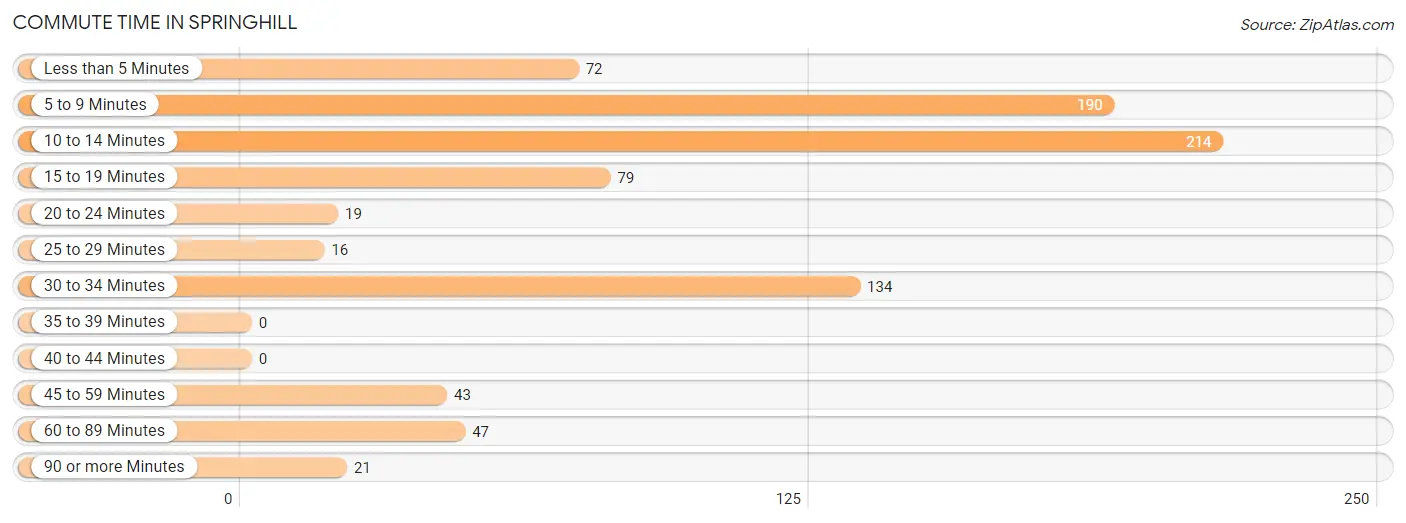
| Commute Time | # Commuters | % Commuters |
| Less than 5 Minutes | 72 | 8.6% |
| 5 to 9 Minutes | 190 | 22.8% |
| 10 to 14 Minutes | 214 | 25.6% |
| 15 to 19 Minutes | 79 | 9.5% |
| 20 to 24 Minutes | 19 | 2.3% |
| 25 to 29 Minutes | 16 | 1.9% |
| 30 to 34 Minutes | 134 | 16.1% |
| 35 to 39 Minutes | 0 | 0.0% |
| 40 to 44 Minutes | 0 | 0.0% |
| 45 to 59 Minutes | 43 | 5.1% |
| 60 to 89 Minutes | 47 | 5.6% |
| 90 or more Minutes | 21 | 2.5% |
Commute Time by Sex in Springhill
The most common commute times in Springhill are 30 to 34 minutes (134 commuters, 31.6%) for males and 10 to 14 minutes (191 commuters, 46.5%) for females.
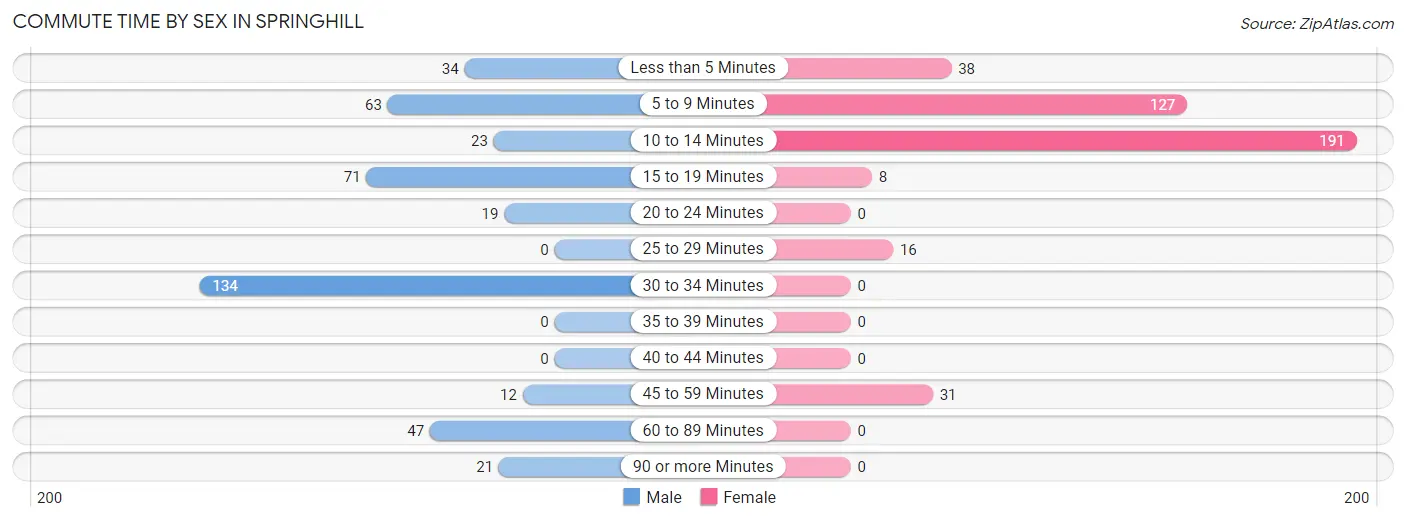
| Commute Time | Male | Female |
| Less than 5 Minutes | 34 (8.0%) | 38 (9.2%) |
| 5 to 9 Minutes | 63 (14.9%) | 127 (30.9%) |
| 10 to 14 Minutes | 23 (5.4%) | 191 (46.5%) |
| 15 to 19 Minutes | 71 (16.8%) | 8 (1.9%) |
| 20 to 24 Minutes | 19 (4.5%) | 0 (0.0%) |
| 25 to 29 Minutes | 0 (0.0%) | 16 (3.9%) |
| 30 to 34 Minutes | 134 (31.6%) | 0 (0.0%) |
| 35 to 39 Minutes | 0 (0.0%) | 0 (0.0%) |
| 40 to 44 Minutes | 0 (0.0%) | 0 (0.0%) |
| 45 to 59 Minutes | 12 (2.8%) | 31 (7.5%) |
| 60 to 89 Minutes | 47 (11.1%) | 0 (0.0%) |
| 90 or more Minutes | 21 (5.0%) | 0 (0.0%) |
Time of Departure to Work by Sex in Springhill
The most frequent times of departure to work in Springhill are 7:00 AM to 7:29 AM (113, 26.7%) for males and 6:30 AM to 6:59 AM (91, 22.1%) for females.
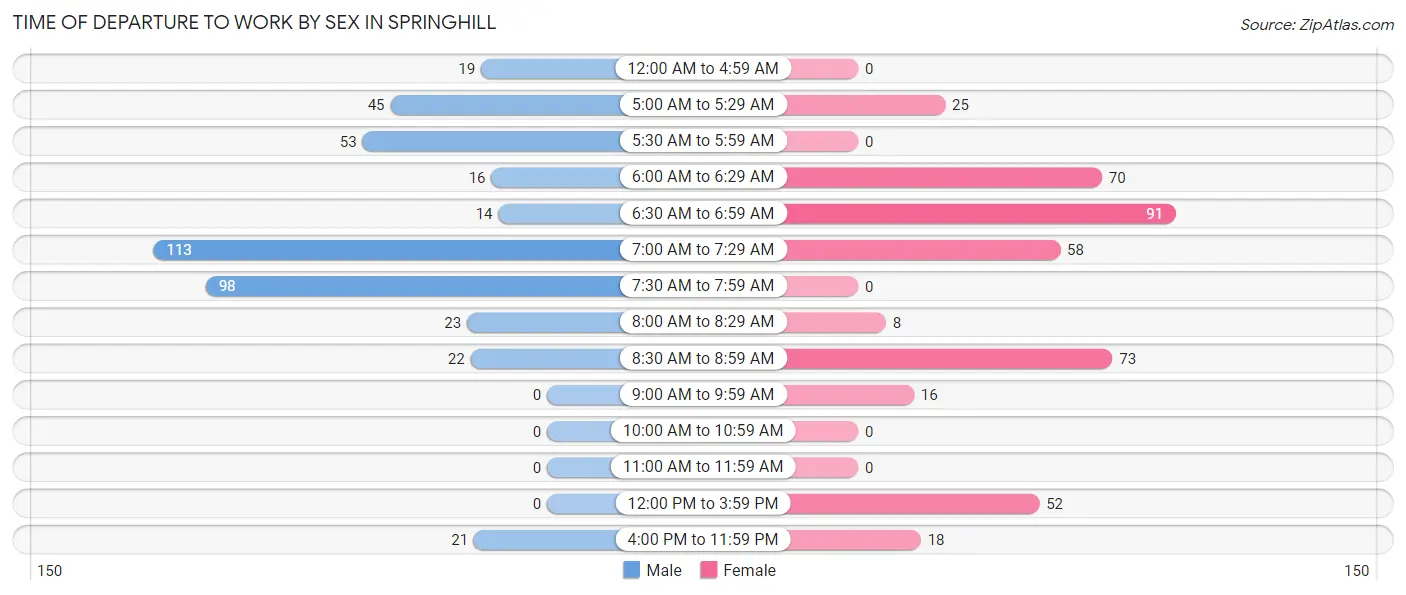
| Time of Departure | Male | Female |
| 12:00 AM to 4:59 AM | 19 (4.5%) | 0 (0.0%) |
| 5:00 AM to 5:29 AM | 45 (10.6%) | 25 (6.1%) |
| 5:30 AM to 5:59 AM | 53 (12.5%) | 0 (0.0%) |
| 6:00 AM to 6:29 AM | 16 (3.8%) | 70 (17.0%) |
| 6:30 AM to 6:59 AM | 14 (3.3%) | 91 (22.1%) |
| 7:00 AM to 7:29 AM | 113 (26.7%) | 58 (14.1%) |
| 7:30 AM to 7:59 AM | 98 (23.1%) | 0 (0.0%) |
| 8:00 AM to 8:29 AM | 23 (5.4%) | 8 (1.9%) |
| 8:30 AM to 8:59 AM | 22 (5.2%) | 73 (17.8%) |
| 9:00 AM to 9:59 AM | 0 (0.0%) | 16 (3.9%) |
| 10:00 AM to 10:59 AM | 0 (0.0%) | 0 (0.0%) |
| 11:00 AM to 11:59 AM | 0 (0.0%) | 0 (0.0%) |
| 12:00 PM to 3:59 PM | 0 (0.0%) | 52 (12.7%) |
| 4:00 PM to 11:59 PM | 21 (5.0%) | 18 (4.4%) |
| Total | 424 (100.0%) | 411 (100.0%) |
Housing Occupancy in Springhill
Occupancy by Ownership in Springhill
Of the total 1,960 dwellings in Springhill, owner-occupied units account for 866 (44.2%), while renter-occupied units make up 1,094 (55.8%).
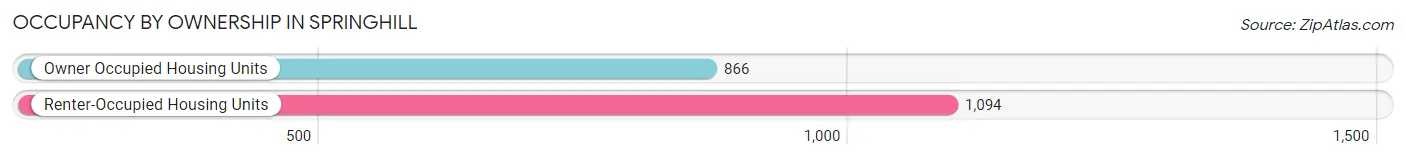
| Occupancy | # Housing Units | % Housing Units |
| Owner Occupied Housing Units | 866 | 44.2% |
| Renter-Occupied Housing Units | 1,094 | 55.8% |
| Total Occupied Housing Units | 1,960 | 100.0% |
Occupancy by Household Size in Springhill
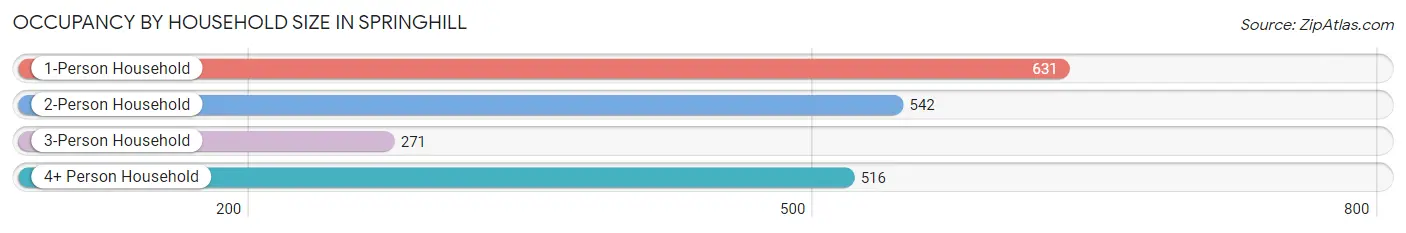
| Household Size | # Housing Units | % Housing Units |
| 1-Person Household | 631 | 32.2% |
| 2-Person Household | 542 | 27.7% |
| 3-Person Household | 271 | 13.8% |
| 4+ Person Household | 516 | 26.3% |
| Total Housing Units | 1,960 | 100.0% |
Occupancy by Ownership by Household Size in Springhill
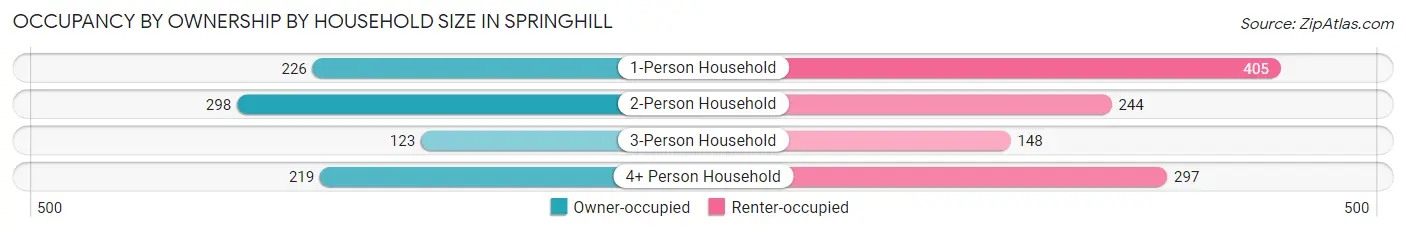
| Household Size | Owner-occupied | Renter-occupied |
| 1-Person Household | 226 (35.8%) | 405 (64.2%) |
| 2-Person Household | 298 (55.0%) | 244 (45.0%) |
| 3-Person Household | 123 (45.4%) | 148 (54.6%) |
| 4+ Person Household | 219 (42.4%) | 297 (57.6%) |
| Total Housing Units | 866 (44.2%) | 1,094 (55.8%) |
Occupancy by Educational Attainment in Springhill
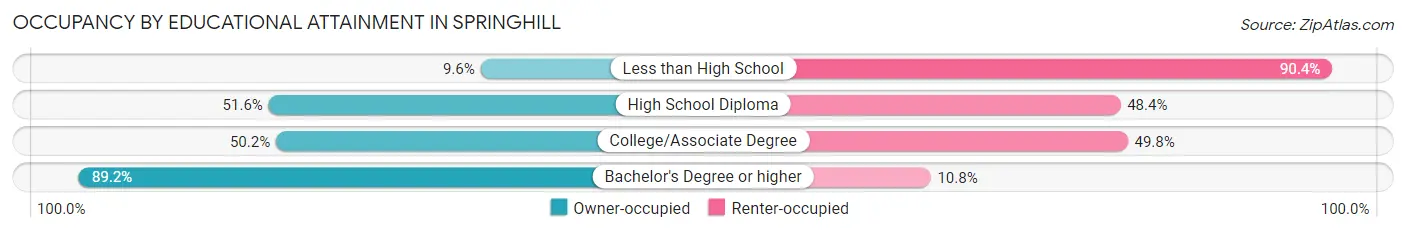
| Household Size | Owner-occupied | Renter-occupied |
| Less than High School | 48 (9.6%) | 452 (90.4%) |
| High School Diploma | 337 (51.6%) | 316 (48.4%) |
| College/Associate Degree | 307 (50.2%) | 305 (49.8%) |
| Bachelor's Degree or higher | 174 (89.2%) | 21 (10.8%) |
Occupancy by Age of Householder in Springhill
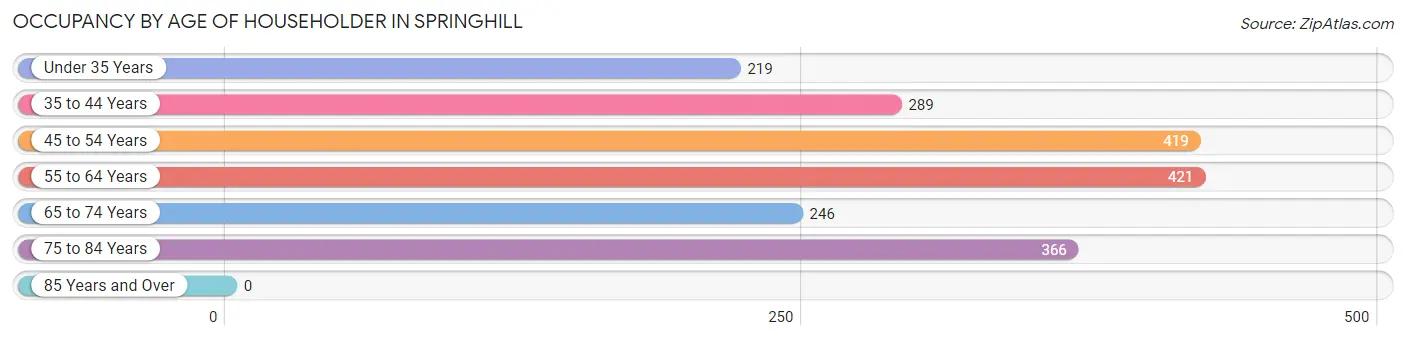
| Age Bracket | # Households | % Households |
| Under 35 Years | 219 | 11.2% |
| 35 to 44 Years | 289 | 14.7% |
| 45 to 54 Years | 419 | 21.4% |
| 55 to 64 Years | 421 | 21.5% |
| 65 to 74 Years | 246 | 12.6% |
| 75 to 84 Years | 366 | 18.7% |
| 85 Years and Over | 0 | 0.0% |
| Total | 1,960 | 100.0% |
Housing Finances in Springhill
Median Income by Occupancy in Springhill
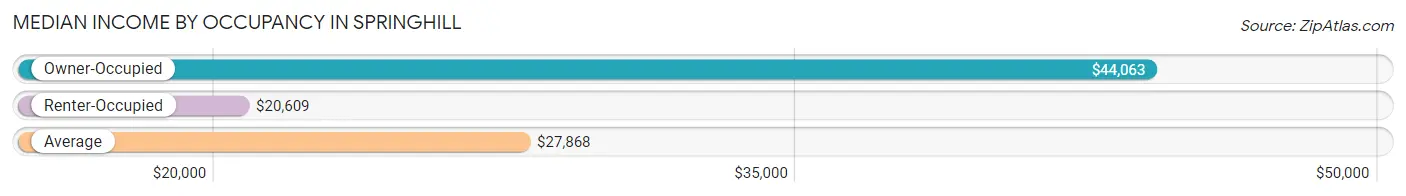
| Occupancy Type | # Households | Median Income |
| Owner-Occupied | 866 (44.2%) | $44,063 |
| Renter-Occupied | 1,094 (55.8%) | $20,609 |
| Average | 1,960 (100.0%) | $27,868 |
Occupancy by Householder Income Bracket in Springhill
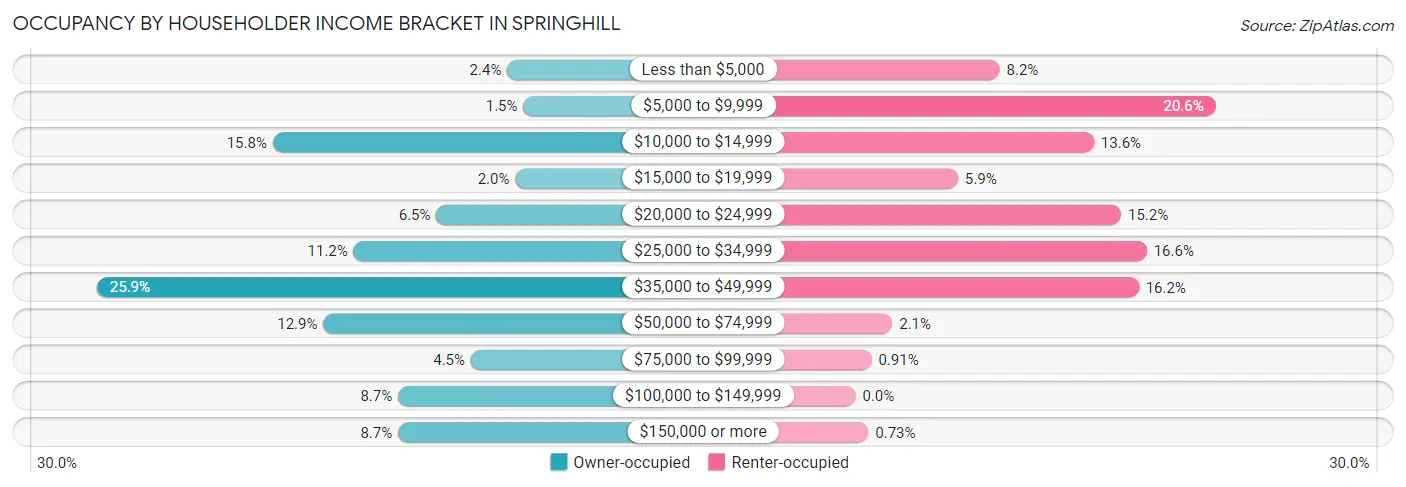
| Income Bracket | Owner-occupied | Renter-occupied |
| Less than $5,000 | 21 (2.4%) | 90 (8.2%) |
| $5,000 to $9,999 | 13 (1.5%) | 225 (20.6%) |
| $10,000 to $14,999 | 137 (15.8%) | 149 (13.6%) |
| $15,000 to $19,999 | 17 (2.0%) | 64 (5.9%) |
| $20,000 to $24,999 | 56 (6.5%) | 166 (15.2%) |
| $25,000 to $34,999 | 97 (11.2%) | 182 (16.6%) |
| $35,000 to $49,999 | 224 (25.9%) | 177 (16.2%) |
| $50,000 to $74,999 | 112 (12.9%) | 23 (2.1%) |
| $75,000 to $99,999 | 39 (4.5%) | 10 (0.9%) |
| $100,000 to $149,999 | 75 (8.7%) | 0 (0.0%) |
| $150,000 or more | 75 (8.7%) | 8 (0.7%) |
| Total | 866 (100.0%) | 1,094 (100.0%) |
Monthly Housing Cost Tiers in Springhill
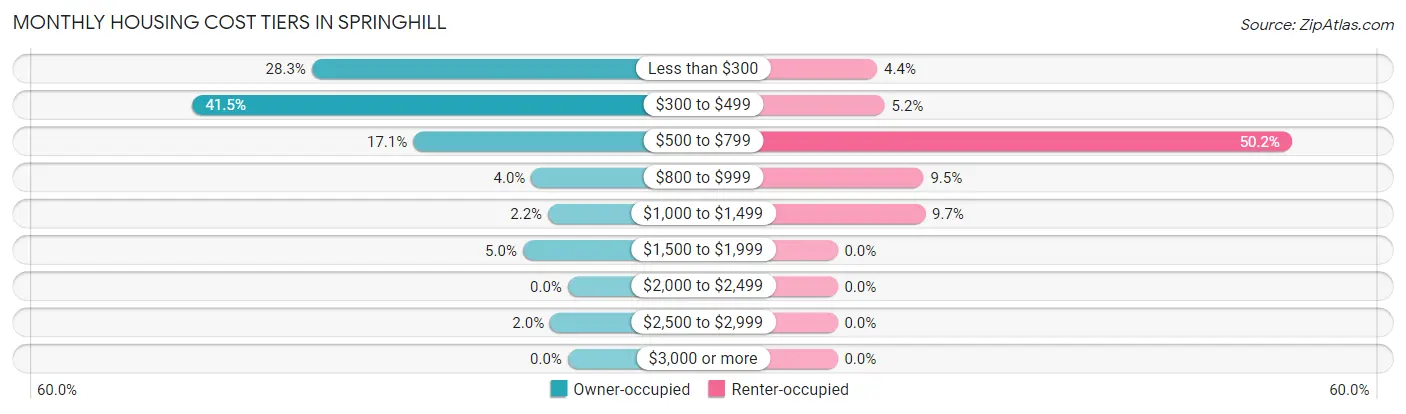
| Monthly Cost | Owner-occupied | Renter-occupied |
| Less than $300 | 245 (28.3%) | 48 (4.4%) |
| $300 to $499 | 359 (41.4%) | 57 (5.2%) |
| $500 to $799 | 148 (17.1%) | 549 (50.2%) |
| $800 to $999 | 35 (4.0%) | 104 (9.5%) |
| $1,000 to $1,499 | 19 (2.2%) | 106 (9.7%) |
| $1,500 to $1,999 | 43 (5.0%) | 0 (0.0%) |
| $2,000 to $2,499 | 0 (0.0%) | 0 (0.0%) |
| $2,500 to $2,999 | 17 (2.0%) | 0 (0.0%) |
| $3,000 or more | 0 (0.0%) | 0 (0.0%) |
| Total | 866 (100.0%) | 1,094 (100.0%) |
Physical Housing Characteristics in Springhill
Housing Structures in Springhill
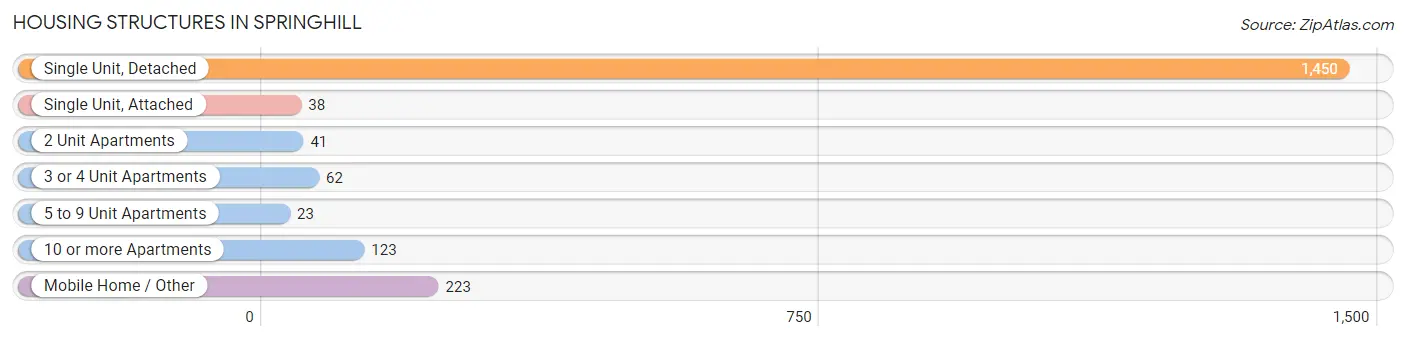
| Structure Type | # Housing Units | % Housing Units |
| Single Unit, Detached | 1,450 | 74.0% |
| Single Unit, Attached | 38 | 1.9% |
| 2 Unit Apartments | 41 | 2.1% |
| 3 or 4 Unit Apartments | 62 | 3.2% |
| 5 to 9 Unit Apartments | 23 | 1.2% |
| 10 or more Apartments | 123 | 6.3% |
| Mobile Home / Other | 223 | 11.4% |
| Total | 1,960 | 100.0% |
Housing Structures by Occupancy in Springhill
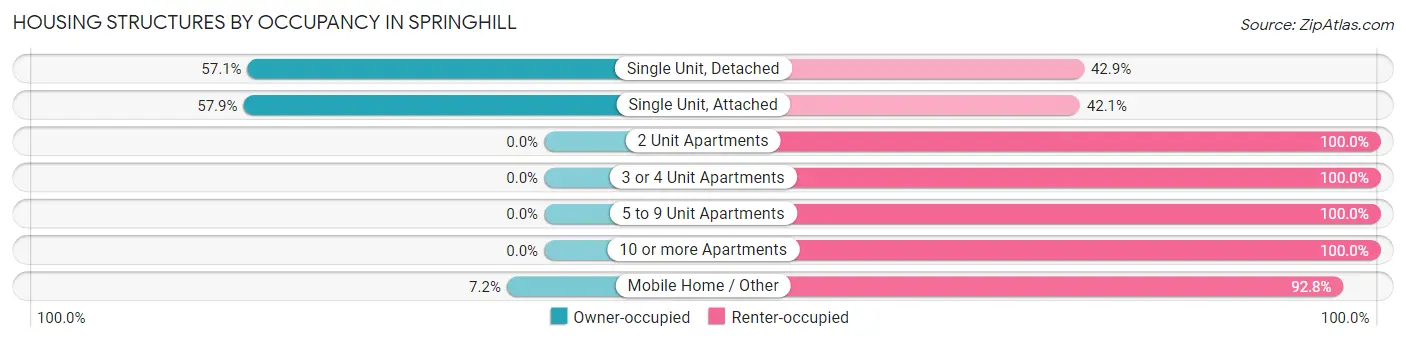
| Structure Type | Owner-occupied | Renter-occupied |
| Single Unit, Detached | 828 (57.1%) | 622 (42.9%) |
| Single Unit, Attached | 22 (57.9%) | 16 (42.1%) |
| 2 Unit Apartments | 0 (0.0%) | 41 (100.0%) |
| 3 or 4 Unit Apartments | 0 (0.0%) | 62 (100.0%) |
| 5 to 9 Unit Apartments | 0 (0.0%) | 23 (100.0%) |
| 10 or more Apartments | 0 (0.0%) | 123 (100.0%) |
| Mobile Home / Other | 16 (7.2%) | 207 (92.8%) |
| Total | 866 (44.2%) | 1,094 (55.8%) |
Housing Structures by Number of Rooms in Springhill
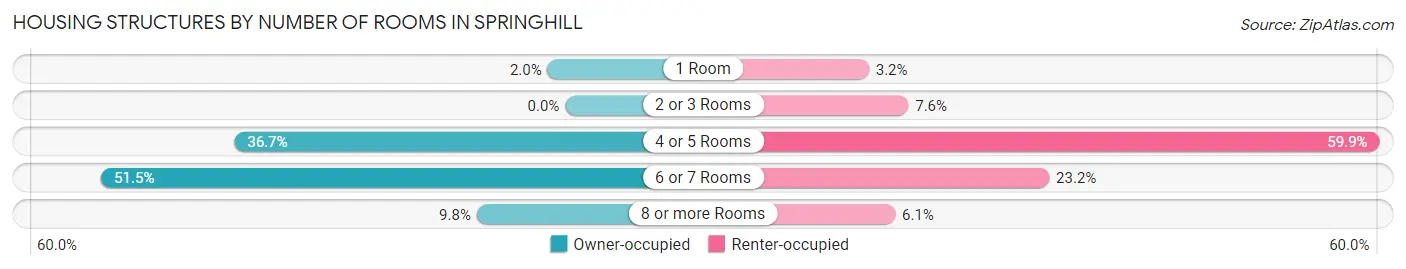
| Number of Rooms | Owner-occupied | Renter-occupied |
| 1 Room | 17 (2.0%) | 35 (3.2%) |
| 2 or 3 Rooms | 0 (0.0%) | 83 (7.6%) |
| 4 or 5 Rooms | 318 (36.7%) | 655 (59.9%) |
| 6 or 7 Rooms | 446 (51.5%) | 254 (23.2%) |
| 8 or more Rooms | 85 (9.8%) | 67 (6.1%) |
| Total | 866 (100.0%) | 1,094 (100.0%) |
Housing Structure by Heating Type in Springhill
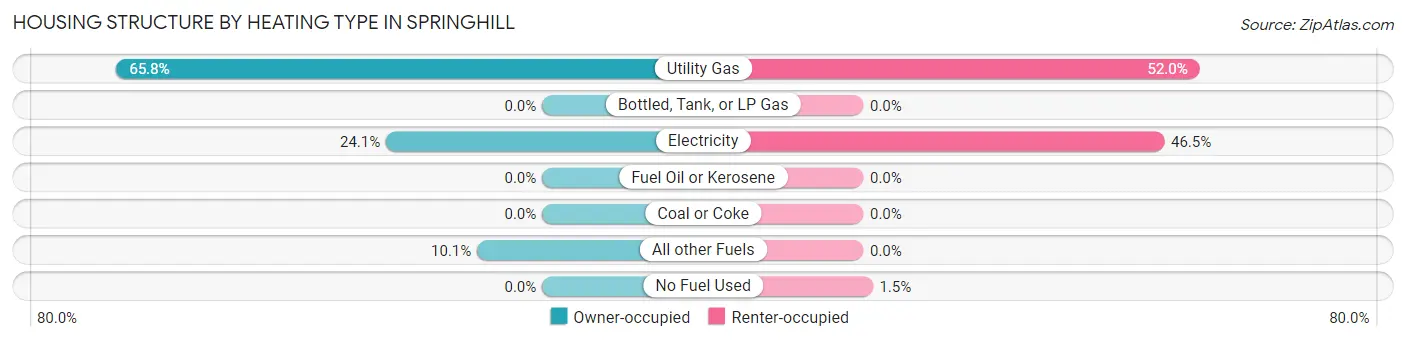
| Heating Type | Owner-occupied | Renter-occupied |
| Utility Gas | 570 (65.8%) | 569 (52.0%) |
| Bottled, Tank, or LP Gas | 0 (0.0%) | 0 (0.0%) |
| Electricity | 209 (24.1%) | 509 (46.5%) |
| Fuel Oil or Kerosene | 0 (0.0%) | 0 (0.0%) |
| Coal or Coke | 0 (0.0%) | 0 (0.0%) |
| All other Fuels | 87 (10.1%) | 0 (0.0%) |
| No Fuel Used | 0 (0.0%) | 16 (1.5%) |
| Total | 866 (100.0%) | 1,094 (100.0%) |
Household Vehicle Usage in Springhill
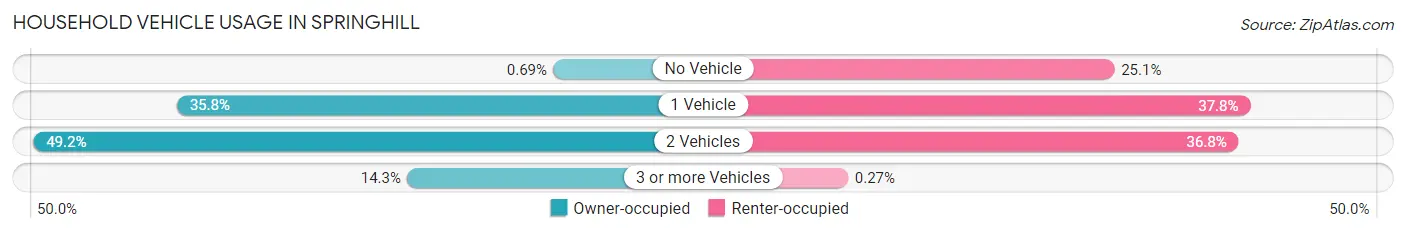
| Vehicles per Household | Owner-occupied | Renter-occupied |
| No Vehicle | 6 (0.7%) | 275 (25.1%) |
| 1 Vehicle | 310 (35.8%) | 414 (37.8%) |
| 2 Vehicles | 426 (49.2%) | 402 (36.7%) |
| 3 or more Vehicles | 124 (14.3%) | 3 (0.3%) |
| Total | 866 (100.0%) | 1,094 (100.0%) |
Real Estate & Mortgages in Springhill
Real Estate and Mortgage Overview in Springhill
| Characteristic | Without Mortgage | With Mortgage |
| Housing Units | 692 | 174 |
| Median Property Value | $98,900 | $0 |
| Median Household Income | $43,281 | $53 |
| Monthly Housing Costs | $330 | $0 |
| Real Estate Taxes | $199 | $0 |
Property Value by Mortgage Status in Springhill
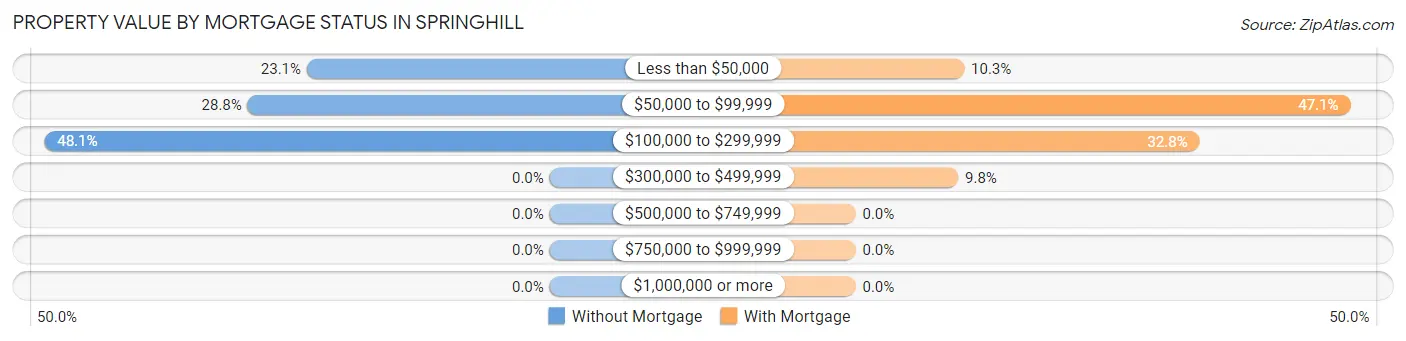
| Property Value | Without Mortgage | With Mortgage |
| Less than $50,000 | 160 (23.1%) | 18 (10.3%) |
| $50,000 to $99,999 | 199 (28.8%) | 82 (47.1%) |
| $100,000 to $299,999 | 333 (48.1%) | 57 (32.8%) |
| $300,000 to $499,999 | 0 (0.0%) | 17 (9.8%) |
| $500,000 to $749,999 | 0 (0.0%) | 0 (0.0%) |
| $750,000 to $999,999 | 0 (0.0%) | 0 (0.0%) |
| $1,000,000 or more | 0 (0.0%) | 0 (0.0%) |
| Total | 692 (100.0%) | 174 (100.0%) |
Household Income by Mortgage Status in Springhill
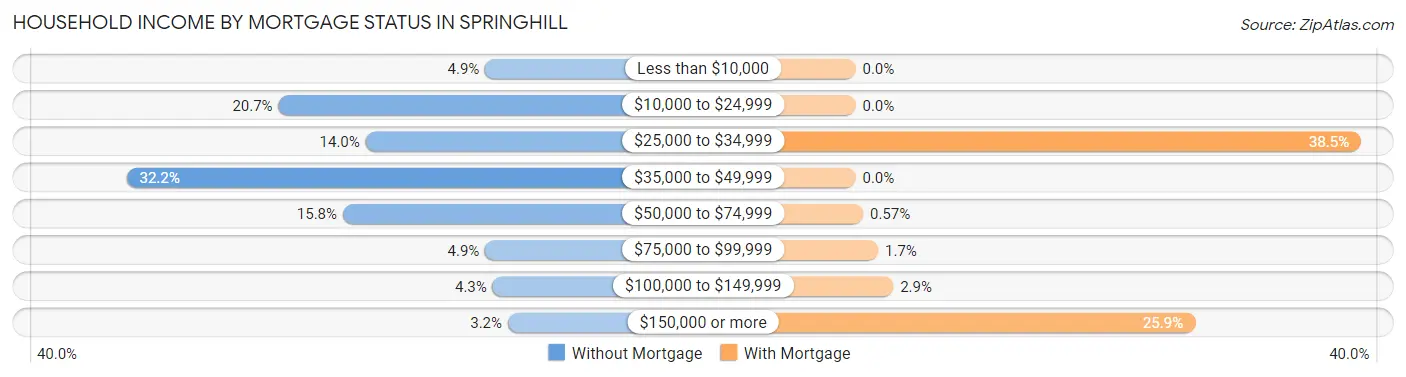
| Household Income | Without Mortgage | With Mortgage |
| Less than $10,000 | 34 (4.9%) | 0 (0.0%) |
| $10,000 to $24,999 | 143 (20.7%) | 0 (0.0%) |
| $25,000 to $34,999 | 97 (14.0%) | 67 (38.5%) |
| $35,000 to $49,999 | 223 (32.2%) | 0 (0.0%) |
| $50,000 to $74,999 | 109 (15.8%) | 1 (0.6%) |
| $75,000 to $99,999 | 34 (4.9%) | 3 (1.7%) |
| $100,000 to $149,999 | 30 (4.3%) | 5 (2.9%) |
| $150,000 or more | 22 (3.2%) | 45 (25.9%) |
| Total | 692 (100.0%) | 174 (100.0%) |
Property Value to Household Income Ratio in Springhill
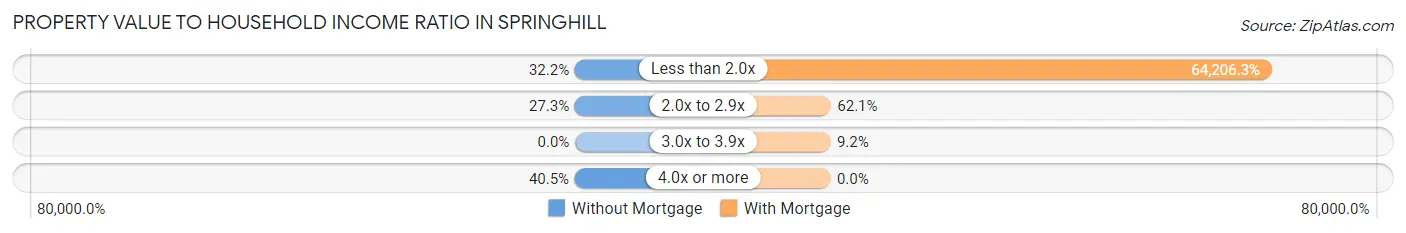
| Value-to-Income Ratio | Without Mortgage | With Mortgage |
| Less than 2.0x | 223 (32.2%) | 111,719 (64,206.3%) |
| 2.0x to 2.9x | 189 (27.3%) | 108 (62.1%) |
| 3.0x to 3.9x | 0 (0.0%) | 16 (9.2%) |
| 4.0x or more | 280 (40.5%) | 0 (0.0%) |
| Total | 692 (100.0%) | 174 (100.0%) |
Real Estate Taxes by Mortgage Status in Springhill
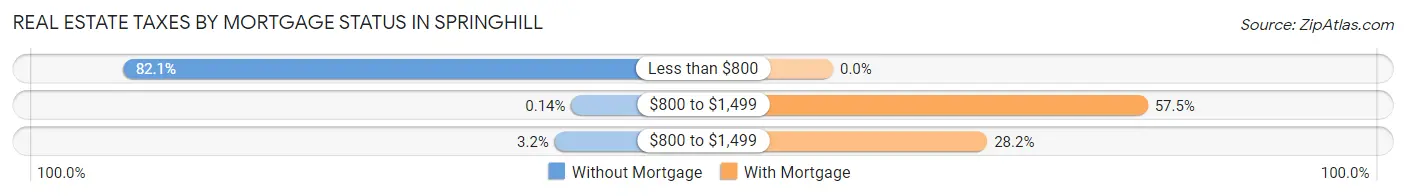
| Property Taxes | Without Mortgage | With Mortgage |
| Less than $800 | 568 (82.1%) | 0 (0.0%) |
| $800 to $1,499 | 1 (0.1%) | 100 (57.5%) |
| $800 to $1,499 | 22 (3.2%) | 49 (28.2%) |
| Total | 692 (100.0%) | 174 (100.0%) |
Health & Disability in Springhill
Health Insurance Coverage by Age in Springhill
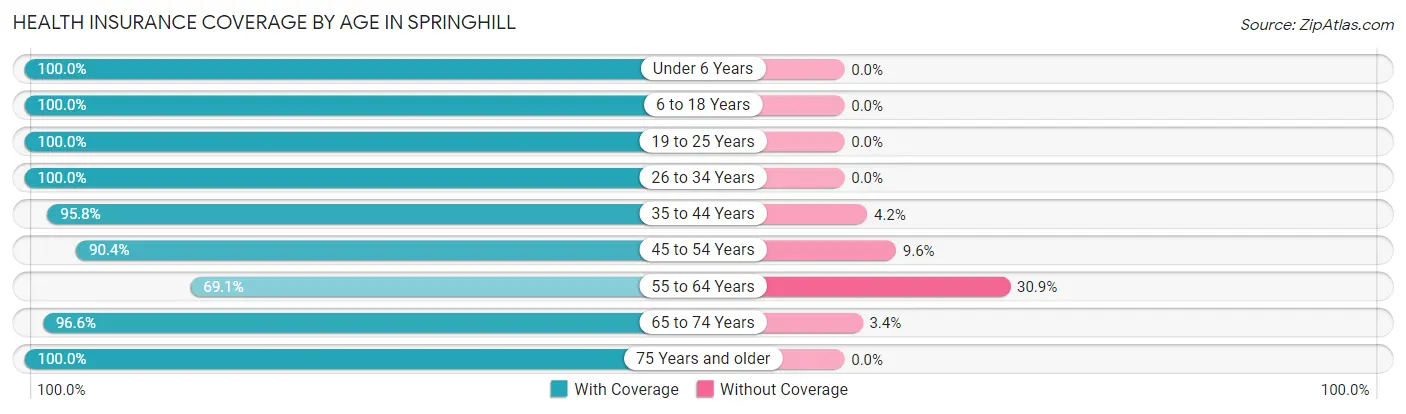
| Age Bracket | With Coverage | Without Coverage |
| Under 6 Years | 286 (100.0%) | 0 (0.0%) |
| 6 to 18 Years | 853 (100.0%) | 0 (0.0%) |
| 19 to 25 Years | 405 (100.0%) | 0 (0.0%) |
| 26 to 34 Years | 230 (100.0%) | 0 (0.0%) |
| 35 to 44 Years | 452 (95.8%) | 20 (4.2%) |
| 45 to 54 Years | 668 (90.4%) | 71 (9.6%) |
| 55 to 64 Years | 465 (69.1%) | 208 (30.9%) |
| 65 to 74 Years | 400 (96.6%) | 14 (3.4%) |
| 75 Years and older | 581 (100.0%) | 0 (0.0%) |
| Total | 4,340 (93.3%) | 313 (6.7%) |
Health Insurance Coverage by Citizenship Status in Springhill
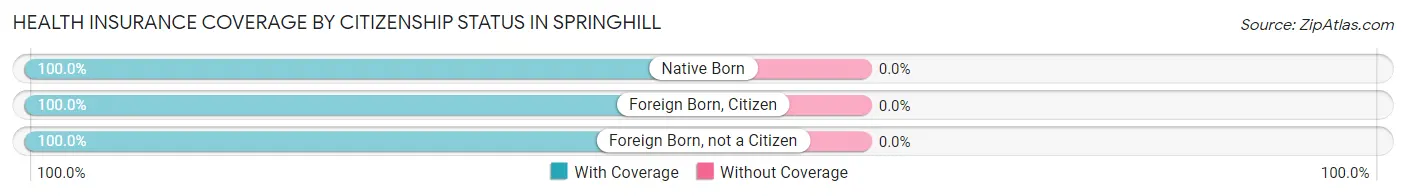
| Citizenship Status | With Coverage | Without Coverage |
| Native Born | 286 (100.0%) | 0 (0.0%) |
| Foreign Born, Citizen | 853 (100.0%) | 0 (0.0%) |
| Foreign Born, not a Citizen | 405 (100.0%) | 0 (0.0%) |
Health Insurance Coverage by Household Income in Springhill
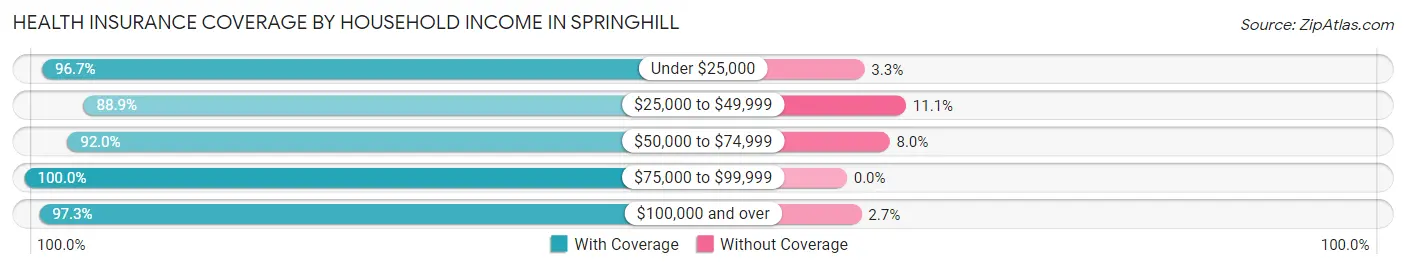
| Household Income | With Coverage | Without Coverage |
| Under $25,000 | 1,671 (96.7%) | 57 (3.3%) |
| $25,000 to $49,999 | 1,727 (88.9%) | 215 (11.1%) |
| $50,000 to $74,999 | 310 (92.0%) | 27 (8.0%) |
| $75,000 to $99,999 | 118 (100.0%) | 0 (0.0%) |
| $100,000 and over | 497 (97.3%) | 14 (2.7%) |
Public vs Private Health Insurance Coverage by Age in Springhill
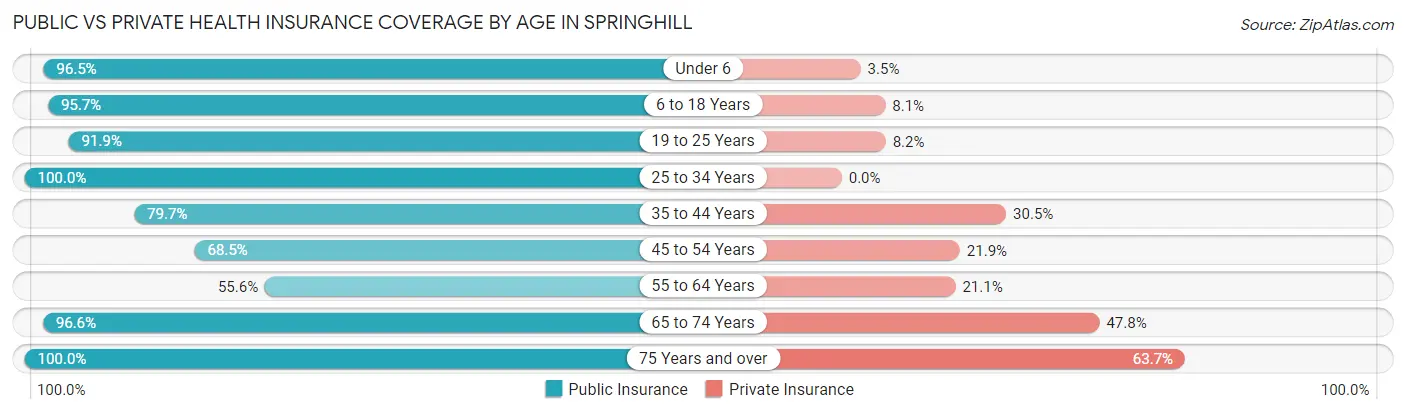
| Age Bracket | Public Insurance | Private Insurance |
| Under 6 | 276 (96.5%) | 10 (3.5%) |
| 6 to 18 Years | 816 (95.7%) | 69 (8.1%) |
| 19 to 25 Years | 372 (91.8%) | 33 (8.2%) |
| 25 to 34 Years | 230 (100.0%) | 0 (0.0%) |
| 35 to 44 Years | 376 (79.7%) | 144 (30.5%) |
| 45 to 54 Years | 506 (68.5%) | 162 (21.9%) |
| 55 to 64 Years | 374 (55.6%) | 142 (21.1%) |
| 65 to 74 Years | 400 (96.6%) | 198 (47.8%) |
| 75 Years and over | 581 (100.0%) | 370 (63.7%) |
| Total | 3,931 (84.5%) | 1,128 (24.2%) |
Disability Status by Sex by Age in Springhill
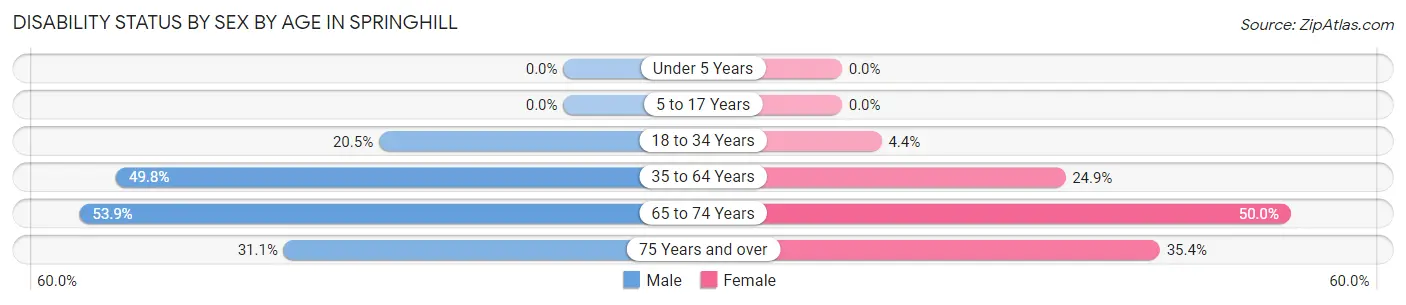
| Age Bracket | Male | Female |
| Under 5 Years | 0 (0.0%) | 0 (0.0%) |
| 5 to 17 Years | 0 (0.0%) | 0 (0.0%) |
| 18 to 34 Years | 39 (20.5%) | 20 (4.4%) |
| 35 to 64 Years | 398 (49.8%) | 270 (24.9%) |
| 65 to 74 Years | 97 (53.9%) | 117 (50.0%) |
| 75 Years and over | 71 (31.1%) | 125 (35.4%) |
Disability Class by Sex by Age in Springhill
Disability Class: Hearing Difficulty
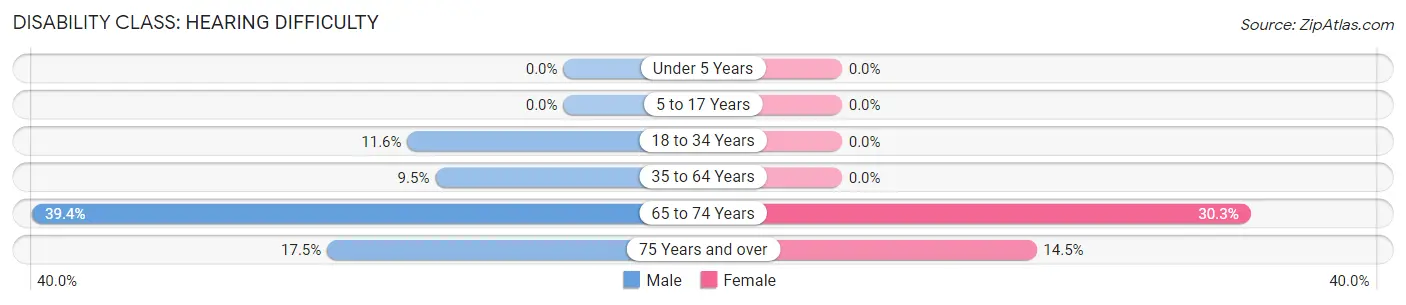
| Age Bracket | Male | Female |
| Under 5 Years | 0 (0.0%) | 0 (0.0%) |
| 5 to 17 Years | 0 (0.0%) | 0 (0.0%) |
| 18 to 34 Years | 22 (11.6%) | 0 (0.0%) |
| 35 to 64 Years | 76 (9.5%) | 0 (0.0%) |
| 65 to 74 Years | 71 (39.4%) | 71 (30.3%) |
| 75 Years and over | 40 (17.5%) | 51 (14.4%) |
Disability Class: Vision Difficulty
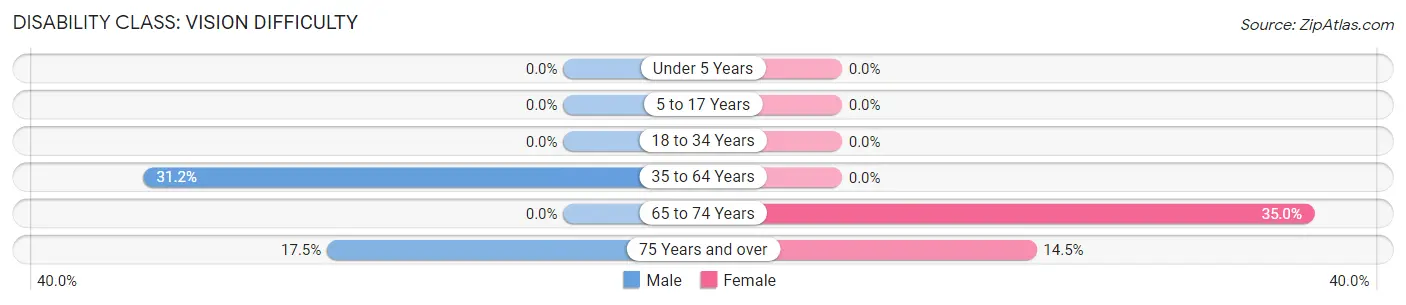
| Age Bracket | Male | Female |
| Under 5 Years | 0 (0.0%) | 0 (0.0%) |
| 5 to 17 Years | 0 (0.0%) | 0 (0.0%) |
| 18 to 34 Years | 0 (0.0%) | 0 (0.0%) |
| 35 to 64 Years | 249 (31.2%) | 0 (0.0%) |
| 65 to 74 Years | 0 (0.0%) | 82 (35.0%) |
| 75 Years and over | 40 (17.5%) | 51 (14.4%) |
Disability Class: Cognitive Difficulty
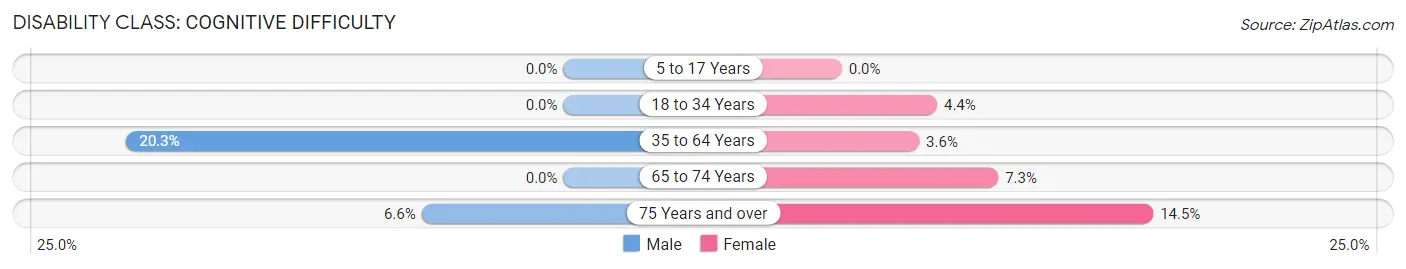
| Age Bracket | Male | Female |
| 5 to 17 Years | 0 (0.0%) | 0 (0.0%) |
| 18 to 34 Years | 0 (0.0%) | 20 (4.4%) |
| 35 to 64 Years | 162 (20.3%) | 39 (3.6%) |
| 65 to 74 Years | 0 (0.0%) | 17 (7.3%) |
| 75 Years and over | 15 (6.6%) | 51 (14.4%) |
Disability Class: Ambulatory Difficulty
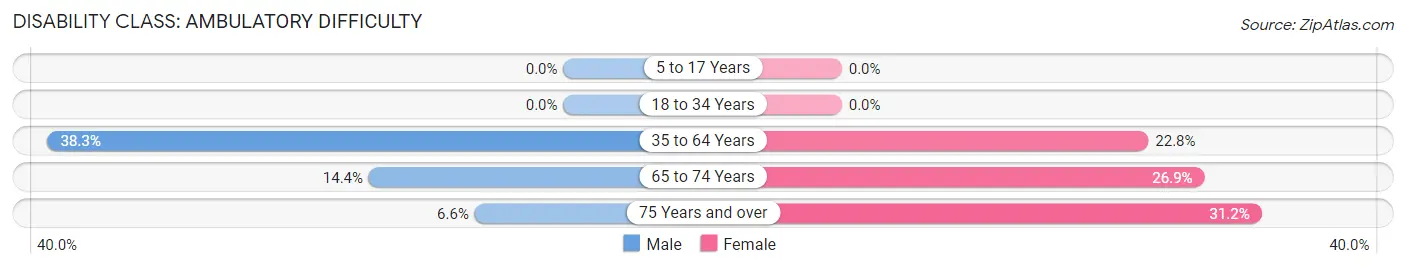
| Age Bracket | Male | Female |
| 5 to 17 Years | 0 (0.0%) | 0 (0.0%) |
| 18 to 34 Years | 0 (0.0%) | 0 (0.0%) |
| 35 to 64 Years | 306 (38.3%) | 247 (22.8%) |
| 65 to 74 Years | 26 (14.4%) | 63 (26.9%) |
| 75 Years and over | 15 (6.6%) | 110 (31.2%) |
Disability Class: Self-Care Difficulty
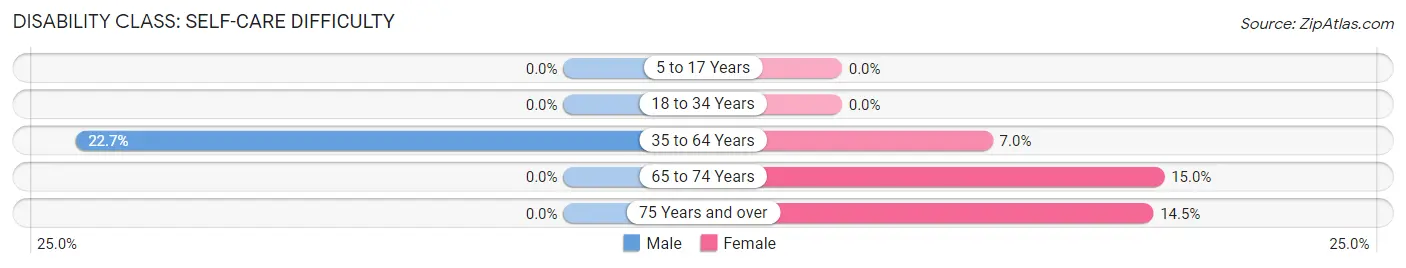
| Age Bracket | Male | Female |
| 5 to 17 Years | 0 (0.0%) | 0 (0.0%) |
| 18 to 34 Years | 0 (0.0%) | 0 (0.0%) |
| 35 to 64 Years | 181 (22.7%) | 76 (7.0%) |
| 65 to 74 Years | 0 (0.0%) | 35 (15.0%) |
| 75 Years and over | 0 (0.0%) | 51 (14.4%) |
Technology Access in Springhill
Computing Device Access in Springhill
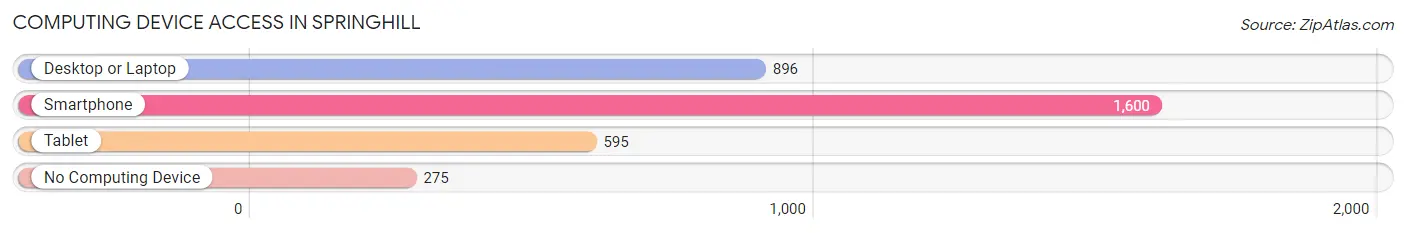
| Device Type | # Households | % Households |
| Desktop or Laptop | 896 | 45.7% |
| Smartphone | 1,600 | 81.6% |
| Tablet | 595 | 30.4% |
| No Computing Device | 275 | 14.0% |
| Total | 1,960 | 100.0% |
Internet Access in Springhill
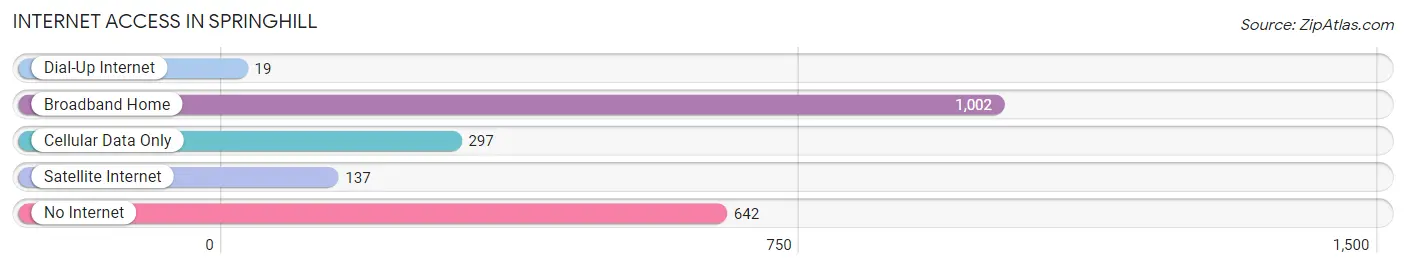
| Internet Type | # Households | % Households |
| Dial-Up Internet | 19 | 1.0% |
| Broadband Home | 1,002 | 51.1% |
| Cellular Data Only | 297 | 15.1% |
| Satellite Internet | 137 | 7.0% |
| No Internet | 642 | 32.8% |
| Total | 1,960 | 100.0% |
Springhill Summary
History
The city of Springhill, Louisiana is located in the northwest corner of the state, near the Arkansas border. It is the largest city in the area and the seat of Webster Parish. The city was founded in 1839 and named after the nearby spring. The area was originally inhabited by the Caddo Indians, who were later displaced by European settlers.
The first settlers in the area were mostly farmers and ranchers, who were attracted to the area by its fertile soil and abundant natural resources. The area was also home to a large number of Confederate soldiers during the Civil War. After the war, the area experienced a period of economic growth, as the railroad was built through the area and the timber industry began to flourish.
In the early 20th century, the area experienced a period of rapid growth, as the timber industry continued to expand and the city became a hub for the oil and gas industry. The city was incorporated in 1912 and has since grown to become the largest city in the area.
Geography
Springhill is located in the northwest corner of Louisiana, near the Arkansas border. It is situated in the Red River Valley, which is part of the larger Mississippi River Valley. The city is located at the intersection of Interstate 49 and U.S. Highway 71.
The city has a total area of 8.3 square miles, of which 8.2 square miles is land and 0.1 square miles is water. The city is located at an elevation of approximately 300 feet above sea level. The climate in the area is humid subtropical, with hot summers and mild winters.
Economy
The economy of Springhill is largely based on the oil and gas industry, as well as timber and agriculture. The city is home to several oil and gas companies, as well as a number of timber companies. The city is also home to a number of manufacturing companies, including a paper mill and a furniture factory.
The city is also home to a number of retail stores, restaurants, and other businesses. The city is served by the Springhill Municipal Airport, which provides air service to the area.
Demographics
As of the 2010 census, the population of Springhill was 7,719. The racial makeup of the city was 79.2% White, 17.2% African American, 0.7% Native American, 0.4% Asian, 0.1% Pacific Islander, and 2.4% from other races. Hispanic or Latino of any race were 2.7% of the population.
The median household income in the city was $31,944, and the median family income was $41,944. The per capita income in the city was $17,845. About 17.2% of the population was below the poverty line.
The city is served by the Webster Parish School District, which includes four elementary schools, two middle schools, and one high school. The city is also home to a number of private schools, including a Catholic school and a Christian school.
Common Questions
What is Per Capita Income in Springhill?
Per Capita income in Springhill is $15,942.
What is the Median Family Income in Springhill?
Median Family Income in Springhill is $38,304.
What is the Median Household income in Springhill?
Median Household Income in Springhill is $27,868.
What is Income or Wage Gap in Springhill?
Income or Wage Gap in Springhill is 50.9%.
Women in Springhill earn 49.1 cents for every dollar earned by a man.
What is Inequality or Gini Index in Springhill?
Inequality or Gini Index in Springhill is 0.49.
What is the Total Population of Springhill?
Total Population of Springhill is 4,740.
What is the Total Male Population of Springhill?
Total Male Population of Springhill is 2,197.
What is the Total Female Population of Springhill?
Total Female Population of Springhill is 2,543.
What is the Ratio of Males per 100 Females in Springhill?
There are 86.39 Males per 100 Females in Springhill.
What is the Ratio of Females per 100 Males in Springhill?
There are 115.75 Females per 100 Males in Springhill.
What is the Median Population Age in Springhill?
Median Population Age in Springhill is 46.1 Years.
What is the Average Family Size in Springhill
Average Family Size in Springhill is 3.0 People.
What is the Average Household Size in Springhill
Average Household Size in Springhill is 2.4 People.
How Large is the Labor Force in Springhill?
There are 1,085 People in the Labor Forcein in Springhill.
What is the Percentage of People in the Labor Force in Springhill?
29.5% of People are in the Labor Force in Springhill.
What is the Unemployment Rate in Springhill?
Unemployment Rate in Springhill is 10.7%.