Roseland, LA Map & Demographics
Roseland Map
Roseland Overview
$17,732
PER CAPITA INCOME
$43,652
AVG FAMILY INCOME
$43,693
AVG HOUSEHOLD INCOME
7.6%
WAGE / INCOME GAP [ % ]
92.4¢/ $1
WAGE / INCOME GAP [ $ ]
0.33
INEQUALITY / GINI INDEX
1,237
TOTAL POPULATION
589
MALE POPULATION
648
FEMALE POPULATION
90.90
MALES / 100 FEMALES
110.02
FEMALES / 100 MALES
38.6
MEDIAN AGE
3.0
AVG FAMILY SIZE
2.9
AVG HOUSEHOLD SIZE
437
LABOR FORCE [ PEOPLE ]
48.8%
PERCENT IN LABOR FORCE
8.0%
UNEMPLOYMENT RATE
Roseland Zip Codes
Income in Roseland
Income Overview in Roseland
Per Capita Income in Roseland is $17,732, while median incomes of families and households are $43,652 and $43,693 respectively.
| Characteristic | Number | Measure |
| Per Capita Income | 1,237 | $17,732 |
| Median Family Income | 373 | $43,652 |
| Mean Family Income | 373 | $49,414 |
| Median Household Income | 430 | $43,693 |
| Mean Household Income | 430 | $49,896 |
| Income Deficit | 373 | $0 |
| Wage / Income Gap (%) | 1,237 | 7.63% |
| Wage / Income Gap ($) | 1,237 | 92.37¢ per $1 |
| Gini / Inequality Index | 1,237 | 0.33 |
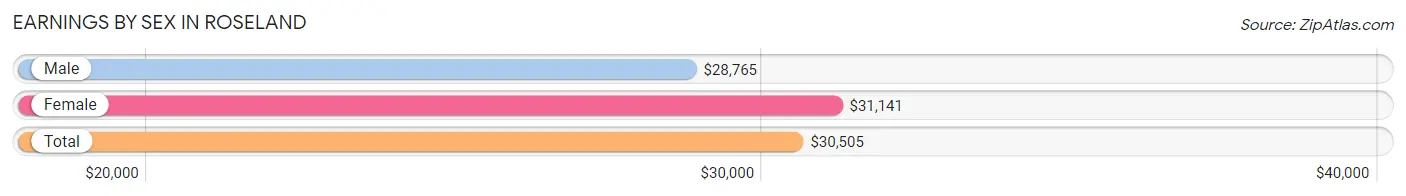
Earnings by Sex in Roseland
Average Earnings in Roseland are $30,505, $28,765 for men and $31,141 for women, a difference of 7.6%.
| Sex | Number | Average Earnings |
| Male | 216 (48.8%) | $28,765 |
| Female | 227 (51.2%) | $31,141 |
| Total | 443 (100.0%) | $30,505 |
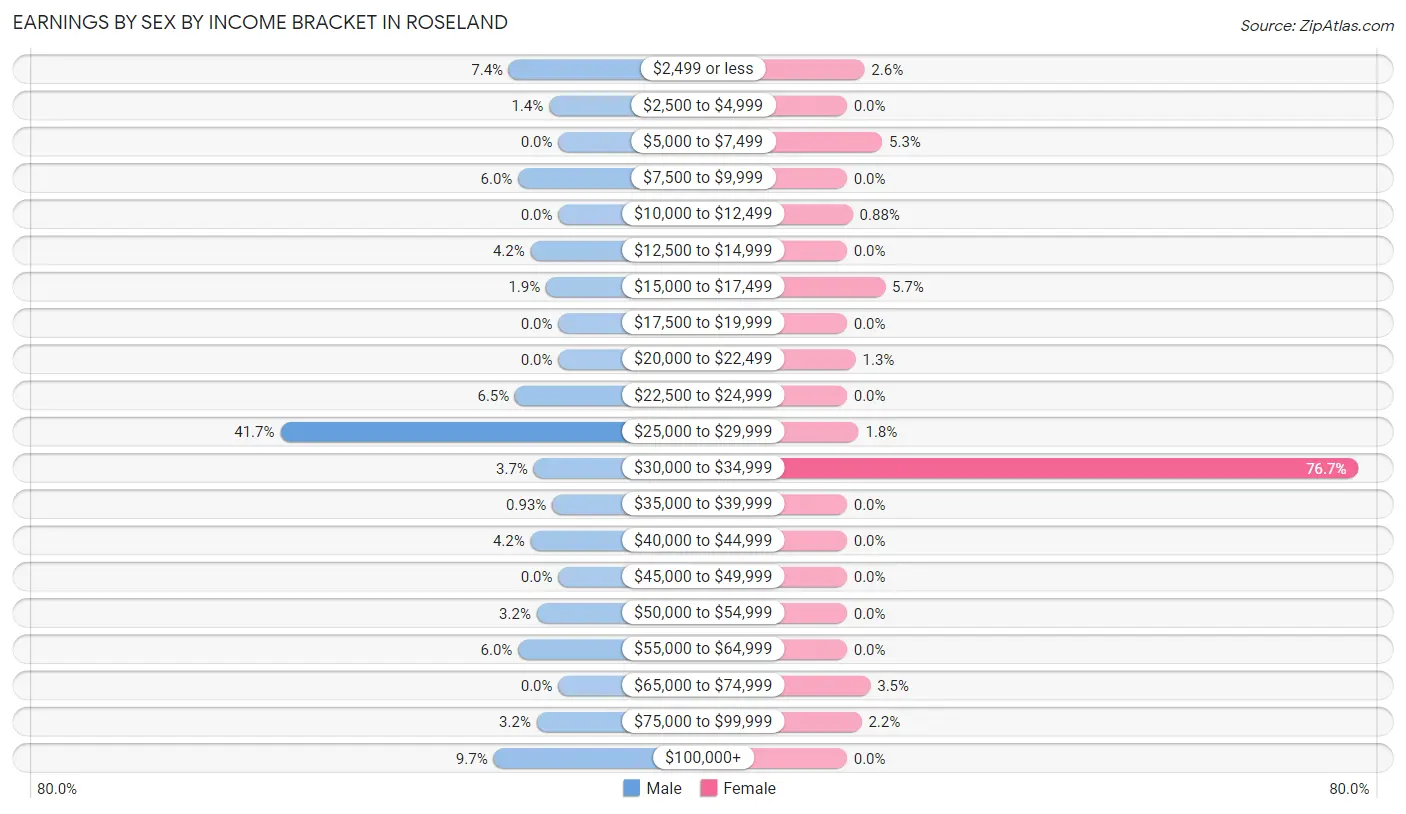
Earnings by Sex by Income Bracket in Roseland
The most common earnings brackets in Roseland are $25,000 to $29,999 for men (90 | 41.7%) and $30,000 to $34,999 for women (174 | 76.6%).
| Income | Male | Female |
| $2,499 or less | 16 (7.4%) | 6 (2.6%) |
| $2,500 to $4,999 | 3 (1.4%) | 0 (0.0%) |
| $5,000 to $7,499 | 0 (0.0%) | 12 (5.3%) |
| $7,500 to $9,999 | 13 (6.0%) | 0 (0.0%) |
| $10,000 to $12,499 | 0 (0.0%) | 2 (0.9%) |
| $12,500 to $14,999 | 9 (4.2%) | 0 (0.0%) |
| $15,000 to $17,499 | 4 (1.8%) | 13 (5.7%) |
| $17,500 to $19,999 | 0 (0.0%) | 0 (0.0%) |
| $20,000 to $22,499 | 0 (0.0%) | 3 (1.3%) |
| $22,500 to $24,999 | 14 (6.5%) | 0 (0.0%) |
| $25,000 to $29,999 | 90 (41.7%) | 4 (1.8%) |
| $30,000 to $34,999 | 8 (3.7%) | 174 (76.6%) |
| $35,000 to $39,999 | 2 (0.9%) | 0 (0.0%) |
| $40,000 to $44,999 | 9 (4.2%) | 0 (0.0%) |
| $45,000 to $49,999 | 0 (0.0%) | 0 (0.0%) |
| $50,000 to $54,999 | 7 (3.2%) | 0 (0.0%) |
| $55,000 to $64,999 | 13 (6.0%) | 0 (0.0%) |
| $65,000 to $74,999 | 0 (0.0%) | 8 (3.5%) |
| $75,000 to $99,999 | 7 (3.2%) | 5 (2.2%) |
| $100,000+ | 21 (9.7%) | 0 (0.0%) |
| Total | 216 (100.0%) | 227 (100.0%) |
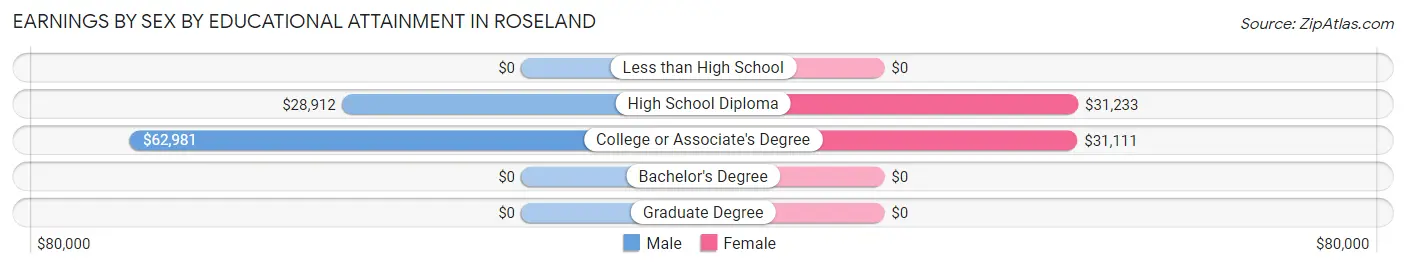
Earnings by Sex by Educational Attainment in Roseland
Average earnings in Roseland are $29,247 for men and $31,172 for women, a difference of 6.2%. Men with an educational attainment of college or associate's degree enjoy the highest average annual earnings of $62,981, while those with high school diploma education earn the least with $28,912. Women with an educational attainment of high school diploma earn the most with the average annual earnings of $31,233, while those with college or associate's degree education have the smallest earnings of $31,111.
| Educational Attainment | Male Income | Female Income |
| Less than High School | - | - |
| High School Diploma | $28,912 | $31,233 |
| College or Associate's Degree | $62,981 | $31,111 |
| Bachelor's Degree | - | - |
| Graduate Degree | - | - |
| Total | $29,247 | $31,172 |
Family Income in Roseland
Family Income Brackets in Roseland
According to the Roseland family income data, there are 201 families falling into the $35,000 to $49,999 income range, which is the most common income bracket and makes up 53.9% of all families.
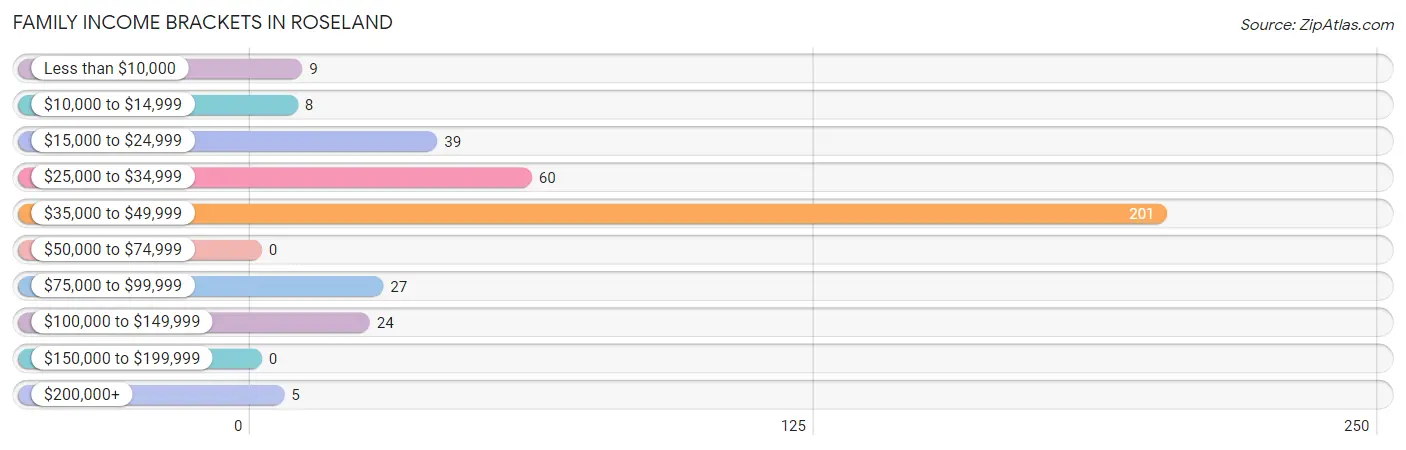
| Income Bracket | # Families | % Families |
| Less than $10,000 | 9 | 2.4% |
| $10,000 to $14,999 | 8 | 2.1% |
| $15,000 to $24,999 | 39 | 10.5% |
| $25,000 to $34,999 | 60 | 16.1% |
| $35,000 to $49,999 | 201 | 53.9% |
| $50,000 to $74,999 | 0 | 0.0% |
| $75,000 to $99,999 | 27 | 7.2% |
| $100,000 to $149,999 | 24 | 6.4% |
| $150,000 to $199,999 | 0 | 0.0% |
| $200,000+ | 5 | 1.3% |
Family Income by Famaliy Size in Roseland
2-person families (252 | 67.6%) account for the highest median family income in Roseland with $43,841 per family, while 2-person families (252 | 67.6%) have the highest median income of $21,920 per family member.
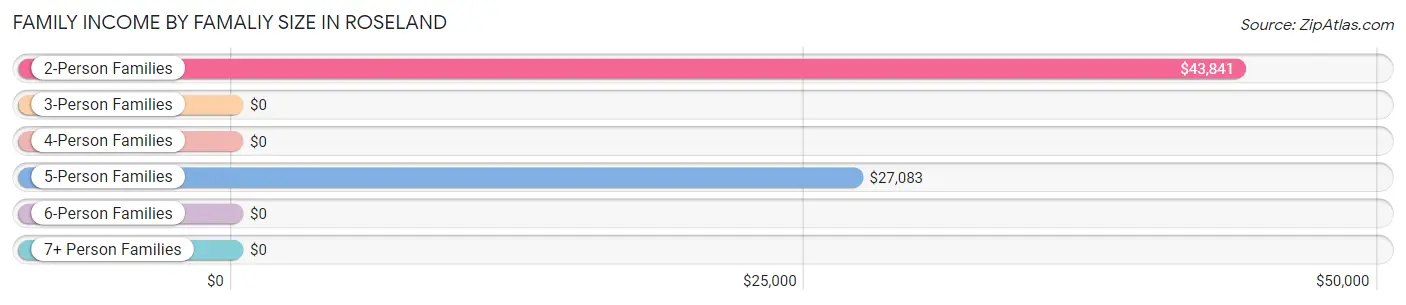
| Income Bracket | # Families | Median Income |
| 2-Person Families | 252 (67.6%) | $43,841 |
| 3-Person Families | 61 (16.4%) | $0 |
| 4-Person Families | 50 (13.4%) | $0 |
| 5-Person Families | 10 (2.7%) | $27,083 |
| 6-Person Families | 0 (0.0%) | $0 |
| 7+ Person Families | 0 (0.0%) | $0 |
| Total | 373 (100.0%) | $43,652 |
Family Income by Number of Earners in Roseland
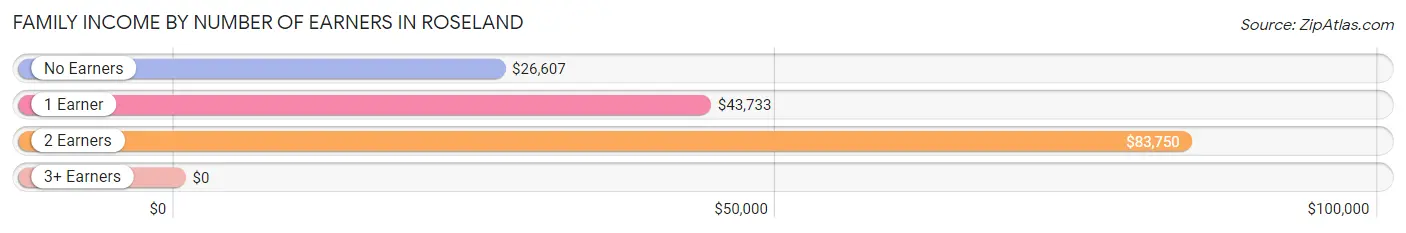
| Number of Earners | # Families | Median Income |
| No Earners | 70 (18.8%) | $26,607 |
| 1 Earner | 263 (70.5%) | $43,733 |
| 2 Earners | 37 (9.9%) | $83,750 |
| 3+ Earners | 3 (0.8%) | $0 |
| Total | 373 (100.0%) | $43,652 |
Household Income in Roseland
Household Income Brackets in Roseland
With 203 households falling in the category, the $35,000 to $49,999 income range is the most frequent in Roseland, accounting for 47.2% of all households. In contrast, only 3 households (0.7%) fall into the $150,000 to $199,999 income bracket, making it the least populous group.
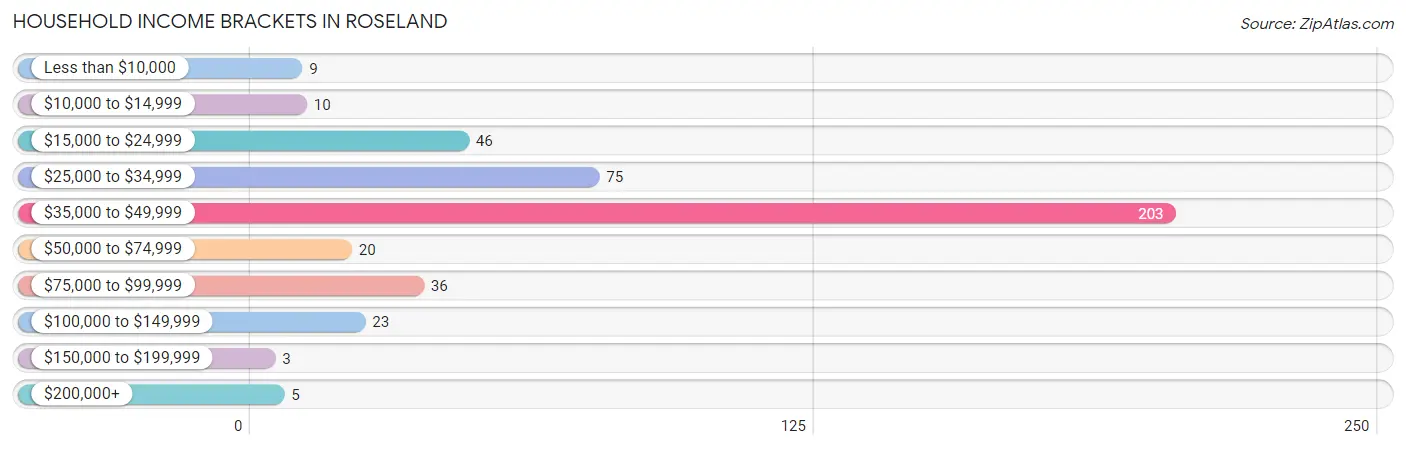
| Income Bracket | # Households | % Households |
| Less than $10,000 | 9 | 2.1% |
| $10,000 to $14,999 | 10 | 2.3% |
| $15,000 to $24,999 | 46 | 10.7% |
| $25,000 to $34,999 | 75 | 17.4% |
| $35,000 to $49,999 | 203 | 47.2% |
| $50,000 to $74,999 | 20 | 4.7% |
| $75,000 to $99,999 | 36 | 8.4% |
| $100,000 to $149,999 | 23 | 5.3% |
| $150,000 to $199,999 | 3 | 0.7% |
| $200,000+ | 5 | 1.2% |
Household Income by Householder Age in Roseland
The median household income in Roseland is $43,693, with the highest median household income of $47,786 found in the 65+ years age bracket for the primary householder. A total of 121 households (28.1%) fall into this category. Meanwhile, the 15 to 24 years age bracket for the primary householder has the lowest median household income of $0, with 18 households (4.2%) in this group.
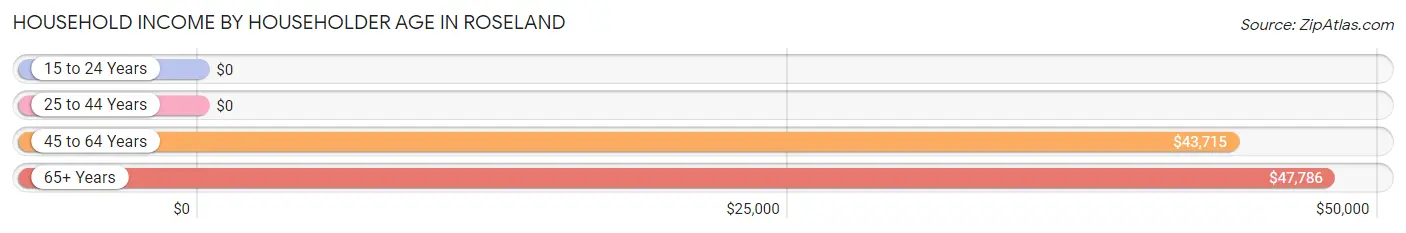
| Income Bracket | # Households | Median Income |
| 15 to 24 Years | 18 (4.2%) | $0 |
| 25 to 44 Years | 52 (12.1%) | $0 |
| 45 to 64 Years | 239 (55.6%) | $43,715 |
| 65+ Years | 121 (28.1%) | $47,786 |
| Total | 430 (100.0%) | $43,693 |
Poverty in Roseland
Income Below Poverty by Sex and Age in Roseland
With 52.3% poverty level for males and 40.3% for females among the residents of Roseland, under 5 year old males and 5 year old females are the most vulnerable to poverty, with 95 males (100.0%) and 5 females (100.0%) in their respective age groups living below the poverty level.
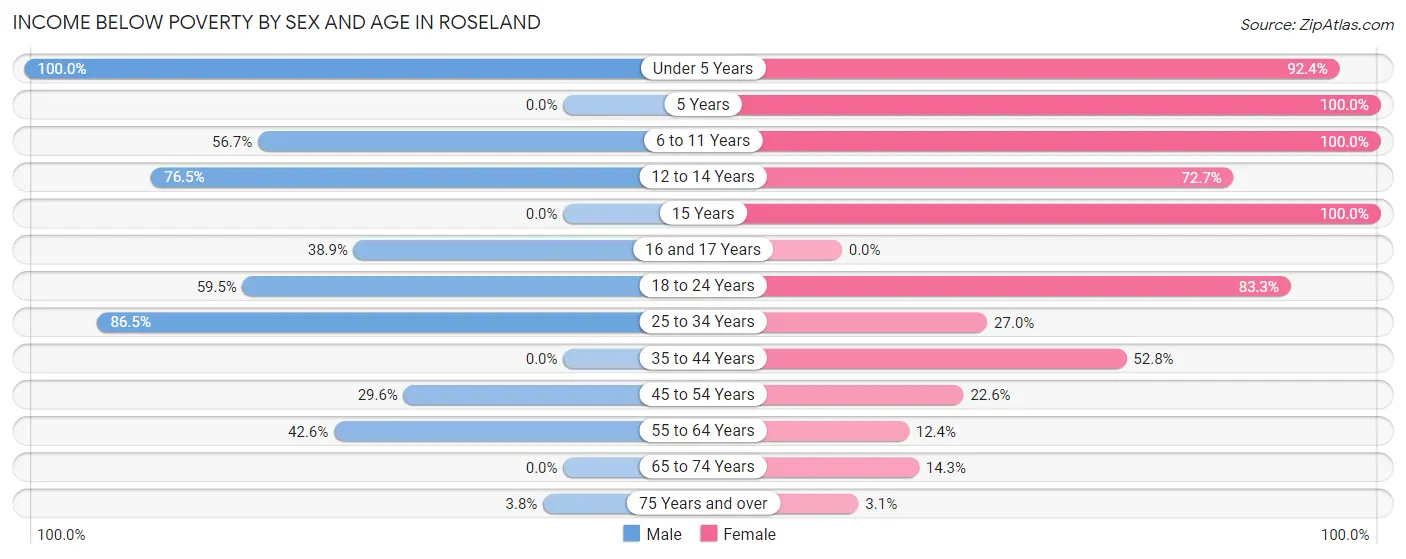
| Age Bracket | Male | Female |
| Under 5 Years | 95 (100.0%) | 121 (92.4%) |
| 5 Years | 0 (0.0%) | 5 (100.0%) |
| 6 to 11 Years | 34 (56.7%) | 20 (100.0%) |
| 12 to 14 Years | 13 (76.5%) | 8 (72.7%) |
| 15 Years | 0 (0.0%) | 2 (100.0%) |
| 16 and 17 Years | 7 (38.9%) | 0 (0.0%) |
| 18 to 24 Years | 25 (59.5%) | 20 (83.3%) |
| 25 to 34 Years | 83 (86.5%) | 17 (27.0%) |
| 35 to 44 Years | 0 (0.0%) | 28 (52.8%) |
| 45 to 54 Years | 8 (29.6%) | 7 (22.6%) |
| 55 to 64 Years | 40 (42.5%) | 25 (12.4%) |
| 65 to 74 Years | 0 (0.0%) | 6 (14.3%) |
| 75 Years and over | 3 (3.7%) | 2 (3.1%) |
| Total | 308 (52.3%) | 261 (40.3%) |
Income Above Poverty by Sex and Age in Roseland
According to the poverty statistics in Roseland, males aged 35 to 44 years and females aged 75 years and over are the age groups that are most secure financially, with 100.0% of males and 96.9% of females in these age groups living above the poverty line.
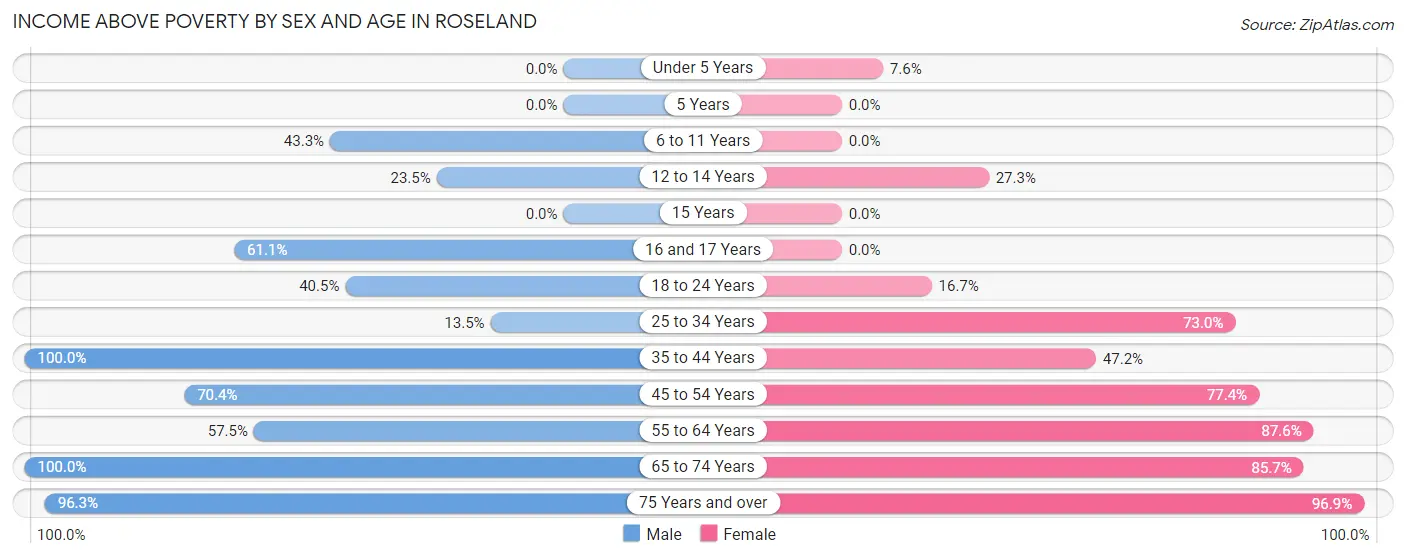
| Age Bracket | Male | Female |
| Under 5 Years | 0 (0.0%) | 10 (7.6%) |
| 5 Years | 0 (0.0%) | 0 (0.0%) |
| 6 to 11 Years | 26 (43.3%) | 0 (0.0%) |
| 12 to 14 Years | 4 (23.5%) | 3 (27.3%) |
| 15 Years | 0 (0.0%) | 0 (0.0%) |
| 16 and 17 Years | 11 (61.1%) | 0 (0.0%) |
| 18 to 24 Years | 17 (40.5%) | 4 (16.7%) |
| 25 to 34 Years | 13 (13.5%) | 46 (73.0%) |
| 35 to 44 Years | 26 (100.0%) | 25 (47.2%) |
| 45 to 54 Years | 19 (70.4%) | 24 (77.4%) |
| 55 to 64 Years | 54 (57.5%) | 176 (87.6%) |
| 65 to 74 Years | 34 (100.0%) | 36 (85.7%) |
| 75 Years and over | 77 (96.3%) | 63 (96.9%) |
| Total | 281 (47.7%) | 387 (59.7%) |
Income Below Poverty Among Married-Couple Families in Roseland
The poverty statistics for married-couple families in Roseland show that 16.6% or 25 of the total 151 families live below the poverty line. Families with 3 or 4 children have the highest poverty rate of 100.0%, comprising of 3 families. On the other hand, families with no children have the lowest poverty rate of 3.0%, which includes 3 families.
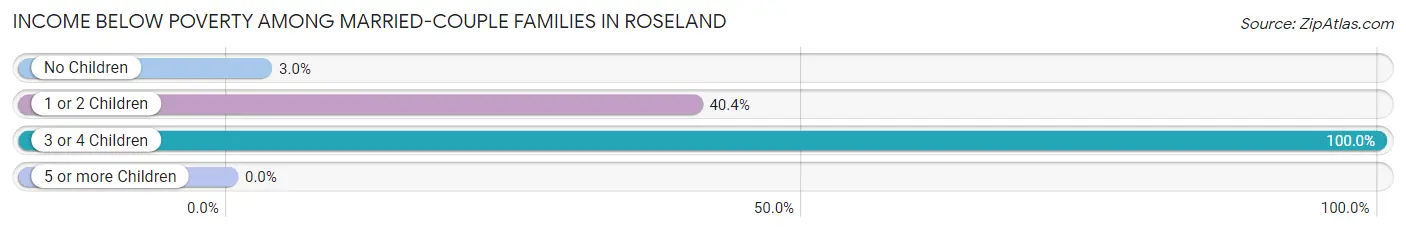
| Children | Above Poverty | Below Poverty |
| No Children | 98 (97.0%) | 3 (3.0%) |
| 1 or 2 Children | 28 (59.6%) | 19 (40.4%) |
| 3 or 4 Children | 0 (0.0%) | 3 (100.0%) |
| 5 or more Children | 0 (0.0%) | 0 (0.0%) |
| Total | 126 (83.4%) | 25 (16.6%) |
Income Below Poverty Among Single-Parent Households in Roseland
According to the poverty data in Roseland, 44.4% or 8 single-father households and 18.1% or 37 single-mother households are living below the poverty line. Among single-father households, those with 1 or 2 children have the highest poverty rate, with 8 households (57.1%) experiencing poverty. Likewise, among single-mother households, those with 3 or 4 children have the highest poverty rate, with 8 households (100.0%) falling below the poverty line.
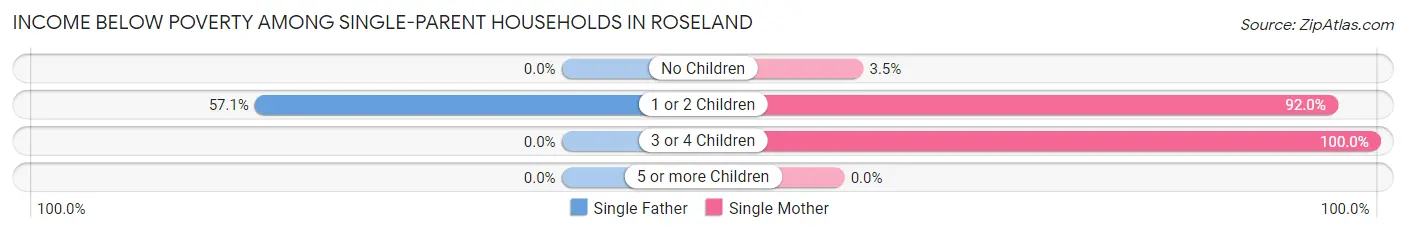
| Children | Single Father | Single Mother |
| No Children | 0 (0.0%) | 6 (3.5%) |
| 1 or 2 Children | 8 (57.1%) | 23 (92.0%) |
| 3 or 4 Children | 0 (0.0%) | 8 (100.0%) |
| 5 or more Children | 0 (0.0%) | 0 (0.0%) |
| Total | 8 (44.4%) | 37 (18.1%) |
Income Below Poverty Among Married-Couple vs Single-Parent Households in Roseland
The poverty data for Roseland shows that 25 of the married-couple family households (16.6%) and 45 of the single-parent households (20.3%) are living below the poverty level. Within the married-couple family households, those with 3 or 4 children have the highest poverty rate, with 3 households (100.0%) falling below the poverty line. Among the single-parent households, those with 3 or 4 children have the highest poverty rate, with 8 household (100.0%) living below poverty.
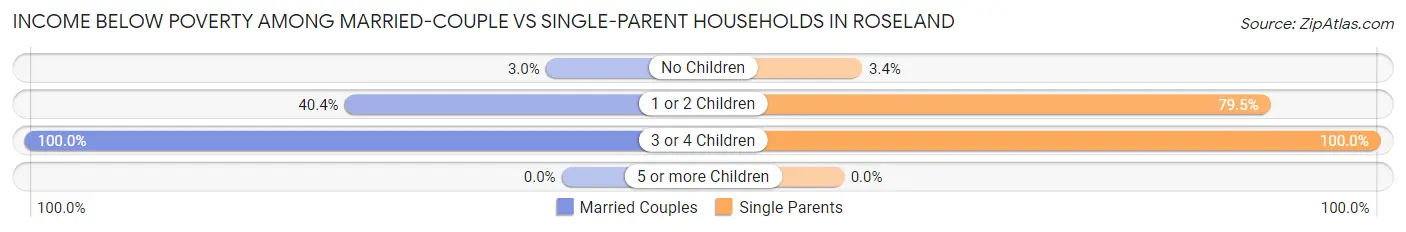
| Children | Married-Couple Families | Single-Parent Households |
| No Children | 3 (3.0%) | 6 (3.4%) |
| 1 or 2 Children | 19 (40.4%) | 31 (79.5%) |
| 3 or 4 Children | 3 (100.0%) | 8 (100.0%) |
| 5 or more Children | 0 (0.0%) | 0 (0.0%) |
| Total | 25 (16.6%) | 45 (20.3%) |
Race in Roseland
The most populous races in Roseland are Black / African American (643 | 52.0%), White / Caucasian (564 | 45.6%), and Asian (12 | 1.0%).
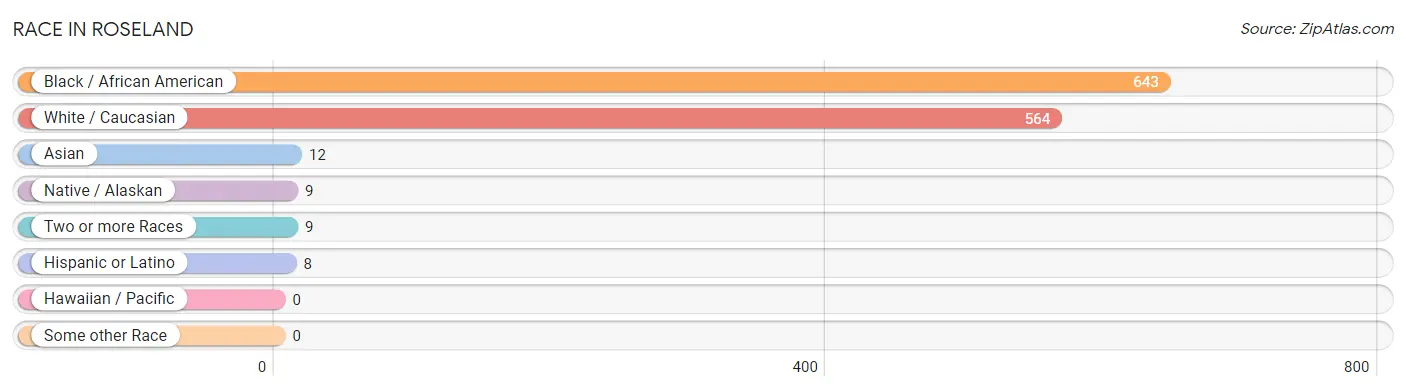
| Race | # Population | % Population |
| Asian | 12 | 1.0% |
| Black / African American | 643 | 52.0% |
| Hawaiian / Pacific | 0 | 0.0% |
| Hispanic or Latino | 8 | 0.6% |
| Native / Alaskan | 9 | 0.7% |
| White / Caucasian | 564 | 45.6% |
| Two or more Races | 9 | 0.7% |
| Some other Race | 0 | 0.0% |
| Total | 1,237 | 100.0% |
Ancestry in Roseland
The most populous ancestries reported in Roseland are English (285 | 23.0%), American (179 | 14.5%), Irish (79 | 6.4%), Scotch-Irish (40 | 3.2%), and French (17 | 1.4%), together accounting for 48.5% of all Roseland residents.
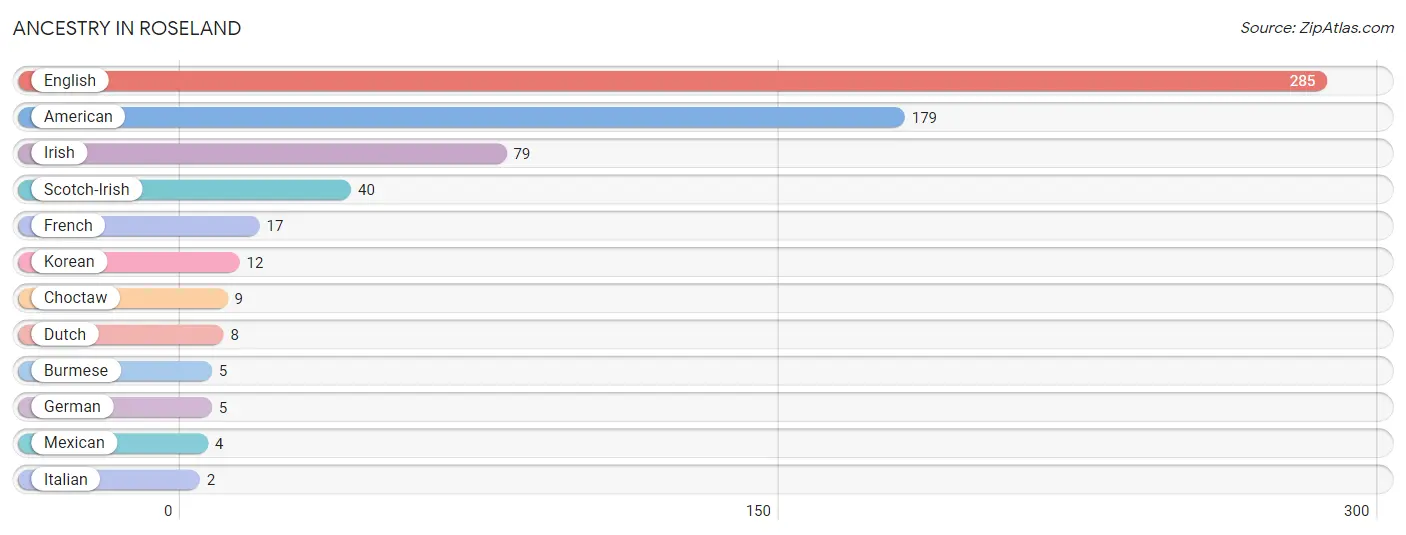
| Ancestry | # Population | % Population |
| American | 179 | 14.5% |
| Burmese | 5 | 0.4% |
| Choctaw | 9 | 0.7% |
| Dutch | 8 | 0.6% |
| English | 285 | 23.0% |
| French | 17 | 1.4% |
| German | 5 | 0.4% |
| Irish | 79 | 6.4% |
| Italian | 2 | 0.2% |
| Korean | 12 | 1.0% |
| Mexican | 4 | 0.3% |
| Scotch-Irish | 40 | 3.2% | View All 12 Rows |
Immigrants in Roseland

| Immigration Origin | # Population | % Population | View All 0 Rows |
Sex and Age in Roseland
Sex and Age in Roseland
The most populous age groups in Roseland are Under 5 Years (95 | 16.1%) for men and 55 to 59 Years (151 | 23.3%) for women.
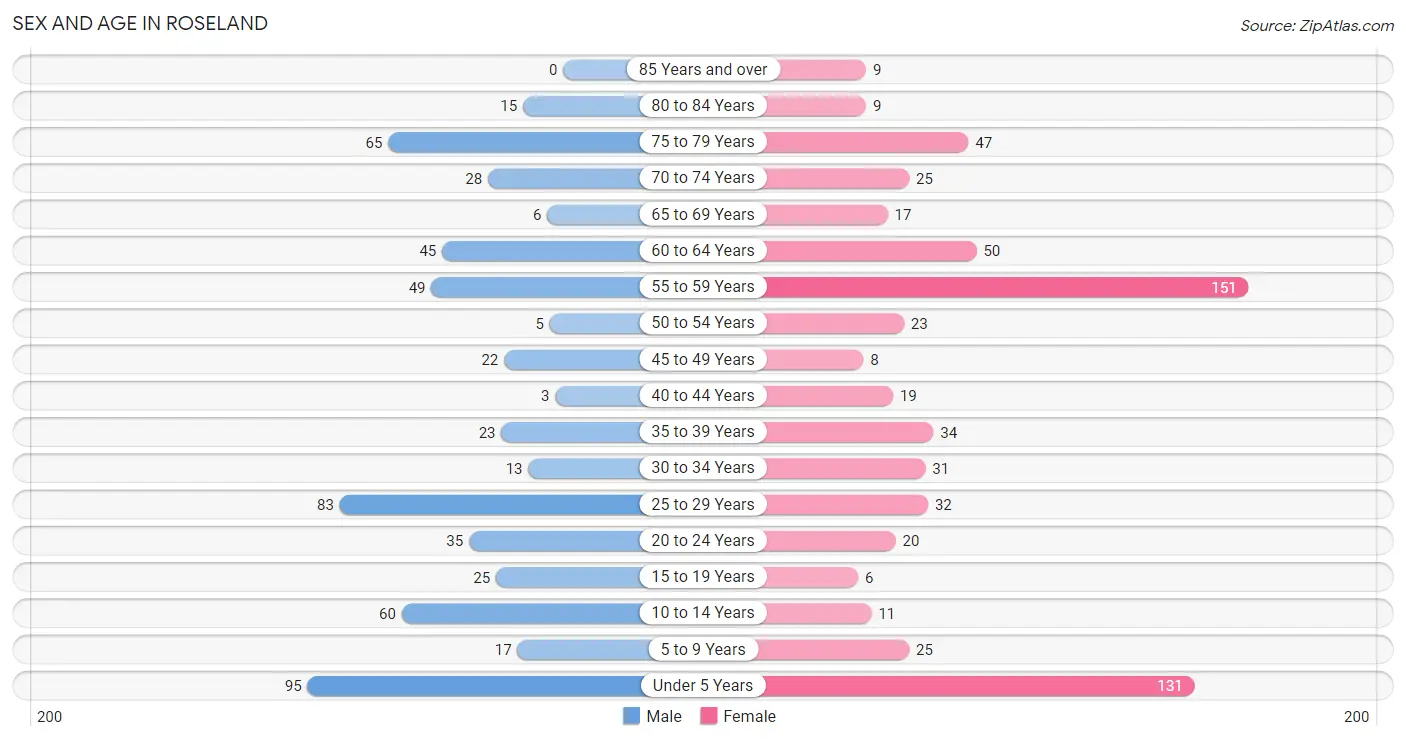
| Age Bracket | Male | Female |
| Under 5 Years | 95 (16.1%) | 131 (20.2%) |
| 5 to 9 Years | 17 (2.9%) | 25 (3.9%) |
| 10 to 14 Years | 60 (10.2%) | 11 (1.7%) |
| 15 to 19 Years | 25 (4.2%) | 6 (0.9%) |
| 20 to 24 Years | 35 (5.9%) | 20 (3.1%) |
| 25 to 29 Years | 83 (14.1%) | 32 (4.9%) |
| 30 to 34 Years | 13 (2.2%) | 31 (4.8%) |
| 35 to 39 Years | 23 (3.9%) | 34 (5.2%) |
| 40 to 44 Years | 3 (0.5%) | 19 (2.9%) |
| 45 to 49 Years | 22 (3.7%) | 8 (1.2%) |
| 50 to 54 Years | 5 (0.9%) | 23 (3.5%) |
| 55 to 59 Years | 49 (8.3%) | 151 (23.3%) |
| 60 to 64 Years | 45 (7.6%) | 50 (7.7%) |
| 65 to 69 Years | 6 (1.0%) | 17 (2.6%) |
| 70 to 74 Years | 28 (4.8%) | 25 (3.9%) |
| 75 to 79 Years | 65 (11.0%) | 47 (7.2%) |
| 80 to 84 Years | 15 (2.5%) | 9 (1.4%) |
| 85 Years and over | 0 (0.0%) | 9 (1.4%) |
| Total | 589 (100.0%) | 648 (100.0%) |
Families and Households in Roseland
Median Family Size in Roseland
The median family size in Roseland is 2.97 persons per family, with married-couple families (151 | 40.5%) accounting for the largest median family size of 4.11 persons per family. On the other hand, single female/mother families (204 | 54.7%) represent the smallest median family size with 2.09 persons per family.
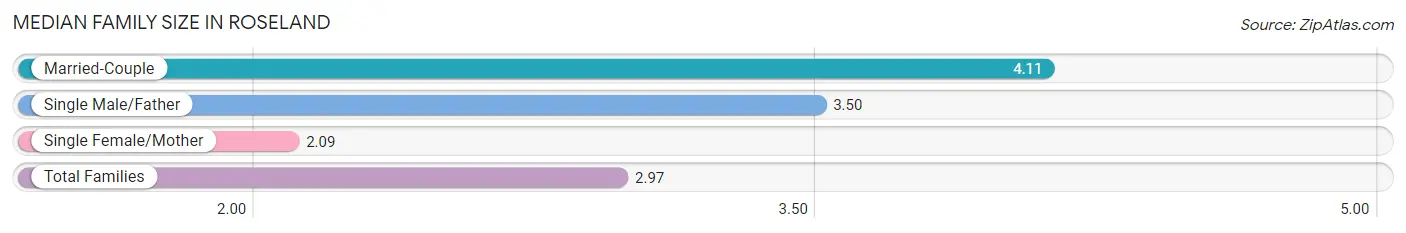
| Family Type | # Families | Family Size |
| Married-Couple | 151 (40.5%) | 4.11 |
| Single Male/Father | 18 (4.8%) | 3.50 |
| Single Female/Mother | 204 (54.7%) | 2.09 |
| Total Families | 373 (100.0%) | 2.97 |
Median Household Size in Roseland
The median household size in Roseland is 2.88 persons per household, with married-couple households (151 | 35.1%) accounting for the largest median household size of 4.18 persons per household. non-family households (57 | 13.3%) represent the smallest median household size with 1.89 persons per household.
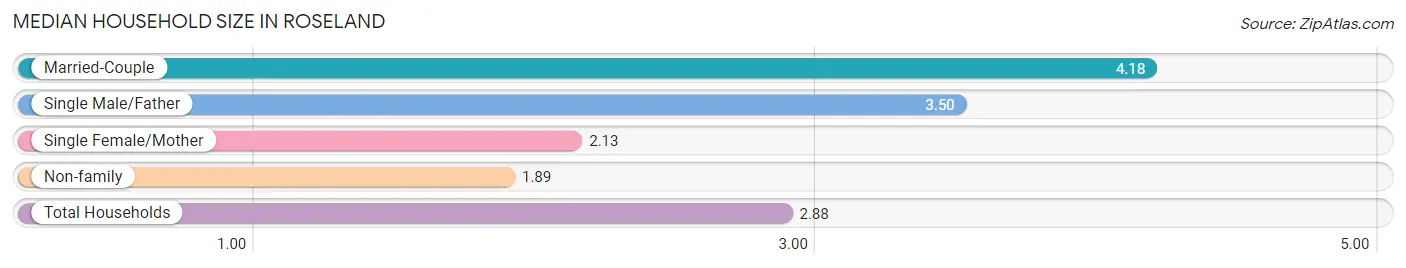
| Household Type | # Households | Household Size |
| Married-Couple | 151 (35.1%) | 4.18 |
| Single Male/Father | 18 (4.2%) | 3.50 |
| Single Female/Mother | 204 (47.4%) | 2.13 |
| Non-family | 57 (13.3%) | 1.89 |
| Total Households | 430 (100.0%) | 2.88 |
Household Size by Marriage Status in Roseland
Out of a total of 430 households in Roseland, 373 (86.7%) are family households, while 57 (13.3%) are nonfamily households. The most numerous type of family households are 2-person households, comprising 249, and the most common type of nonfamily households are 1-person households, comprising 37.
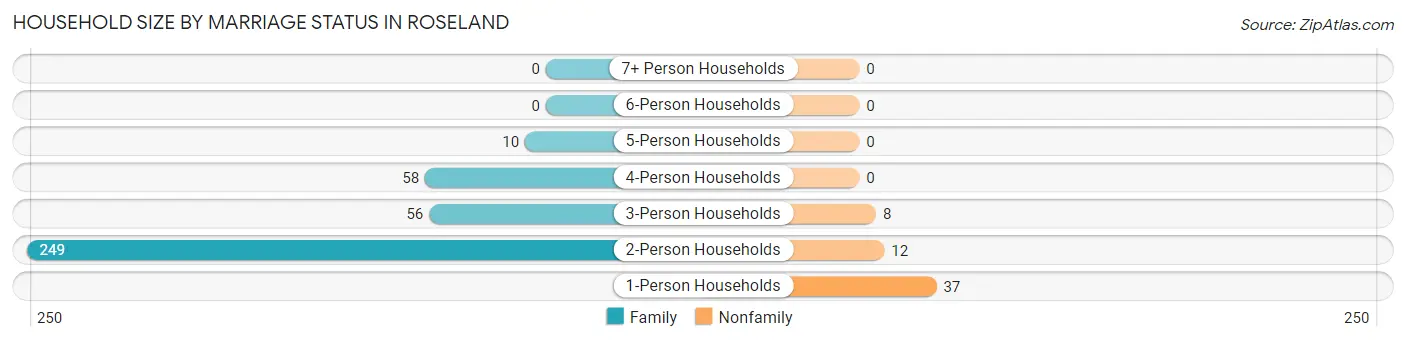
| Household Size | Family Households | Nonfamily Households |
| 1-Person Households | - | 37 (8.6%) |
| 2-Person Households | 249 (57.9%) | 12 (2.8%) |
| 3-Person Households | 56 (13.0%) | 8 (1.9%) |
| 4-Person Households | 58 (13.5%) | 0 (0.0%) |
| 5-Person Households | 10 (2.3%) | 0 (0.0%) |
| 6-Person Households | 0 (0.0%) | 0 (0.0%) |
| 7+ Person Households | 0 (0.0%) | 0 (0.0%) |
| Total | 373 (86.7%) | 57 (13.3%) |
Female Fertility in Roseland
Fertility by Age in Roseland
Average fertility rate in Roseland is 220.0 births per 1,000 women. Women in the age bracket of 20 to 34 years have the highest fertility rate with 349.0 births per 1,000 women. Women in the age bracket of 20 to 34 years acount for 87.9% of all women with births.
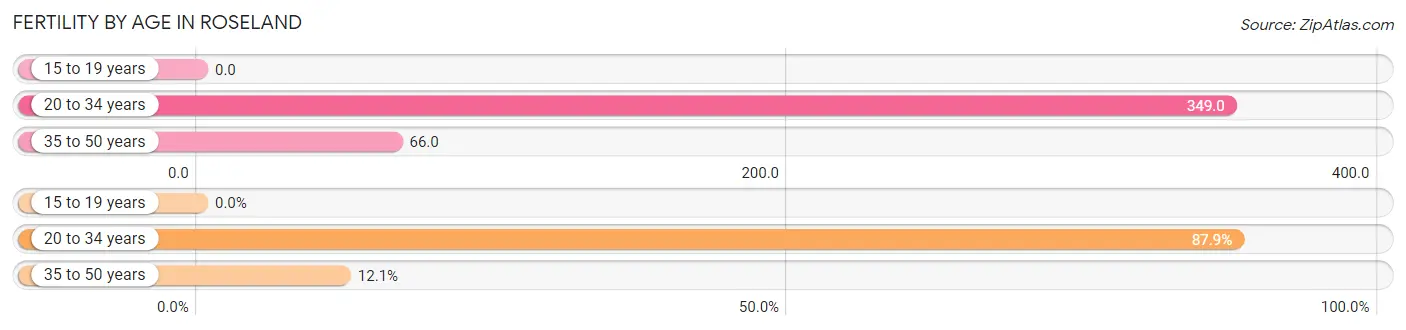
| Age Bracket | Women with Births | Births / 1,000 Women |
| 15 to 19 years | 0 (0.0%) | 0.0 |
| 20 to 34 years | 29 (87.9%) | 349.0 |
| 35 to 50 years | 4 (12.1%) | 66.0 |
| Total | 33 (100.0%) | 220.0 |
Fertility by Age by Marriage Status in Roseland
60.6% of women with births (33) in Roseland are married. The highest percentage of unmarried women with births falls into 20 to 34 years age bracket with 44.8% of them unmarried at the time of birth, while the lowest percentage of unmarried women with births belong to 35 to 50 years age bracket with 0.0% of them unmarried.
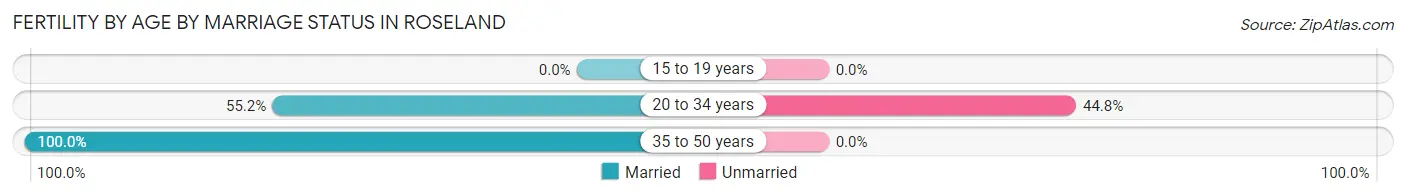
| Age Bracket | Married | Unmarried |
| 15 to 19 years | 0 (0.0%) | 0 (0.0%) |
| 20 to 34 years | 16 (55.2%) | 13 (44.8%) |
| 35 to 50 years | 4 (100.0%) | 0 (0.0%) |
| Total | 20 (60.6%) | 13 (39.4%) |
Fertility by Education in Roseland
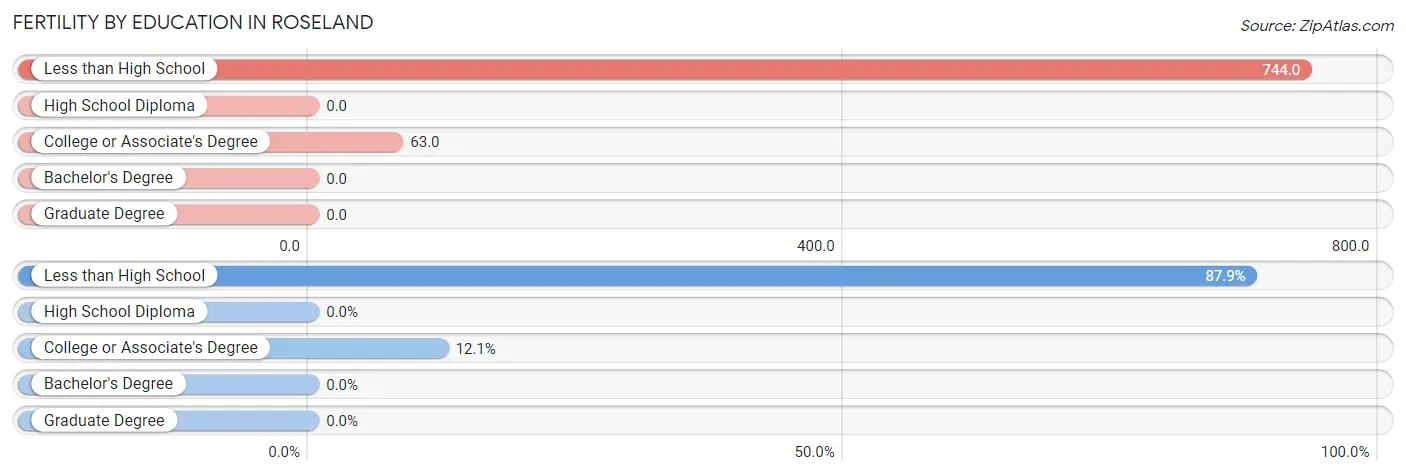
| Educational Attainment | Women with Births | Births / 1,000 Women |
| Less than High School | 29 (87.9%) | 744.0 |
| High School Diploma | 0 (0.0%) | 0.0 |
| College or Associate's Degree | 4 (12.1%) | 63.0 |
| Bachelor's Degree | 0 (0.0%) | 0.0 |
| Graduate Degree | 0 (0.0%) | 0.0 |
| Total | 33 (100.0%) | 220.0 |
Fertility by Education by Marriage Status in Roseland
39.4% of women with births in Roseland are unmarried. Women with the educational attainment of less than high school are most likely to be married with 69.0% of them married at childbirth, while women with the educational attainment of college or associate's degree are least likely to be married with 100.0% of them unmarried at childbirth.
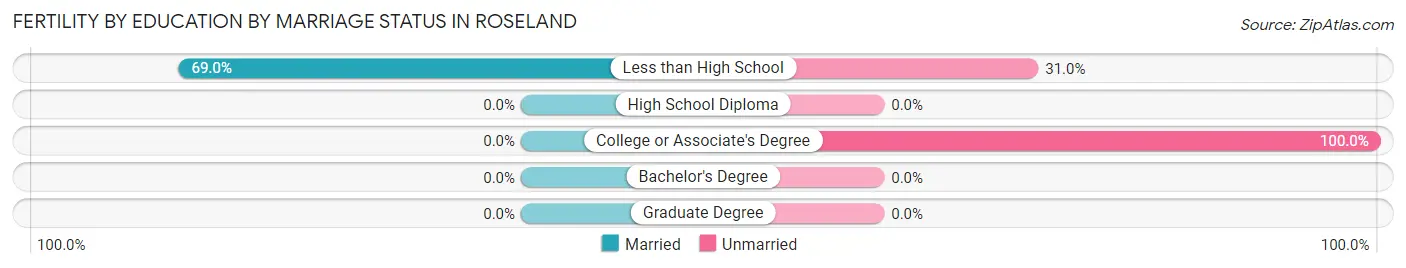
| Educational Attainment | Married | Unmarried |
| Less than High School | 20 (69.0%) | 9 (31.0%) |
| High School Diploma | 0 (0.0%) | 0 (0.0%) |
| College or Associate's Degree | 0 (0.0%) | 4 (100.0%) |
| Bachelor's Degree | 0 (0.0%) | 0 (0.0%) |
| Graduate Degree | 0 (0.0%) | 0 (0.0%) |
| Total | 20 (60.6%) | 13 (39.4%) |
Employment Characteristics in Roseland
Employment by Class of Employer in Roseland
Among the 389 employed individuals in Roseland, private company employees (344 | 88.4%), local government employees (36 | 9.2%), and not-for-profit organizations (7 | 1.8%) make up the most common classes of employment.
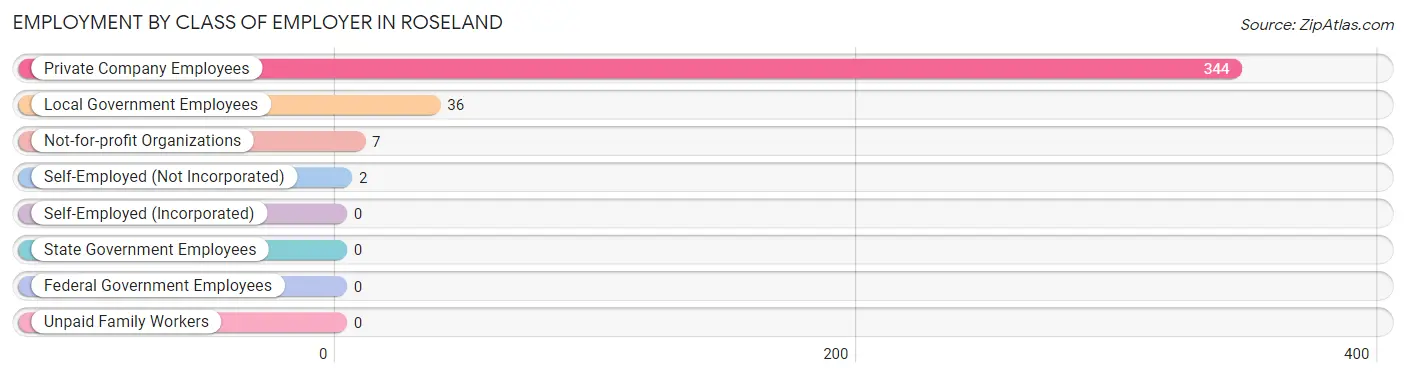
| Employer Class | # Employees | % Employees |
| Private Company Employees | 344 | 88.4% |
| Self-Employed (Incorporated) | 0 | 0.0% |
| Self-Employed (Not Incorporated) | 2 | 0.5% |
| Not-for-profit Organizations | 7 | 1.8% |
| Local Government Employees | 36 | 9.2% |
| State Government Employees | 0 | 0.0% |
| Federal Government Employees | 0 | 0.0% |
| Unpaid Family Workers | 0 | 0.0% |
| Total | 389 | 100.0% |
Employment Status by Age in Roseland
According to the labor force statistics for Roseland, out of the total population over 16 years of age (896), 48.8% or 437 individuals are in the labor force, with 8.0% or 35 of them unemployed. The age group with the highest labor force participation rate is 25 to 29 years, with 92.2% or 106 individuals in the labor force. Within the labor force, the 35 to 44 years age range has the highest percentage of unemployed individuals, with 52.4% or 22 of them being unemployed.
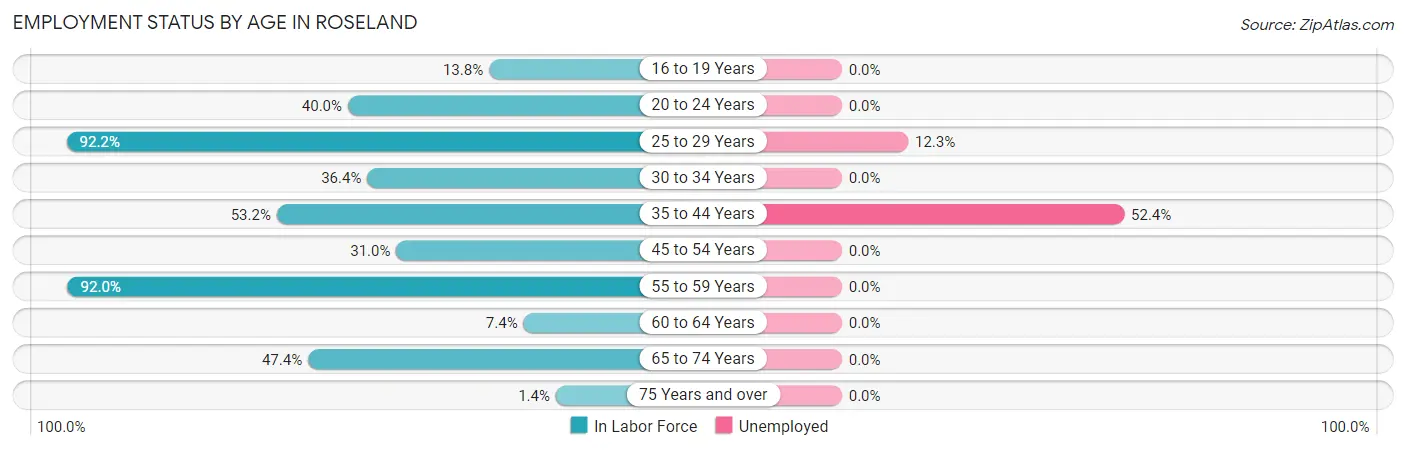
| Age Bracket | In Labor Force | Unemployed |
| 16 to 19 Years | 4 (13.8%) | 0 (0.0%) |
| 20 to 24 Years | 22 (40.0%) | 0 (0.0%) |
| 25 to 29 Years | 106 (92.2%) | 13 (12.3%) |
| 30 to 34 Years | 16 (36.4%) | 0 (0.0%) |
| 35 to 44 Years | 42 (53.2%) | 22 (52.4%) |
| 45 to 54 Years | 18 (31.0%) | 0 (0.0%) |
| 55 to 59 Years | 184 (92.0%) | 0 (0.0%) |
| 60 to 64 Years | 7 (7.4%) | 0 (0.0%) |
| 65 to 74 Years | 36 (47.4%) | 0 (0.0%) |
| 75 Years and over | 2 (1.4%) | 0 (0.0%) |
| Total | 437 (48.8%) | 35 (8.0%) |
Employment Status by Educational Attainment in Roseland
According to labor force statistics for Roseland, 63.1% of individuals (373) out of the total population between 25 and 64 years of age (591) are in the labor force, with 9.4% or 35 of them being unemployed. The group with the highest labor force participation rate are those with the educational attainment of high school diploma, with 69.9% or 263 individuals in the labor force. Within the labor force, individuals with college / associate degree education have the highest percentage of unemployment, with 39.3% or 35 of them being unemployed.
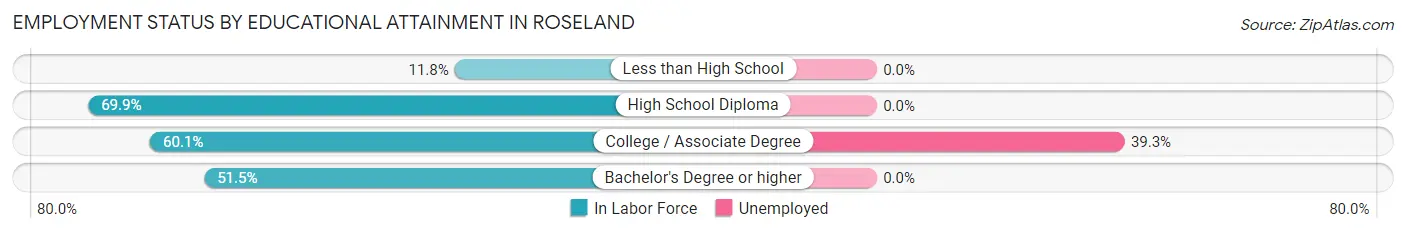
| Educational Attainment | In Labor Force | Unemployed |
| Less than High School | 4 (11.8%) | 0 (0.0%) |
| High School Diploma | 263 (69.9%) | 0 (0.0%) |
| College / Associate Degree | 89 (60.1%) | 58 (39.3%) |
| Bachelor's Degree or higher | 17 (51.5%) | 0 (0.0%) |
| Total | 373 (63.1%) | 56 (9.4%) |
Employment Occupations by Sex in Roseland
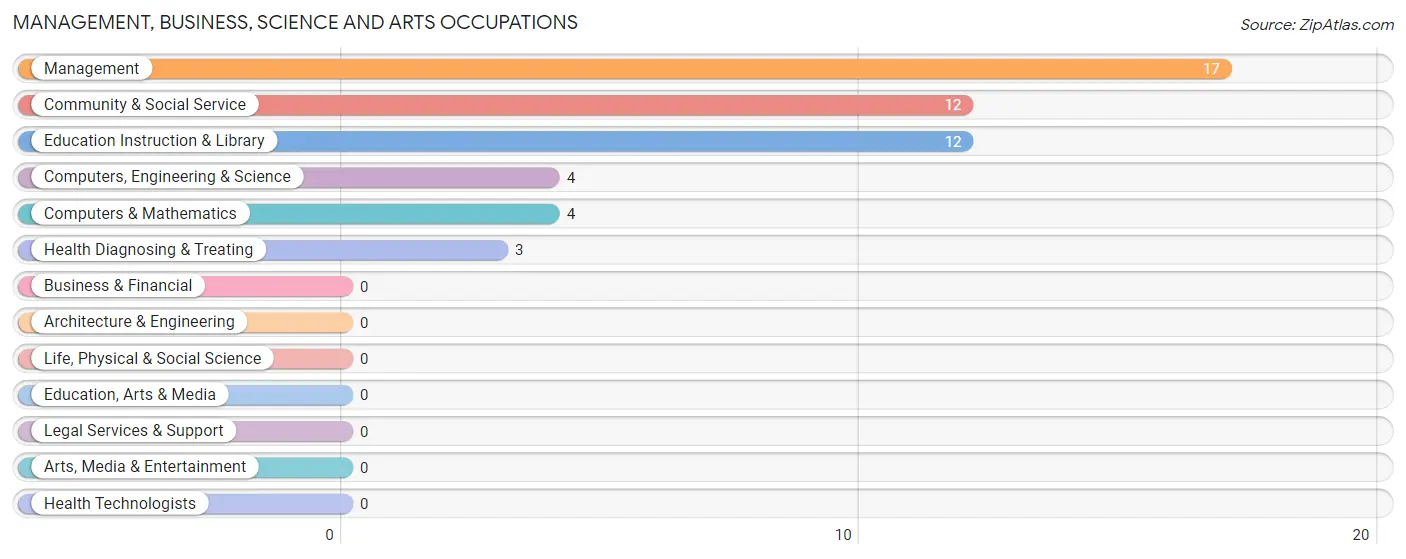
Management, Business, Science and Arts Occupations
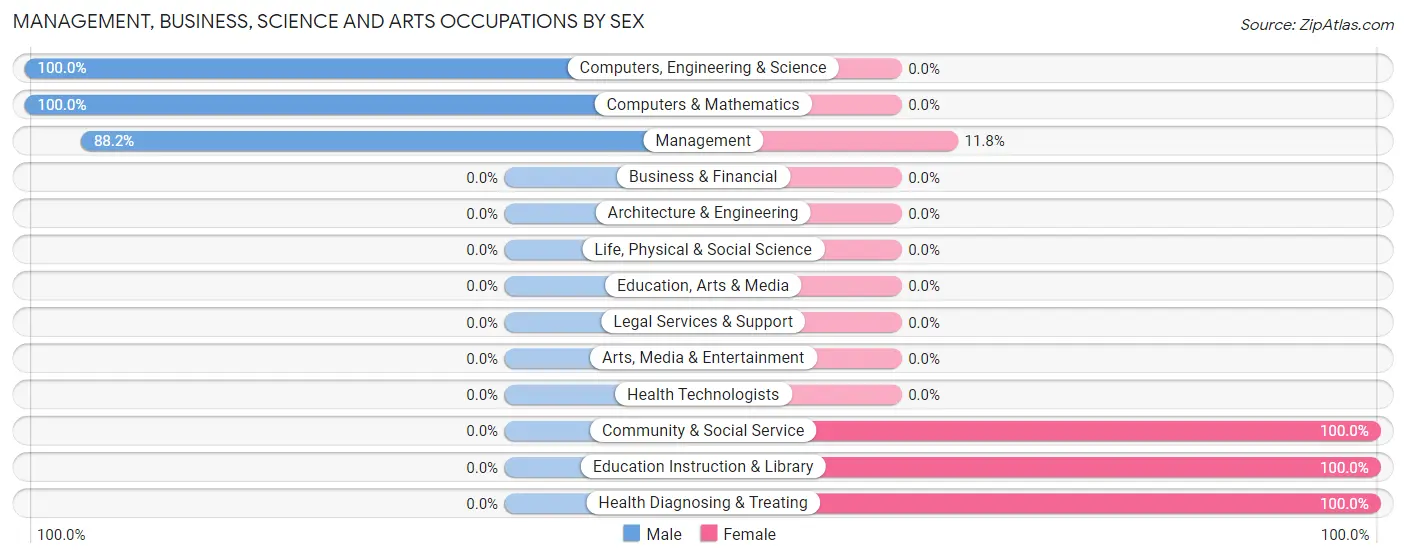
The most common Management, Business, Science and Arts occupations in Roseland are Management (17 | 4.2%), Community & Social Service (12 | 3.0%), Education Instruction & Library (12 | 3.0%), Computers, Engineering & Science (4 | 1.0%), and Computers & Mathematics (4 | 1.0%).
Management, Business, Science and Arts Occupations by Sex
Within the Management, Business, Science and Arts occupations in Roseland, the most male-oriented occupations are Computers, Engineering & Science (100.0%), Computers & Mathematics (100.0%), and Management (88.2%), while the most female-oriented occupations are Community & Social Service (100.0%), Education Instruction & Library (100.0%), and Health Diagnosing & Treating (100.0%).
| Occupation | Male | Female |
| Management | 15 (88.2%) | 2 (11.8%) |
| Business & Financial | 0 (0.0%) | 0 (0.0%) |
| Computers, Engineering & Science | 4 (100.0%) | 0 (0.0%) |
| Computers & Mathematics | 4 (100.0%) | 0 (0.0%) |
| Architecture & Engineering | 0 (0.0%) | 0 (0.0%) |
| Life, Physical & Social Science | 0 (0.0%) | 0 (0.0%) |
| Community & Social Service | 0 (0.0%) | 12 (100.0%) |
| Education, Arts & Media | 0 (0.0%) | 0 (0.0%) |
| Legal Services & Support | 0 (0.0%) | 0 (0.0%) |
| Education Instruction & Library | 0 (0.0%) | 12 (100.0%) |
| Arts, Media & Entertainment | 0 (0.0%) | 0 (0.0%) |
| Health Diagnosing & Treating | 0 (0.0%) | 3 (100.0%) |
| Health Technologists | 0 (0.0%) | 0 (0.0%) |
| Total (Category) | 19 (52.8%) | 17 (47.2%) |
| Total (Overall) | 200 (49.7%) | 202 (50.2%) |
Services Occupations
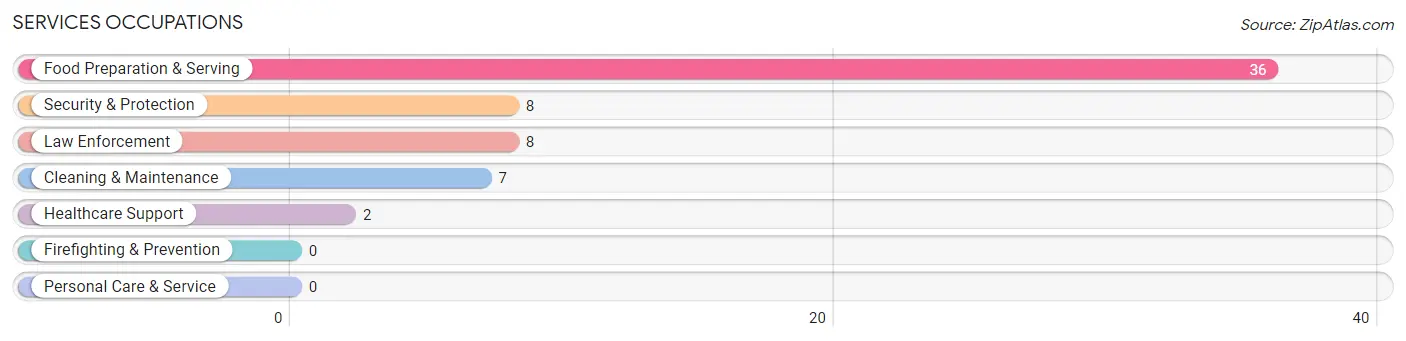
The most common Services occupations in Roseland are Food Preparation & Serving (36 | 9.0%), Security & Protection (8 | 2.0%), Law Enforcement (8 | 2.0%), Cleaning & Maintenance (7 | 1.7%), and Healthcare Support (2 | 0.5%).
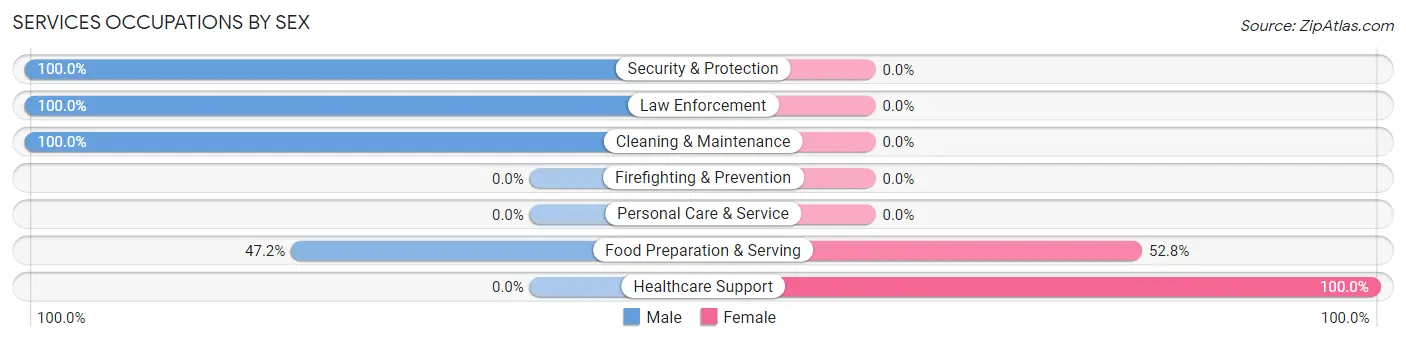
Services Occupations by Sex
Within the Services occupations in Roseland, the most male-oriented occupations are Security & Protection (100.0%), Law Enforcement (100.0%), and Cleaning & Maintenance (100.0%), while the most female-oriented occupations are Healthcare Support (100.0%), and Food Preparation & Serving (52.8%).
| Occupation | Male | Female |
| Healthcare Support | 0 (0.0%) | 2 (100.0%) |
| Security & Protection | 8 (100.0%) | 0 (0.0%) |
| Firefighting & Prevention | 0 (0.0%) | 0 (0.0%) |
| Law Enforcement | 8 (100.0%) | 0 (0.0%) |
| Food Preparation & Serving | 17 (47.2%) | 19 (52.8%) |
| Cleaning & Maintenance | 7 (100.0%) | 0 (0.0%) |
| Personal Care & Service | 0 (0.0%) | 0 (0.0%) |
| Total (Category) | 32 (60.4%) | 21 (39.6%) |
| Total (Overall) | 200 (49.7%) | 202 (50.2%) |
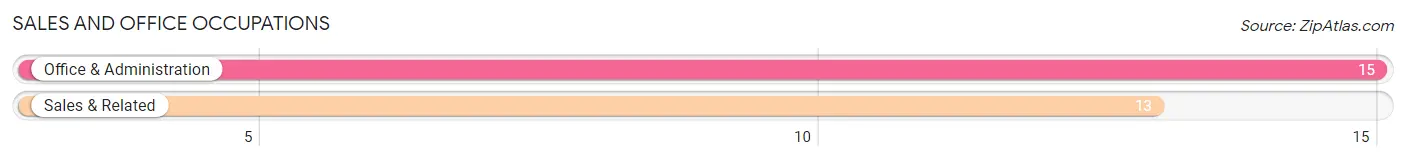
Sales and Office Occupations
The most common Sales and Office occupations in Roseland are Office & Administration (15 | 3.7%), and Sales & Related (13 | 3.2%).
Sales and Office Occupations by Sex
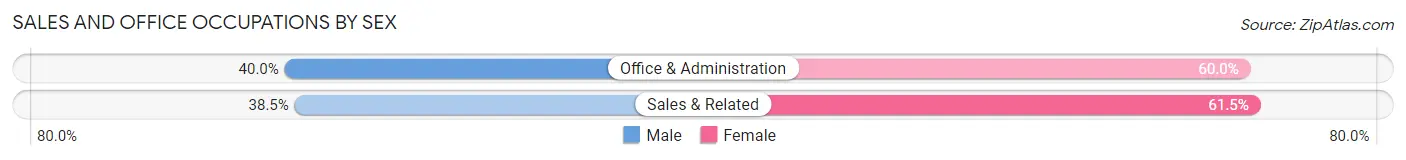
| Occupation | Male | Female |
| Sales & Related | 5 (38.5%) | 8 (61.5%) |
| Office & Administration | 6 (40.0%) | 9 (60.0%) |
| Total (Category) | 11 (39.3%) | 17 (60.7%) |
| Total (Overall) | 200 (49.7%) | 202 (50.2%) |
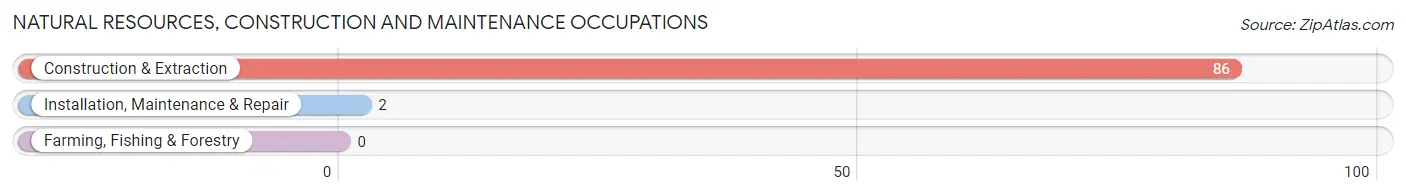
Natural Resources, Construction and Maintenance Occupations
The most common Natural Resources, Construction and Maintenance occupations in Roseland are Construction & Extraction (86 | 21.4%), and Installation, Maintenance & Repair (2 | 0.5%).
Natural Resources, Construction and Maintenance Occupations by Sex
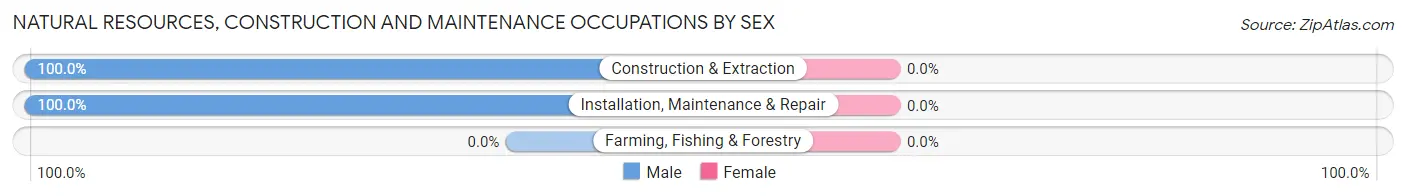
| Occupation | Male | Female |
| Farming, Fishing & Forestry | 0 (0.0%) | 0 (0.0%) |
| Construction & Extraction | 86 (100.0%) | 0 (0.0%) |
| Installation, Maintenance & Repair | 2 (100.0%) | 0 (0.0%) |
| Total (Category) | 88 (100.0%) | 0 (0.0%) |
| Total (Overall) | 200 (49.7%) | 202 (50.2%) |
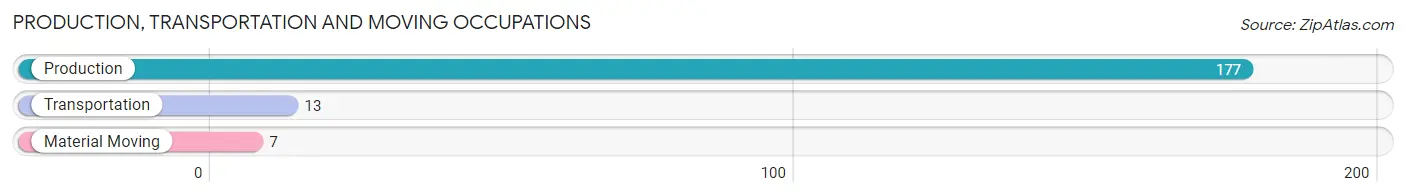
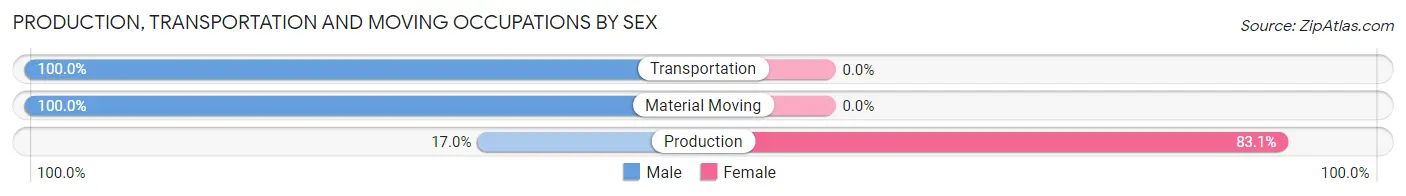
Production, Transportation and Moving Occupations
The most common Production, Transportation and Moving occupations in Roseland are Production (177 | 44.0%), Transportation (13 | 3.2%), and Material Moving (7 | 1.7%).
Production, Transportation and Moving Occupations by Sex
| Occupation | Male | Female |
| Production | 30 (17.0%) | 147 (83.1%) |
| Transportation | 13 (100.0%) | 0 (0.0%) |
| Material Moving | 7 (100.0%) | 0 (0.0%) |
| Total (Category) | 50 (25.4%) | 147 (74.6%) |
| Total (Overall) | 200 (49.7%) | 202 (50.2%) |
Employment Industries by Sex in Roseland
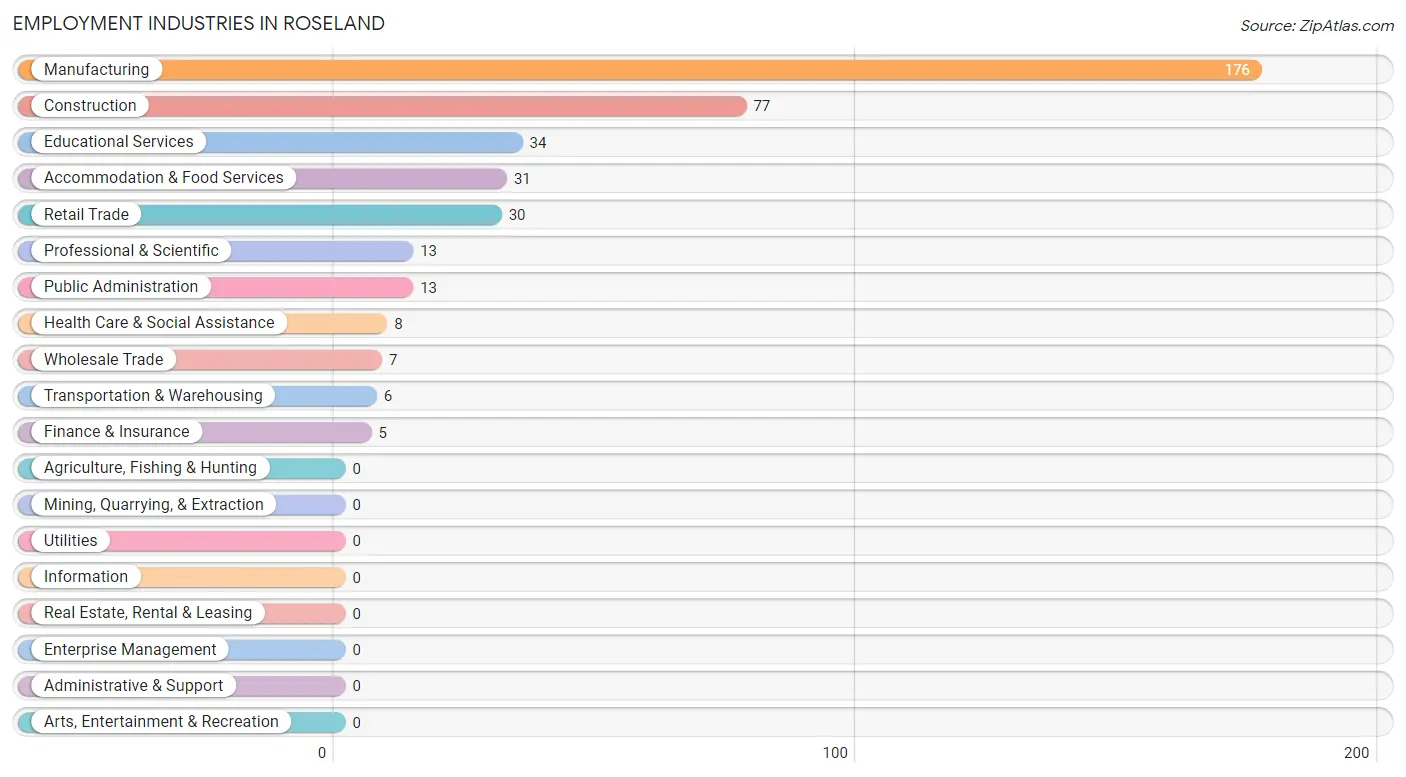
Employment Industries in Roseland
The major employment industries in Roseland include Manufacturing (176 | 43.8%), Construction (77 | 19.2%), Educational Services (34 | 8.5%), Accommodation & Food Services (31 | 7.7%), and Retail Trade (30 | 7.5%).
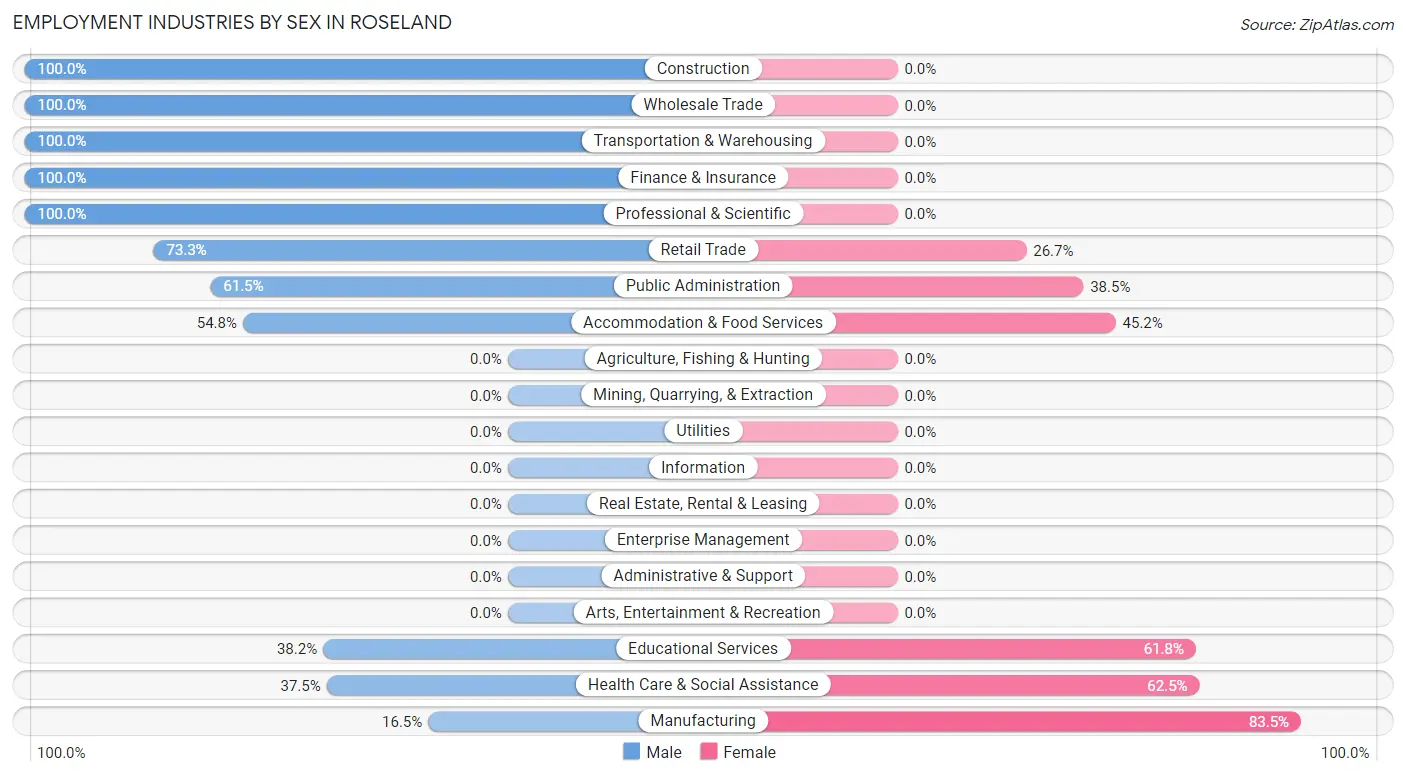
Employment Industries by Sex in Roseland
The Roseland industries that see more men than women are Construction (100.0%), Wholesale Trade (100.0%), and Transportation & Warehousing (100.0%), whereas the industries that tend to have a higher number of women are Manufacturing (83.5%), Health Care & Social Assistance (62.5%), and Educational Services (61.8%).
| Industry | Male | Female |
| Agriculture, Fishing & Hunting | 0 (0.0%) | 0 (0.0%) |
| Mining, Quarrying, & Extraction | 0 (0.0%) | 0 (0.0%) |
| Construction | 77 (100.0%) | 0 (0.0%) |
| Manufacturing | 29 (16.5%) | 147 (83.5%) |
| Wholesale Trade | 7 (100.0%) | 0 (0.0%) |
| Retail Trade | 22 (73.3%) | 8 (26.7%) |
| Transportation & Warehousing | 6 (100.0%) | 0 (0.0%) |
| Utilities | 0 (0.0%) | 0 (0.0%) |
| Information | 0 (0.0%) | 0 (0.0%) |
| Finance & Insurance | 5 (100.0%) | 0 (0.0%) |
| Real Estate, Rental & Leasing | 0 (0.0%) | 0 (0.0%) |
| Professional & Scientific | 13 (100.0%) | 0 (0.0%) |
| Enterprise Management | 0 (0.0%) | 0 (0.0%) |
| Administrative & Support | 0 (0.0%) | 0 (0.0%) |
| Educational Services | 13 (38.2%) | 21 (61.8%) |
| Health Care & Social Assistance | 3 (37.5%) | 5 (62.5%) |
| Arts, Entertainment & Recreation | 0 (0.0%) | 0 (0.0%) |
| Accommodation & Food Services | 17 (54.8%) | 14 (45.2%) |
| Public Administration | 8 (61.5%) | 5 (38.5%) |
| Total | 200 (49.7%) | 202 (50.2%) |
Education in Roseland
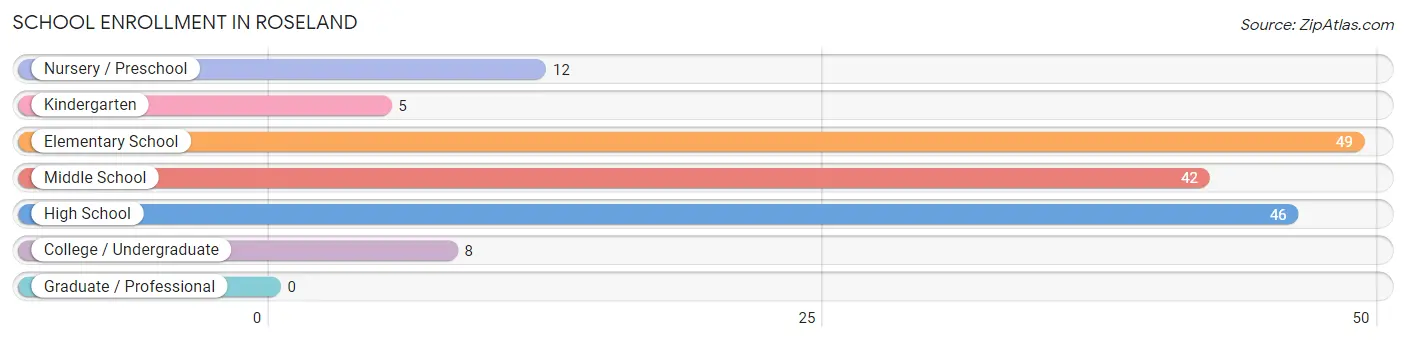
School Enrollment in Roseland
The most common levels of schooling among the 162 students in Roseland are elementary school (49 | 30.2%), high school (46 | 28.4%), and middle school (42 | 25.9%).
| School Level | # Students | % Students |
| Nursery / Preschool | 12 | 7.4% |
| Kindergarten | 5 | 3.1% |
| Elementary School | 49 | 30.2% |
| Middle School | 42 | 25.9% |
| High School | 46 | 28.4% |
| College / Undergraduate | 8 | 4.9% |
| Graduate / Professional | 0 | 0.0% |
| Total | 162 | 100.0% |
School Enrollment by Age by Funding Source in Roseland
Out of a total of 162 students who are enrolled in schools in Roseland, 24 (14.8%) attend a private institution, while the remaining 138 (85.2%) are enrolled in public schools. The age group of 5 to 9 year old has the highest likelihood of being enrolled in private schools, with 11 (26.2% in the age bracket) enrolled. Conversely, the age group of 3 to 4 year olds has the lowest likelihood of being enrolled in a private school, with 12 (100.0% in the age bracket) attending a public institution.
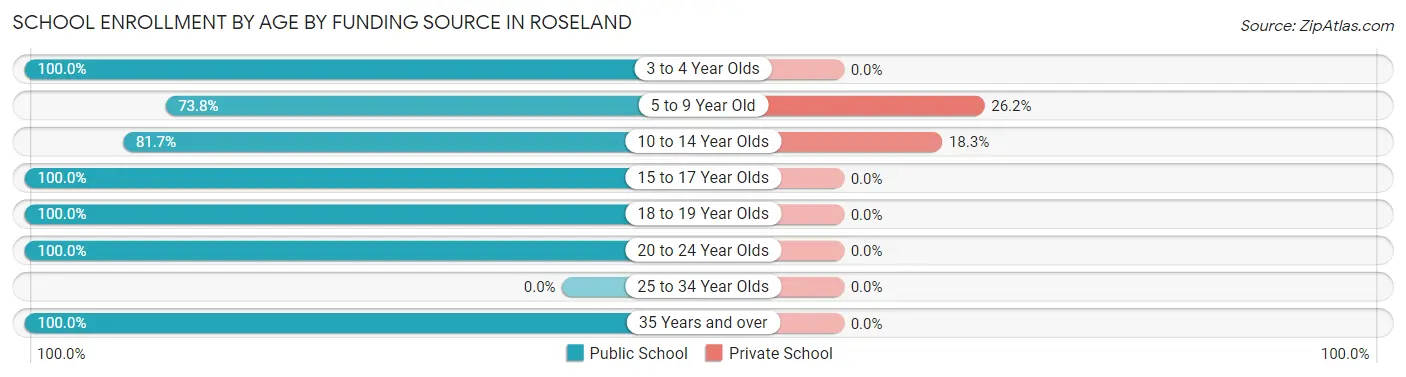
| Age Bracket | Public School | Private School |
| 3 to 4 Year Olds | 12 (100.0%) | 0 (0.0%) |
| 5 to 9 Year Old | 31 (73.8%) | 11 (26.2%) |
| 10 to 14 Year Olds | 58 (81.7%) | 13 (18.3%) |
| 15 to 17 Year Olds | 18 (100.0%) | 0 (0.0%) |
| 18 to 19 Year Olds | 11 (100.0%) | 0 (0.0%) |
| 20 to 24 Year Olds | 5 (100.0%) | 0 (0.0%) |
| 25 to 34 Year Olds | 0 (0.0%) | 0 (0.0%) |
| 35 Years and over | 3 (100.0%) | 0 (0.0%) |
| Total | 138 (85.2%) | 24 (14.8%) |
Educational Attainment by Field of Study in Roseland
Engineering (23 | 41.8%), bio, nature & agricultural (16 | 29.1%), education (9 | 16.4%), literature & languages (3 | 5.4%), and computers & mathematics (2 | 3.6%) are the most common fields of study among 55 individuals in Roseland who have obtained a bachelor's degree or higher.
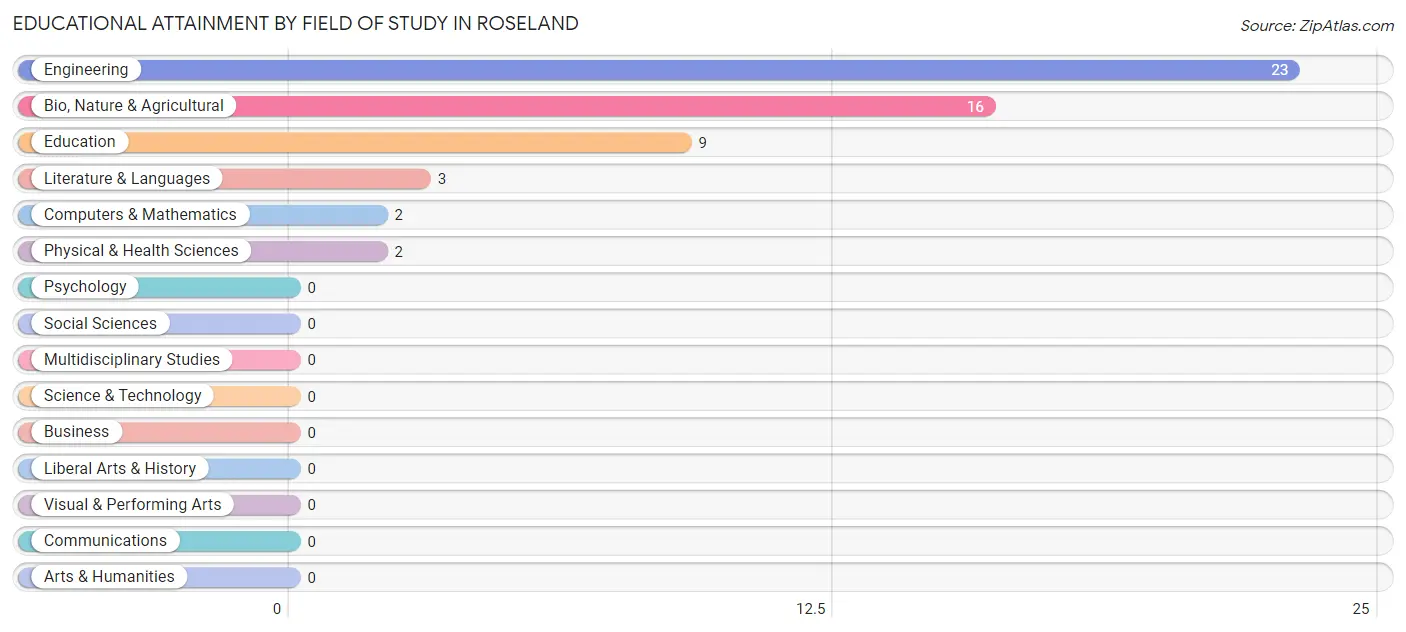
| Field of Study | # Graduates | % Graduates |
| Computers & Mathematics | 2 | 3.6% |
| Bio, Nature & Agricultural | 16 | 29.1% |
| Physical & Health Sciences | 2 | 3.6% |
| Psychology | 0 | 0.0% |
| Social Sciences | 0 | 0.0% |
| Engineering | 23 | 41.8% |
| Multidisciplinary Studies | 0 | 0.0% |
| Science & Technology | 0 | 0.0% |
| Business | 0 | 0.0% |
| Education | 9 | 16.4% |
| Literature & Languages | 3 | 5.4% |
| Liberal Arts & History | 0 | 0.0% |
| Visual & Performing Arts | 0 | 0.0% |
| Communications | 0 | 0.0% |
| Arts & Humanities | 0 | 0.0% |
| Total | 55 | 100.0% |
Transportation & Commute in Roseland
Vehicle Availability by Sex in Roseland
The most prevalent vehicle ownership categories in Roseland are males with 1 vehicle (115, accounting for 60.2%) and females with 1 vehicle (150, making up 58.1%).
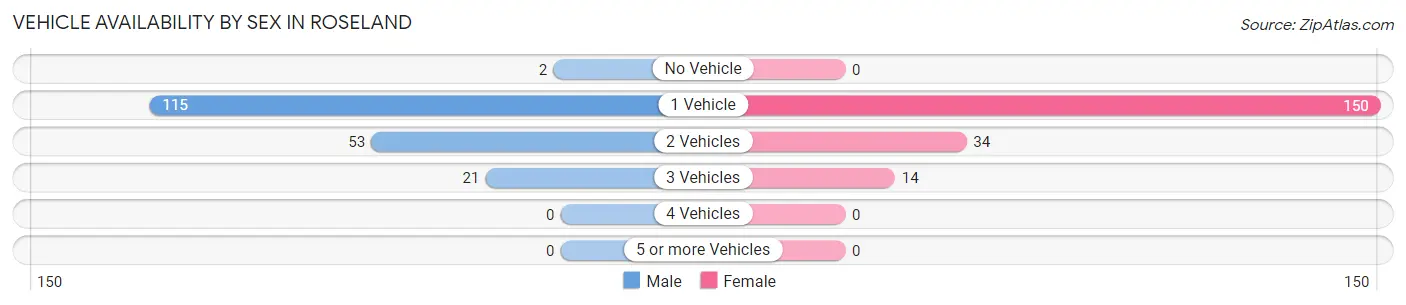
| Vehicles Available | Male | Female |
| No Vehicle | 2 (1.1%) | 0 (0.0%) |
| 1 Vehicle | 115 (60.2%) | 150 (75.8%) |
| 2 Vehicles | 53 (27.8%) | 34 (17.2%) |
| 3 Vehicles | 21 (11.0%) | 14 (7.1%) |
| 4 Vehicles | 0 (0.0%) | 0 (0.0%) |
| 5 or more Vehicles | 0 (0.0%) | 0 (0.0%) |
| Total | 191 (100.0%) | 198 (100.0%) |
Commute Time in Roseland
The most frequently occuring commute durations in Roseland are 45 to 59 minutes (145 commuters, 37.3%), 25 to 29 minutes (81 commuters, 20.8%), and 30 to 34 minutes (32 commuters, 8.2%).
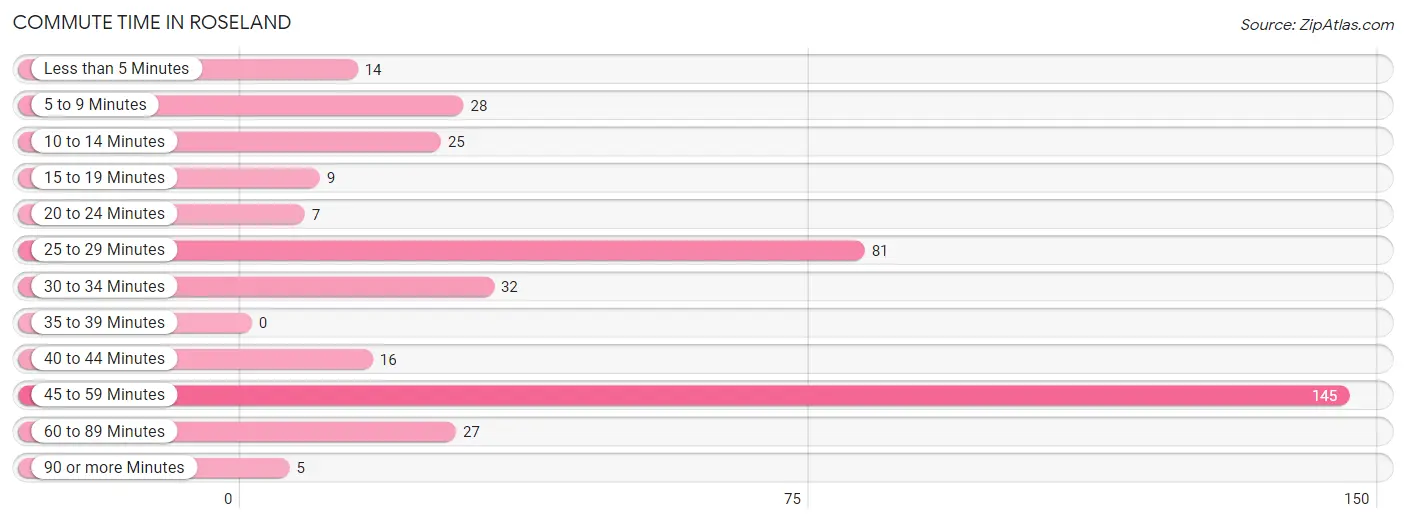
| Commute Time | # Commuters | % Commuters |
| Less than 5 Minutes | 14 | 3.6% |
| 5 to 9 Minutes | 28 | 7.2% |
| 10 to 14 Minutes | 25 | 6.4% |
| 15 to 19 Minutes | 9 | 2.3% |
| 20 to 24 Minutes | 7 | 1.8% |
| 25 to 29 Minutes | 81 | 20.8% |
| 30 to 34 Minutes | 32 | 8.2% |
| 35 to 39 Minutes | 0 | 0.0% |
| 40 to 44 Minutes | 16 | 4.1% |
| 45 to 59 Minutes | 145 | 37.3% |
| 60 to 89 Minutes | 27 | 6.9% |
| 90 or more Minutes | 5 | 1.3% |
Commute Time by Sex in Roseland
The most common commute times in Roseland are 25 to 29 minutes (81 commuters, 42.4%) for males and 45 to 59 minutes (145 commuters, 73.2%) for females.
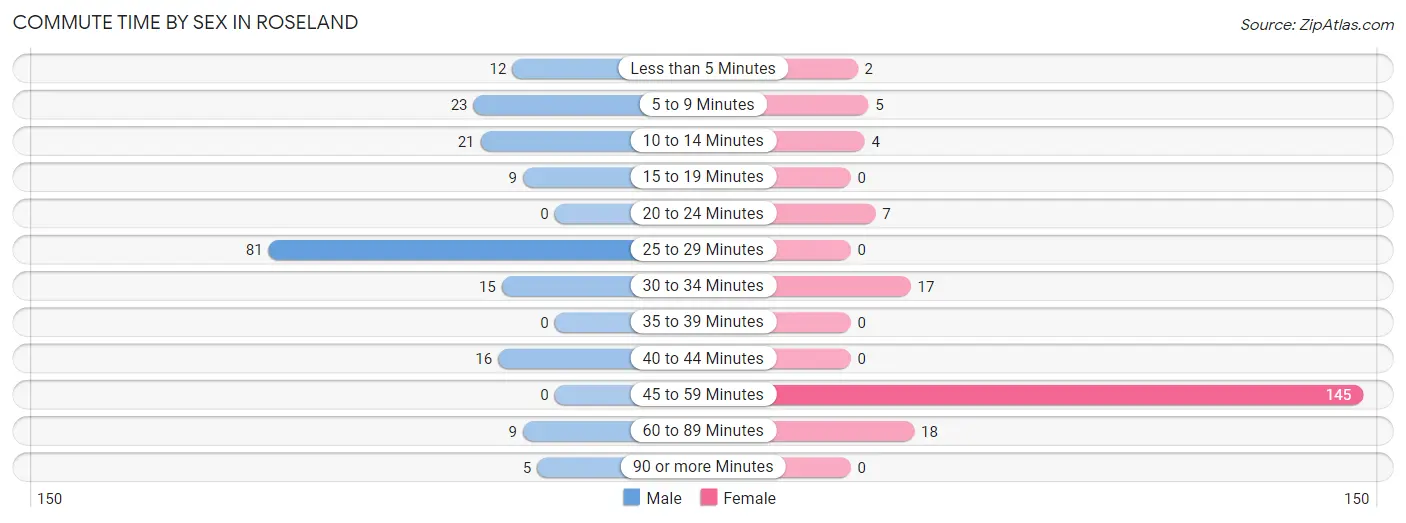
| Commute Time | Male | Female |
| Less than 5 Minutes | 12 (6.3%) | 2 (1.0%) |
| 5 to 9 Minutes | 23 (12.0%) | 5 (2.5%) |
| 10 to 14 Minutes | 21 (11.0%) | 4 (2.0%) |
| 15 to 19 Minutes | 9 (4.7%) | 0 (0.0%) |
| 20 to 24 Minutes | 0 (0.0%) | 7 (3.5%) |
| 25 to 29 Minutes | 81 (42.4%) | 0 (0.0%) |
| 30 to 34 Minutes | 15 (7.9%) | 17 (8.6%) |
| 35 to 39 Minutes | 0 (0.0%) | 0 (0.0%) |
| 40 to 44 Minutes | 16 (8.4%) | 0 (0.0%) |
| 45 to 59 Minutes | 0 (0.0%) | 145 (73.2%) |
| 60 to 89 Minutes | 9 (4.7%) | 18 (9.1%) |
| 90 or more Minutes | 5 (2.6%) | 0 (0.0%) |
Time of Departure to Work by Sex in Roseland
The most frequent times of departure to work in Roseland are 7:00 AM to 7:29 AM (77, 40.3%) for males and 4:00 PM to 11:59 PM (143, 72.2%) for females.
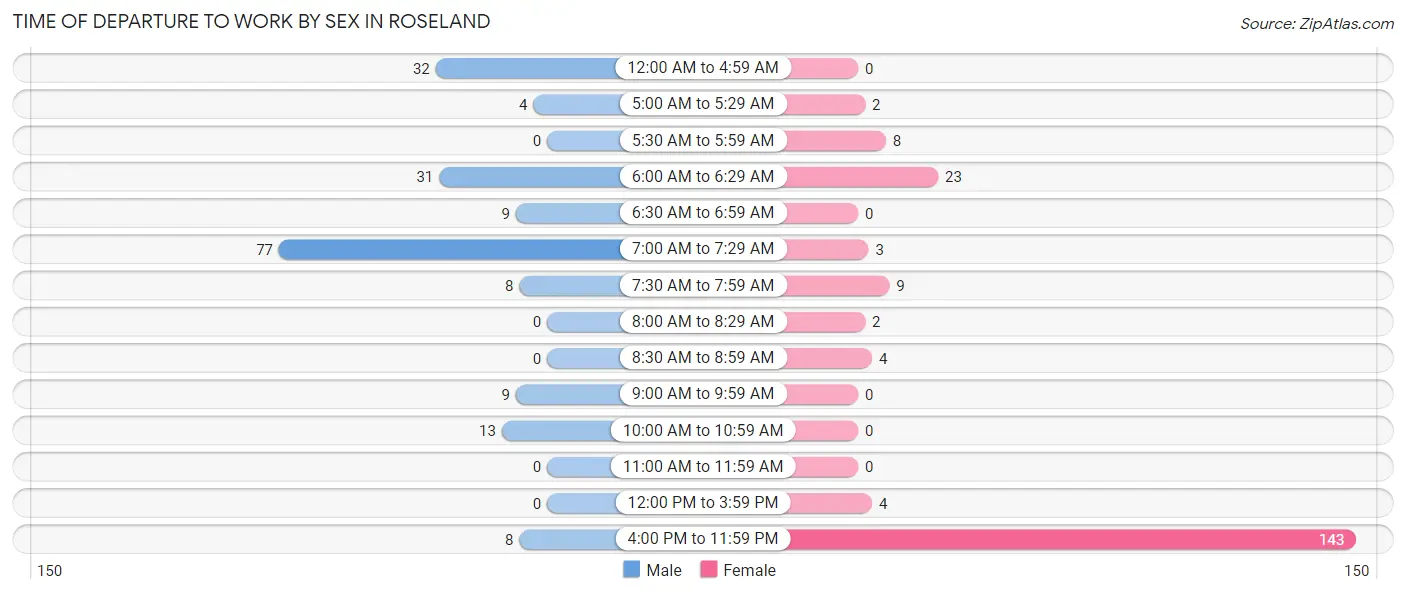
| Time of Departure | Male | Female |
| 12:00 AM to 4:59 AM | 32 (16.8%) | 0 (0.0%) |
| 5:00 AM to 5:29 AM | 4 (2.1%) | 2 (1.0%) |
| 5:30 AM to 5:59 AM | 0 (0.0%) | 8 (4.0%) |
| 6:00 AM to 6:29 AM | 31 (16.2%) | 23 (11.6%) |
| 6:30 AM to 6:59 AM | 9 (4.7%) | 0 (0.0%) |
| 7:00 AM to 7:29 AM | 77 (40.3%) | 3 (1.5%) |
| 7:30 AM to 7:59 AM | 8 (4.2%) | 9 (4.5%) |
| 8:00 AM to 8:29 AM | 0 (0.0%) | 2 (1.0%) |
| 8:30 AM to 8:59 AM | 0 (0.0%) | 4 (2.0%) |
| 9:00 AM to 9:59 AM | 9 (4.7%) | 0 (0.0%) |
| 10:00 AM to 10:59 AM | 13 (6.8%) | 0 (0.0%) |
| 11:00 AM to 11:59 AM | 0 (0.0%) | 0 (0.0%) |
| 12:00 PM to 3:59 PM | 0 (0.0%) | 4 (2.0%) |
| 4:00 PM to 11:59 PM | 8 (4.2%) | 143 (72.2%) |
| Total | 191 (100.0%) | 198 (100.0%) |
Housing Occupancy in Roseland
Occupancy by Ownership in Roseland
Of the total 430 dwellings in Roseland, owner-occupied units account for 364 (84.7%), while renter-occupied units make up 66 (15.3%).
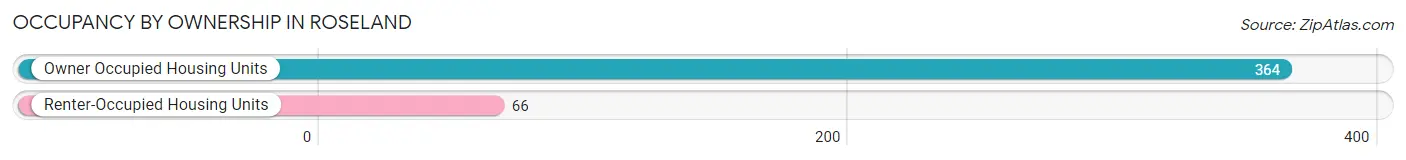
| Occupancy | # Housing Units | % Housing Units |
| Owner Occupied Housing Units | 364 | 84.7% |
| Renter-Occupied Housing Units | 66 | 15.3% |
| Total Occupied Housing Units | 430 | 100.0% |
Occupancy by Household Size in Roseland
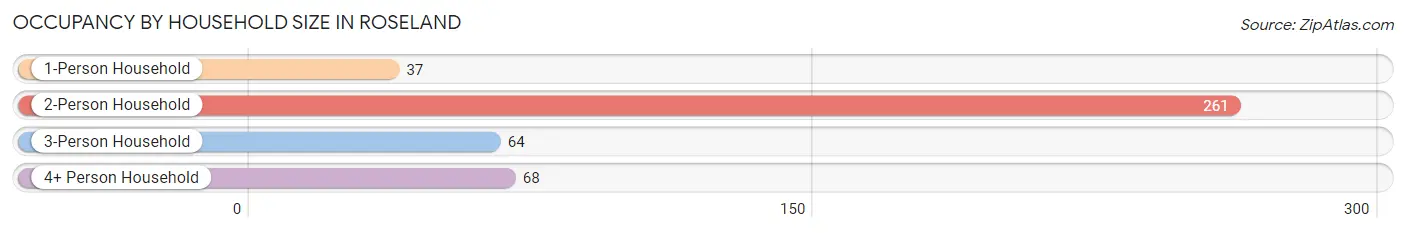
| Household Size | # Housing Units | % Housing Units |
| 1-Person Household | 37 | 8.6% |
| 2-Person Household | 261 | 60.7% |
| 3-Person Household | 64 | 14.9% |
| 4+ Person Household | 68 | 15.8% |
| Total Housing Units | 430 | 100.0% |
Occupancy by Ownership by Household Size in Roseland
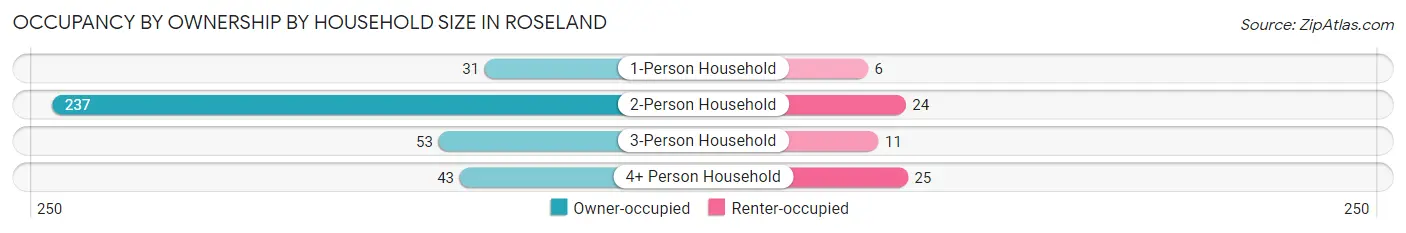
| Household Size | Owner-occupied | Renter-occupied |
| 1-Person Household | 31 (83.8%) | 6 (16.2%) |
| 2-Person Household | 237 (90.8%) | 24 (9.2%) |
| 3-Person Household | 53 (82.8%) | 11 (17.2%) |
| 4+ Person Household | 43 (63.2%) | 25 (36.8%) |
| Total Housing Units | 364 (84.7%) | 66 (15.3%) |
Occupancy by Educational Attainment in Roseland
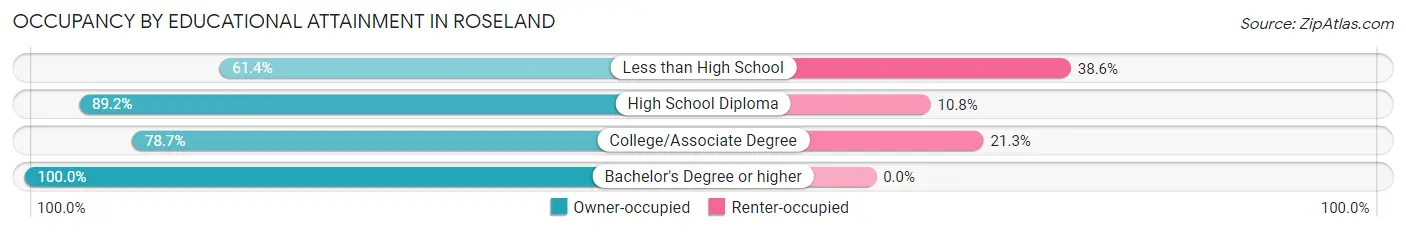
| Household Size | Owner-occupied | Renter-occupied |
| Less than High School | 35 (61.4%) | 22 (38.6%) |
| High School Diploma | 256 (89.2%) | 31 (10.8%) |
| College/Associate Degree | 48 (78.7%) | 13 (21.3%) |
| Bachelor's Degree or higher | 25 (100.0%) | 0 (0.0%) |
Occupancy by Age of Householder in Roseland
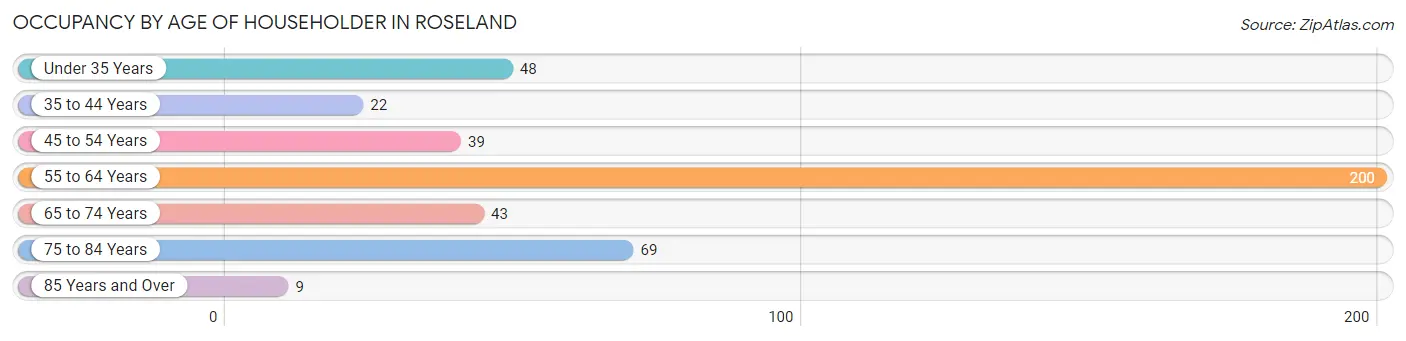
| Age Bracket | # Households | % Households |
| Under 35 Years | 48 | 11.2% |
| 35 to 44 Years | 22 | 5.1% |
| 45 to 54 Years | 39 | 9.1% |
| 55 to 64 Years | 200 | 46.5% |
| 65 to 74 Years | 43 | 10.0% |
| 75 to 84 Years | 69 | 16.1% |
| 85 Years and Over | 9 | 2.1% |
| Total | 430 | 100.0% |
Housing Finances in Roseland
Median Income by Occupancy in Roseland
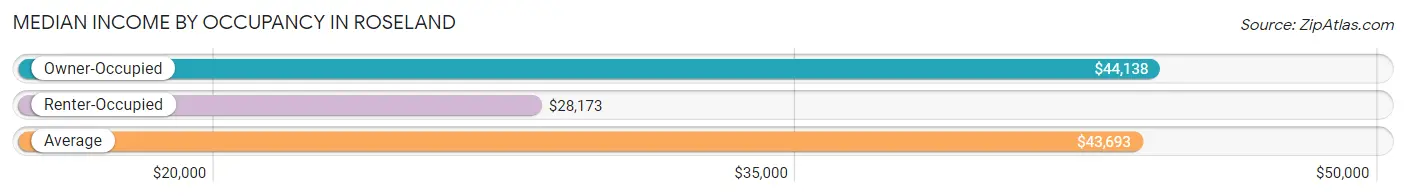
| Occupancy Type | # Households | Median Income |
| Owner-Occupied | 364 (84.7%) | $44,138 |
| Renter-Occupied | 66 (15.3%) | $28,173 |
| Average | 430 (100.0%) | $43,693 |
Occupancy by Householder Income Bracket in Roseland
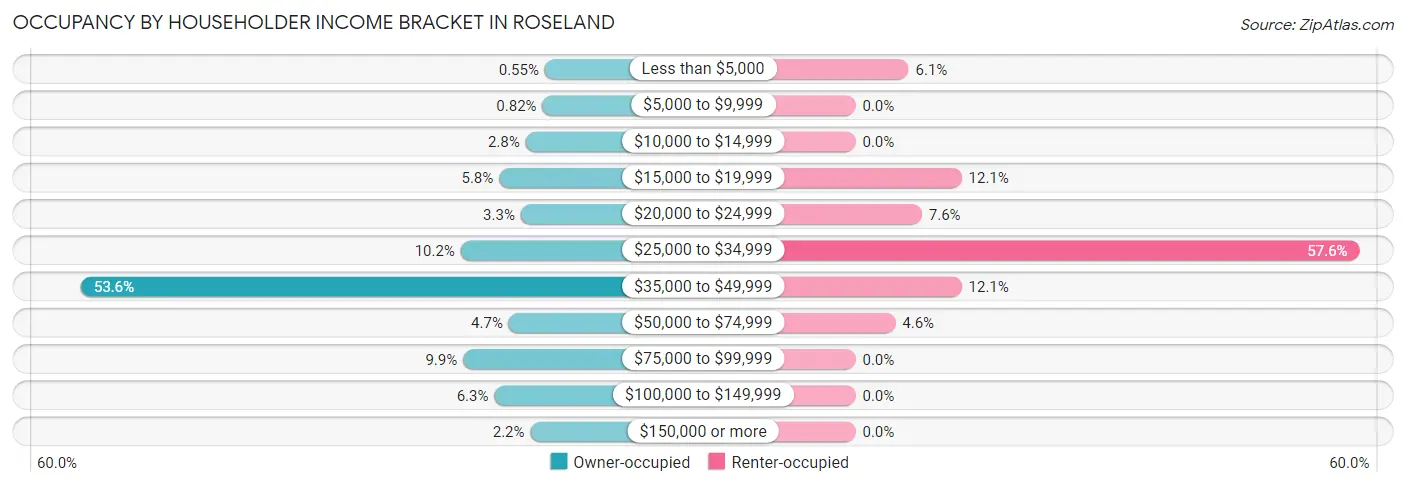
| Income Bracket | Owner-occupied | Renter-occupied |
| Less than $5,000 | 2 (0.5%) | 4 (6.1%) |
| $5,000 to $9,999 | 3 (0.8%) | 0 (0.0%) |
| $10,000 to $14,999 | 10 (2.8%) | 0 (0.0%) |
| $15,000 to $19,999 | 21 (5.8%) | 8 (12.1%) |
| $20,000 to $24,999 | 12 (3.3%) | 5 (7.6%) |
| $25,000 to $34,999 | 37 (10.2%) | 38 (57.6%) |
| $35,000 to $49,999 | 195 (53.6%) | 8 (12.1%) |
| $50,000 to $74,999 | 17 (4.7%) | 3 (4.5%) |
| $75,000 to $99,999 | 36 (9.9%) | 0 (0.0%) |
| $100,000 to $149,999 | 23 (6.3%) | 0 (0.0%) |
| $150,000 or more | 8 (2.2%) | 0 (0.0%) |
| Total | 364 (100.0%) | 66 (100.0%) |
Monthly Housing Cost Tiers in Roseland
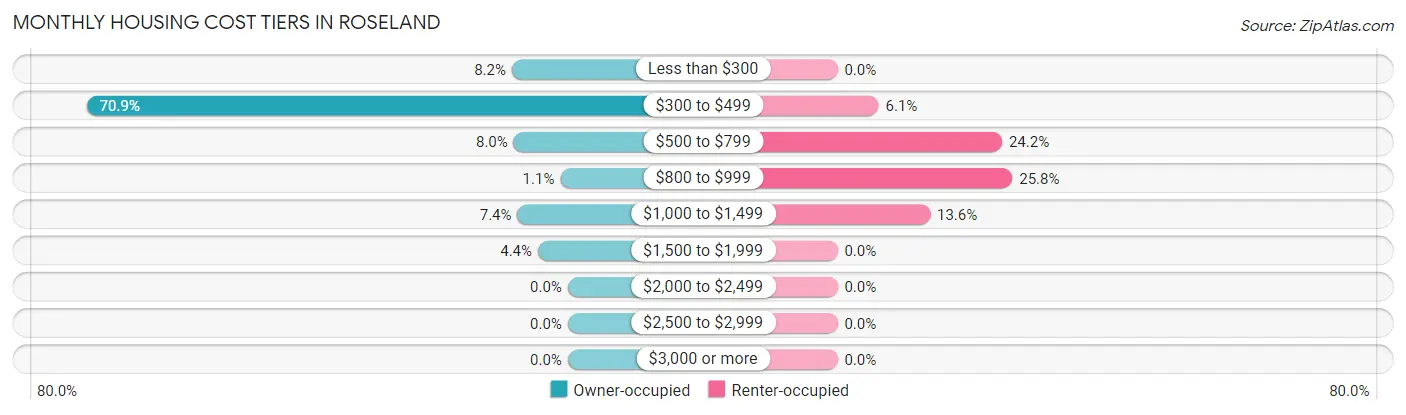
| Monthly Cost | Owner-occupied | Renter-occupied |
| Less than $300 | 30 (8.2%) | 0 (0.0%) |
| $300 to $499 | 258 (70.9%) | 4 (6.1%) |
| $500 to $799 | 29 (8.0%) | 16 (24.2%) |
| $800 to $999 | 4 (1.1%) | 17 (25.8%) |
| $1,000 to $1,499 | 27 (7.4%) | 9 (13.6%) |
| $1,500 to $1,999 | 16 (4.4%) | 0 (0.0%) |
| $2,000 to $2,499 | 0 (0.0%) | 0 (0.0%) |
| $2,500 to $2,999 | 0 (0.0%) | 0 (0.0%) |
| $3,000 or more | 0 (0.0%) | 0 (0.0%) |
| Total | 364 (100.0%) | 66 (100.0%) |
Physical Housing Characteristics in Roseland
Housing Structures in Roseland
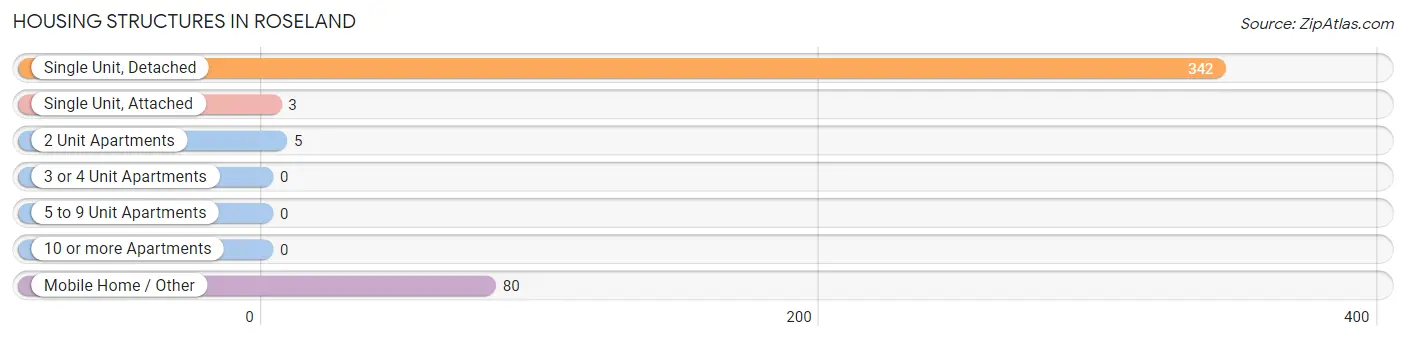
| Structure Type | # Housing Units | % Housing Units |
| Single Unit, Detached | 342 | 79.5% |
| Single Unit, Attached | 3 | 0.7% |
| 2 Unit Apartments | 5 | 1.2% |
| 3 or 4 Unit Apartments | 0 | 0.0% |
| 5 to 9 Unit Apartments | 0 | 0.0% |
| 10 or more Apartments | 0 | 0.0% |
| Mobile Home / Other | 80 | 18.6% |
| Total | 430 | 100.0% |
Housing Structures by Occupancy in Roseland
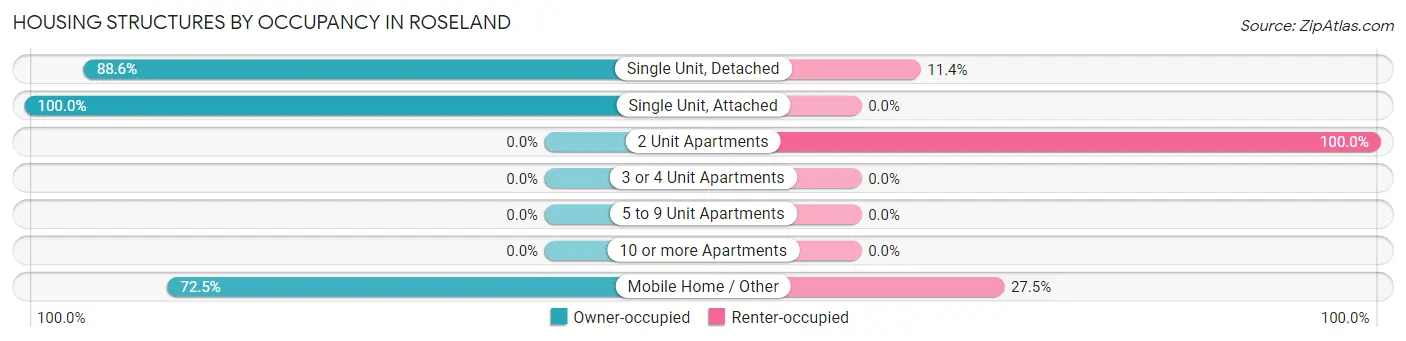
| Structure Type | Owner-occupied | Renter-occupied |
| Single Unit, Detached | 303 (88.6%) | 39 (11.4%) |
| Single Unit, Attached | 3 (100.0%) | 0 (0.0%) |
| 2 Unit Apartments | 0 (0.0%) | 5 (100.0%) |
| 3 or 4 Unit Apartments | 0 (0.0%) | 0 (0.0%) |
| 5 to 9 Unit Apartments | 0 (0.0%) | 0 (0.0%) |
| 10 or more Apartments | 0 (0.0%) | 0 (0.0%) |
| Mobile Home / Other | 58 (72.5%) | 22 (27.5%) |
| Total | 364 (84.7%) | 66 (15.3%) |
Housing Structures by Number of Rooms in Roseland
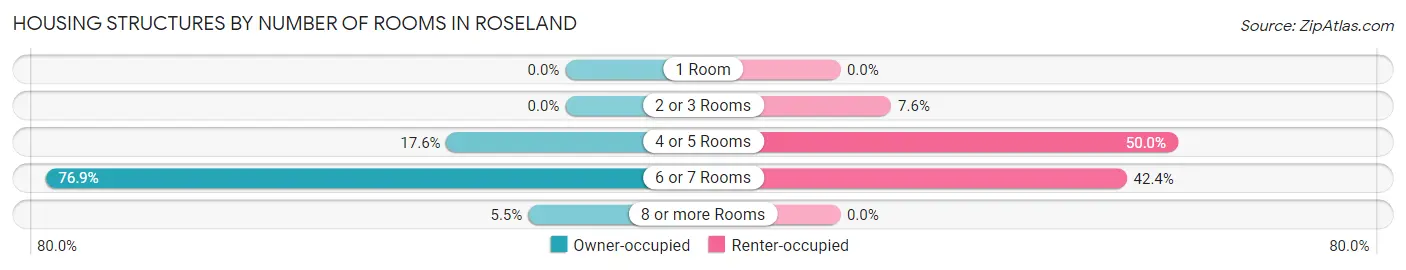
| Number of Rooms | Owner-occupied | Renter-occupied |
| 1 Room | 0 (0.0%) | 0 (0.0%) |
| 2 or 3 Rooms | 0 (0.0%) | 5 (7.6%) |
| 4 or 5 Rooms | 64 (17.6%) | 33 (50.0%) |
| 6 or 7 Rooms | 280 (76.9%) | 28 (42.4%) |
| 8 or more Rooms | 20 (5.5%) | 0 (0.0%) |
| Total | 364 (100.0%) | 66 (100.0%) |
Housing Structure by Heating Type in Roseland
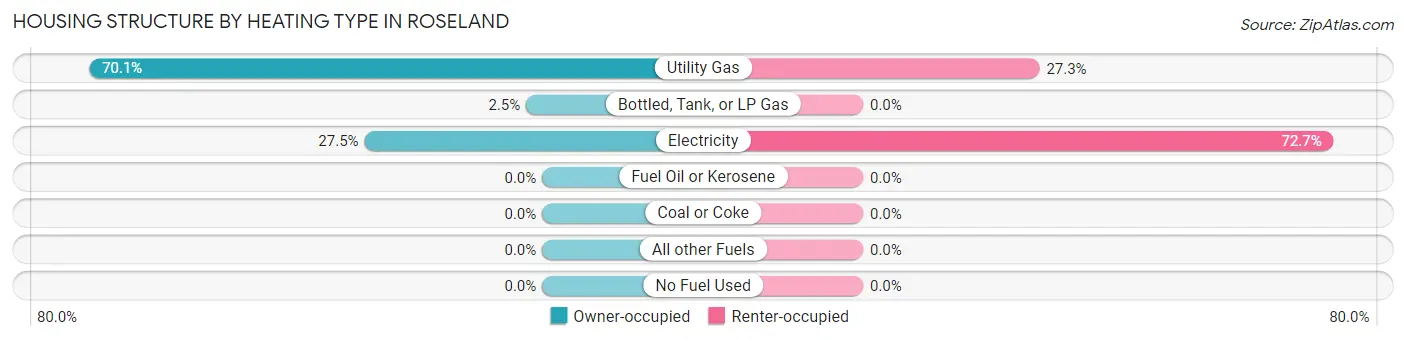
| Heating Type | Owner-occupied | Renter-occupied |
| Utility Gas | 255 (70.1%) | 18 (27.3%) |
| Bottled, Tank, or LP Gas | 9 (2.5%) | 0 (0.0%) |
| Electricity | 100 (27.5%) | 48 (72.7%) |
| Fuel Oil or Kerosene | 0 (0.0%) | 0 (0.0%) |
| Coal or Coke | 0 (0.0%) | 0 (0.0%) |
| All other Fuels | 0 (0.0%) | 0 (0.0%) |
| No Fuel Used | 0 (0.0%) | 0 (0.0%) |
| Total | 364 (100.0%) | 66 (100.0%) |
Household Vehicle Usage in Roseland
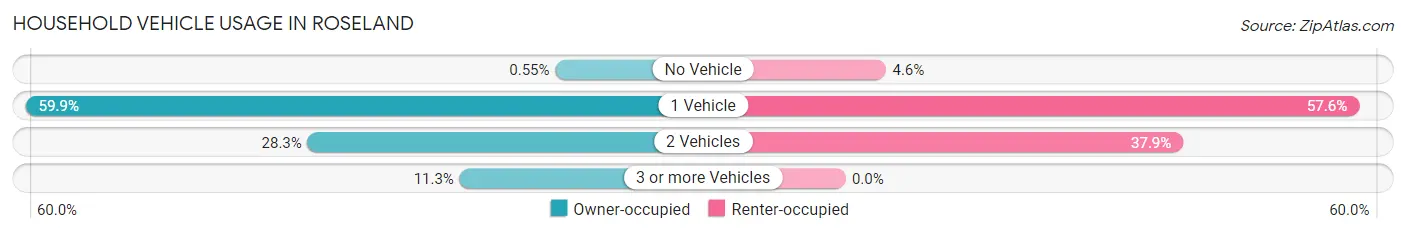
| Vehicles per Household | Owner-occupied | Renter-occupied |
| No Vehicle | 2 (0.5%) | 3 (4.5%) |
| 1 Vehicle | 218 (59.9%) | 38 (57.6%) |
| 2 Vehicles | 103 (28.3%) | 25 (37.9%) |
| 3 or more Vehicles | 41 (11.3%) | 0 (0.0%) |
| Total | 364 (100.0%) | 66 (100.0%) |
Real Estate & Mortgages in Roseland
Real Estate and Mortgage Overview in Roseland
| Characteristic | Without Mortgage | With Mortgage |
| Housing Units | 306 | 58 |
| Median Property Value | $107,800 | $100,000 |
| Median Household Income | $43,724 | $8 |
| Monthly Housing Costs | $437 | $0 |
| Real Estate Taxes | $199 | $8 |
Property Value by Mortgage Status in Roseland
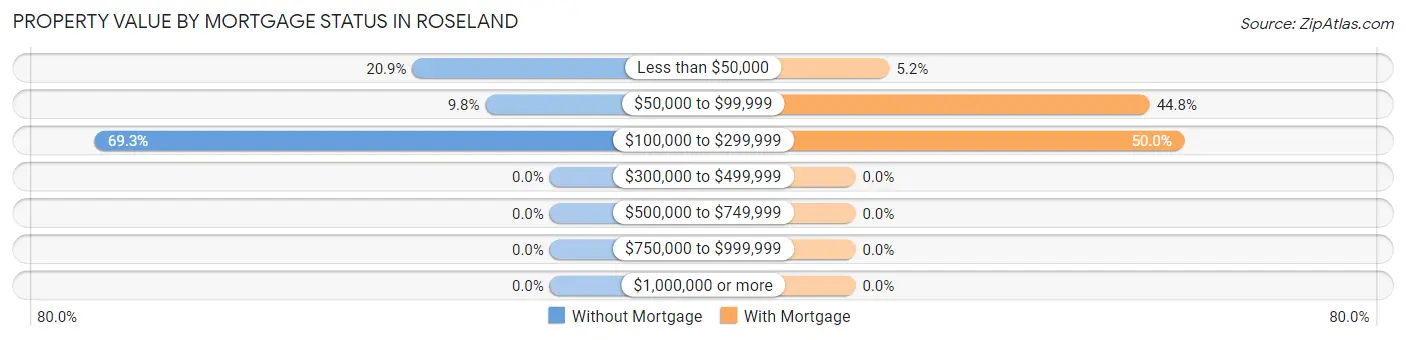
| Property Value | Without Mortgage | With Mortgage |
| Less than $50,000 | 64 (20.9%) | 3 (5.2%) |
| $50,000 to $99,999 | 30 (9.8%) | 26 (44.8%) |
| $100,000 to $299,999 | 212 (69.3%) | 29 (50.0%) |
| $300,000 to $499,999 | 0 (0.0%) | 0 (0.0%) |
| $500,000 to $749,999 | 0 (0.0%) | 0 (0.0%) |
| $750,000 to $999,999 | 0 (0.0%) | 0 (0.0%) |
| $1,000,000 or more | 0 (0.0%) | 0 (0.0%) |
| Total | 306 (100.0%) | 58 (100.0%) |
Household Income by Mortgage Status in Roseland
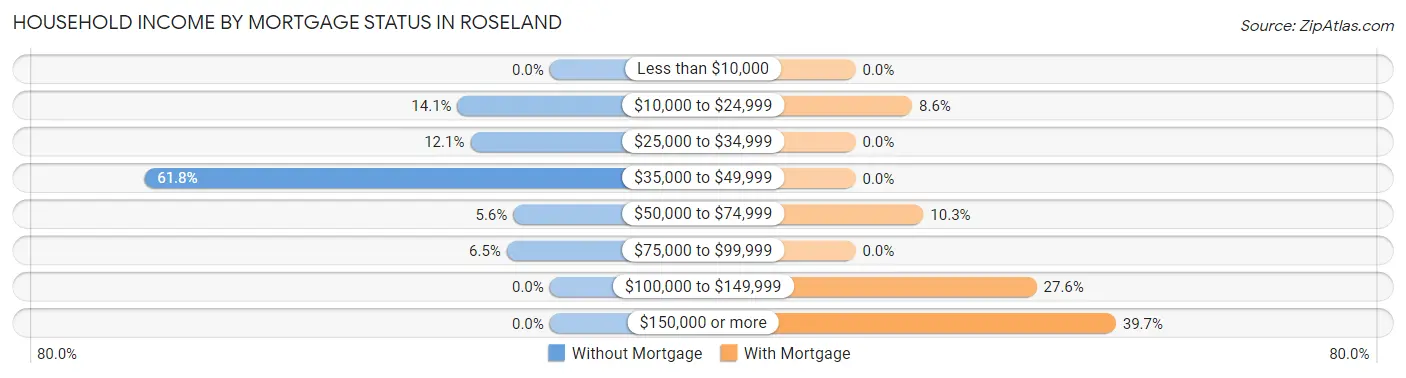
| Household Income | Without Mortgage | With Mortgage |
| Less than $10,000 | 0 (0.0%) | 0 (0.0%) |
| $10,000 to $24,999 | 43 (14.1%) | 5 (8.6%) |
| $25,000 to $34,999 | 37 (12.1%) | 0 (0.0%) |
| $35,000 to $49,999 | 189 (61.8%) | 0 (0.0%) |
| $50,000 to $74,999 | 17 (5.6%) | 6 (10.3%) |
| $75,000 to $99,999 | 20 (6.5%) | 0 (0.0%) |
| $100,000 to $149,999 | 0 (0.0%) | 16 (27.6%) |
| $150,000 or more | 0 (0.0%) | 23 (39.7%) |
| Total | 306 (100.0%) | 58 (100.0%) |
Property Value to Household Income Ratio in Roseland
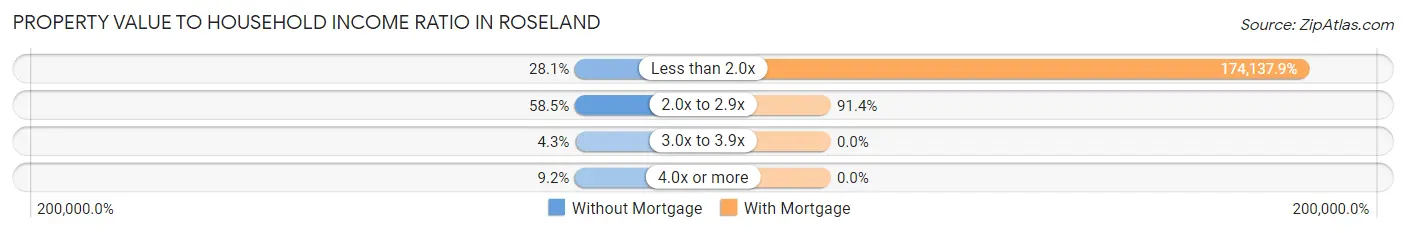
| Value-to-Income Ratio | Without Mortgage | With Mortgage |
| Less than 2.0x | 86 (28.1%) | 101,000 (174,137.9%) |
| 2.0x to 2.9x | 179 (58.5%) | 53 (91.4%) |
| 3.0x to 3.9x | 13 (4.3%) | 0 (0.0%) |
| 4.0x or more | 28 (9.1%) | 0 (0.0%) |
| Total | 306 (100.0%) | 58 (100.0%) |
Real Estate Taxes by Mortgage Status in Roseland
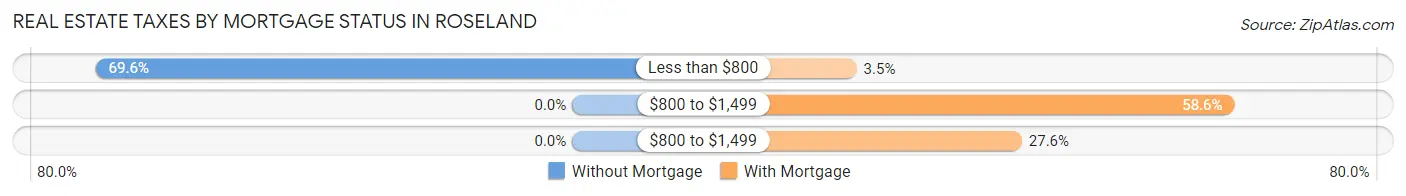
| Property Taxes | Without Mortgage | With Mortgage |
| Less than $800 | 213 (69.6%) | 2 (3.5%) |
| $800 to $1,499 | 0 (0.0%) | 34 (58.6%) |
| $800 to $1,499 | 0 (0.0%) | 16 (27.6%) |
| Total | 306 (100.0%) | 58 (100.0%) |
Health & Disability in Roseland
Health Insurance Coverage by Age in Roseland
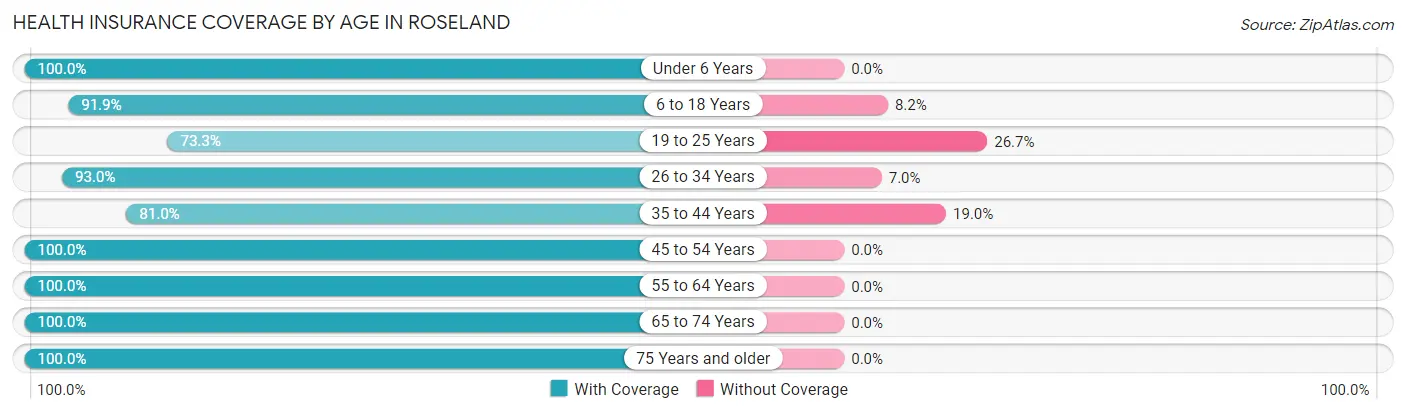
| Age Bracket | With Coverage | Without Coverage |
| Under 6 Years | 231 (100.0%) | 0 (0.0%) |
| 6 to 18 Years | 124 (91.8%) | 11 (8.2%) |
| 19 to 25 Years | 55 (73.3%) | 20 (26.7%) |
| 26 to 34 Years | 133 (93.0%) | 10 (7.0%) |
| 35 to 44 Years | 64 (81.0%) | 15 (19.0%) |
| 45 to 54 Years | 58 (100.0%) | 0 (0.0%) |
| 55 to 64 Years | 295 (100.0%) | 0 (0.0%) |
| 65 to 74 Years | 76 (100.0%) | 0 (0.0%) |
| 75 Years and older | 145 (100.0%) | 0 (0.0%) |
| Total | 1,181 (95.5%) | 56 (4.5%) |
Health Insurance Coverage by Citizenship Status in Roseland
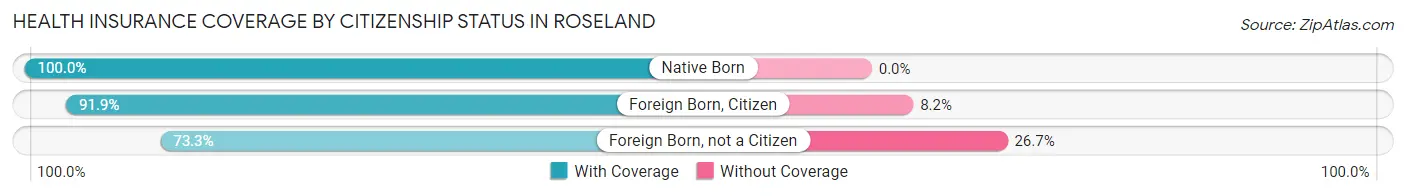
| Citizenship Status | With Coverage | Without Coverage |
| Native Born | 231 (100.0%) | 0 (0.0%) |
| Foreign Born, Citizen | 124 (91.8%) | 11 (8.2%) |
| Foreign Born, not a Citizen | 55 (73.3%) | 20 (26.7%) |
Health Insurance Coverage by Household Income in Roseland
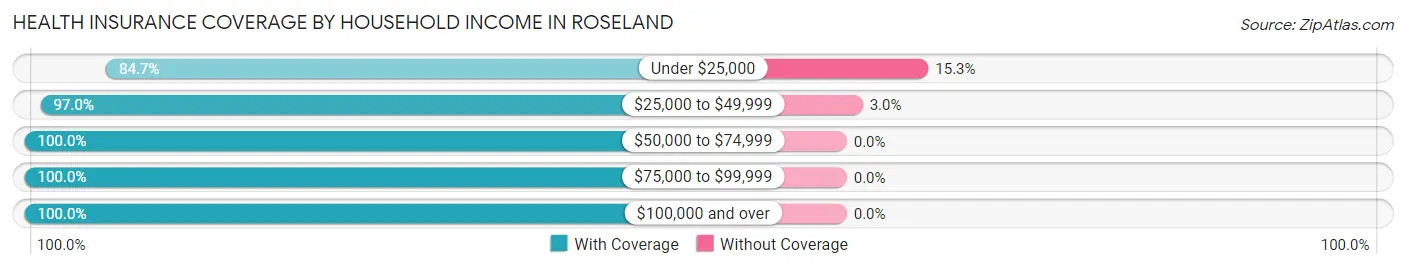
| Household Income | With Coverage | Without Coverage |
| Under $25,000 | 183 (84.7%) | 33 (15.3%) |
| $25,000 to $49,999 | 748 (97.0%) | 23 (3.0%) |
| $50,000 to $74,999 | 58 (100.0%) | 0 (0.0%) |
| $75,000 to $99,999 | 109 (100.0%) | 0 (0.0%) |
| $100,000 and over | 83 (100.0%) | 0 (0.0%) |
Public vs Private Health Insurance Coverage by Age in Roseland
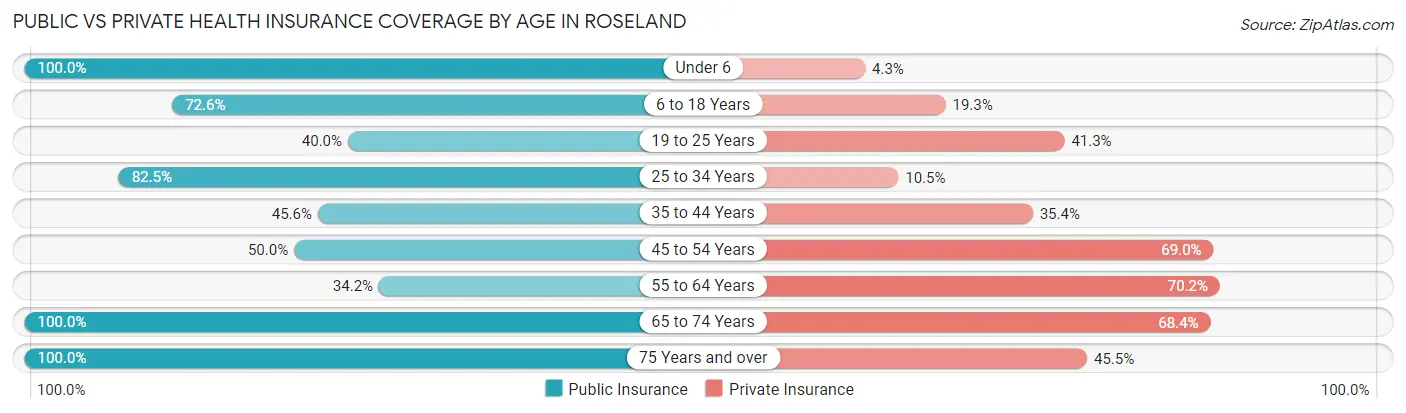
| Age Bracket | Public Insurance | Private Insurance |
| Under 6 | 231 (100.0%) | 10 (4.3%) |
| 6 to 18 Years | 98 (72.6%) | 26 (19.3%) |
| 19 to 25 Years | 30 (40.0%) | 31 (41.3%) |
| 25 to 34 Years | 118 (82.5%) | 15 (10.5%) |
| 35 to 44 Years | 36 (45.6%) | 28 (35.4%) |
| 45 to 54 Years | 29 (50.0%) | 40 (69.0%) |
| 55 to 64 Years | 101 (34.2%) | 207 (70.2%) |
| 65 to 74 Years | 76 (100.0%) | 52 (68.4%) |
| 75 Years and over | 145 (100.0%) | 66 (45.5%) |
| Total | 864 (69.9%) | 475 (38.4%) |
Disability Status by Sex by Age in Roseland
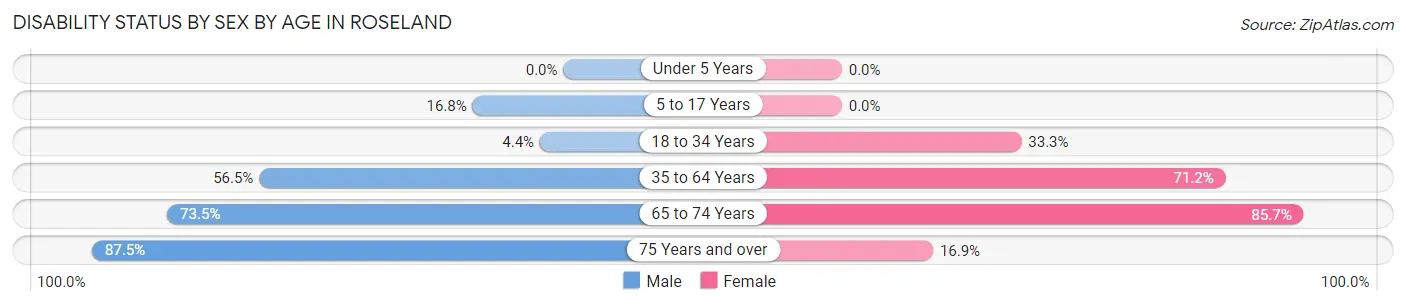
| Age Bracket | Male | Female |
| Under 5 Years | 0 (0.0%) | 0 (0.0%) |
| 5 to 17 Years | 16 (16.8%) | 0 (0.0%) |
| 18 to 34 Years | 6 (4.3%) | 29 (33.3%) |
| 35 to 64 Years | 83 (56.5%) | 203 (71.2%) |
| 65 to 74 Years | 25 (73.5%) | 36 (85.7%) |
| 75 Years and over | 70 (87.5%) | 11 (16.9%) |
Disability Class by Sex by Age in Roseland
Disability Class: Hearing Difficulty
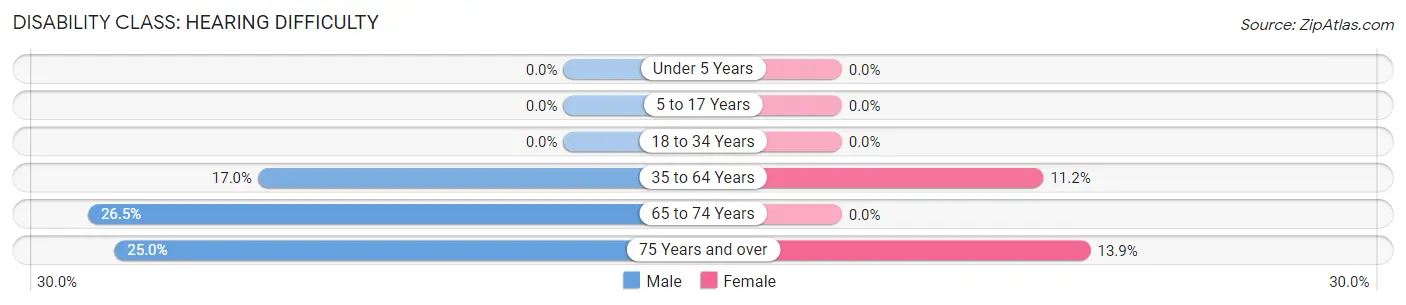
| Age Bracket | Male | Female |
| Under 5 Years | 0 (0.0%) | 0 (0.0%) |
| 5 to 17 Years | 0 (0.0%) | 0 (0.0%) |
| 18 to 34 Years | 0 (0.0%) | 0 (0.0%) |
| 35 to 64 Years | 25 (17.0%) | 32 (11.2%) |
| 65 to 74 Years | 9 (26.5%) | 0 (0.0%) |
| 75 Years and over | 20 (25.0%) | 9 (13.9%) |
Disability Class: Vision Difficulty
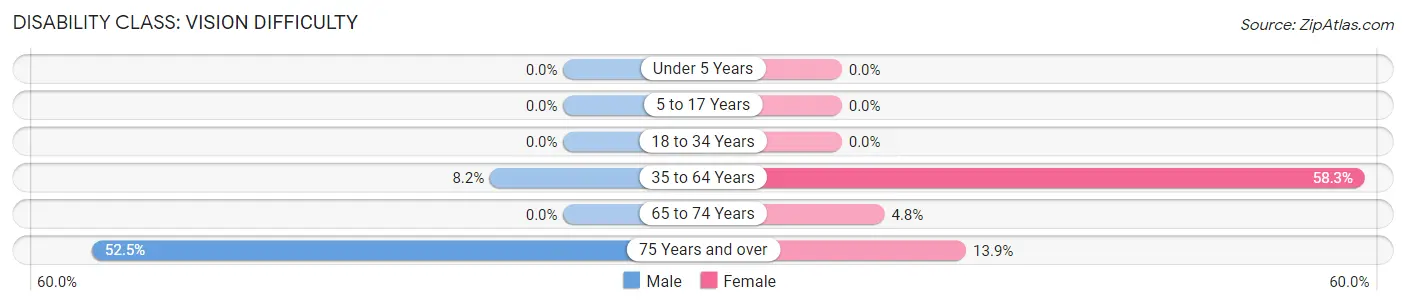
| Age Bracket | Male | Female |
| Under 5 Years | 0 (0.0%) | 0 (0.0%) |
| 5 to 17 Years | 0 (0.0%) | 0 (0.0%) |
| 18 to 34 Years | 0 (0.0%) | 0 (0.0%) |
| 35 to 64 Years | 12 (8.2%) | 166 (58.3%) |
| 65 to 74 Years | 0 (0.0%) | 2 (4.8%) |
| 75 Years and over | 42 (52.5%) | 9 (13.9%) |
Disability Class: Cognitive Difficulty
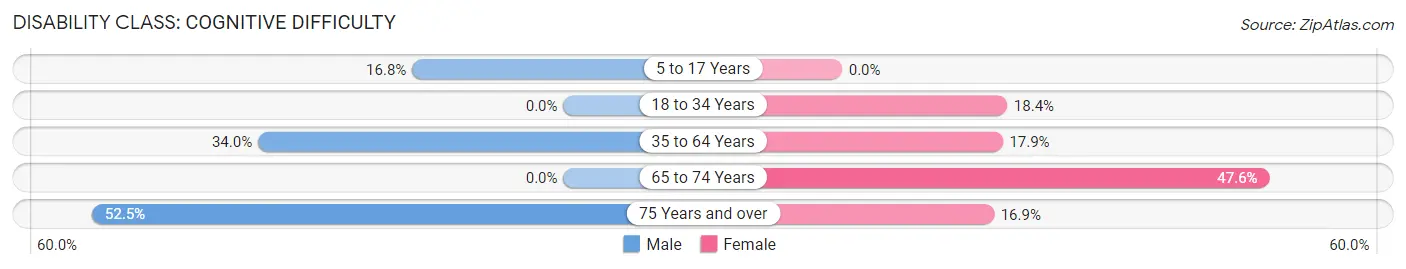
| Age Bracket | Male | Female |
| 5 to 17 Years | 16 (16.8%) | 0 (0.0%) |
| 18 to 34 Years | 0 (0.0%) | 16 (18.4%) |
| 35 to 64 Years | 50 (34.0%) | 51 (17.9%) |
| 65 to 74 Years | 0 (0.0%) | 20 (47.6%) |
| 75 Years and over | 42 (52.5%) | 11 (16.9%) |
Disability Class: Ambulatory Difficulty
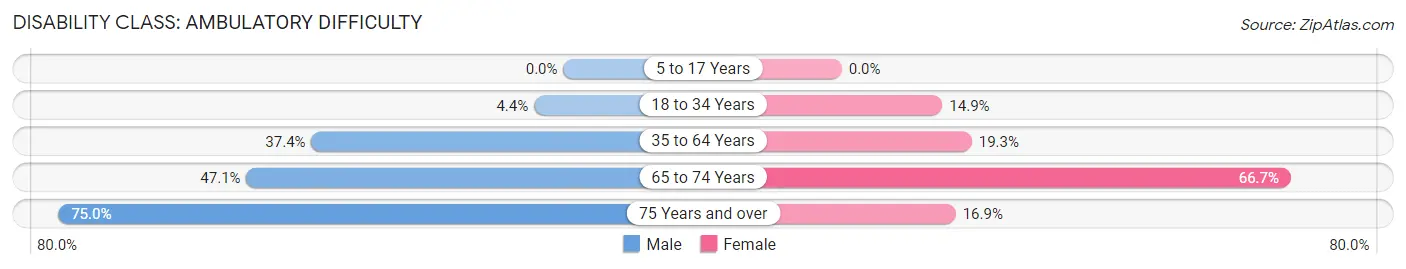
| Age Bracket | Male | Female |
| 5 to 17 Years | 0 (0.0%) | 0 (0.0%) |
| 18 to 34 Years | 6 (4.3%) | 13 (14.9%) |
| 35 to 64 Years | 55 (37.4%) | 55 (19.3%) |
| 65 to 74 Years | 16 (47.1%) | 28 (66.7%) |
| 75 Years and over | 60 (75.0%) | 11 (16.9%) |
Disability Class: Self-Care Difficulty
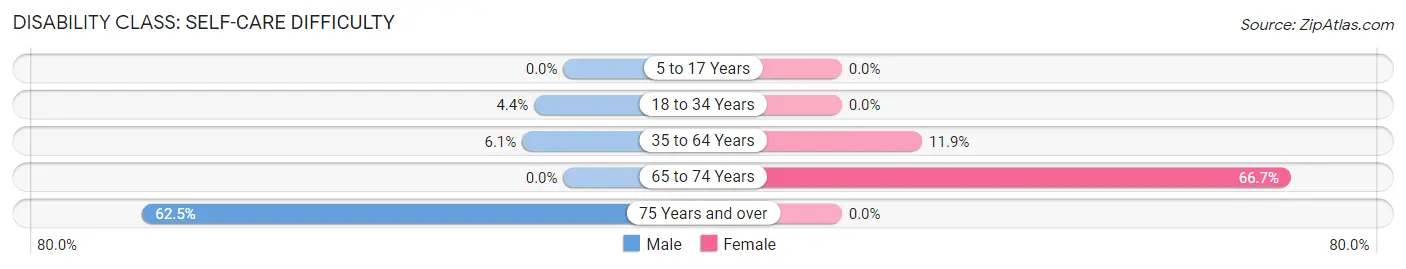
| Age Bracket | Male | Female |
| 5 to 17 Years | 0 (0.0%) | 0 (0.0%) |
| 18 to 34 Years | 6 (4.3%) | 0 (0.0%) |
| 35 to 64 Years | 9 (6.1%) | 34 (11.9%) |
| 65 to 74 Years | 0 (0.0%) | 28 (66.7%) |
| 75 Years and over | 50 (62.5%) | 0 (0.0%) |
Technology Access in Roseland
Computing Device Access in Roseland
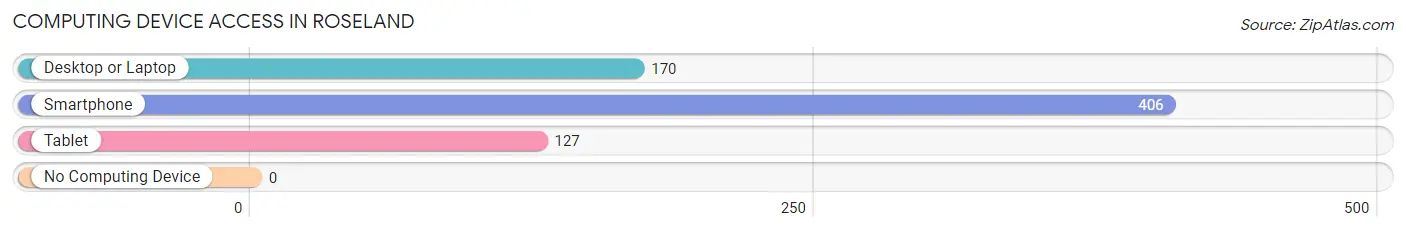
| Device Type | # Households | % Households |
| Desktop or Laptop | 170 | 39.5% |
| Smartphone | 406 | 94.4% |
| Tablet | 127 | 29.5% |
| No Computing Device | 0 | 0.0% |
| Total | 430 | 100.0% |
Internet Access in Roseland
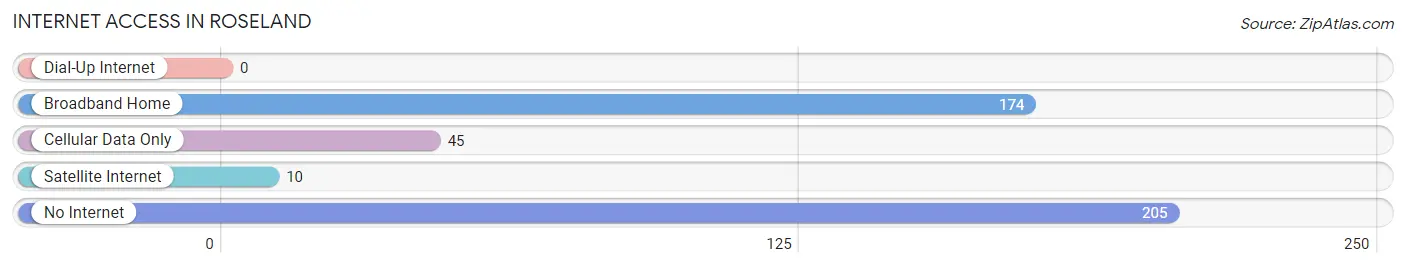
| Internet Type | # Households | % Households |
| Dial-Up Internet | 0 | 0.0% |
| Broadband Home | 174 | 40.5% |
| Cellular Data Only | 45 | 10.5% |
| Satellite Internet | 10 | 2.3% |
| No Internet | 205 | 47.7% |
| Total | 430 | 100.0% |
Roseland Summary
Roseland is a small town located in Tangipahoa Parish, Louisiana. It is situated on the banks of the Tangipahoa River, approximately 25 miles north of New Orleans. The town has a population of 1,845 people, according to the 2010 census.
History
Roseland was founded in 1883 by the Rose family, who were among the first settlers in the area. The town was named after the family’s patriarch, William Rose. The Rose family owned a large plantation in the area, and the town grew up around it.
In the early 1900s, Roseland was a thriving agricultural community. The town was home to several cotton gins, a sawmill, and a gristmill. The town also had a post office, a general store, and a hotel.
In the 1920s, the town began to decline as the cotton industry declined. The Great Depression further weakened the town’s economy, and many of the businesses closed.
In the 1940s, the town began to experience a resurgence. The Tangipahoa River was dammed to create a reservoir, and the town became a popular fishing and recreational destination. The town also became a popular weekend getaway for New Orleans residents.
Geography
Roseland is located in the southeastern corner of Tangipahoa Parish, approximately 25 miles north of New Orleans. The town is situated on the banks of the Tangipahoa River, and is surrounded by rolling hills and forests.
The town has a total area of 1.2 square miles, all of which is land. The town is located at an elevation of 40 feet above sea level.
Economy
The economy of Roseland is largely based on tourism and recreation. The town is a popular destination for fishing, boating, and other outdoor activities. The town also has several restaurants, bars, and other businesses catering to tourists.
The town also has a small manufacturing sector, with several small businesses producing furniture, clothing, and other goods.
Demographics
According to the 2010 census, Roseland has a population of 1,845 people. The racial makeup of the town is 79.3% White, 17.2% African American, 0.7% Native American, 0.3% Asian, and 2.5% from other races.
The median household income in Roseland is $37,917, and the median family income is $45,938. The per capita income in the town is $19,945.
Conclusion
Roseland is a small town located in Tangipahoa Parish, Louisiana. It was founded in 1883 by the Rose family, and has a population of 1,845 people. The town’s economy is largely based on tourism and recreation, and it is a popular destination for fishing, boating, and other outdoor activities. The town has a diverse population, with a median household income of $37,917.
Common Questions
What is Per Capita Income in Roseland?
Per Capita income in Roseland is $17,732.
What is the Median Family Income in Roseland?
Median Family Income in Roseland is $43,652.
What is the Median Household income in Roseland?
Median Household Income in Roseland is $43,693.
What is Income or Wage Gap in Roseland?
Income or Wage Gap in Roseland is 7.6%.
Women in Roseland earn 92.4 cents for every dollar earned by a man.
What is Inequality or Gini Index in Roseland?
Inequality or Gini Index in Roseland is 0.33.
What is the Total Population of Roseland?
Total Population of Roseland is 1,237.
What is the Total Male Population of Roseland?
Total Male Population of Roseland is 589.
What is the Total Female Population of Roseland?
Total Female Population of Roseland is 648.
What is the Ratio of Males per 100 Females in Roseland?
There are 90.90 Males per 100 Females in Roseland.
What is the Ratio of Females per 100 Males in Roseland?
There are 110.02 Females per 100 Males in Roseland.
What is the Median Population Age in Roseland?
Median Population Age in Roseland is 38.6 Years.
What is the Average Family Size in Roseland
Average Family Size in Roseland is 3.0 People.
What is the Average Household Size in Roseland
Average Household Size in Roseland is 2.9 People.
How Large is the Labor Force in Roseland?
There are 437 People in the Labor Forcein in Roseland.
What is the Percentage of People in the Labor Force in Roseland?
48.8% of People are in the Labor Force in Roseland.
What is the Unemployment Rate in Roseland?
Unemployment Rate in Roseland is 8.0%.