Rayville, LA Map & Demographics
Rayville Map
Rayville Overview
$12,802
PER CAPITA INCOME
$23,202
AVG FAMILY INCOME
$23,292
AVG HOUSEHOLD INCOME
$18,614
FAMILY INCOME DEFICIT
0.53
INEQUALITY / GINI INDEX
3,343
TOTAL POPULATION
1,437
MALE POPULATION
1,906
FEMALE POPULATION
75.39
MALES / 100 FEMALES
132.64
FEMALES / 100 MALES
31.3
MEDIAN AGE
3.4
AVG FAMILY SIZE
2.8
AVG HOUSEHOLD SIZE
1,078
LABOR FORCE [ PEOPLE ]
45.8%
PERCENT IN LABOR FORCE
12.5%
UNEMPLOYMENT RATE
Rayville Zip Codes
Rayville Area Codes
Income in Rayville
Income Overview in Rayville
Per Capita Income in Rayville is $12,802, while median incomes of families and households are $23,202 and $23,292 respectively.
| Characteristic | Number | Measure |
| Per Capita Income | 3,343 | $12,802 |
| Median Family Income | 818 | $23,202 |
| Mean Family Income | 818 | $32,351 |
| Median Household Income | 1,145 | $23,292 |
| Mean Household Income | 1,145 | $33,082 |
| Income Deficit | 818 | $18,614 |
| Wage / Income Gap (%) | 3,343 | 0.00% |
| Wage / Income Gap ($) | 3,343 | 100.00¢ per $1 |
| Gini / Inequality Index | 3,343 | 0.53 |
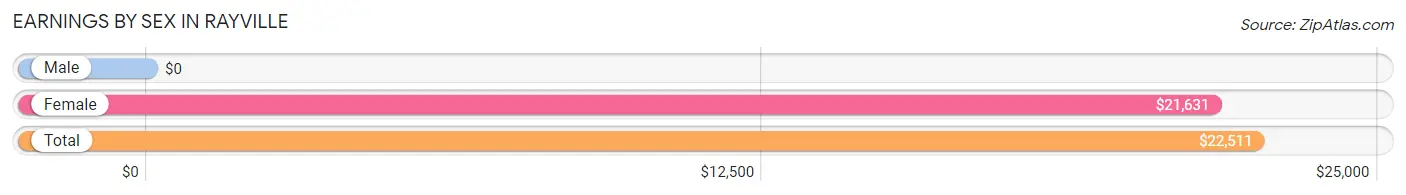
Earnings by Sex in Rayville
| Sex | Number | Average Earnings |
| Male | 328 (30.6%) | $0 |
| Female | 743 (69.4%) | $21,631 |
| Total | 1,071 (100.0%) | $22,511 |
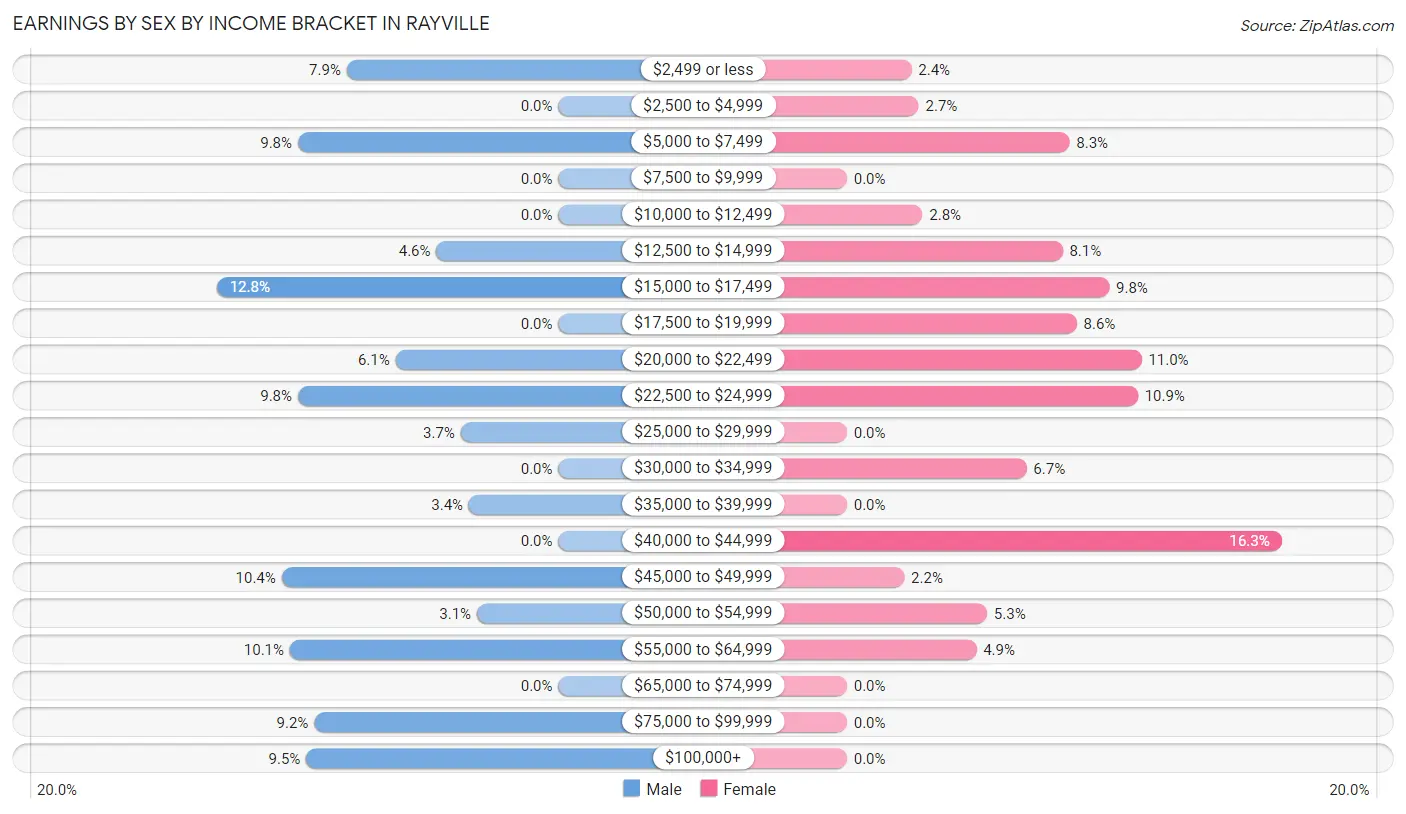
Earnings by Sex by Income Bracket in Rayville
The most common earnings brackets in Rayville are $15,000 to $17,499 for men (42 | 12.8%) and $40,000 to $44,999 for women (121 | 16.3%).
| Income | Male | Female |
| $2,499 or less | 26 (7.9%) | 18 (2.4%) |
| $2,500 to $4,999 | 0 (0.0%) | 20 (2.7%) |
| $5,000 to $7,499 | 32 (9.8%) | 62 (8.3%) |
| $7,500 to $9,999 | 0 (0.0%) | 0 (0.0%) |
| $10,000 to $12,499 | 0 (0.0%) | 21 (2.8%) |
| $12,500 to $14,999 | 15 (4.6%) | 60 (8.1%) |
| $15,000 to $17,499 | 42 (12.8%) | 73 (9.8%) |
| $17,500 to $19,999 | 0 (0.0%) | 64 (8.6%) |
| $20,000 to $22,499 | 20 (6.1%) | 82 (11.0%) |
| $22,500 to $24,999 | 32 (9.8%) | 81 (10.9%) |
| $25,000 to $29,999 | 12 (3.7%) | 0 (0.0%) |
| $30,000 to $34,999 | 0 (0.0%) | 50 (6.7%) |
| $35,000 to $39,999 | 11 (3.4%) | 0 (0.0%) |
| $40,000 to $44,999 | 0 (0.0%) | 121 (16.3%) |
| $45,000 to $49,999 | 34 (10.4%) | 16 (2.1%) |
| $50,000 to $54,999 | 10 (3.0%) | 39 (5.2%) |
| $55,000 to $64,999 | 33 (10.1%) | 36 (4.9%) |
| $65,000 to $74,999 | 0 (0.0%) | 0 (0.0%) |
| $75,000 to $99,999 | 30 (9.1%) | 0 (0.0%) |
| $100,000+ | 31 (9.5%) | 0 (0.0%) |
| Total | 328 (100.0%) | 743 (100.0%) |
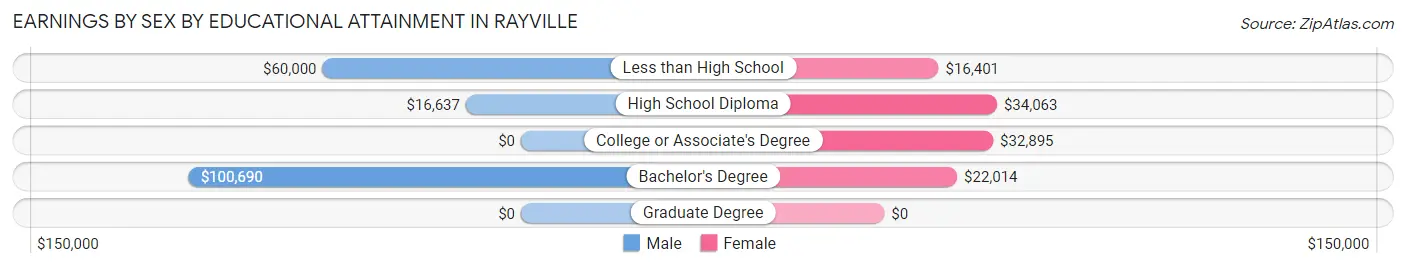
Earnings by Sex by Educational Attainment in Rayville
Average earnings in Rayville are $31,250 for men and $22,364 for women, a difference of 28.4%. Men with an educational attainment of bachelor's degree enjoy the highest average annual earnings of $100,690, while those with high school diploma education earn the least with $16,637. Women with an educational attainment of high school diploma earn the most with the average annual earnings of $34,063, while those with less than high school education have the smallest earnings of $16,401.
| Educational Attainment | Male Income | Female Income |
| Less than High School | $60,000 | $16,401 |
| High School Diploma | $16,637 | $34,063 |
| College or Associate's Degree | - | - |
| Bachelor's Degree | $100,690 | $22,014 |
| Graduate Degree | - | - |
| Total | $31,250 | $22,364 |
Family Income in Rayville
Family Income Brackets in Rayville
According to the Rayville family income data, there are 289 families falling into the less than $10,000 income range, which is the most common income bracket and makes up 35.3% of all families.
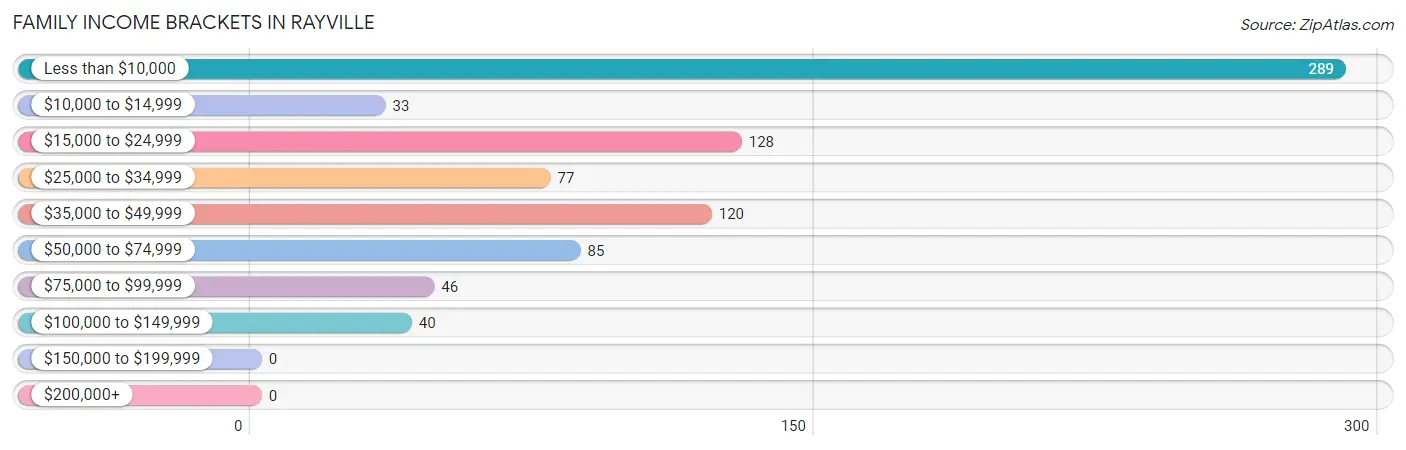
| Income Bracket | # Families | % Families |
| Less than $10,000 | 289 | 35.3% |
| $10,000 to $14,999 | 33 | 4.0% |
| $15,000 to $24,999 | 128 | 15.6% |
| $25,000 to $34,999 | 77 | 9.4% |
| $35,000 to $49,999 | 120 | 14.7% |
| $50,000 to $74,999 | 85 | 10.4% |
| $75,000 to $99,999 | 46 | 5.6% |
| $100,000 to $149,999 | 40 | 4.9% |
| $150,000 to $199,999 | 0 | 0.0% |
| $200,000+ | 0 | 0.0% |
Family Income by Famaliy Size in Rayville
4-person families (152 | 18.6%) account for the highest median family income in Rayville with $41,085 per family, while 3-person families (280 | 34.2%) have the highest median income of $11,083 per family member.
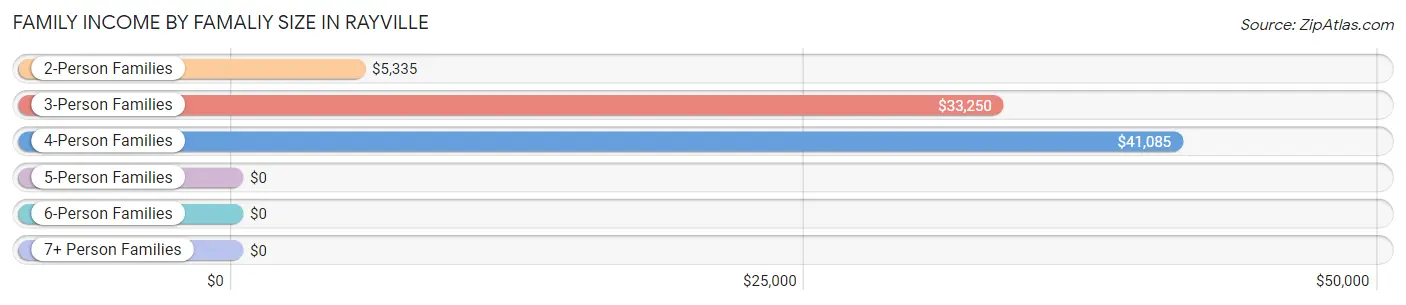
| Income Bracket | # Families | Median Income |
| 2-Person Families | 283 (34.6%) | $5,335 |
| 3-Person Families | 280 (34.2%) | $33,250 |
| 4-Person Families | 152 (18.6%) | $41,085 |
| 5-Person Families | 9 (1.1%) | $0 |
| 6-Person Families | 27 (3.3%) | $0 |
| 7+ Person Families | 67 (8.2%) | $0 |
| Total | 818 (100.0%) | $23,202 |
Family Income by Number of Earners in Rayville
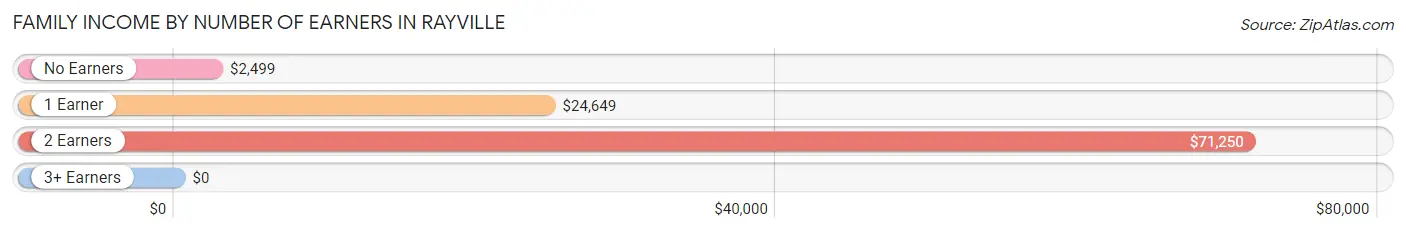
| Number of Earners | # Families | Median Income |
| No Earners | 287 (35.1%) | $2,499 |
| 1 Earner | 376 (46.0%) | $24,649 |
| 2 Earners | 135 (16.5%) | $71,250 |
| 3+ Earners | 20 (2.4%) | $0 |
| Total | 818 (100.0%) | $23,202 |
Household Income in Rayville
Household Income Brackets in Rayville
With 313 households falling in the category, the less than $10,000 income range is the most frequent in Rayville, accounting for 27.3% of all households.
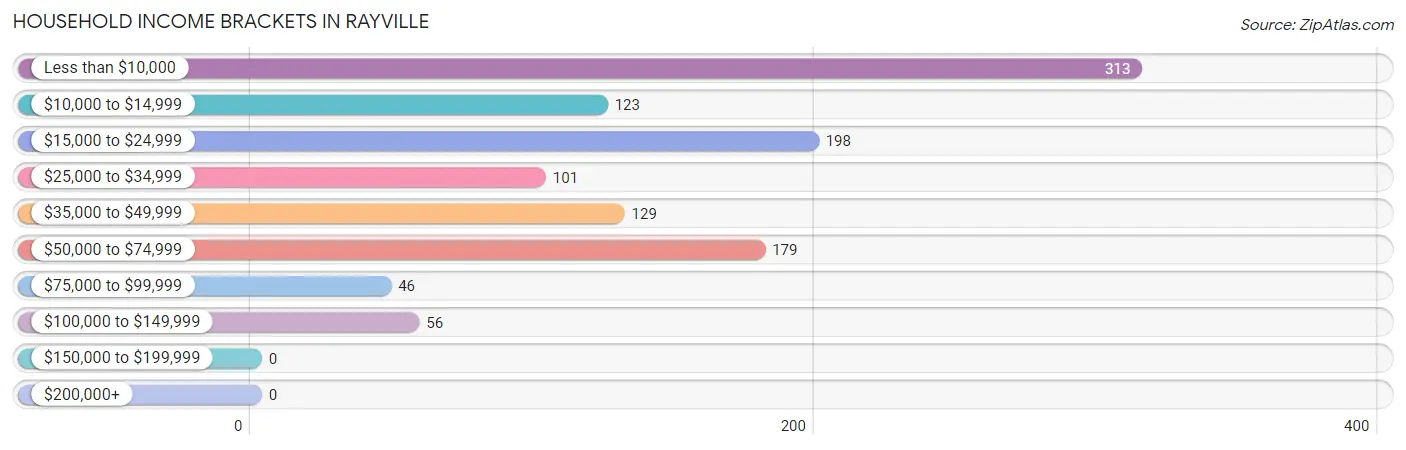
| Income Bracket | # Households | % Households |
| Less than $10,000 | 313 | 27.3% |
| $10,000 to $14,999 | 123 | 10.7% |
| $15,000 to $24,999 | 198 | 17.3% |
| $25,000 to $34,999 | 101 | 8.8% |
| $35,000 to $49,999 | 129 | 11.3% |
| $50,000 to $74,999 | 179 | 15.6% |
| $75,000 to $99,999 | 46 | 4.0% |
| $100,000 to $149,999 | 56 | 4.9% |
| $150,000 to $199,999 | 0 | 0.0% |
| $200,000+ | 0 | 0.0% |
Household Income by Householder Age in Rayville
The median household income in Rayville is $23,292, with the highest median household income of $23,794 found in the 25 to 44 years age bracket for the primary householder. A total of 385 households (33.6%) fall into this category. Meanwhile, the 15 to 24 years age bracket for the primary householder has the lowest median household income of $0, with 153 households (13.4%) in this group.
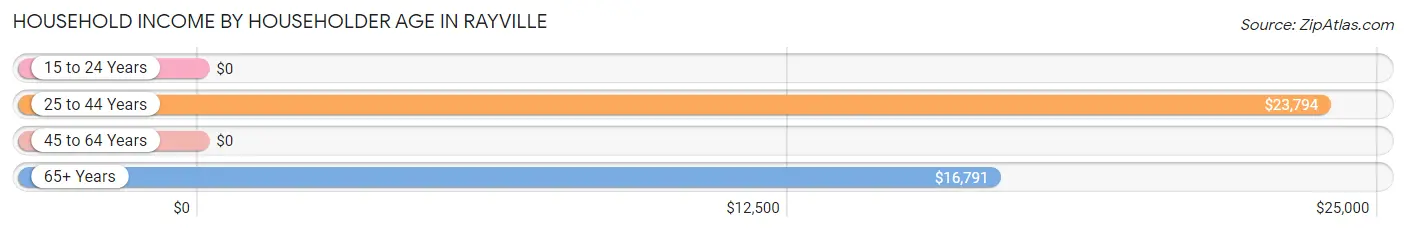
| Income Bracket | # Households | Median Income |
| 15 to 24 Years | 153 (13.4%) | $0 |
| 25 to 44 Years | 385 (33.6%) | $23,794 |
| 45 to 64 Years | 320 (28.0%) | $0 |
| 65+ Years | 287 (25.1%) | $16,791 |
| Total | 1,145 (100.0%) | $23,292 |
Poverty in Rayville
Income Below Poverty by Sex and Age in Rayville
With 43.0% poverty level for males and 38.0% for females among the residents of Rayville, under 5 year old males and 16 and 17 year old females are the most vulnerable to poverty, with 75 males (100.0%) and 65 females (100.0%) in their respective age groups living below the poverty level.
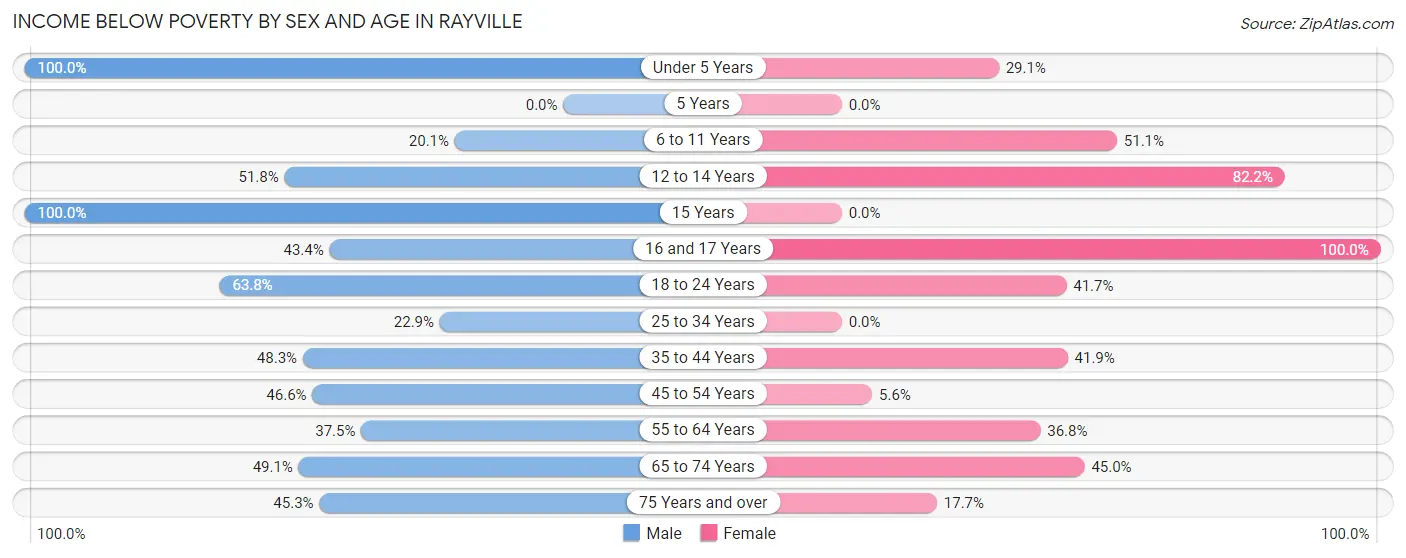
| Age Bracket | Male | Female |
| Under 5 Years | 75 (100.0%) | 53 (29.1%) |
| 5 Years | 0 (0.0%) | 0 (0.0%) |
| 6 to 11 Years | 59 (20.1%) | 120 (51.1%) |
| 12 to 14 Years | 59 (51.7%) | 37 (82.2%) |
| 15 Years | 39 (100.0%) | 0 (0.0%) |
| 16 and 17 Years | 23 (43.4%) | 65 (100.0%) |
| 18 to 24 Years | 60 (63.8%) | 100 (41.7%) |
| 25 to 34 Years | 44 (22.9%) | 0 (0.0%) |
| 35 to 44 Years | 73 (48.3%) | 127 (41.9%) |
| 45 to 54 Years | 34 (46.6%) | 5 (5.6%) |
| 55 to 64 Years | 54 (37.5%) | 112 (36.8%) |
| 65 to 74 Years | 56 (49.1%) | 59 (45.0%) |
| 75 Years and over | 24 (45.3%) | 15 (17.6%) |
| Total | 600 (43.0%) | 693 (38.0%) |
Income Above Poverty by Sex and Age in Rayville
According to the poverty statistics in Rayville, males aged 6 to 11 years and females aged 15 years are the age groups that are most secure financially, with 79.9% of males and 100.0% of females in these age groups living above the poverty line.
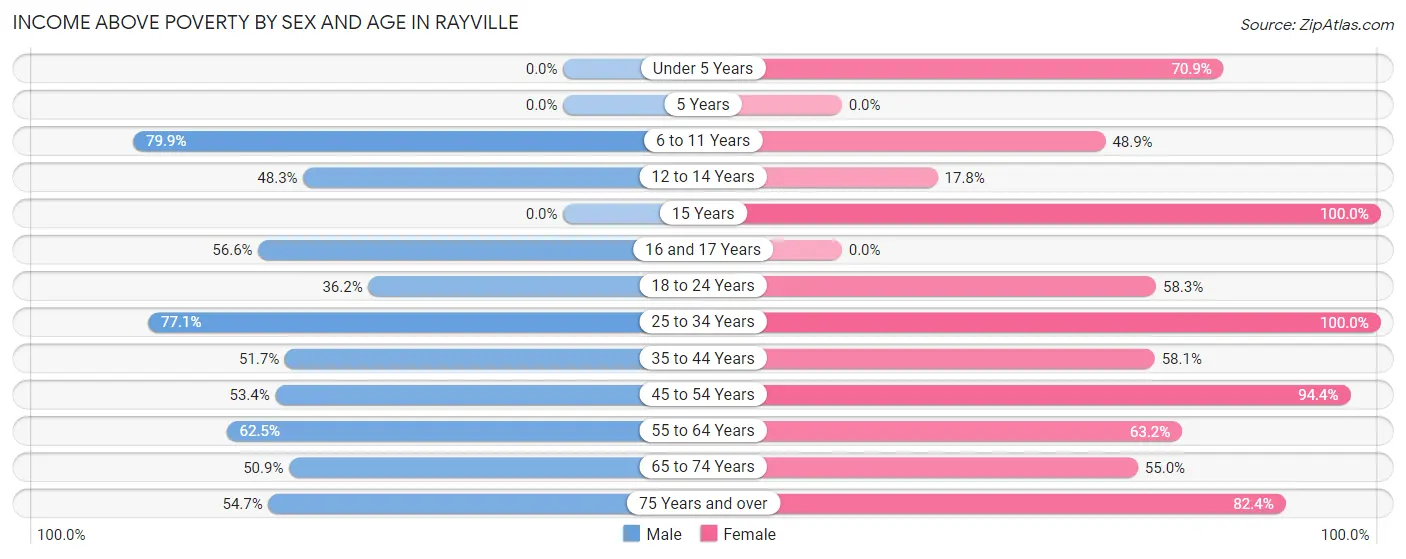
| Age Bracket | Male | Female |
| Under 5 Years | 0 (0.0%) | 129 (70.9%) |
| 5 Years | 0 (0.0%) | 0 (0.0%) |
| 6 to 11 Years | 234 (79.9%) | 115 (48.9%) |
| 12 to 14 Years | 55 (48.2%) | 8 (17.8%) |
| 15 Years | 0 (0.0%) | 6 (100.0%) |
| 16 and 17 Years | 30 (56.6%) | 0 (0.0%) |
| 18 to 24 Years | 34 (36.2%) | 140 (58.3%) |
| 25 to 34 Years | 148 (77.1%) | 141 (100.0%) |
| 35 to 44 Years | 78 (51.7%) | 176 (58.1%) |
| 45 to 54 Years | 39 (53.4%) | 84 (94.4%) |
| 55 to 64 Years | 90 (62.5%) | 192 (63.2%) |
| 65 to 74 Years | 58 (50.9%) | 72 (55.0%) |
| 75 Years and over | 29 (54.7%) | 70 (82.4%) |
| Total | 795 (57.0%) | 1,133 (62.1%) |
Income Below Poverty Among Married-Couple Families in Rayville
The poverty statistics for married-couple families in Rayville show that 42.1% or 90 of the total 214 families live below the poverty line. Families with 3 or 4 children have the highest poverty rate of 76.5%, comprising of 62 families. On the other hand, families with no children have the lowest poverty rate of 5.7%, which includes 4 families.
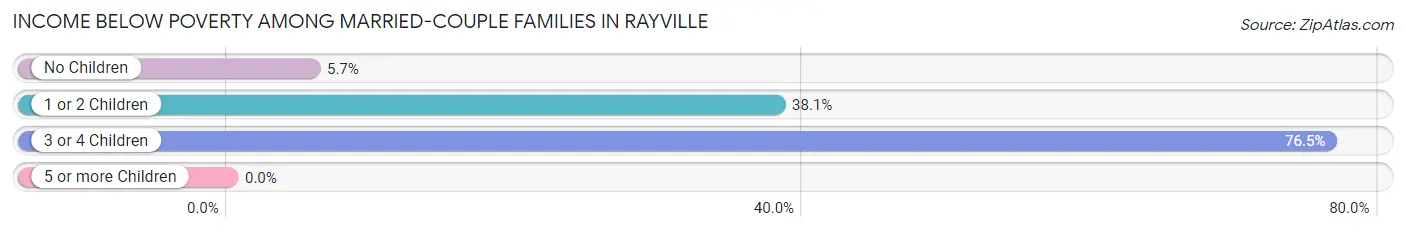
| Children | Above Poverty | Below Poverty |
| No Children | 66 (94.3%) | 4 (5.7%) |
| 1 or 2 Children | 39 (61.9%) | 24 (38.1%) |
| 3 or 4 Children | 19 (23.5%) | 62 (76.5%) |
| 5 or more Children | 0 (0.0%) | 0 (0.0%) |
| Total | 124 (57.9%) | 90 (42.1%) |
Income Below Poverty Among Single-Parent Households in Rayville
According to the poverty data in Rayville, 79.8% or 142 single-father households and 33.1% or 141 single-mother households are living below the poverty line. Among single-father households, those with 1 or 2 children have the highest poverty rate, with 142 households (100.0%) experiencing poverty. Likewise, among single-mother households, those with 3 or 4 children have the highest poverty rate, with 37 households (39.0%) falling below the poverty line.
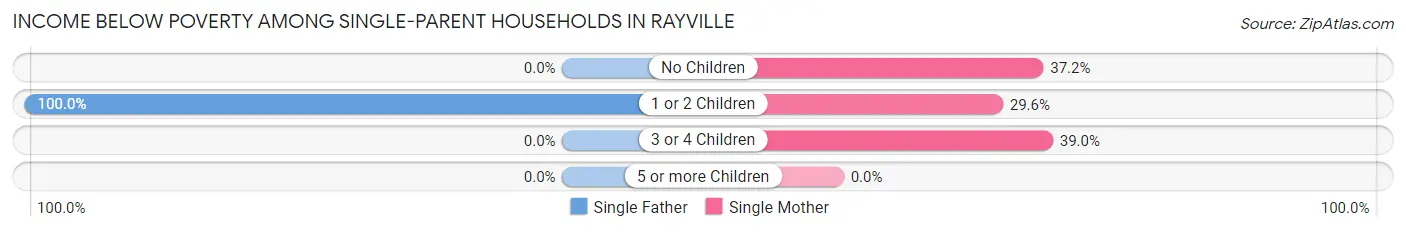
| Children | Single Father | Single Mother |
| No Children | 0 (0.0%) | 29 (37.2%) |
| 1 or 2 Children | 142 (100.0%) | 75 (29.6%) |
| 3 or 4 Children | 0 (0.0%) | 37 (39.0%) |
| 5 or more Children | 0 (0.0%) | 0 (0.0%) |
| Total | 142 (79.8%) | 141 (33.1%) |
Income Below Poverty Among Married-Couple vs Single-Parent Households in Rayville
The poverty data for Rayville shows that 90 of the married-couple family households (42.1%) and 283 of the single-parent households (46.9%) are living below the poverty level. Within the married-couple family households, those with 3 or 4 children have the highest poverty rate, with 62 households (76.5%) falling below the poverty line. Among the single-parent households, those with 1 or 2 children have the highest poverty rate, with 217 household (54.9%) living below poverty.
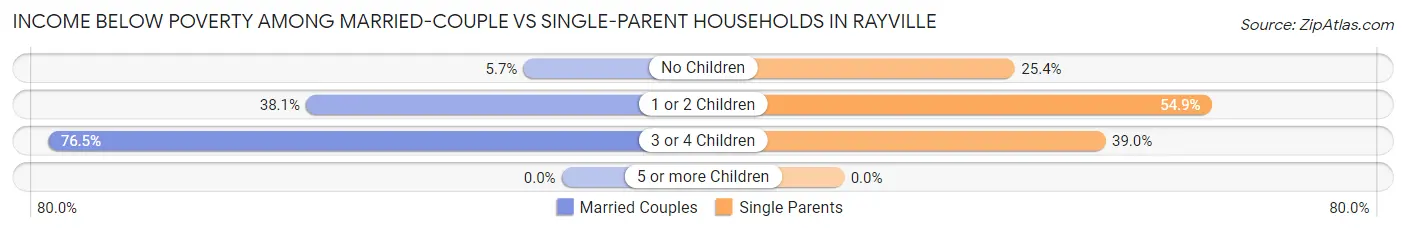
| Children | Married-Couple Families | Single-Parent Households |
| No Children | 4 (5.7%) | 29 (25.4%) |
| 1 or 2 Children | 24 (38.1%) | 217 (54.9%) |
| 3 or 4 Children | 62 (76.5%) | 37 (39.0%) |
| 5 or more Children | 0 (0.0%) | 0 (0.0%) |
| Total | 90 (42.1%) | 283 (46.9%) |
Race in Rayville
The most populous races in Rayville are Black / African American (2,766 | 82.7%), White / Caucasian (561 | 16.8%), and Two or more Races (16 | 0.5%).
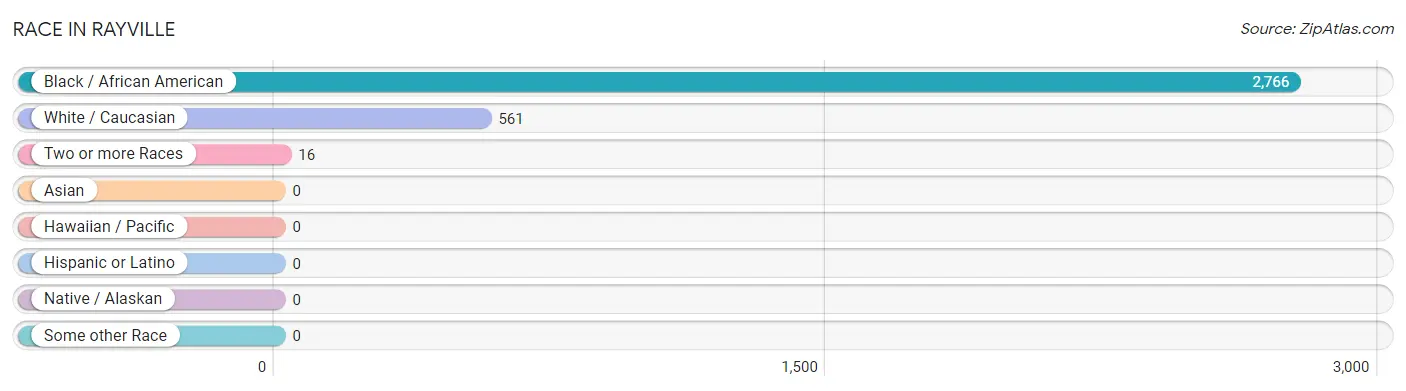
| Race | # Population | % Population |
| Asian | 0 | 0.0% |
| Black / African American | 2,766 | 82.7% |
| Hawaiian / Pacific | 0 | 0.0% |
| Hispanic or Latino | 0 | 0.0% |
| Native / Alaskan | 0 | 0.0% |
| White / Caucasian | 561 | 16.8% |
| Two or more Races | 16 | 0.5% |
| Some other Race | 0 | 0.0% |
| Total | 3,343 | 100.0% |
Ancestry in Rayville
The most populous ancestries reported in Rayville are American (262 | 7.8%), French (105 | 3.1%), English (83 | 2.5%), German (25 | 0.7%), and Italian (24 | 0.7%), together accounting for 14.9% of all Rayville residents.
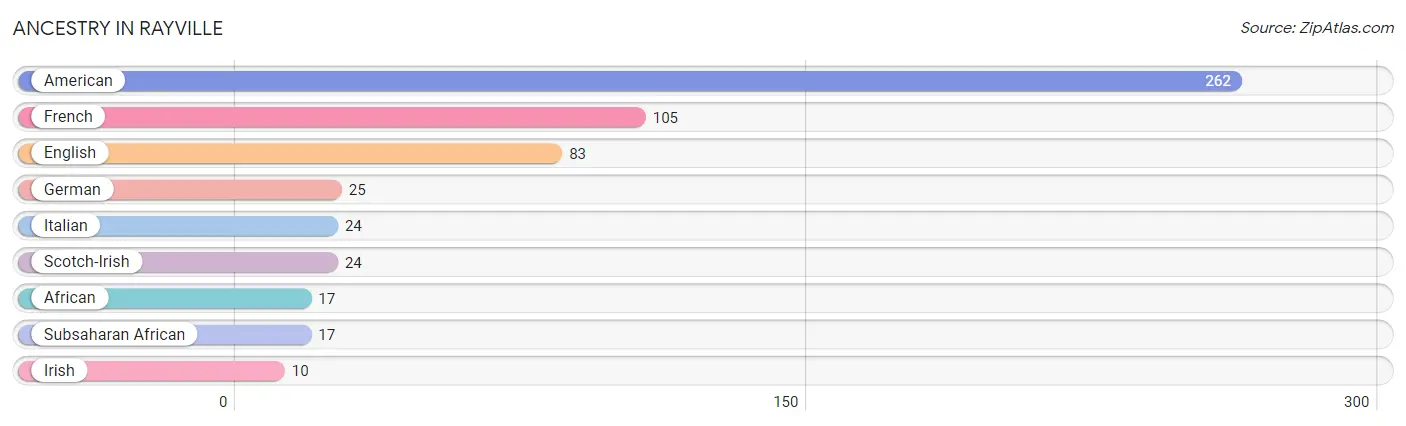
| Ancestry | # Population | % Population |
| African | 17 | 0.5% |
| American | 262 | 7.8% |
| English | 83 | 2.5% |
| French | 105 | 3.1% |
| German | 25 | 0.7% |
| Irish | 10 | 0.3% |
| Italian | 24 | 0.7% |
| Scotch-Irish | 24 | 0.7% |
| Subsaharan African | 17 | 0.5% | View All 9 Rows |
Immigrants in Rayville

| Immigration Origin | # Population | % Population | View All 0 Rows |
Sex and Age in Rayville
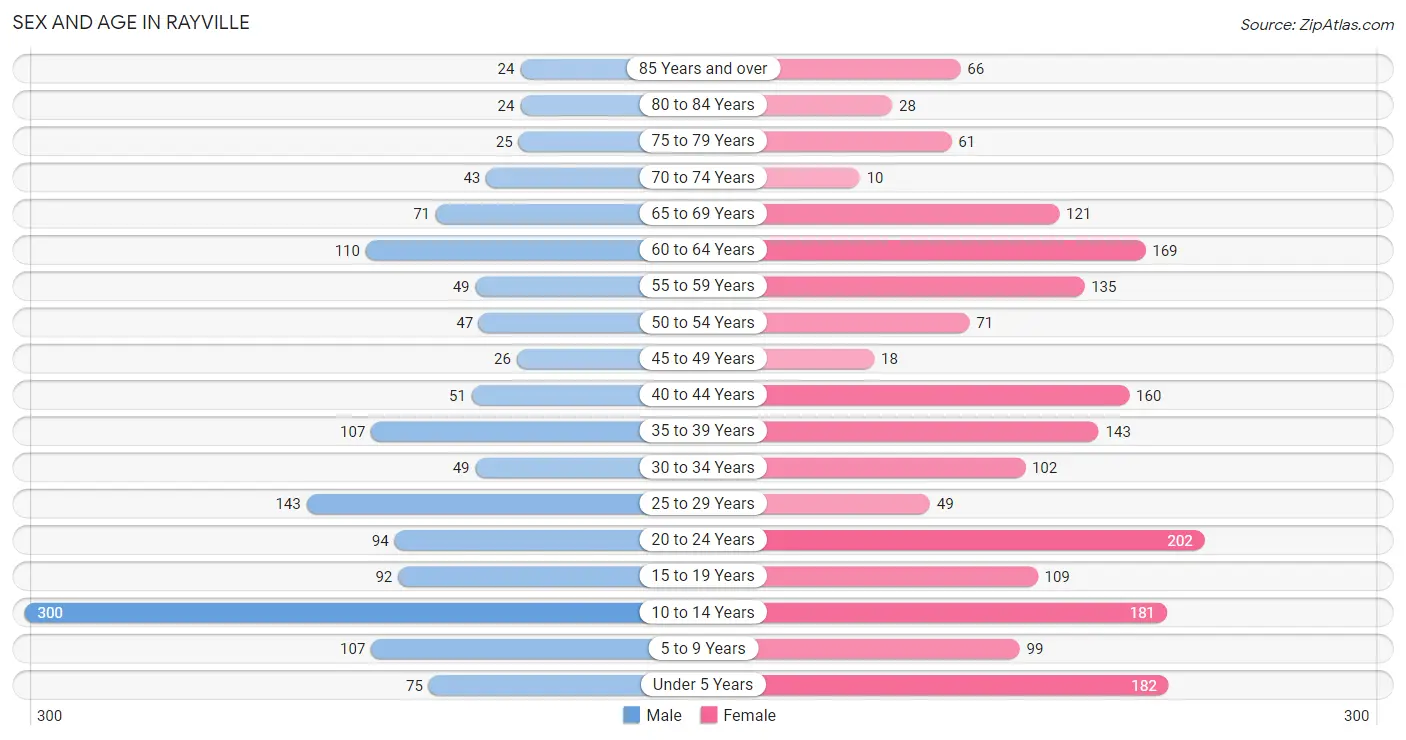
Sex and Age in Rayville
The most populous age groups in Rayville are 10 to 14 Years (300 | 20.9%) for men and 20 to 24 Years (202 | 10.6%) for women.
| Age Bracket | Male | Female |
| Under 5 Years | 75 (5.2%) | 182 (9.6%) |
| 5 to 9 Years | 107 (7.4%) | 99 (5.2%) |
| 10 to 14 Years | 300 (20.9%) | 181 (9.5%) |
| 15 to 19 Years | 92 (6.4%) | 109 (5.7%) |
| 20 to 24 Years | 94 (6.5%) | 202 (10.6%) |
| 25 to 29 Years | 143 (10.0%) | 49 (2.6%) |
| 30 to 34 Years | 49 (3.4%) | 102 (5.3%) |
| 35 to 39 Years | 107 (7.4%) | 143 (7.5%) |
| 40 to 44 Years | 51 (3.5%) | 160 (8.4%) |
| 45 to 49 Years | 26 (1.8%) | 18 (0.9%) |
| 50 to 54 Years | 47 (3.3%) | 71 (3.7%) |
| 55 to 59 Years | 49 (3.4%) | 135 (7.1%) |
| 60 to 64 Years | 110 (7.6%) | 169 (8.9%) |
| 65 to 69 Years | 71 (4.9%) | 121 (6.4%) |
| 70 to 74 Years | 43 (3.0%) | 10 (0.5%) |
| 75 to 79 Years | 25 (1.7%) | 61 (3.2%) |
| 80 to 84 Years | 24 (1.7%) | 28 (1.5%) |
| 85 Years and over | 24 (1.7%) | 66 (3.5%) |
| Total | 1,437 (100.0%) | 1,906 (100.0%) |
Families and Households in Rayville
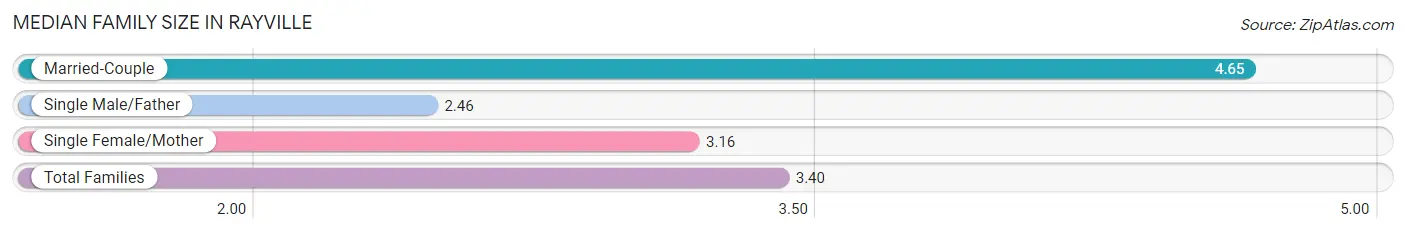
Median Family Size in Rayville
The median family size in Rayville is 3.40 persons per family, with married-couple families (214 | 26.2%) accounting for the largest median family size of 4.65 persons per family. On the other hand, single male/father families (178 | 21.8%) represent the smallest median family size with 2.46 persons per family.
| Family Type | # Families | Family Size |
| Married-Couple | 214 (26.2%) | 4.65 |
| Single Male/Father | 178 (21.8%) | 2.46 |
| Single Female/Mother | 426 (52.1%) | 3.16 |
| Total Families | 818 (100.0%) | 3.40 |
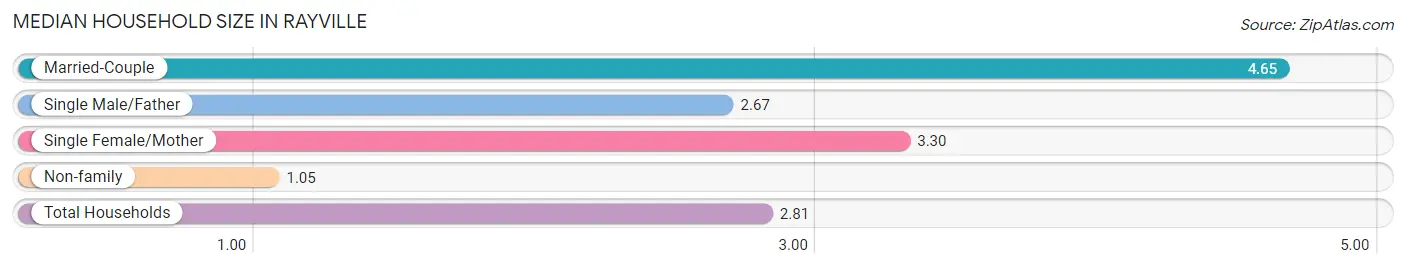
Median Household Size in Rayville
The median household size in Rayville is 2.81 persons per household, with married-couple households (214 | 18.7%) accounting for the largest median household size of 4.65 persons per household. non-family households (327 | 28.6%) represent the smallest median household size with 1.05 persons per household.
| Household Type | # Households | Household Size |
| Married-Couple | 214 (18.7%) | 4.65 |
| Single Male/Father | 178 (15.5%) | 2.67 |
| Single Female/Mother | 426 (37.2%) | 3.30 |
| Non-family | 327 (28.6%) | 1.05 |
| Total Households | 1,145 (100.0%) | 2.81 |
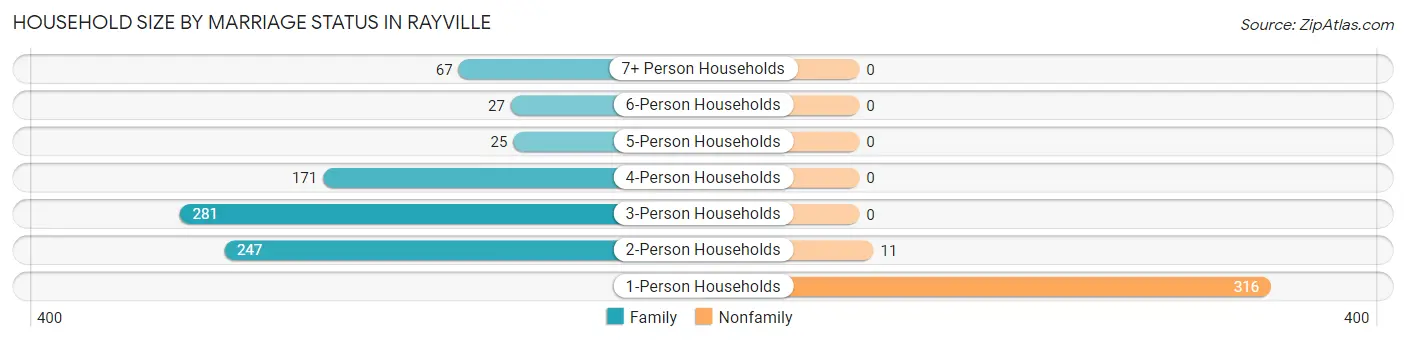
Household Size by Marriage Status in Rayville
Out of a total of 1,145 households in Rayville, 818 (71.4%) are family households, while 327 (28.6%) are nonfamily households. The most numerous type of family households are 3-person households, comprising 281, and the most common type of nonfamily households are 1-person households, comprising 316.
| Household Size | Family Households | Nonfamily Households |
| 1-Person Households | - | 316 (27.6%) |
| 2-Person Households | 247 (21.6%) | 11 (1.0%) |
| 3-Person Households | 281 (24.5%) | 0 (0.0%) |
| 4-Person Households | 171 (14.9%) | 0 (0.0%) |
| 5-Person Households | 25 (2.2%) | 0 (0.0%) |
| 6-Person Households | 27 (2.4%) | 0 (0.0%) |
| 7+ Person Households | 67 (5.9%) | 0 (0.0%) |
| Total | 818 (71.4%) | 327 (28.6%) |
Female Fertility in Rayville
Fertility by Age in Rayville
Average fertility rate in Rayville is 172.0 births per 1,000 women. Women in the age bracket of 15 to 19 years have the highest fertility rate with 275.0 births per 1,000 women. Women in the age bracket of 35 to 50 years acount for 45.9% of all women with births.
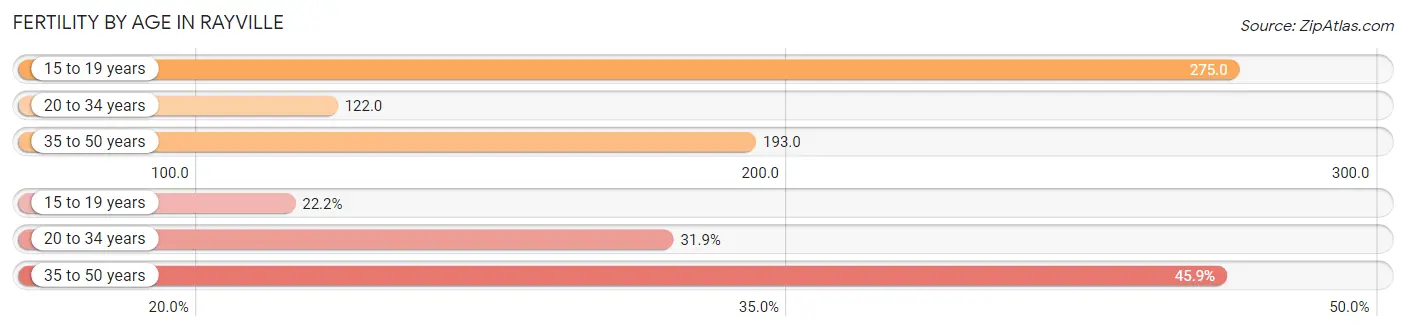
| Age Bracket | Women with Births | Births / 1,000 Women |
| 15 to 19 years | 30 (22.2%) | 275.0 |
| 20 to 34 years | 43 (31.9%) | 122.0 |
| 35 to 50 years | 62 (45.9%) | 193.0 |
| Total | 135 (100.0%) | 172.0 |
Fertility by Age by Marriage Status in Rayville
45.9% of women with births (135) in Rayville are married. The highest percentage of unmarried women with births falls into 15 to 19 years age bracket with 100.0% of them unmarried at the time of birth, while the lowest percentage of unmarried women with births belong to 35 to 50 years age bracket with 0.0% of them unmarried.
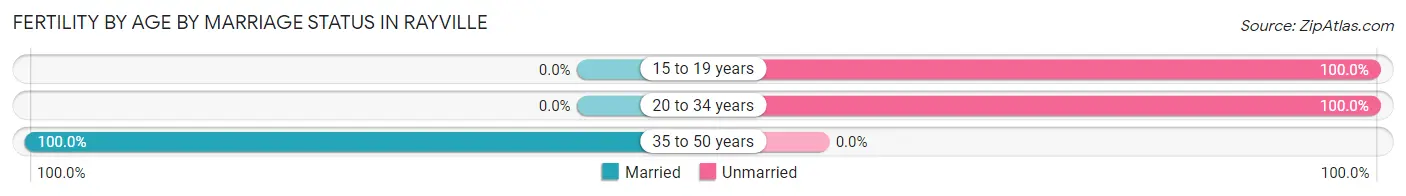
| Age Bracket | Married | Unmarried |
| 15 to 19 years | 0 (0.0%) | 30 (100.0%) |
| 20 to 34 years | 0 (0.0%) | 43 (100.0%) |
| 35 to 50 years | 62 (100.0%) | 0 (0.0%) |
| Total | 62 (45.9%) | 73 (54.1%) |
Fertility by Education in Rayville
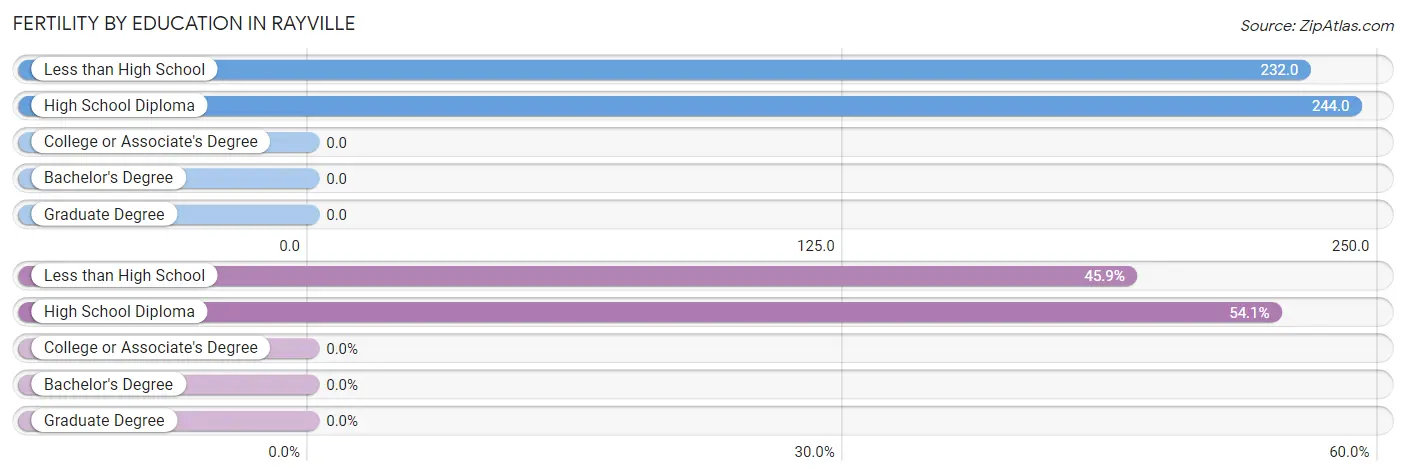
| Educational Attainment | Women with Births | Births / 1,000 Women |
| Less than High School | 62 (45.9%) | 232.0 |
| High School Diploma | 73 (54.1%) | 244.0 |
| College or Associate's Degree | 0 (0.0%) | 0.0 |
| Bachelor's Degree | 0 (0.0%) | 0.0 |
| Graduate Degree | 0 (0.0%) | 0.0 |
| Total | 135 (100.0%) | 172.0 |
Fertility by Education by Marriage Status in Rayville
54.1% of women with births in Rayville are unmarried. Women with the educational attainment of less than high school are most likely to be married with 100.0% of them married at childbirth, while women with the educational attainment of high school diploma are least likely to be married with 100.0% of them unmarried at childbirth.
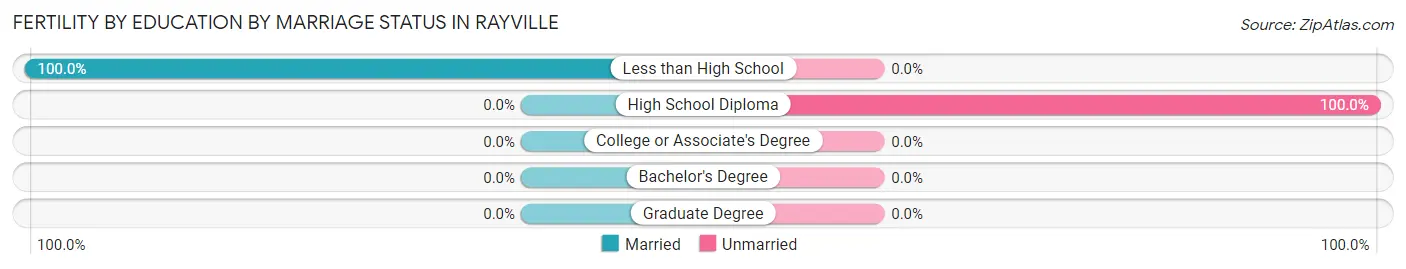
| Educational Attainment | Married | Unmarried |
| Less than High School | 62 (100.0%) | 0 (0.0%) |
| High School Diploma | 0 (0.0%) | 73 (100.0%) |
| College or Associate's Degree | 0 (0.0%) | 0 (0.0%) |
| Bachelor's Degree | 0 (0.0%) | 0 (0.0%) |
| Graduate Degree | 0 (0.0%) | 0 (0.0%) |
| Total | 62 (45.9%) | 73 (54.1%) |
Employment Characteristics in Rayville
Employment by Class of Employer in Rayville
Among the 871 employed individuals in Rayville, private company employees (565 | 64.9%), local government employees (145 | 16.7%), and self-employed (not incorporated) (76 | 8.7%) make up the most common classes of employment.
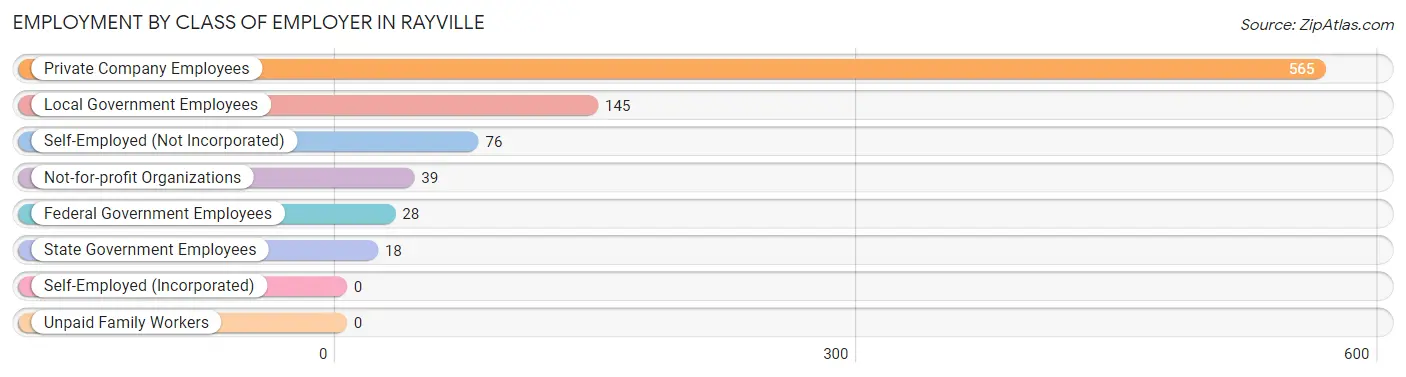
| Employer Class | # Employees | % Employees |
| Private Company Employees | 565 | 64.9% |
| Self-Employed (Incorporated) | 0 | 0.0% |
| Self-Employed (Not Incorporated) | 76 | 8.7% |
| Not-for-profit Organizations | 39 | 4.5% |
| Local Government Employees | 145 | 16.7% |
| State Government Employees | 18 | 2.1% |
| Federal Government Employees | 28 | 3.2% |
| Unpaid Family Workers | 0 | 0.0% |
| Total | 871 | 100.0% |
Employment Status by Age in Rayville
According to the labor force statistics for Rayville, out of the total population over 16 years of age (2,354), 45.8% or 1,078 individuals are in the labor force, with 12.5% or 135 of them unemployed. The age group with the highest labor force participation rate is 45 to 54 years, with 96.9% or 157 individuals in the labor force. Within the labor force, the 20 to 24 years age range has the highest percentage of unemployed individuals, with 30.9% or 68 of them being unemployed.
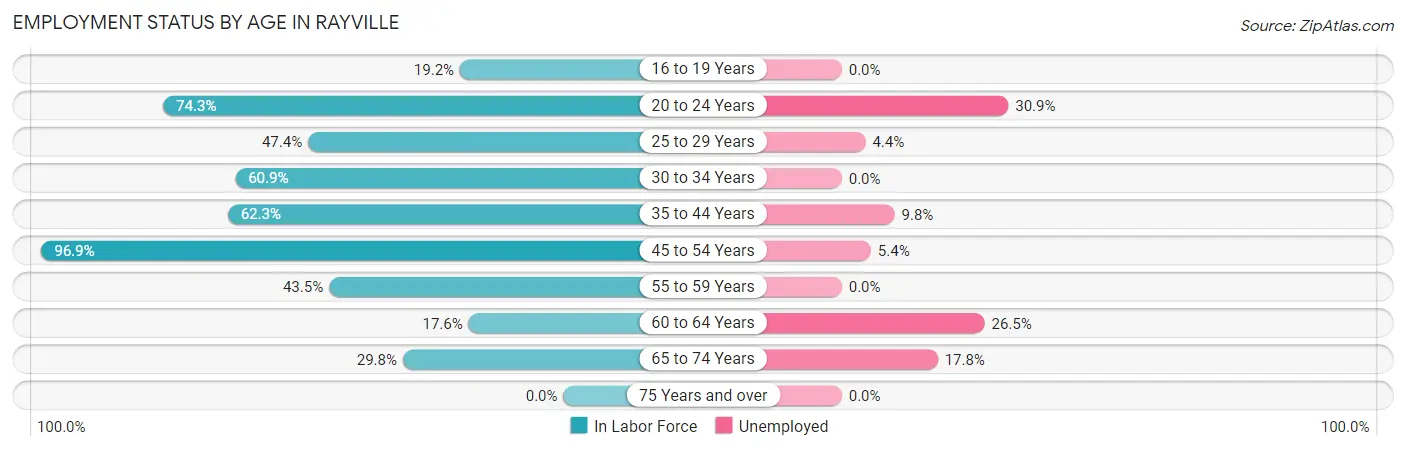
| Age Bracket | In Labor Force | Unemployed |
| 16 to 19 Years | 30 (19.2%) | 0 (0.0%) |
| 20 to 24 Years | 220 (74.3%) | 68 (30.9%) |
| 25 to 29 Years | 91 (47.4%) | 4 (4.4%) |
| 30 to 34 Years | 92 (60.9%) | 0 (0.0%) |
| 35 to 44 Years | 287 (62.3%) | 28 (9.8%) |
| 45 to 54 Years | 157 (96.9%) | 8 (5.4%) |
| 55 to 59 Years | 80 (43.5%) | 0 (0.0%) |
| 60 to 64 Years | 49 (17.6%) | 13 (26.5%) |
| 65 to 74 Years | 73 (29.8%) | 13 (17.8%) |
| 75 Years and over | 0 (0.0%) | 0 (0.0%) |
| Total | 1,078 (45.8%) | 135 (12.5%) |
Employment Status by Educational Attainment in Rayville
According to labor force statistics for Rayville, 52.9% of individuals (756) out of the total population between 25 and 64 years of age (1,429) are in the labor force, with 7.1% or 54 of them being unemployed. The group with the highest labor force participation rate are those with the educational attainment of bachelor's degree or higher, with 85.7% or 191 individuals in the labor force. Within the labor force, individuals with bachelor's degree or higher education have the highest percentage of unemployment, with 9.9% or 19 of them being unemployed.
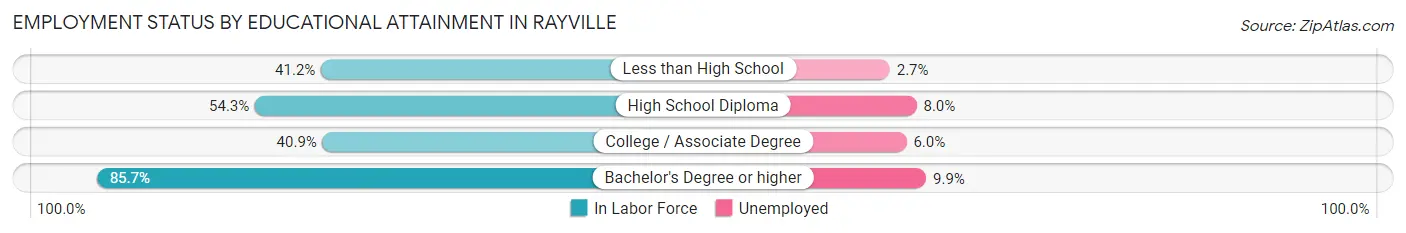
| Educational Attainment | In Labor Force | Unemployed |
| Less than High School | 146 (41.2%) | 10 (2.7%) |
| High School Diploma | 286 (54.3%) | 42 (8.0%) |
| College / Associate Degree | 133 (40.9%) | 20 (6.0%) |
| Bachelor's Degree or higher | 191 (85.7%) | 22 (9.9%) |
| Total | 756 (52.9%) | 101 (7.1%) |
Employment Occupations by Sex in Rayville
Management, Business, Science and Arts Occupations
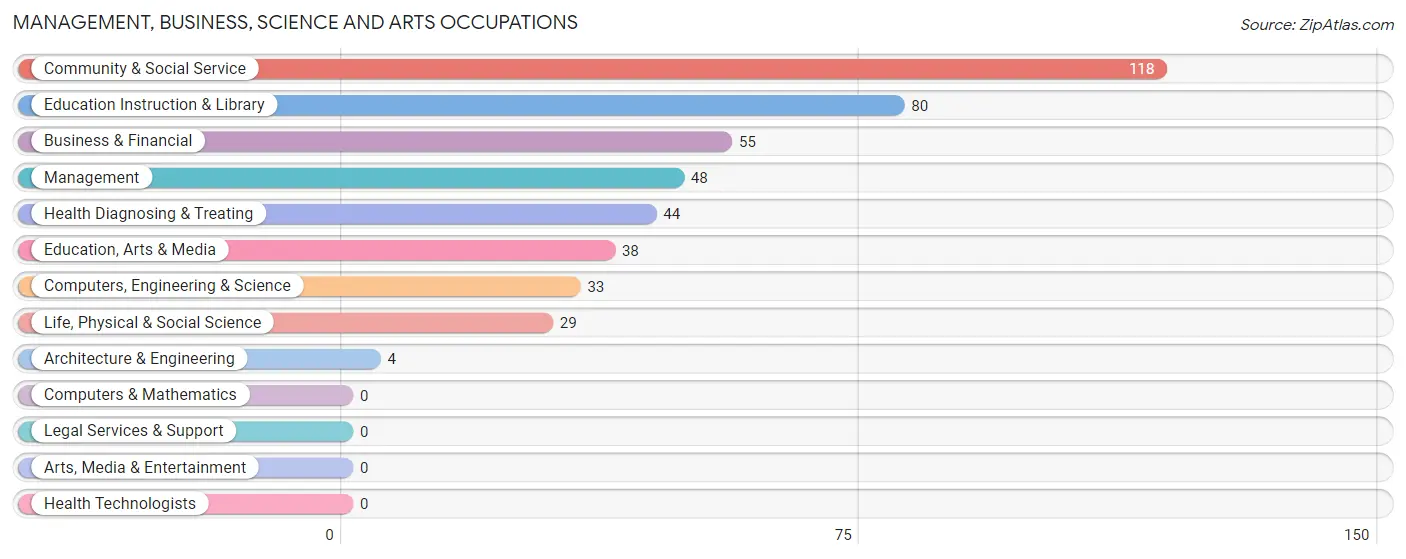
The most common Management, Business, Science and Arts occupations in Rayville are Community & Social Service (118 | 12.6%), Education Instruction & Library (80 | 8.6%), Business & Financial (55 | 5.9%), Management (48 | 5.1%), and Health Diagnosing & Treating (44 | 4.7%).
Management, Business, Science and Arts Occupations by Sex
Within the Management, Business, Science and Arts occupations in Rayville, the most male-oriented occupations are Computers, Engineering & Science (100.0%), Architecture & Engineering (100.0%), and Life, Physical & Social Science (100.0%), while the most female-oriented occupations are Business & Financial (100.0%), Education Instruction & Library (100.0%), and Health Diagnosing & Treating (100.0%).
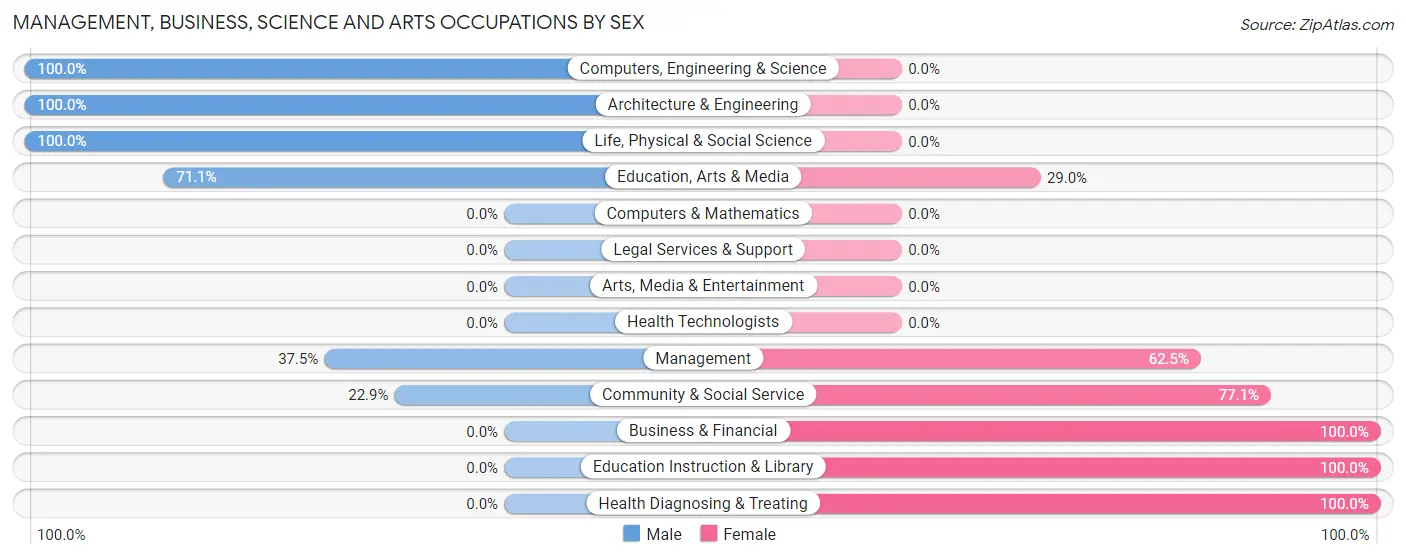
| Occupation | Male | Female |
| Management | 18 (37.5%) | 30 (62.5%) |
| Business & Financial | 0 (0.0%) | 55 (100.0%) |
| Computers, Engineering & Science | 33 (100.0%) | 0 (0.0%) |
| Computers & Mathematics | 0 (0.0%) | 0 (0.0%) |
| Architecture & Engineering | 4 (100.0%) | 0 (0.0%) |
| Life, Physical & Social Science | 29 (100.0%) | 0 (0.0%) |
| Community & Social Service | 27 (22.9%) | 91 (77.1%) |
| Education, Arts & Media | 27 (71.1%) | 11 (28.9%) |
| Legal Services & Support | 0 (0.0%) | 0 (0.0%) |
| Education Instruction & Library | 0 (0.0%) | 80 (100.0%) |
| Arts, Media & Entertainment | 0 (0.0%) | 0 (0.0%) |
| Health Diagnosing & Treating | 0 (0.0%) | 44 (100.0%) |
| Health Technologists | 0 (0.0%) | 0 (0.0%) |
| Total (Category) | 78 (26.2%) | 220 (73.8%) |
| Total (Overall) | 272 (29.1%) | 663 (70.9%) |
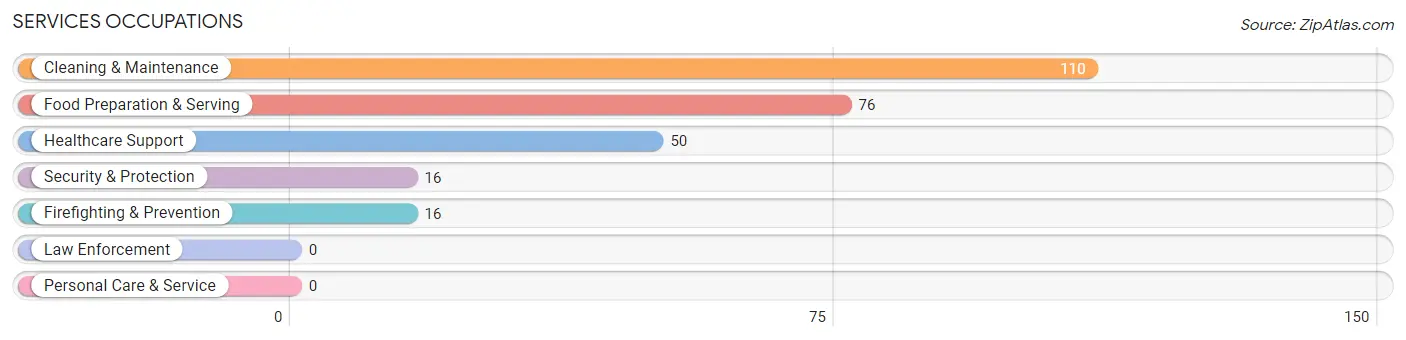
Services Occupations
The most common Services occupations in Rayville are Cleaning & Maintenance (110 | 11.8%), Food Preparation & Serving (76 | 8.1%), Healthcare Support (50 | 5.3%), Security & Protection (16 | 1.7%), and Firefighting & Prevention (16 | 1.7%).
Services Occupations by Sex
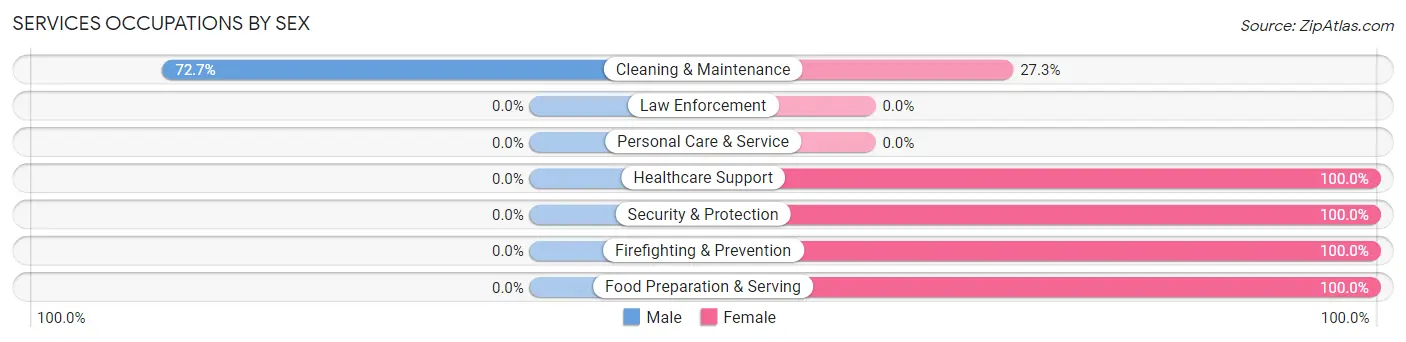
| Occupation | Male | Female |
| Healthcare Support | 0 (0.0%) | 50 (100.0%) |
| Security & Protection | 0 (0.0%) | 16 (100.0%) |
| Firefighting & Prevention | 0 (0.0%) | 16 (100.0%) |
| Law Enforcement | 0 (0.0%) | 0 (0.0%) |
| Food Preparation & Serving | 0 (0.0%) | 76 (100.0%) |
| Cleaning & Maintenance | 80 (72.7%) | 30 (27.3%) |
| Personal Care & Service | 0 (0.0%) | 0 (0.0%) |
| Total (Category) | 80 (31.8%) | 172 (68.2%) |
| Total (Overall) | 272 (29.1%) | 663 (70.9%) |
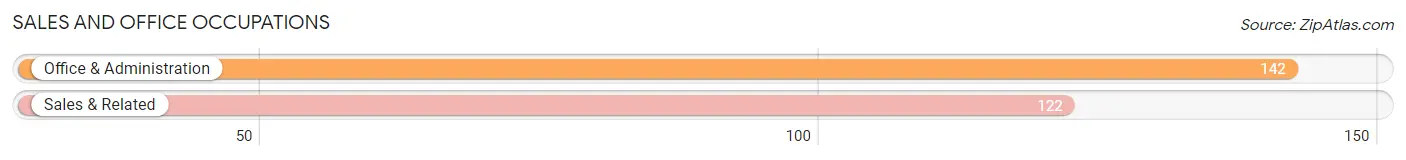
Sales and Office Occupations
The most common Sales and Office occupations in Rayville are Office & Administration (142 | 15.2%), and Sales & Related (122 | 13.1%).
Sales and Office Occupations by Sex
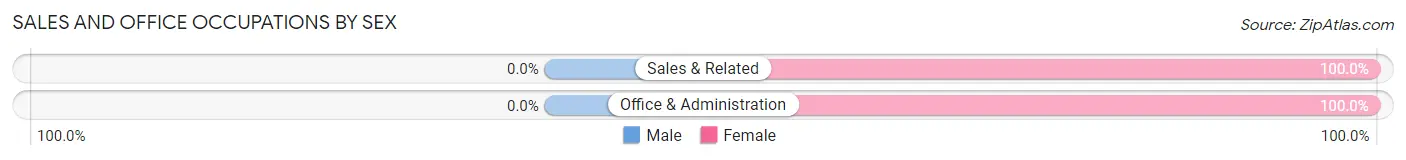
| Occupation | Male | Female |
| Sales & Related | 0 (0.0%) | 122 (100.0%) |
| Office & Administration | 0 (0.0%) | 142 (100.0%) |
| Total (Category) | 0 (0.0%) | 264 (100.0%) |
| Total (Overall) | 272 (29.1%) | 663 (70.9%) |
Natural Resources, Construction and Maintenance Occupations
The most common Natural Resources, Construction and Maintenance occupations in Rayville are Construction & Extraction (67 | 7.2%), and Installation, Maintenance & Repair (4 | 0.4%).

Natural Resources, Construction and Maintenance Occupations by Sex
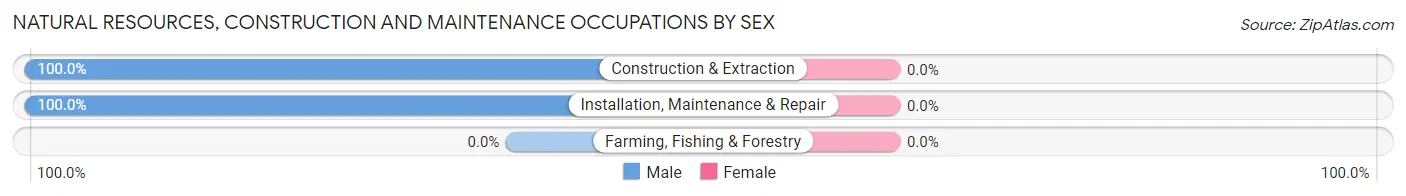
| Occupation | Male | Female |
| Farming, Fishing & Forestry | 0 (0.0%) | 0 (0.0%) |
| Construction & Extraction | 67 (100.0%) | 0 (0.0%) |
| Installation, Maintenance & Repair | 4 (100.0%) | 0 (0.0%) |
| Total (Category) | 71 (100.0%) | 0 (0.0%) |
| Total (Overall) | 272 (29.1%) | 663 (70.9%) |
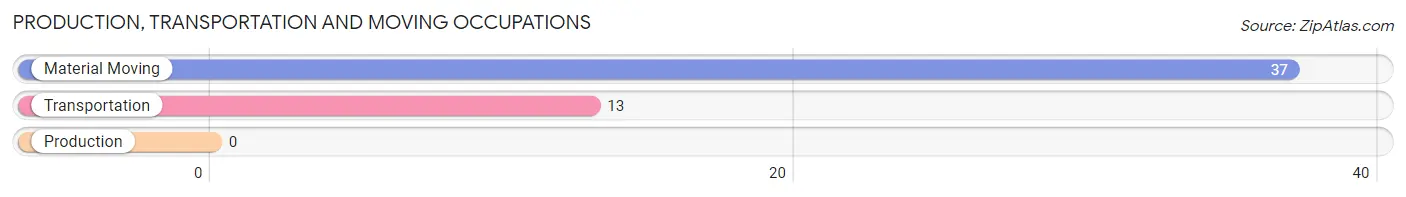
Production, Transportation and Moving Occupations
The most common Production, Transportation and Moving occupations in Rayville are Material Moving (37 | 4.0%), and Transportation (13 | 1.4%).
Production, Transportation and Moving Occupations by Sex
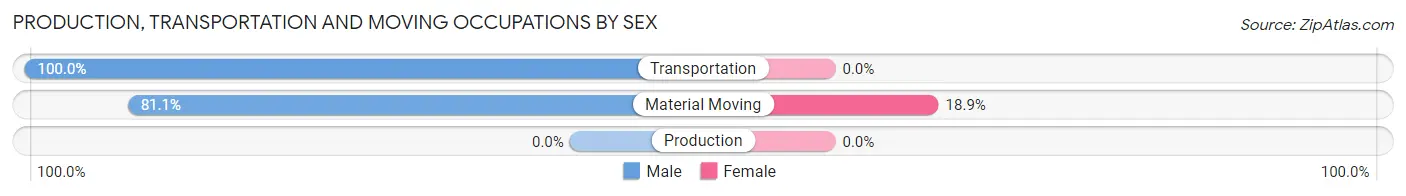
| Occupation | Male | Female |
| Production | 0 (0.0%) | 0 (0.0%) |
| Transportation | 13 (100.0%) | 0 (0.0%) |
| Material Moving | 30 (81.1%) | 7 (18.9%) |
| Total (Category) | 43 (86.0%) | 7 (14.0%) |
| Total (Overall) | 272 (29.1%) | 663 (70.9%) |
Employment Industries by Sex in Rayville
Employment Industries in Rayville
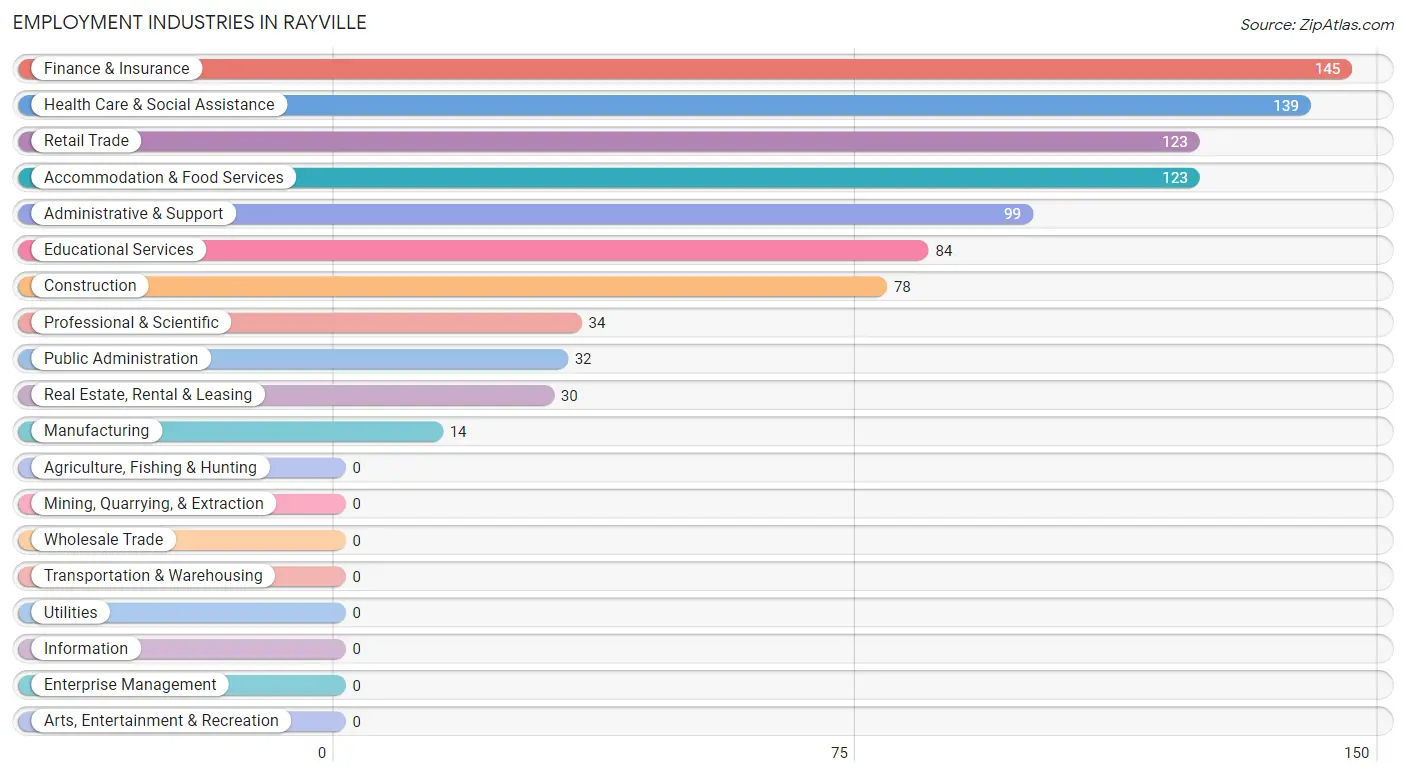
The major employment industries in Rayville include Finance & Insurance (145 | 15.5%), Health Care & Social Assistance (139 | 14.9%), Retail Trade (123 | 13.2%), Accommodation & Food Services (123 | 13.2%), and Administrative & Support (99 | 10.6%).
Employment Industries by Sex in Rayville
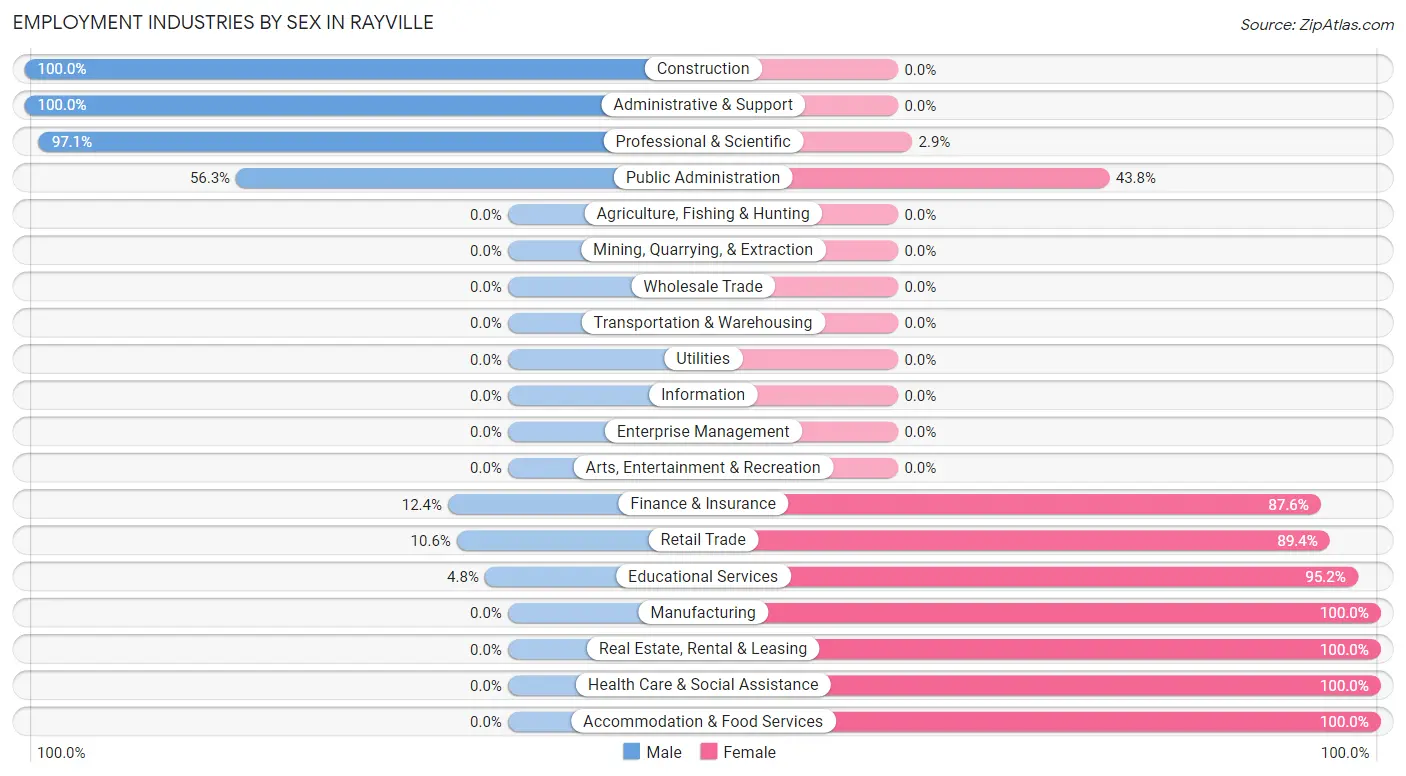
The Rayville industries that see more men than women are Construction (100.0%), Administrative & Support (100.0%), and Professional & Scientific (97.1%), whereas the industries that tend to have a higher number of women are Manufacturing (100.0%), Real Estate, Rental & Leasing (100.0%), and Health Care & Social Assistance (100.0%).
| Industry | Male | Female |
| Agriculture, Fishing & Hunting | 0 (0.0%) | 0 (0.0%) |
| Mining, Quarrying, & Extraction | 0 (0.0%) | 0 (0.0%) |
| Construction | 78 (100.0%) | 0 (0.0%) |
| Manufacturing | 0 (0.0%) | 14 (100.0%) |
| Wholesale Trade | 0 (0.0%) | 0 (0.0%) |
| Retail Trade | 13 (10.6%) | 110 (89.4%) |
| Transportation & Warehousing | 0 (0.0%) | 0 (0.0%) |
| Utilities | 0 (0.0%) | 0 (0.0%) |
| Information | 0 (0.0%) | 0 (0.0%) |
| Finance & Insurance | 18 (12.4%) | 127 (87.6%) |
| Real Estate, Rental & Leasing | 0 (0.0%) | 30 (100.0%) |
| Professional & Scientific | 33 (97.1%) | 1 (2.9%) |
| Enterprise Management | 0 (0.0%) | 0 (0.0%) |
| Administrative & Support | 99 (100.0%) | 0 (0.0%) |
| Educational Services | 4 (4.8%) | 80 (95.2%) |
| Health Care & Social Assistance | 0 (0.0%) | 139 (100.0%) |
| Arts, Entertainment & Recreation | 0 (0.0%) | 0 (0.0%) |
| Accommodation & Food Services | 0 (0.0%) | 123 (100.0%) |
| Public Administration | 18 (56.2%) | 14 (43.8%) |
| Total | 272 (29.1%) | 663 (70.9%) |
Education in Rayville
School Enrollment in Rayville
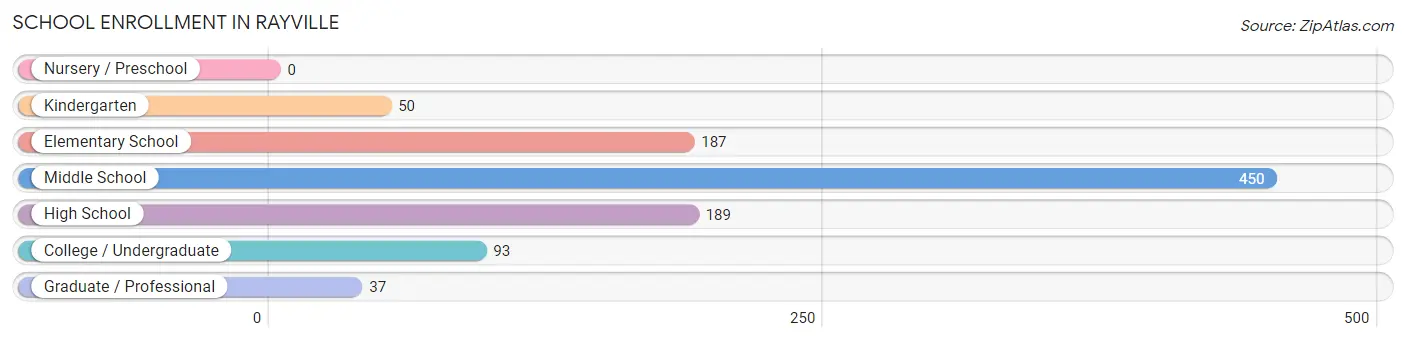
The most common levels of schooling among the 1,006 students in Rayville are middle school (450 | 44.7%), high school (189 | 18.8%), and elementary school (187 | 18.6%).
| School Level | # Students | % Students |
| Nursery / Preschool | 0 | 0.0% |
| Kindergarten | 50 | 5.0% |
| Elementary School | 187 | 18.6% |
| Middle School | 450 | 44.7% |
| High School | 189 | 18.8% |
| College / Undergraduate | 93 | 9.2% |
| Graduate / Professional | 37 | 3.7% |
| Total | 1,006 | 100.0% |
School Enrollment by Age by Funding Source in Rayville
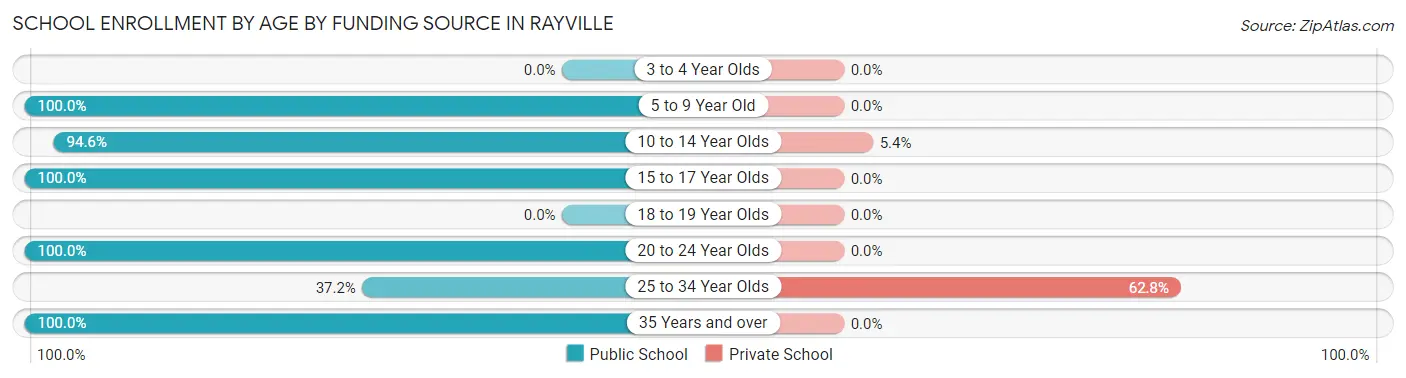
Out of a total of 1,006 students who are enrolled in schools in Rayville, 53 (5.3%) attend a private institution, while the remaining 953 (94.7%) are enrolled in public schools. The age group of 25 to 34 year olds has the highest likelihood of being enrolled in private schools, with 27 (62.8% in the age bracket) enrolled. Conversely, the age group of 5 to 9 year old has the lowest likelihood of being enrolled in a private school, with 206 (100.0% in the age bracket) attending a public institution.
| Age Bracket | Public School | Private School |
| 3 to 4 Year Olds | 0 (0.0%) | 0 (0.0%) |
| 5 to 9 Year Old | 206 (100.0%) | 0 (0.0%) |
| 10 to 14 Year Olds | 455 (94.6%) | 26 (5.4%) |
| 15 to 17 Year Olds | 163 (100.0%) | 0 (0.0%) |
| 18 to 19 Year Olds | 0 (0.0%) | 0 (0.0%) |
| 20 to 24 Year Olds | 32 (100.0%) | 0 (0.0%) |
| 25 to 34 Year Olds | 16 (37.2%) | 27 (62.8%) |
| 35 Years and over | 81 (100.0%) | 0 (0.0%) |
| Total | 953 (94.7%) | 53 (5.3%) |
Educational Attainment by Field of Study in Rayville
Arts & humanities (78 | 25.6%), business (70 | 23.0%), education (44 | 14.4%), communications (40 | 13.1%), and liberal arts & history (22 | 7.2%) are the most common fields of study among 305 individuals in Rayville who have obtained a bachelor's degree or higher.
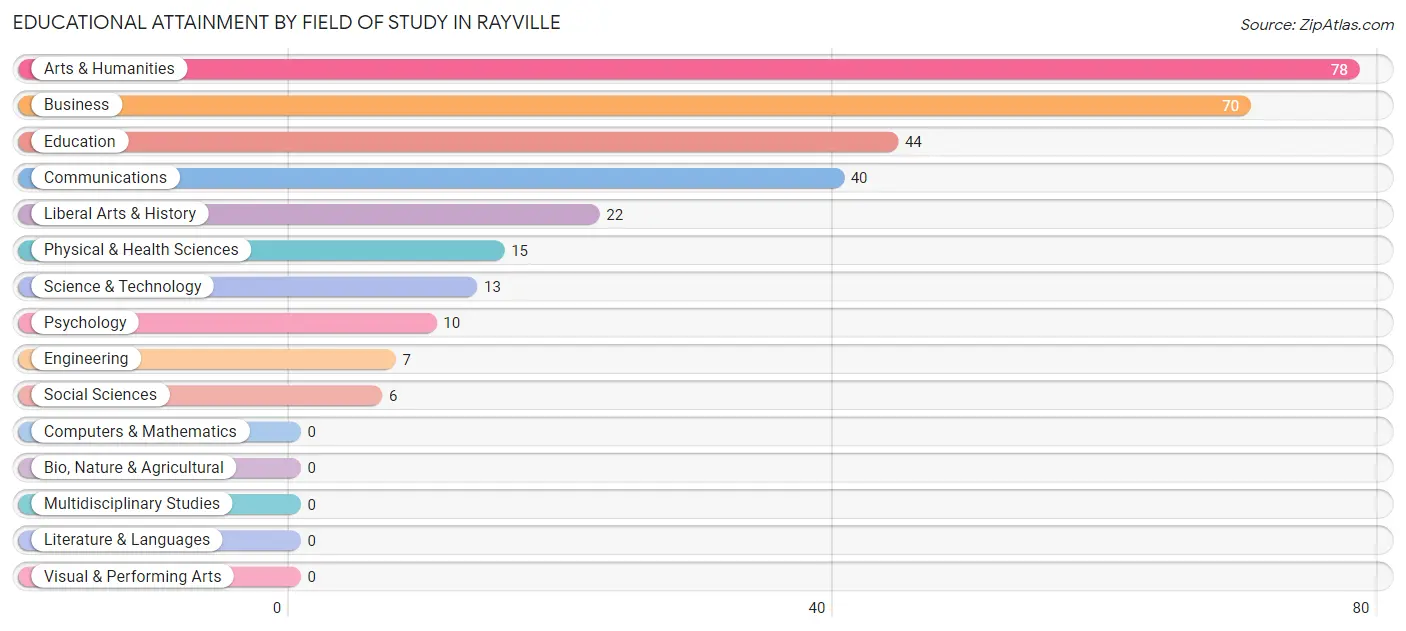
| Field of Study | # Graduates | % Graduates |
| Computers & Mathematics | 0 | 0.0% |
| Bio, Nature & Agricultural | 0 | 0.0% |
| Physical & Health Sciences | 15 | 4.9% |
| Psychology | 10 | 3.3% |
| Social Sciences | 6 | 2.0% |
| Engineering | 7 | 2.3% |
| Multidisciplinary Studies | 0 | 0.0% |
| Science & Technology | 13 | 4.3% |
| Business | 70 | 23.0% |
| Education | 44 | 14.4% |
| Literature & Languages | 0 | 0.0% |
| Liberal Arts & History | 22 | 7.2% |
| Visual & Performing Arts | 0 | 0.0% |
| Communications | 40 | 13.1% |
| Arts & Humanities | 78 | 25.6% |
| Total | 305 | 100.0% |
Transportation & Commute in Rayville
Vehicle Availability by Sex in Rayville
The most prevalent vehicle ownership categories in Rayville are males with 1 vehicle (140, accounting for 49.6%) and females with 1 vehicle (196, making up 23.8%).
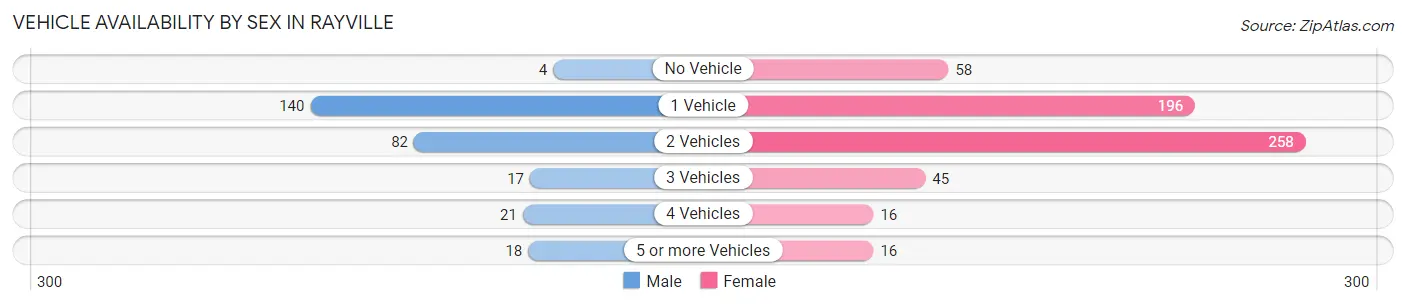
| Vehicles Available | Male | Female |
| No Vehicle | 4 (1.4%) | 58 (9.9%) |
| 1 Vehicle | 140 (49.6%) | 196 (33.3%) |
| 2 Vehicles | 82 (29.1%) | 258 (43.8%) |
| 3 Vehicles | 17 (6.0%) | 45 (7.6%) |
| 4 Vehicles | 21 (7.4%) | 16 (2.7%) |
| 5 or more Vehicles | 18 (6.4%) | 16 (2.7%) |
| Total | 282 (100.0%) | 589 (100.0%) |
Commute Time in Rayville
The most frequently occuring commute durations in Rayville are 30 to 34 minutes (180 commuters, 20.7%), 20 to 24 minutes (129 commuters, 14.8%), and 10 to 14 minutes (124 commuters, 14.2%).
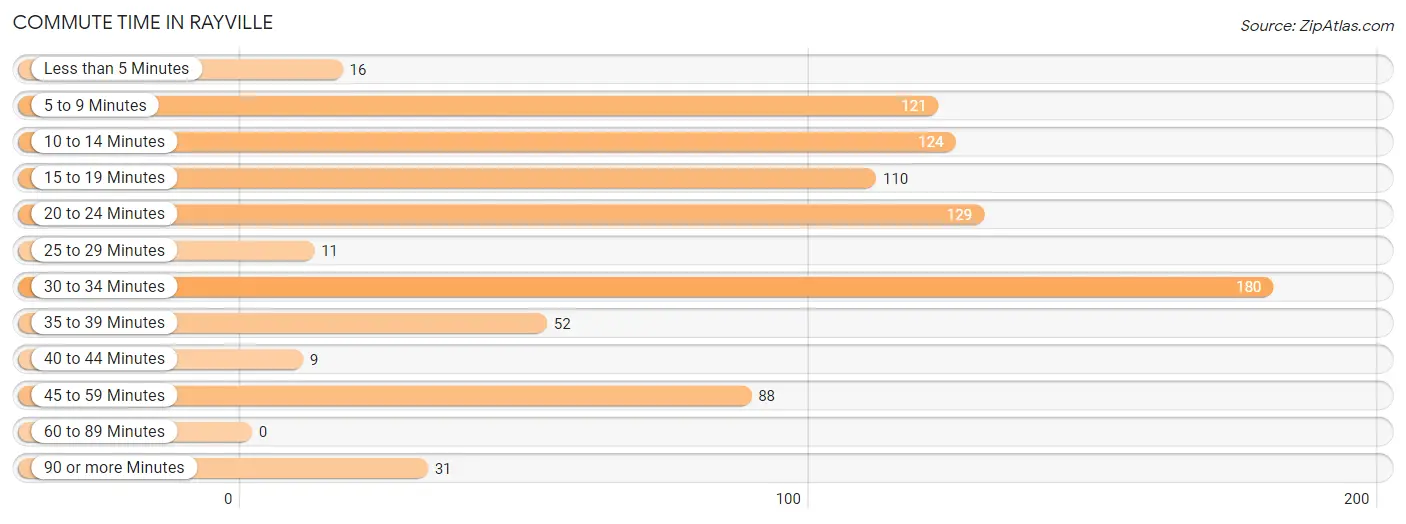
| Commute Time | # Commuters | % Commuters |
| Less than 5 Minutes | 16 | 1.8% |
| 5 to 9 Minutes | 121 | 13.9% |
| 10 to 14 Minutes | 124 | 14.2% |
| 15 to 19 Minutes | 110 | 12.6% |
| 20 to 24 Minutes | 129 | 14.8% |
| 25 to 29 Minutes | 11 | 1.3% |
| 30 to 34 Minutes | 180 | 20.7% |
| 35 to 39 Minutes | 52 | 6.0% |
| 40 to 44 Minutes | 9 | 1.0% |
| 45 to 59 Minutes | 88 | 10.1% |
| 60 to 89 Minutes | 0 | 0.0% |
| 90 or more Minutes | 31 | 3.6% |
Commute Time by Sex in Rayville
The most common commute times in Rayville are 15 to 19 minutes (75 commuters, 26.6%) for males and 30 to 34 minutes (138 commuters, 23.4%) for females.
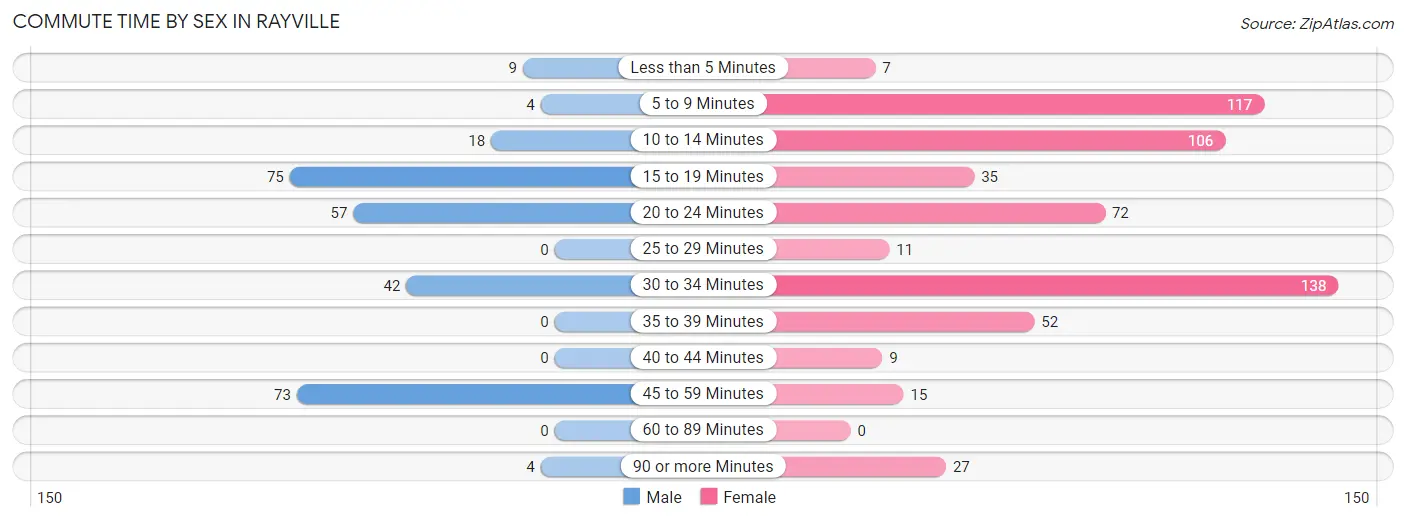
| Commute Time | Male | Female |
| Less than 5 Minutes | 9 (3.2%) | 7 (1.2%) |
| 5 to 9 Minutes | 4 (1.4%) | 117 (19.9%) |
| 10 to 14 Minutes | 18 (6.4%) | 106 (18.0%) |
| 15 to 19 Minutes | 75 (26.6%) | 35 (5.9%) |
| 20 to 24 Minutes | 57 (20.2%) | 72 (12.2%) |
| 25 to 29 Minutes | 0 (0.0%) | 11 (1.9%) |
| 30 to 34 Minutes | 42 (14.9%) | 138 (23.4%) |
| 35 to 39 Minutes | 0 (0.0%) | 52 (8.8%) |
| 40 to 44 Minutes | 0 (0.0%) | 9 (1.5%) |
| 45 to 59 Minutes | 73 (25.9%) | 15 (2.5%) |
| 60 to 89 Minutes | 0 (0.0%) | 0 (0.0%) |
| 90 or more Minutes | 4 (1.4%) | 27 (4.6%) |
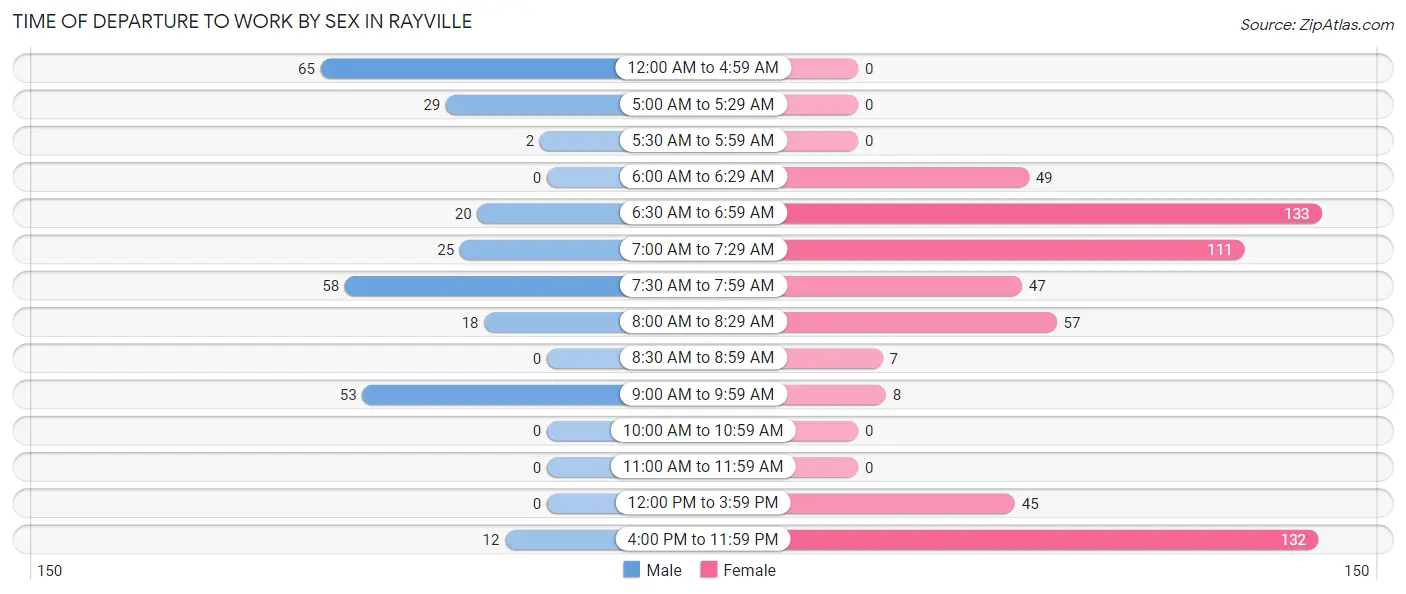
Time of Departure to Work by Sex in Rayville
The most frequent times of departure to work in Rayville are 12:00 AM to 4:59 AM (65, 23.1%) for males and 6:30 AM to 6:59 AM (133, 22.6%) for females.
| Time of Departure | Male | Female |
| 12:00 AM to 4:59 AM | 65 (23.1%) | 0 (0.0%) |
| 5:00 AM to 5:29 AM | 29 (10.3%) | 0 (0.0%) |
| 5:30 AM to 5:59 AM | 2 (0.7%) | 0 (0.0%) |
| 6:00 AM to 6:29 AM | 0 (0.0%) | 49 (8.3%) |
| 6:30 AM to 6:59 AM | 20 (7.1%) | 133 (22.6%) |
| 7:00 AM to 7:29 AM | 25 (8.9%) | 111 (18.9%) |
| 7:30 AM to 7:59 AM | 58 (20.6%) | 47 (8.0%) |
| 8:00 AM to 8:29 AM | 18 (6.4%) | 57 (9.7%) |
| 8:30 AM to 8:59 AM | 0 (0.0%) | 7 (1.2%) |
| 9:00 AM to 9:59 AM | 53 (18.8%) | 8 (1.4%) |
| 10:00 AM to 10:59 AM | 0 (0.0%) | 0 (0.0%) |
| 11:00 AM to 11:59 AM | 0 (0.0%) | 0 (0.0%) |
| 12:00 PM to 3:59 PM | 0 (0.0%) | 45 (7.6%) |
| 4:00 PM to 11:59 PM | 12 (4.3%) | 132 (22.4%) |
| Total | 282 (100.0%) | 589 (100.0%) |
Housing Occupancy in Rayville
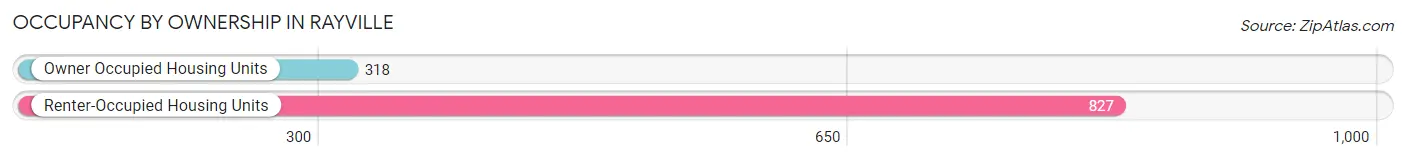
Occupancy by Ownership in Rayville
Of the total 1,145 dwellings in Rayville, owner-occupied units account for 318 (27.8%), while renter-occupied units make up 827 (72.2%).
| Occupancy | # Housing Units | % Housing Units |
| Owner Occupied Housing Units | 318 | 27.8% |
| Renter-Occupied Housing Units | 827 | 72.2% |
| Total Occupied Housing Units | 1,145 | 100.0% |
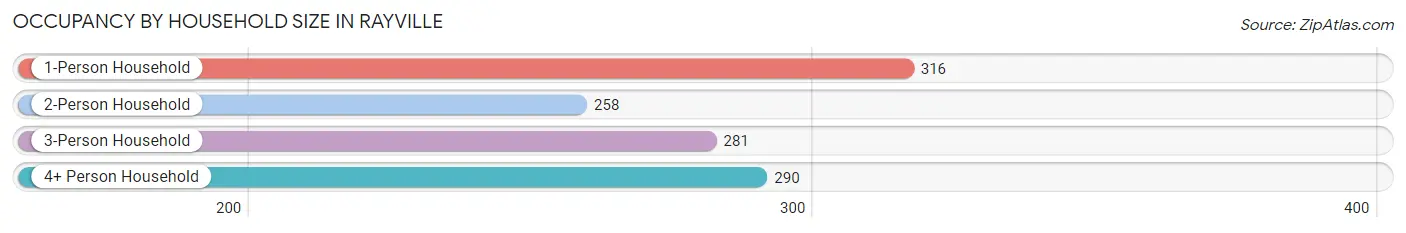
Occupancy by Household Size in Rayville
| Household Size | # Housing Units | % Housing Units |
| 1-Person Household | 316 | 27.6% |
| 2-Person Household | 258 | 22.5% |
| 3-Person Household | 281 | 24.5% |
| 4+ Person Household | 290 | 25.3% |
| Total Housing Units | 1,145 | 100.0% |
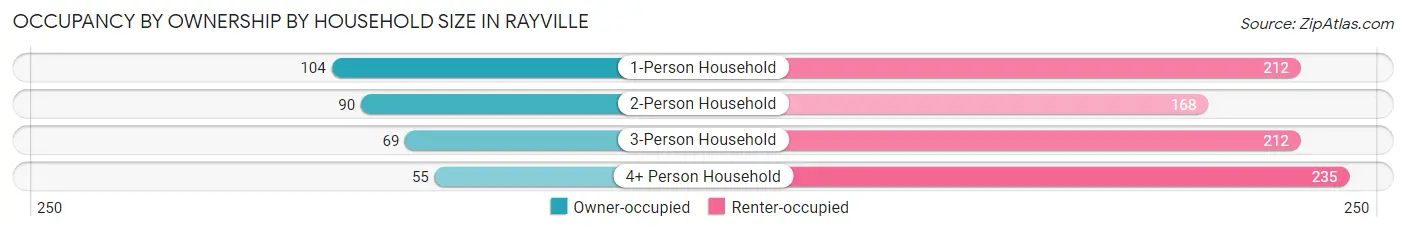
Occupancy by Ownership by Household Size in Rayville
| Household Size | Owner-occupied | Renter-occupied |
| 1-Person Household | 104 (32.9%) | 212 (67.1%) |
| 2-Person Household | 90 (34.9%) | 168 (65.1%) |
| 3-Person Household | 69 (24.6%) | 212 (75.4%) |
| 4+ Person Household | 55 (19.0%) | 235 (81.0%) |
| Total Housing Units | 318 (27.8%) | 827 (72.2%) |
Occupancy by Educational Attainment in Rayville
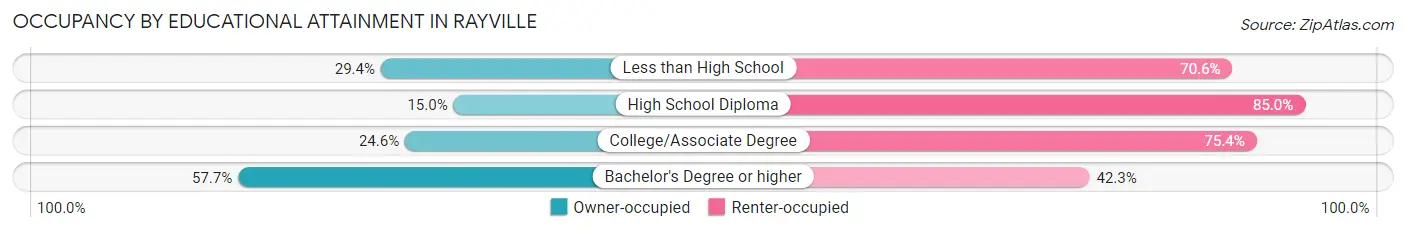
| Household Size | Owner-occupied | Renter-occupied |
| Less than High School | 104 (29.4%) | 250 (70.6%) |
| High School Diploma | 50 (15.0%) | 284 (85.0%) |
| College/Associate Degree | 74 (24.6%) | 227 (75.4%) |
| Bachelor's Degree or higher | 90 (57.7%) | 66 (42.3%) |
Occupancy by Age of Householder in Rayville
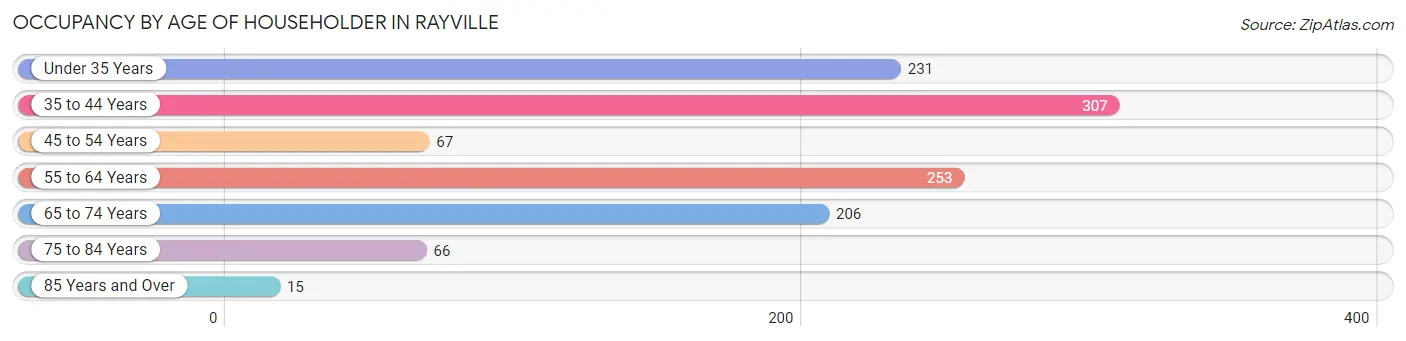
| Age Bracket | # Households | % Households |
| Under 35 Years | 231 | 20.2% |
| 35 to 44 Years | 307 | 26.8% |
| 45 to 54 Years | 67 | 5.9% |
| 55 to 64 Years | 253 | 22.1% |
| 65 to 74 Years | 206 | 18.0% |
| 75 to 84 Years | 66 | 5.8% |
| 85 Years and Over | 15 | 1.3% |
| Total | 1,145 | 100.0% |
Housing Finances in Rayville
Median Income by Occupancy in Rayville
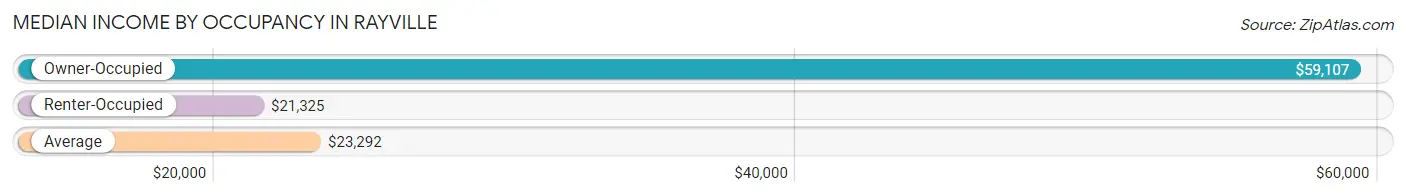
| Occupancy Type | # Households | Median Income |
| Owner-Occupied | 318 (27.8%) | $59,107 |
| Renter-Occupied | 827 (72.2%) | $21,325 |
| Average | 1,145 (100.0%) | $23,292 |
Occupancy by Householder Income Bracket in Rayville
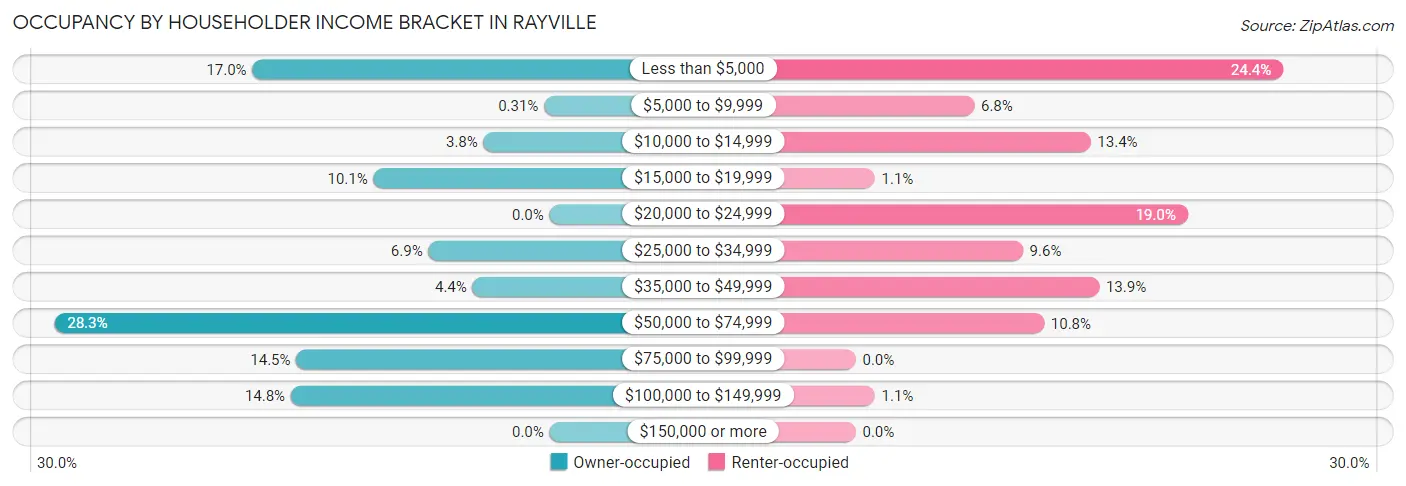
| Income Bracket | Owner-occupied | Renter-occupied |
| Less than $5,000 | 54 (17.0%) | 202 (24.4%) |
| $5,000 to $9,999 | 1 (0.3%) | 56 (6.8%) |
| $10,000 to $14,999 | 12 (3.8%) | 111 (13.4%) |
| $15,000 to $19,999 | 32 (10.1%) | 9 (1.1%) |
| $20,000 to $24,999 | 0 (0.0%) | 157 (19.0%) |
| $25,000 to $34,999 | 22 (6.9%) | 79 (9.6%) |
| $35,000 to $49,999 | 14 (4.4%) | 115 (13.9%) |
| $50,000 to $74,999 | 90 (28.3%) | 89 (10.8%) |
| $75,000 to $99,999 | 46 (14.5%) | 0 (0.0%) |
| $100,000 to $149,999 | 47 (14.8%) | 9 (1.1%) |
| $150,000 or more | 0 (0.0%) | 0 (0.0%) |
| Total | 318 (100.0%) | 827 (100.0%) |
Monthly Housing Cost Tiers in Rayville
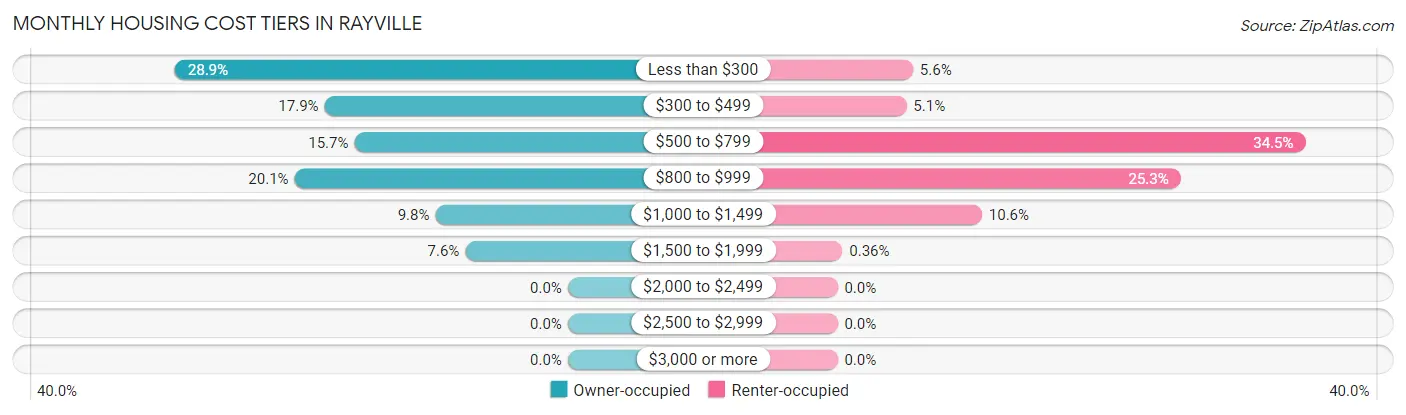
| Monthly Cost | Owner-occupied | Renter-occupied |
| Less than $300 | 92 (28.9%) | 46 (5.6%) |
| $300 to $499 | 57 (17.9%) | 42 (5.1%) |
| $500 to $799 | 50 (15.7%) | 285 (34.5%) |
| $800 to $999 | 64 (20.1%) | 209 (25.3%) |
| $1,000 to $1,499 | 31 (9.8%) | 88 (10.6%) |
| $1,500 to $1,999 | 24 (7.5%) | 3 (0.4%) |
| $2,000 to $2,499 | 0 (0.0%) | 0 (0.0%) |
| $2,500 to $2,999 | 0 (0.0%) | 0 (0.0%) |
| $3,000 or more | 0 (0.0%) | 0 (0.0%) |
| Total | 318 (100.0%) | 827 (100.0%) |
Physical Housing Characteristics in Rayville
Housing Structures in Rayville
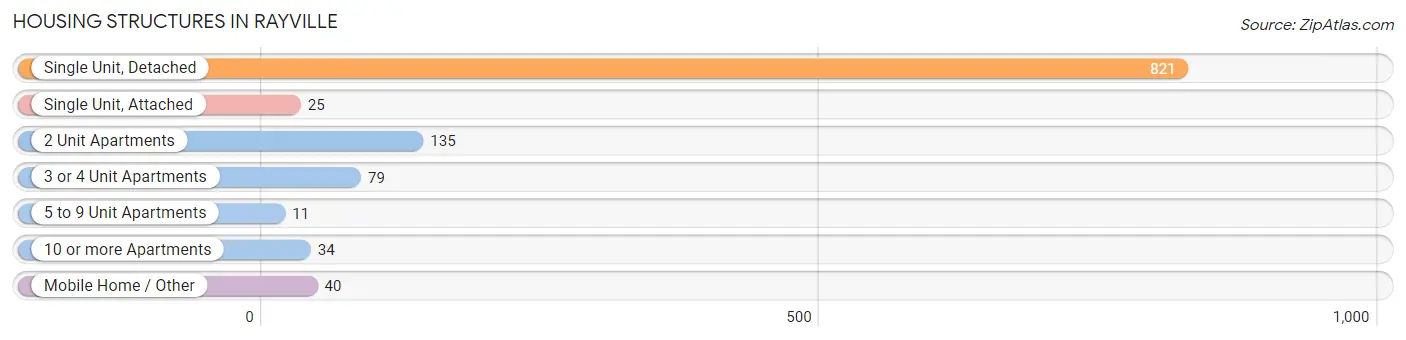
| Structure Type | # Housing Units | % Housing Units |
| Single Unit, Detached | 821 | 71.7% |
| Single Unit, Attached | 25 | 2.2% |
| 2 Unit Apartments | 135 | 11.8% |
| 3 or 4 Unit Apartments | 79 | 6.9% |
| 5 to 9 Unit Apartments | 11 | 1.0% |
| 10 or more Apartments | 34 | 3.0% |
| Mobile Home / Other | 40 | 3.5% |
| Total | 1,145 | 100.0% |
Housing Structures by Occupancy in Rayville
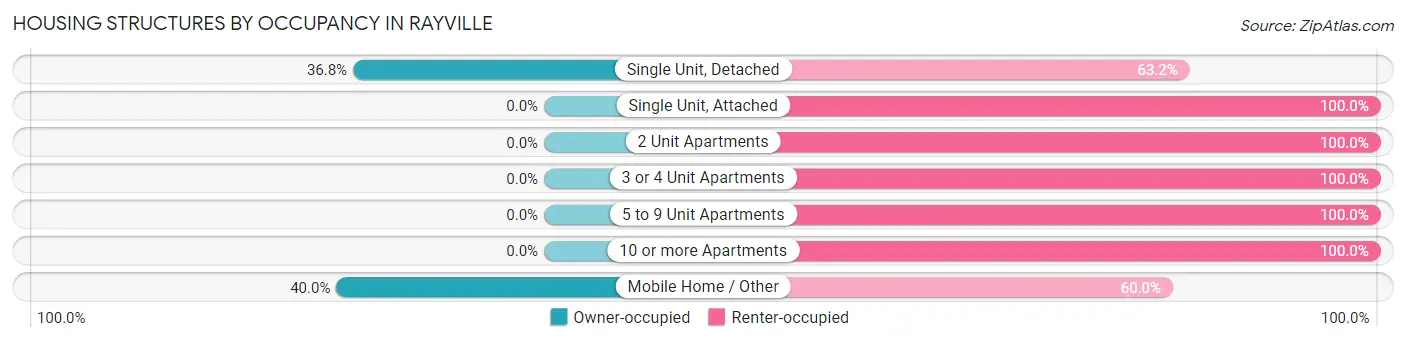
| Structure Type | Owner-occupied | Renter-occupied |
| Single Unit, Detached | 302 (36.8%) | 519 (63.2%) |
| Single Unit, Attached | 0 (0.0%) | 25 (100.0%) |
| 2 Unit Apartments | 0 (0.0%) | 135 (100.0%) |
| 3 or 4 Unit Apartments | 0 (0.0%) | 79 (100.0%) |
| 5 to 9 Unit Apartments | 0 (0.0%) | 11 (100.0%) |
| 10 or more Apartments | 0 (0.0%) | 34 (100.0%) |
| Mobile Home / Other | 16 (40.0%) | 24 (60.0%) |
| Total | 318 (27.8%) | 827 (72.2%) |
Housing Structures by Number of Rooms in Rayville
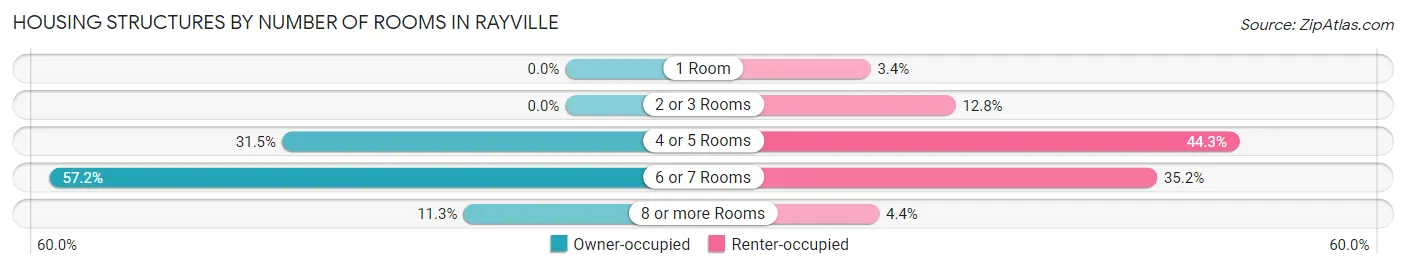
| Number of Rooms | Owner-occupied | Renter-occupied |
| 1 Room | 0 (0.0%) | 28 (3.4%) |
| 2 or 3 Rooms | 0 (0.0%) | 106 (12.8%) |
| 4 or 5 Rooms | 100 (31.5%) | 366 (44.3%) |
| 6 or 7 Rooms | 182 (57.2%) | 291 (35.2%) |
| 8 or more Rooms | 36 (11.3%) | 36 (4.3%) |
| Total | 318 (100.0%) | 827 (100.0%) |
Housing Structure by Heating Type in Rayville
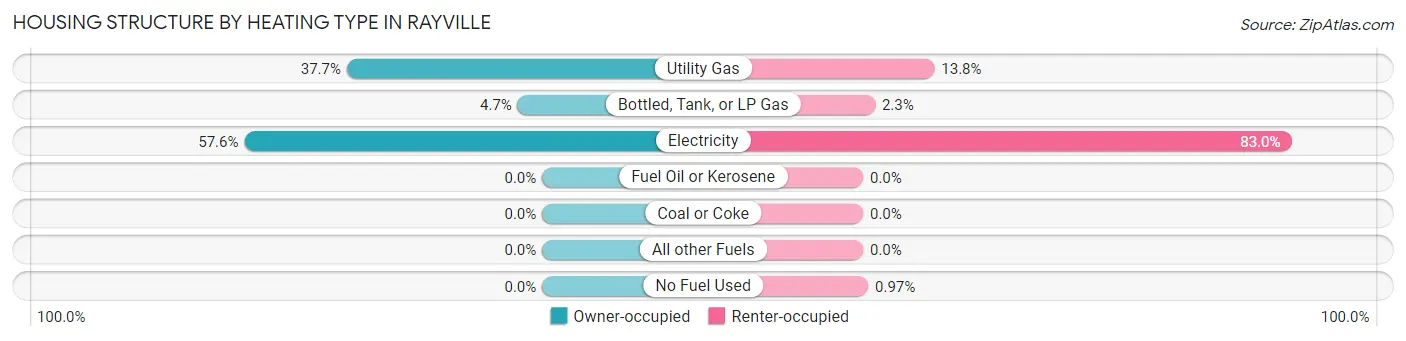
| Heating Type | Owner-occupied | Renter-occupied |
| Utility Gas | 120 (37.7%) | 114 (13.8%) |
| Bottled, Tank, or LP Gas | 15 (4.7%) | 19 (2.3%) |
| Electricity | 183 (57.6%) | 686 (83.0%) |
| Fuel Oil or Kerosene | 0 (0.0%) | 0 (0.0%) |
| Coal or Coke | 0 (0.0%) | 0 (0.0%) |
| All other Fuels | 0 (0.0%) | 0 (0.0%) |
| No Fuel Used | 0 (0.0%) | 8 (1.0%) |
| Total | 318 (100.0%) | 827 (100.0%) |
Household Vehicle Usage in Rayville
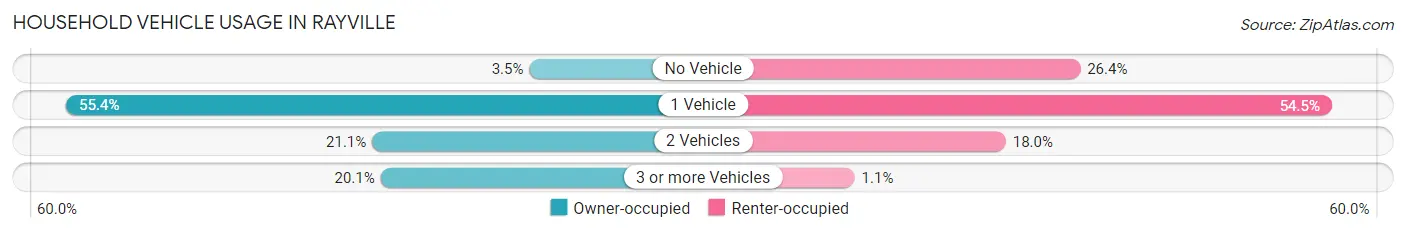
| Vehicles per Household | Owner-occupied | Renter-occupied |
| No Vehicle | 11 (3.5%) | 218 (26.4%) |
| 1 Vehicle | 176 (55.3%) | 451 (54.5%) |
| 2 Vehicles | 67 (21.1%) | 149 (18.0%) |
| 3 or more Vehicles | 64 (20.1%) | 9 (1.1%) |
| Total | 318 (100.0%) | 827 (100.0%) |
Real Estate & Mortgages in Rayville
Real Estate and Mortgage Overview in Rayville
| Characteristic | Without Mortgage | With Mortgage |
| Housing Units | 175 | 143 |
| Median Property Value | $77,300 | $102,800 |
| Median Household Income | - | - |
| Monthly Housing Costs | $288 | $0 |
| Real Estate Taxes | $199 | $0 |
Property Value by Mortgage Status in Rayville
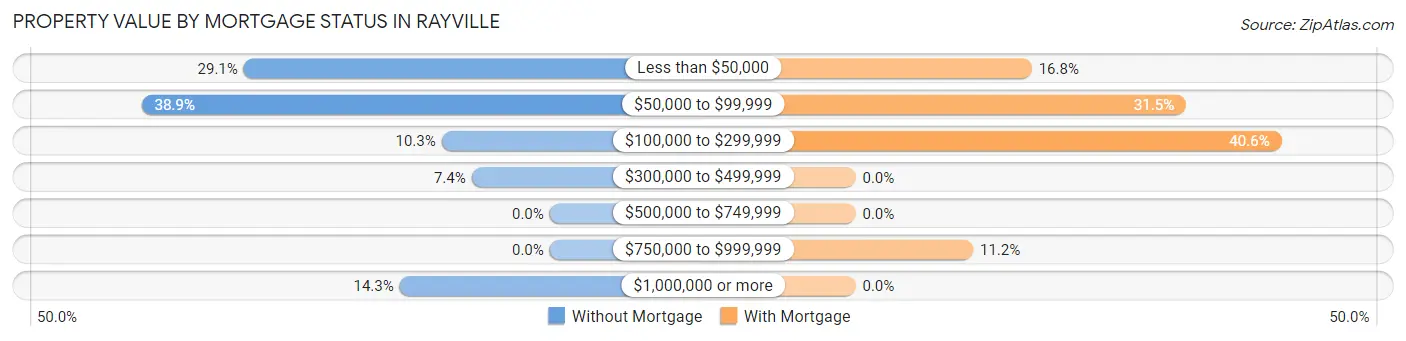
| Property Value | Without Mortgage | With Mortgage |
| Less than $50,000 | 51 (29.1%) | 24 (16.8%) |
| $50,000 to $99,999 | 68 (38.9%) | 45 (31.5%) |
| $100,000 to $299,999 | 18 (10.3%) | 58 (40.6%) |
| $300,000 to $499,999 | 13 (7.4%) | 0 (0.0%) |
| $500,000 to $749,999 | 0 (0.0%) | 0 (0.0%) |
| $750,000 to $999,999 | 0 (0.0%) | 16 (11.2%) |
| $1,000,000 or more | 25 (14.3%) | 0 (0.0%) |
| Total | 175 (100.0%) | 143 (100.0%) |
Household Income by Mortgage Status in Rayville
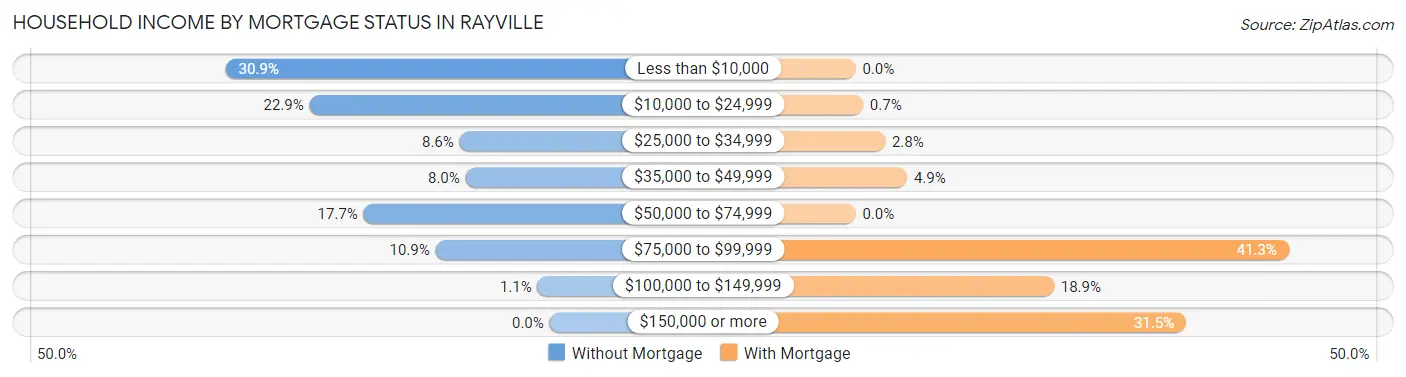
| Household Income | Without Mortgage | With Mortgage |
| Less than $10,000 | 54 (30.9%) | 0 (0.0%) |
| $10,000 to $24,999 | 40 (22.9%) | 1 (0.7%) |
| $25,000 to $34,999 | 15 (8.6%) | 4 (2.8%) |
| $35,000 to $49,999 | 14 (8.0%) | 7 (4.9%) |
| $50,000 to $74,999 | 31 (17.7%) | 0 (0.0%) |
| $75,000 to $99,999 | 19 (10.9%) | 59 (41.3%) |
| $100,000 to $149,999 | 2 (1.1%) | 27 (18.9%) |
| $150,000 or more | 0 (0.0%) | 45 (31.5%) |
| Total | 175 (100.0%) | 143 (100.0%) |
Property Value to Household Income Ratio in Rayville
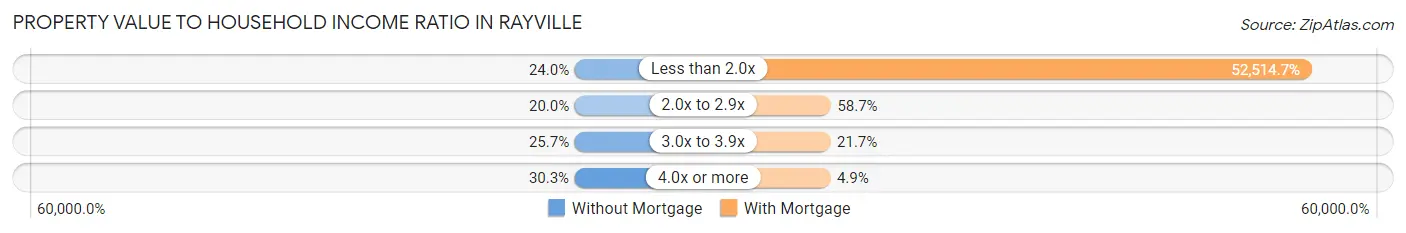
| Value-to-Income Ratio | Without Mortgage | With Mortgage |
| Less than 2.0x | 42 (24.0%) | 75,096 (52,514.7%) |
| 2.0x to 2.9x | 35 (20.0%) | 84 (58.7%) |
| 3.0x to 3.9x | 45 (25.7%) | 31 (21.7%) |
| 4.0x or more | 53 (30.3%) | 7 (4.9%) |
| Total | 175 (100.0%) | 143 (100.0%) |
Real Estate Taxes by Mortgage Status in Rayville
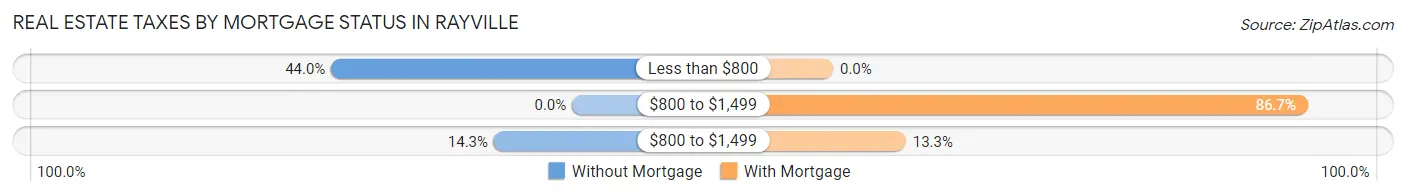
| Property Taxes | Without Mortgage | With Mortgage |
| Less than $800 | 77 (44.0%) | 0 (0.0%) |
| $800 to $1,499 | 0 (0.0%) | 124 (86.7%) |
| $800 to $1,499 | 25 (14.3%) | 19 (13.3%) |
| Total | 175 (100.0%) | 143 (100.0%) |
Health & Disability in Rayville
Health Insurance Coverage by Age in Rayville
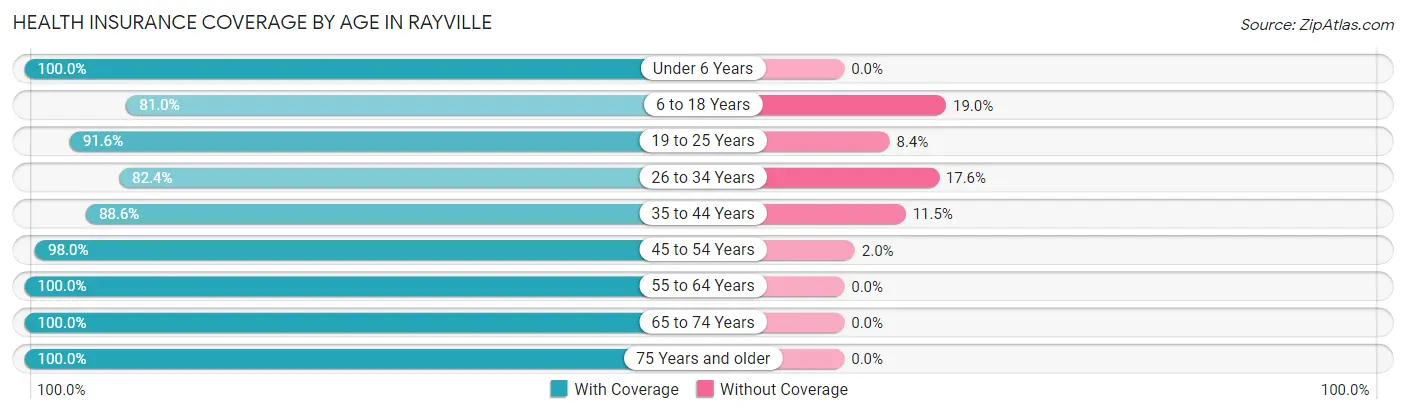
| Age Bracket | With Coverage | Without Coverage |
| Under 6 Years | 257 (100.0%) | 0 (0.0%) |
| 6 to 18 Years | 713 (81.0%) | 167 (19.0%) |
| 19 to 25 Years | 282 (91.6%) | 26 (8.4%) |
| 26 to 34 Years | 271 (82.4%) | 58 (17.6%) |
| 35 to 44 Years | 402 (88.5%) | 52 (11.5%) |
| 45 to 54 Years | 149 (98.0%) | 3 (2.0%) |
| 55 to 64 Years | 448 (100.0%) | 0 (0.0%) |
| 65 to 74 Years | 245 (100.0%) | 0 (0.0%) |
| 75 Years and older | 138 (100.0%) | 0 (0.0%) |
| Total | 2,905 (90.5%) | 306 (9.5%) |
Health Insurance Coverage by Citizenship Status in Rayville
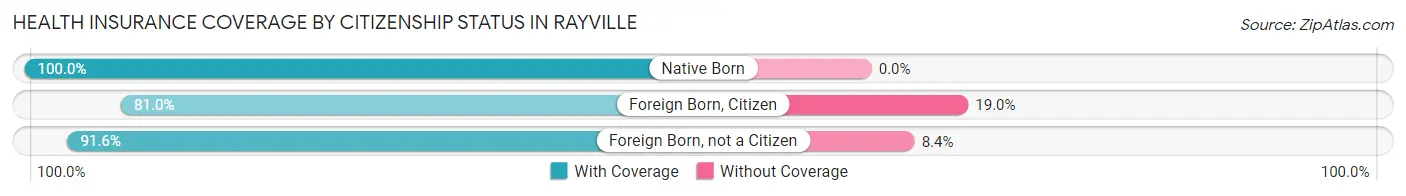
| Citizenship Status | With Coverage | Without Coverage |
| Native Born | 257 (100.0%) | 0 (0.0%) |
| Foreign Born, Citizen | 713 (81.0%) | 167 (19.0%) |
| Foreign Born, not a Citizen | 282 (91.6%) | 26 (8.4%) |
Health Insurance Coverage by Household Income in Rayville
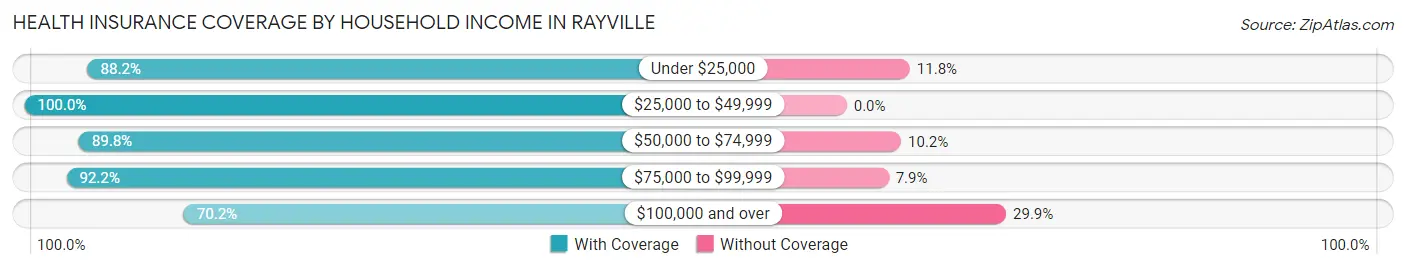
| Household Income | With Coverage | Without Coverage |
| Under $25,000 | 1,291 (88.2%) | 173 (11.8%) |
| $25,000 to $49,999 | 785 (100.0%) | 0 (0.0%) |
| $50,000 to $74,999 | 512 (89.8%) | 58 (10.2%) |
| $75,000 to $99,999 | 176 (92.1%) | 15 (7.9%) |
| $100,000 and over | 141 (70.2%) | 60 (29.8%) |
Public vs Private Health Insurance Coverage by Age in Rayville
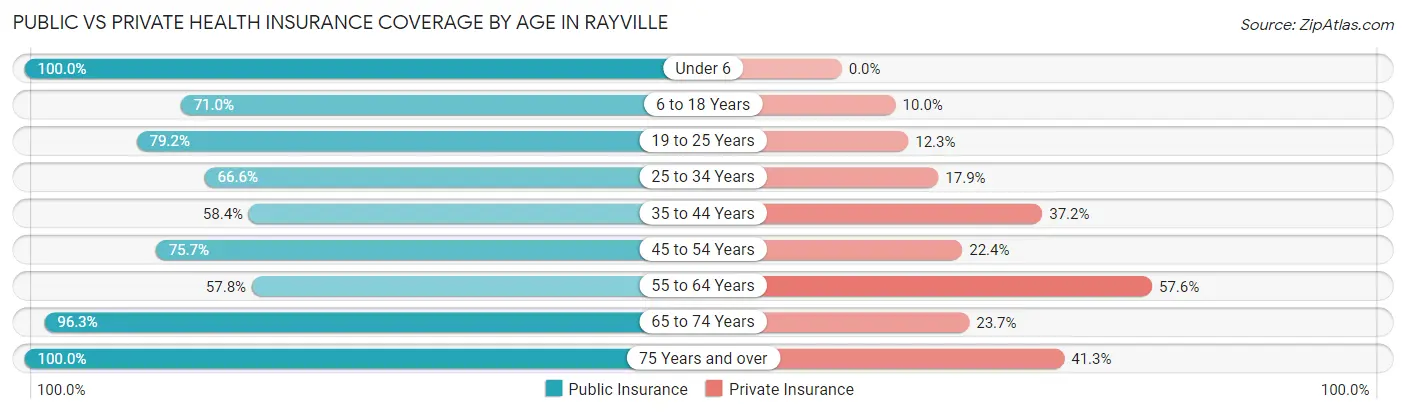
| Age Bracket | Public Insurance | Private Insurance |
| Under 6 | 257 (100.0%) | 0 (0.0%) |
| 6 to 18 Years | 625 (71.0%) | 88 (10.0%) |
| 19 to 25 Years | 244 (79.2%) | 38 (12.3%) |
| 25 to 34 Years | 219 (66.6%) | 59 (17.9%) |
| 35 to 44 Years | 265 (58.4%) | 169 (37.2%) |
| 45 to 54 Years | 115 (75.7%) | 34 (22.4%) |
| 55 to 64 Years | 259 (57.8%) | 258 (57.6%) |
| 65 to 74 Years | 236 (96.3%) | 58 (23.7%) |
| 75 Years and over | 138 (100.0%) | 57 (41.3%) |
| Total | 2,358 (73.4%) | 761 (23.7%) |
Disability Status by Sex by Age in Rayville
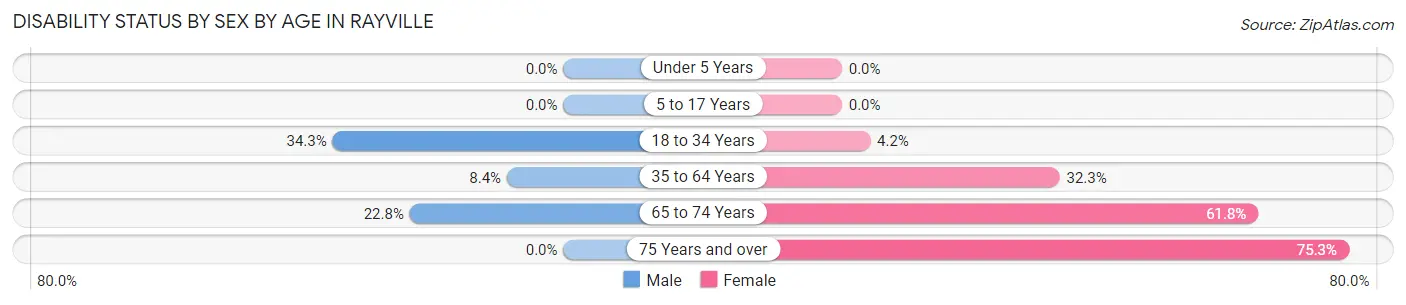
| Age Bracket | Male | Female |
| Under 5 Years | 0 (0.0%) | 0 (0.0%) |
| 5 to 17 Years | 0 (0.0%) | 0 (0.0%) |
| 18 to 34 Years | 98 (34.3%) | 16 (4.2%) |
| 35 to 64 Years | 30 (8.4%) | 225 (32.3%) |
| 65 to 74 Years | 26 (22.8%) | 81 (61.8%) |
| 75 Years and over | 0 (0.0%) | 64 (75.3%) |
Disability Class by Sex by Age in Rayville
Disability Class: Hearing Difficulty
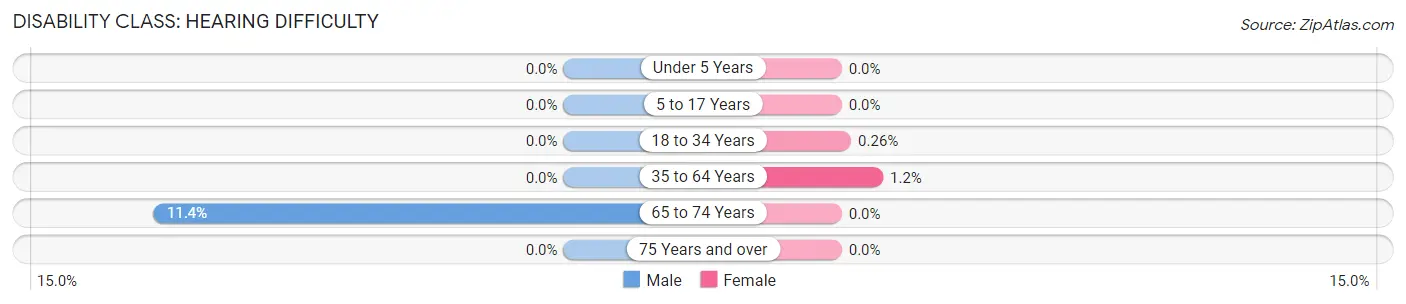
| Age Bracket | Male | Female |
| Under 5 Years | 0 (0.0%) | 0 (0.0%) |
| 5 to 17 Years | 0 (0.0%) | 0 (0.0%) |
| 18 to 34 Years | 0 (0.0%) | 1 (0.3%) |
| 35 to 64 Years | 0 (0.0%) | 8 (1.1%) |
| 65 to 74 Years | 13 (11.4%) | 0 (0.0%) |
| 75 Years and over | 0 (0.0%) | 0 (0.0%) |
Disability Class: Vision Difficulty
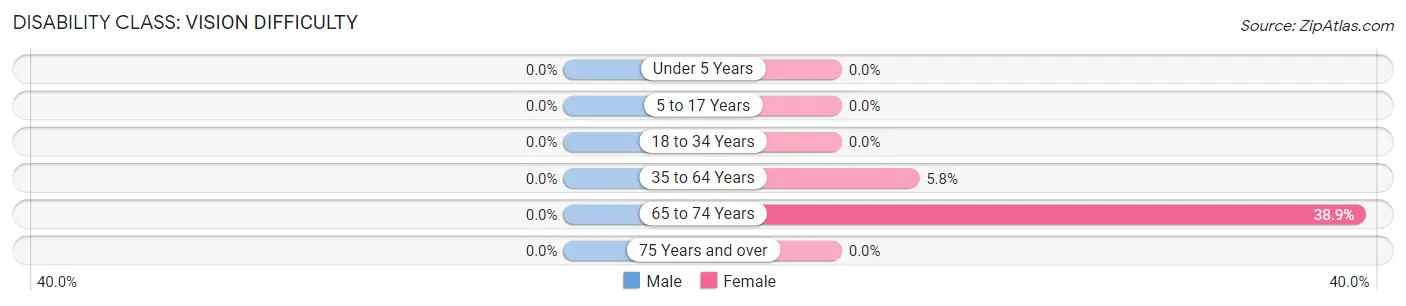
| Age Bracket | Male | Female |
| Under 5 Years | 0 (0.0%) | 0 (0.0%) |
| 5 to 17 Years | 0 (0.0%) | 0 (0.0%) |
| 18 to 34 Years | 0 (0.0%) | 0 (0.0%) |
| 35 to 64 Years | 0 (0.0%) | 40 (5.8%) |
| 65 to 74 Years | 0 (0.0%) | 51 (38.9%) |
| 75 Years and over | 0 (0.0%) | 0 (0.0%) |
Disability Class: Cognitive Difficulty
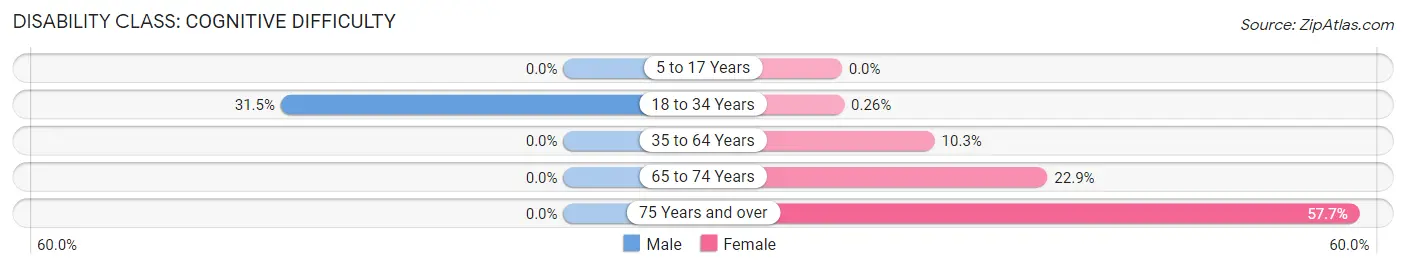
| Age Bracket | Male | Female |
| 5 to 17 Years | 0 (0.0%) | 0 (0.0%) |
| 18 to 34 Years | 90 (31.5%) | 1 (0.3%) |
| 35 to 64 Years | 0 (0.0%) | 72 (10.3%) |
| 65 to 74 Years | 0 (0.0%) | 30 (22.9%) |
| 75 Years and over | 0 (0.0%) | 49 (57.7%) |
Disability Class: Ambulatory Difficulty
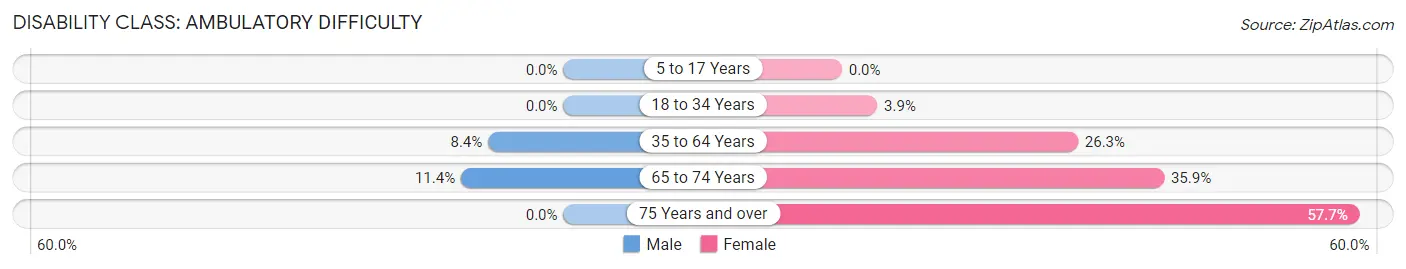
| Age Bracket | Male | Female |
| 5 to 17 Years | 0 (0.0%) | 0 (0.0%) |
| 18 to 34 Years | 0 (0.0%) | 15 (3.9%) |
| 35 to 64 Years | 30 (8.4%) | 183 (26.3%) |
| 65 to 74 Years | 13 (11.4%) | 47 (35.9%) |
| 75 Years and over | 0 (0.0%) | 49 (57.7%) |
Disability Class: Self-Care Difficulty
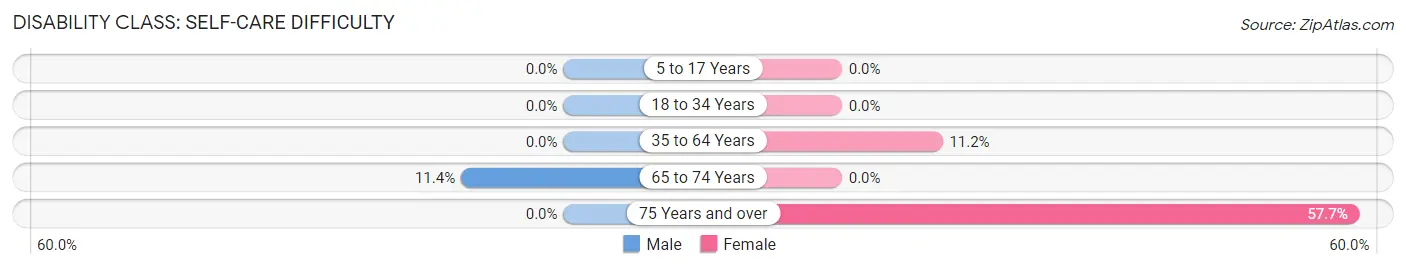
| Age Bracket | Male | Female |
| 5 to 17 Years | 0 (0.0%) | 0 (0.0%) |
| 18 to 34 Years | 0 (0.0%) | 0 (0.0%) |
| 35 to 64 Years | 0 (0.0%) | 78 (11.2%) |
| 65 to 74 Years | 13 (11.4%) | 0 (0.0%) |
| 75 Years and over | 0 (0.0%) | 49 (57.7%) |
Technology Access in Rayville
Computing Device Access in Rayville
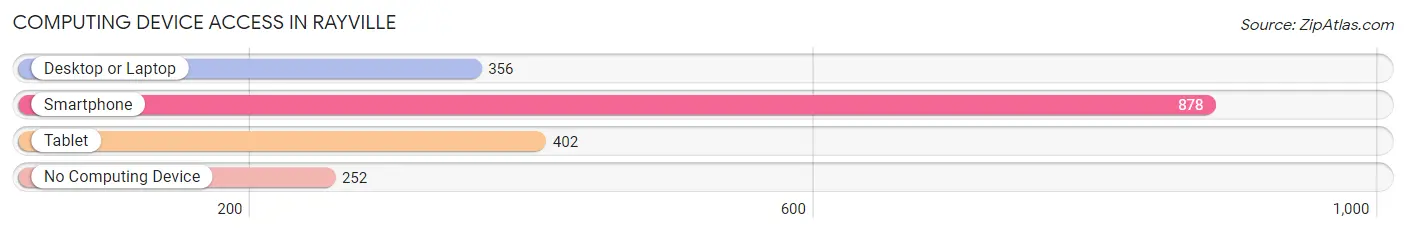
| Device Type | # Households | % Households |
| Desktop or Laptop | 356 | 31.1% |
| Smartphone | 878 | 76.7% |
| Tablet | 402 | 35.1% |
| No Computing Device | 252 | 22.0% |
| Total | 1,145 | 100.0% |
Internet Access in Rayville
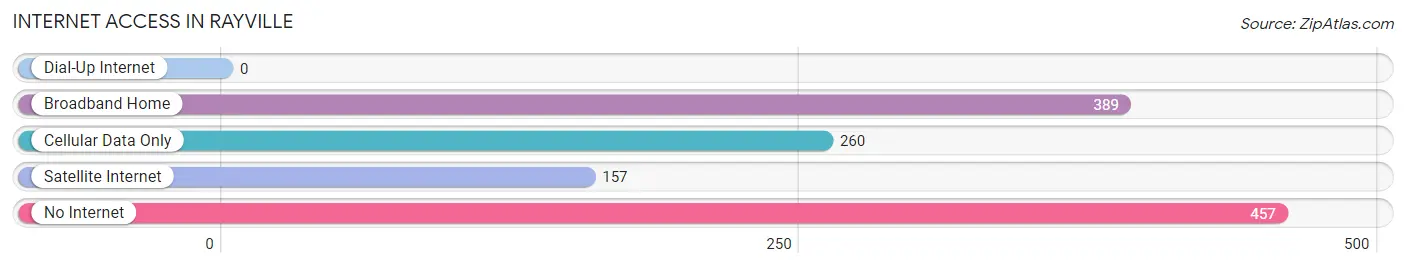
| Internet Type | # Households | % Households |
| Dial-Up Internet | 0 | 0.0% |
| Broadband Home | 389 | 34.0% |
| Cellular Data Only | 260 | 22.7% |
| Satellite Internet | 157 | 13.7% |
| No Internet | 457 | 39.9% |
| Total | 1,145 | 100.0% |
Rayville Summary
Rayville, Louisiana is a small town located in Richland Parish in the northeastern part of the state. It is situated on the banks of the Ouachita River, about 25 miles south of Monroe. The town was founded in 1883 and has a population of approximately 4,000 people.
Rayville is a rural community with a rich history and culture. The town was originally settled by Native Americans, and later by French and Spanish settlers. The town was named after a local landowner, William Ray, who donated the land for the town. The town was incorporated in 1883 and has remained a small, rural community ever since.
Geographically, Rayville is located in the northern part of Richland Parish, which is in the northeastern part of the state. The town is situated on the banks of the Ouachita River, about 25 miles south of Monroe. The town is surrounded by agricultural land, with cotton, soybeans, and corn being the main crops. The town is also home to several small businesses, including a grocery store, a hardware store, and a few restaurants.
The economy of Rayville is largely based on agriculture. The town is home to several large farms, which produce cotton, soybeans, and corn. The town also has a few small businesses, including a grocery store, a hardware store, and a few restaurants. The town is also home to a few manufacturing plants, which produce furniture, clothing, and other goods.
The demographics of Rayville are largely made up of white, African American, and Hispanic residents. The town has a median household income of $30,000, and the poverty rate is around 20%. The town is served by the Richland Parish School District, which provides education to students from kindergarten through 12th grade.
Rayville is a small, rural town with a rich history and culture. The town is home to several large farms, which produce cotton, soybeans, and corn. The town also has a few small businesses, including a grocery store, a hardware store, and a few restaurants. The town is also home to a few manufacturing plants, which produce furniture, clothing, and other goods. The town has a median household income of $30,000, and the poverty rate is around 20%. The town is served by the Richland Parish School District, which provides education to students from kindergarten through 12th grade.
Common Questions
What is Per Capita Income in Rayville?
Per Capita income in Rayville is $12,802.
What is the Median Family Income in Rayville?
Median Family Income in Rayville is $23,202.
What is the Median Household income in Rayville?
Median Household Income in Rayville is $23,292.
What is Family Income Deficit in Rayville?
Family Income Deficit in Rayville is $18,614.
Families that are below poverty line in Rayville earn $18,614 less on average than the poverty threshold level.
What is Inequality or Gini Index in Rayville?
Inequality or Gini Index in Rayville is 0.53.
What is the Total Population of Rayville?
Total Population of Rayville is 3,343.
What is the Total Male Population of Rayville?
Total Male Population of Rayville is 1,437.
What is the Total Female Population of Rayville?
Total Female Population of Rayville is 1,906.
What is the Ratio of Males per 100 Females in Rayville?
There are 75.39 Males per 100 Females in Rayville.
What is the Ratio of Females per 100 Males in Rayville?
There are 132.64 Females per 100 Males in Rayville.
What is the Median Population Age in Rayville?
Median Population Age in Rayville is 31.3 Years.
What is the Average Family Size in Rayville
Average Family Size in Rayville is 3.4 People.
What is the Average Household Size in Rayville
Average Household Size in Rayville is 2.8 People.
How Large is the Labor Force in Rayville?
There are 1,078 People in the Labor Forcein in Rayville.
What is the Percentage of People in the Labor Force in Rayville?
45.8% of People are in the Labor Force in Rayville.
What is the Unemployment Rate in Rayville?
Unemployment Rate in Rayville is 12.5%.