Port Allen, LA Map & Demographics
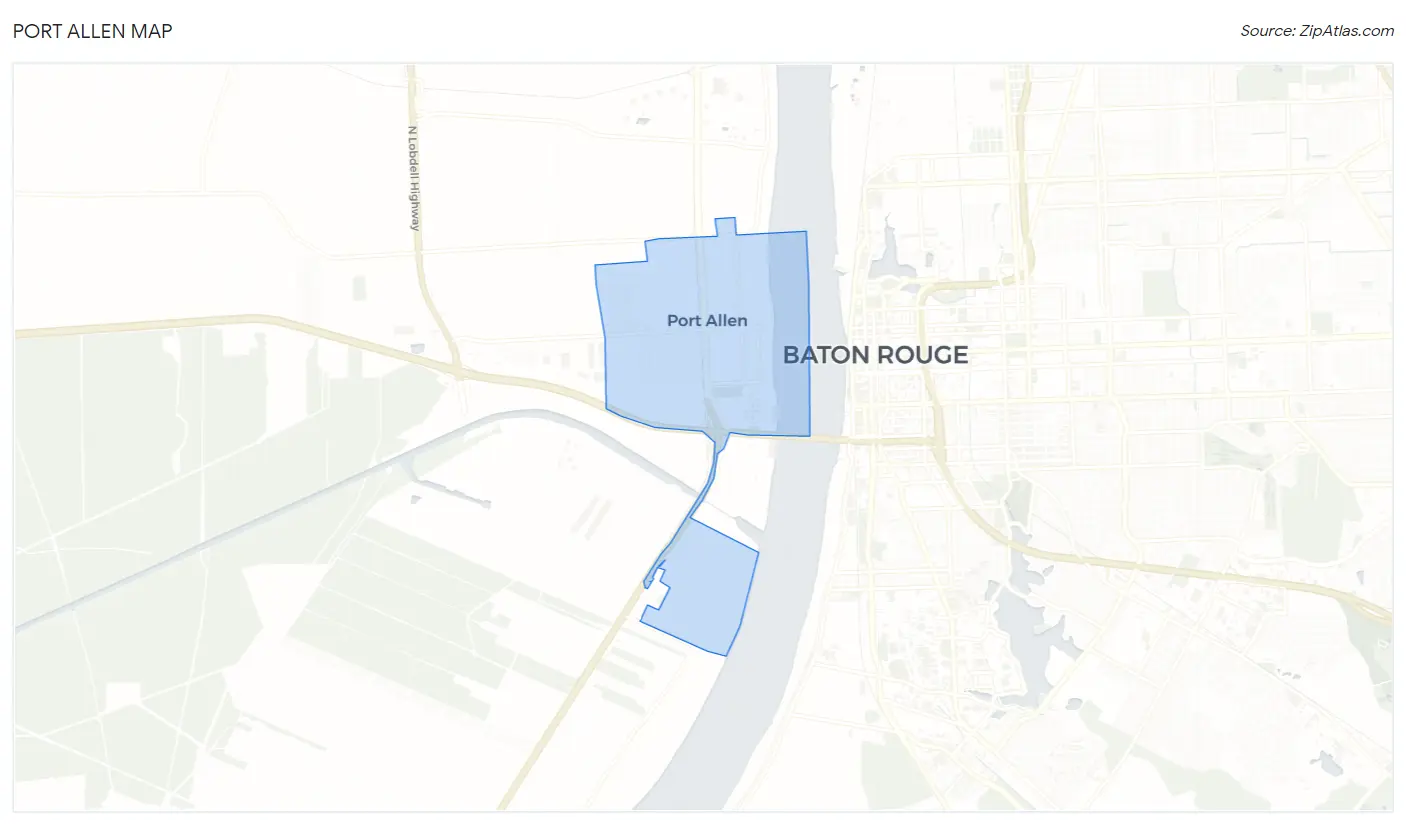
Port Allen Map
Port Allen Overview
$27,621
PER CAPITA INCOME
$57,409
AVG FAMILY INCOME
$53,706
AVG HOUSEHOLD INCOME
13.9%
WAGE / INCOME GAP [ % ]
86.1¢/ $1
WAGE / INCOME GAP [ $ ]
0.44
INEQUALITY / GINI INDEX
4,956
TOTAL POPULATION
2,060
MALE POPULATION
2,896
FEMALE POPULATION
71.13
MALES / 100 FEMALES
140.58
FEMALES / 100 MALES
44.9
MEDIAN AGE
2.9
AVG FAMILY SIZE
2.2
AVG HOUSEHOLD SIZE
2,462
LABOR FORCE [ PEOPLE ]
58.8%
PERCENT IN LABOR FORCE
8.5%
UNEMPLOYMENT RATE
Port Allen Zip Codes
Port Allen Area Codes
Income in Port Allen
Income Overview in Port Allen
Per Capita Income in Port Allen is $27,621, while median incomes of families and households are $57,409 and $53,706 respectively.
| Characteristic | Number | Measure |
| Per Capita Income | 4,956 | $27,621 |
| Median Family Income | 1,288 | $57,409 |
| Mean Family Income | 1,288 | $72,373 |
| Median Household Income | 2,183 | $53,706 |
| Mean Household Income | 2,183 | $61,663 |
| Income Deficit | 1,288 | $0 |
| Wage / Income Gap (%) | 4,956 | 13.92% |
| Wage / Income Gap ($) | 4,956 | 86.08¢ per $1 |
| Gini / Inequality Index | 4,956 | 0.44 |
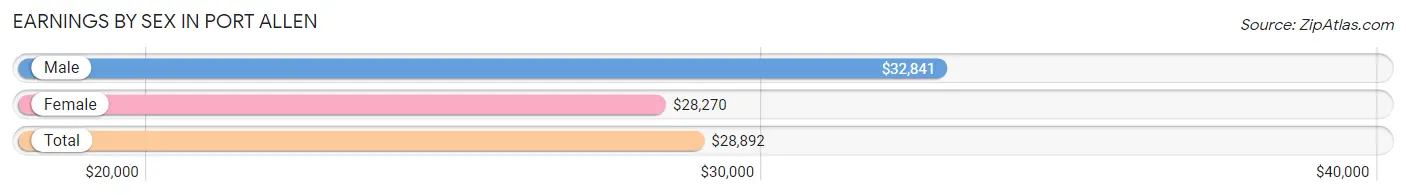
Earnings by Sex in Port Allen
Average Earnings in Port Allen are $28,892, $32,841 for men and $28,270 for women, a difference of 13.9%.
| Sex | Number | Average Earnings |
| Male | 1,157 (47.8%) | $32,841 |
| Female | 1,265 (52.2%) | $28,270 |
| Total | 2,422 (100.0%) | $28,892 |
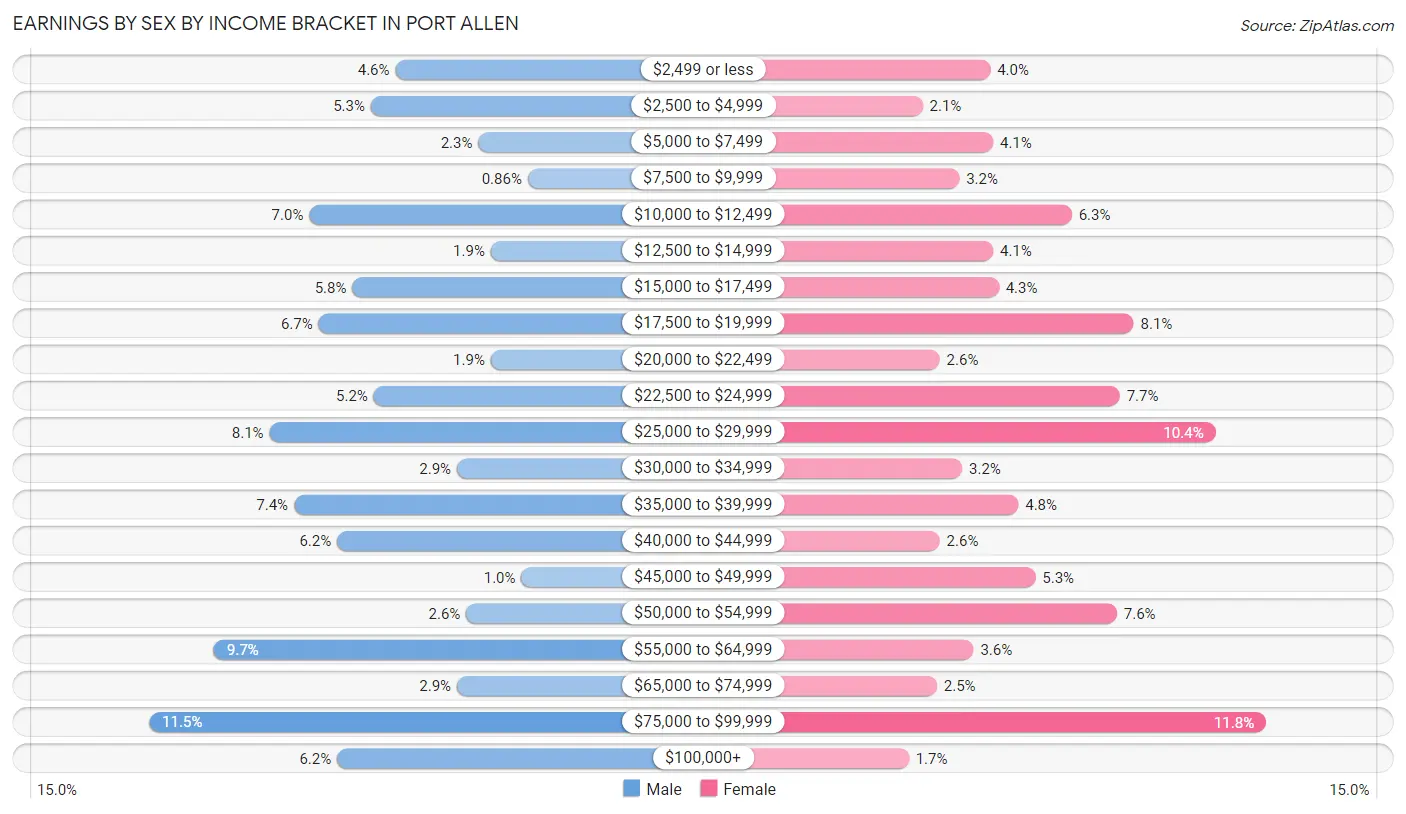
Earnings by Sex by Income Bracket in Port Allen
The most common earnings brackets in Port Allen are $75,000 to $99,999 for men (133 | 11.5%) and $75,000 to $99,999 for women (149 | 11.8%).
| Income | Male | Female |
| $2,499 or less | 53 (4.6%) | 51 (4.0%) |
| $2,500 to $4,999 | 61 (5.3%) | 27 (2.1%) |
| $5,000 to $7,499 | 26 (2.2%) | 52 (4.1%) |
| $7,500 to $9,999 | 10 (0.9%) | 40 (3.2%) |
| $10,000 to $12,499 | 81 (7.0%) | 80 (6.3%) |
| $12,500 to $14,999 | 22 (1.9%) | 52 (4.1%) |
| $15,000 to $17,499 | 67 (5.8%) | 54 (4.3%) |
| $17,500 to $19,999 | 78 (6.7%) | 102 (8.1%) |
| $20,000 to $22,499 | 22 (1.9%) | 33 (2.6%) |
| $22,500 to $24,999 | 60 (5.2%) | 97 (7.7%) |
| $25,000 to $29,999 | 94 (8.1%) | 131 (10.4%) |
| $30,000 to $34,999 | 33 (2.9%) | 41 (3.2%) |
| $35,000 to $39,999 | 86 (7.4%) | 61 (4.8%) |
| $40,000 to $44,999 | 72 (6.2%) | 33 (2.6%) |
| $45,000 to $49,999 | 12 (1.0%) | 67 (5.3%) |
| $50,000 to $54,999 | 30 (2.6%) | 96 (7.6%) |
| $55,000 to $64,999 | 112 (9.7%) | 45 (3.6%) |
| $65,000 to $74,999 | 33 (2.9%) | 32 (2.5%) |
| $75,000 to $99,999 | 133 (11.5%) | 149 (11.8%) |
| $100,000+ | 72 (6.2%) | 22 (1.7%) |
| Total | 1,157 (100.0%) | 1,265 (100.0%) |
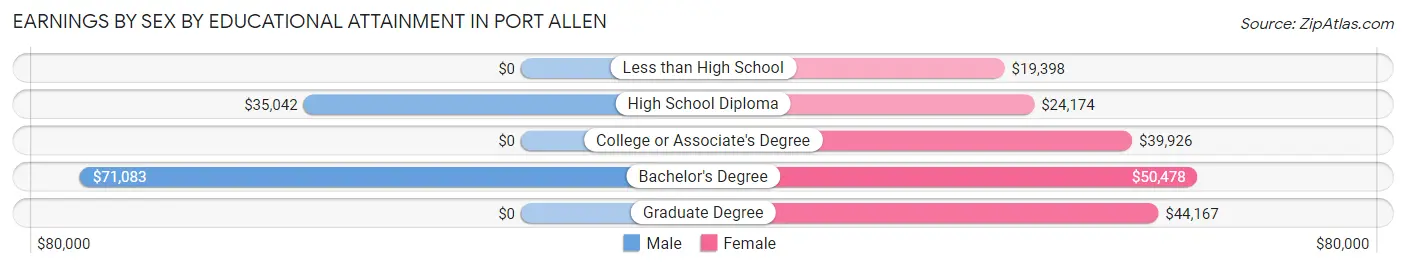
Earnings by Sex by Educational Attainment in Port Allen
Average earnings in Port Allen are $37,149 for men and $30,288 for women, a difference of 18.5%. Men with an educational attainment of bachelor's degree enjoy the highest average annual earnings of $71,083, while those with high school diploma education earn the least with $35,042. Women with an educational attainment of bachelor's degree earn the most with the average annual earnings of $50,478, while those with less than high school education have the smallest earnings of $19,398.
| Educational Attainment | Male Income | Female Income |
| Less than High School | - | - |
| High School Diploma | $35,042 | $24,174 |
| College or Associate's Degree | - | - |
| Bachelor's Degree | $71,083 | $50,478 |
| Graduate Degree | - | - |
| Total | $37,149 | $30,288 |
Family Income in Port Allen
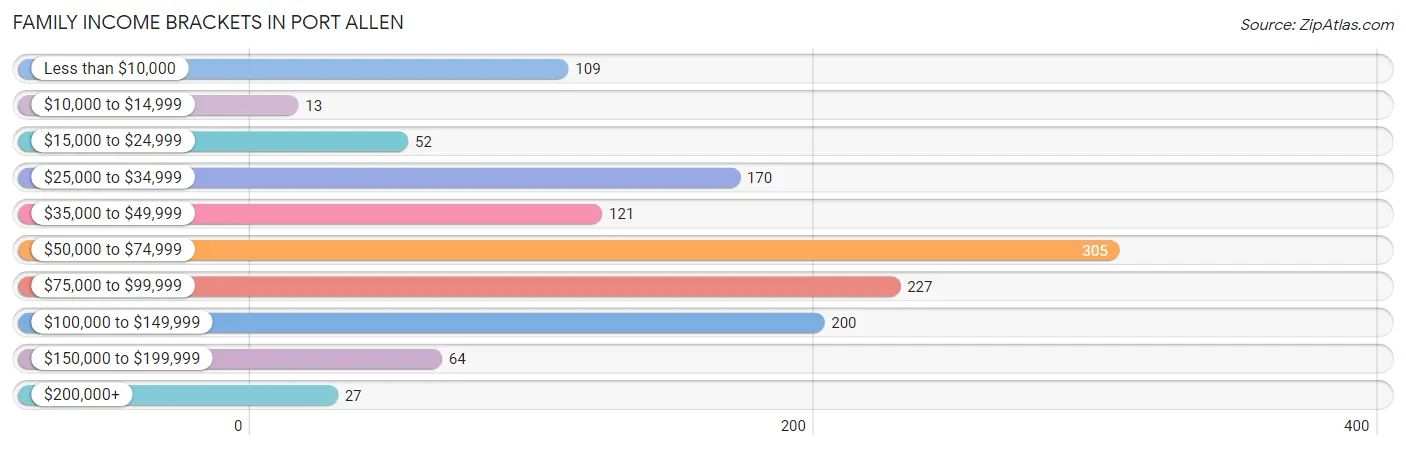
Family Income Brackets in Port Allen
According to the Port Allen family income data, there are 305 families falling into the $50,000 to $74,999 income range, which is the most common income bracket and makes up 23.7% of all families. Conversely, the $10,000 to $14,999 income bracket is the least frequent group with only 13 families (1.0%) belonging to this category.
| Income Bracket | # Families | % Families |
| Less than $10,000 | 109 | 8.5% |
| $10,000 to $14,999 | 13 | 1.0% |
| $15,000 to $24,999 | 52 | 4.0% |
| $25,000 to $34,999 | 170 | 13.2% |
| $35,000 to $49,999 | 121 | 9.4% |
| $50,000 to $74,999 | 305 | 23.7% |
| $75,000 to $99,999 | 227 | 17.6% |
| $100,000 to $149,999 | 200 | 15.5% |
| $150,000 to $199,999 | 64 | 5.0% |
| $200,000+ | 27 | 2.1% |
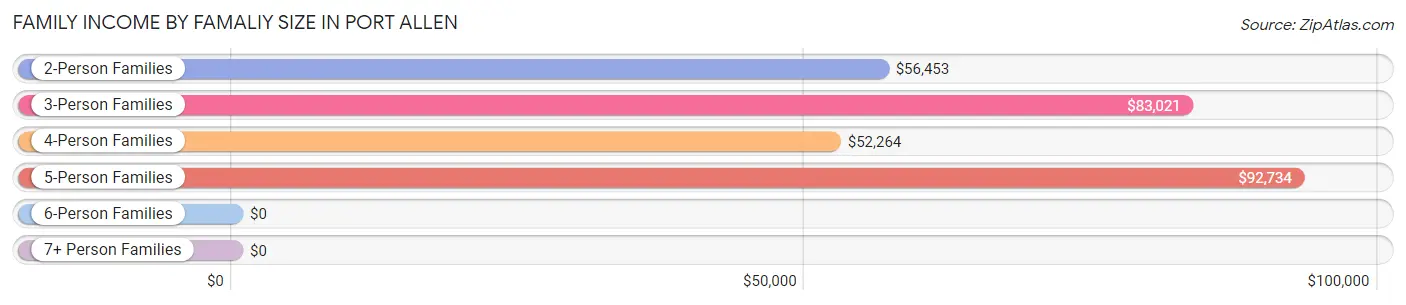
Family Income by Famaliy Size in Port Allen
5-person families (53 | 4.1%) account for the highest median family income in Port Allen with $92,734 per family, while 2-person families (721 | 56.0%) have the highest median income of $28,226 per family member.
| Income Bracket | # Families | Median Income |
| 2-Person Families | 721 (56.0%) | $56,453 |
| 3-Person Families | 339 (26.3%) | $83,021 |
| 4-Person Families | 155 (12.0%) | $52,264 |
| 5-Person Families | 53 (4.1%) | $92,734 |
| 6-Person Families | 0 (0.0%) | $0 |
| 7+ Person Families | 20 (1.5%) | $0 |
| Total | 1,288 (100.0%) | $57,409 |
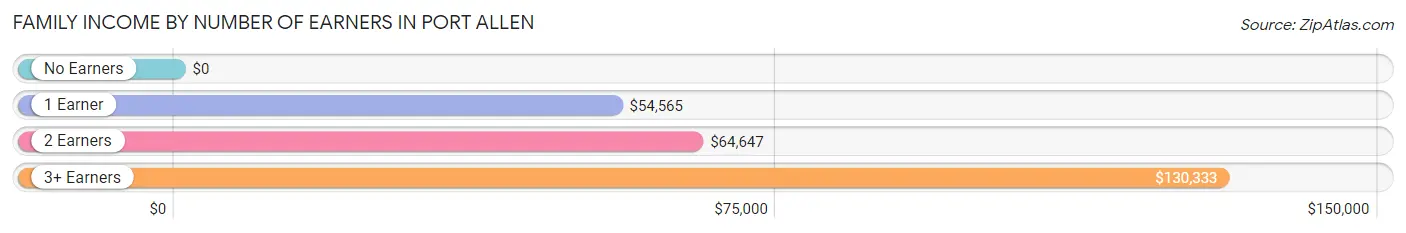
Family Income by Number of Earners in Port Allen
| Number of Earners | # Families | Median Income |
| No Earners | 307 (23.8%) | $0 |
| 1 Earner | 418 (32.5%) | $54,565 |
| 2 Earners | 471 (36.6%) | $64,647 |
| 3+ Earners | 92 (7.1%) | $130,333 |
| Total | 1,288 (100.0%) | $57,409 |
Household Income in Port Allen
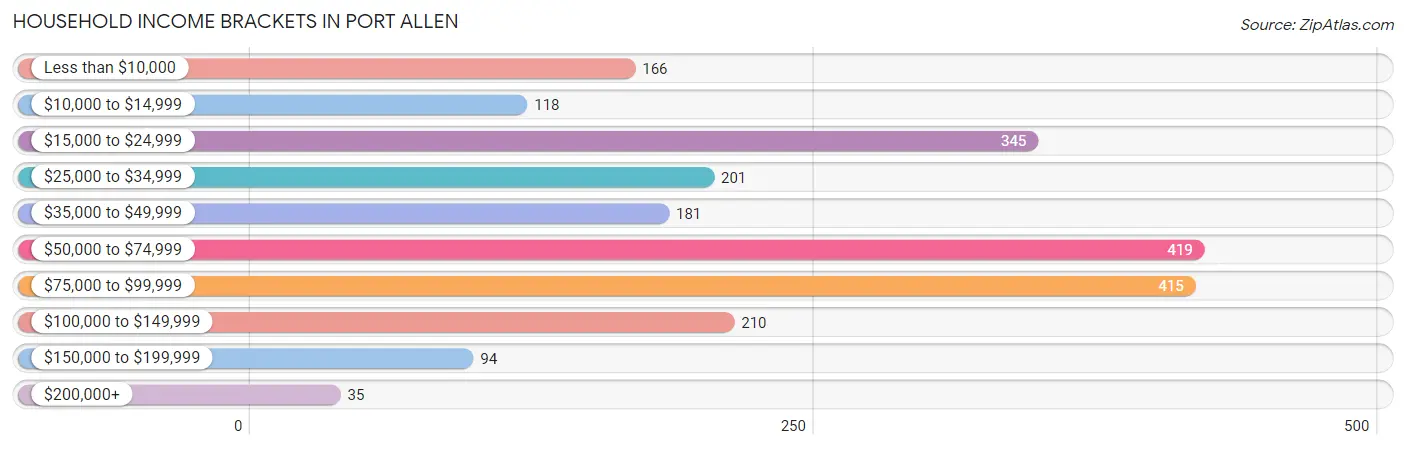
Household Income Brackets in Port Allen
With 419 households falling in the category, the $50,000 to $74,999 income range is the most frequent in Port Allen, accounting for 19.2% of all households. In contrast, only 35 households (1.6%) fall into the $200,000+ income bracket, making it the least populous group.
| Income Bracket | # Households | % Households |
| Less than $10,000 | 166 | 7.6% |
| $10,000 to $14,999 | 118 | 5.4% |
| $15,000 to $24,999 | 345 | 15.8% |
| $25,000 to $34,999 | 201 | 9.2% |
| $35,000 to $49,999 | 181 | 8.3% |
| $50,000 to $74,999 | 419 | 19.2% |
| $75,000 to $99,999 | 415 | 19.0% |
| $100,000 to $149,999 | 210 | 9.6% |
| $150,000 to $199,999 | 94 | 4.3% |
| $200,000+ | 35 | 1.6% |
Household Income by Householder Age in Port Allen
The median household income in Port Allen is $53,706, with the highest median household income of $66,818 found in the 45 to 64 years age bracket for the primary householder. A total of 782 households (35.8%) fall into this category. Meanwhile, the 15 to 24 years age bracket for the primary householder has the lowest median household income of $0, with 35 households (1.6%) in this group.
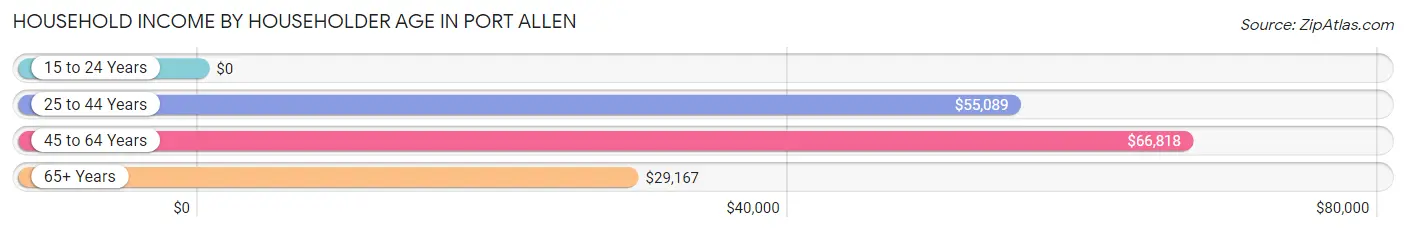
| Income Bracket | # Households | Median Income |
| 15 to 24 Years | 35 (1.6%) | $0 |
| 25 to 44 Years | 638 (29.2%) | $55,089 |
| 45 to 64 Years | 782 (35.8%) | $66,818 |
| 65+ Years | 728 (33.4%) | $29,167 |
| Total | 2,183 (100.0%) | $53,706 |
Poverty in Port Allen
Income Below Poverty by Sex and Age in Port Allen
With 9.9% poverty level for males and 18.5% for females among the residents of Port Allen, 25 to 34 year old males and under 5 year old females are the most vulnerable to poverty, with 80 males (30.6%) and 83 females (44.6%) in their respective age groups living below the poverty level.
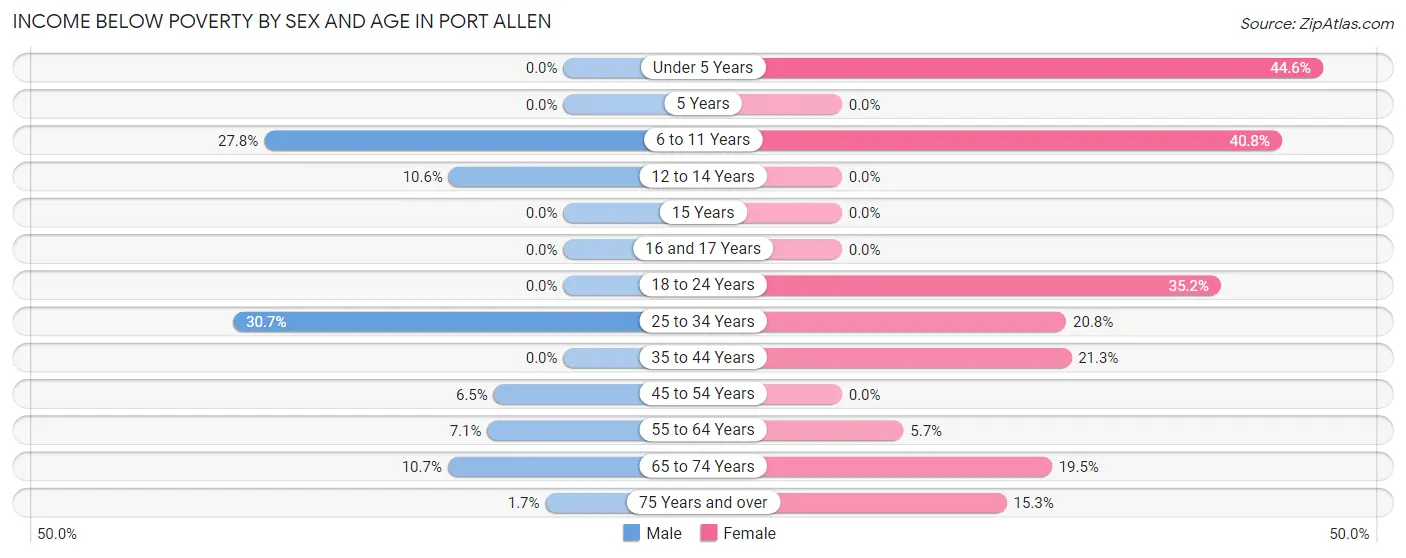
| Age Bracket | Male | Female |
| Under 5 Years | 0 (0.0%) | 83 (44.6%) |
| 5 Years | 0 (0.0%) | 0 (0.0%) |
| 6 to 11 Years | 55 (27.8%) | 89 (40.8%) |
| 12 to 14 Years | 5 (10.6%) | 0 (0.0%) |
| 15 Years | 0 (0.0%) | 0 (0.0%) |
| 16 and 17 Years | 0 (0.0%) | 0 (0.0%) |
| 18 to 24 Years | 0 (0.0%) | 51 (35.2%) |
| 25 to 34 Years | 80 (30.6%) | 51 (20.8%) |
| 35 to 44 Years | 0 (0.0%) | 106 (21.3%) |
| 45 to 54 Years | 22 (6.5%) | 0 (0.0%) |
| 55 to 64 Years | 18 (7.1%) | 19 (5.7%) |
| 65 to 74 Years | 19 (10.7%) | 75 (19.5%) |
| 75 Years and over | 4 (1.7%) | 61 (15.3%) |
| Total | 203 (9.9%) | 535 (18.5%) |
Income Above Poverty by Sex and Age in Port Allen
According to the poverty statistics in Port Allen, males aged under 5 years and females aged 12 to 14 years are the age groups that are most secure financially, with 100.0% of males and 100.0% of females in these age groups living above the poverty line.
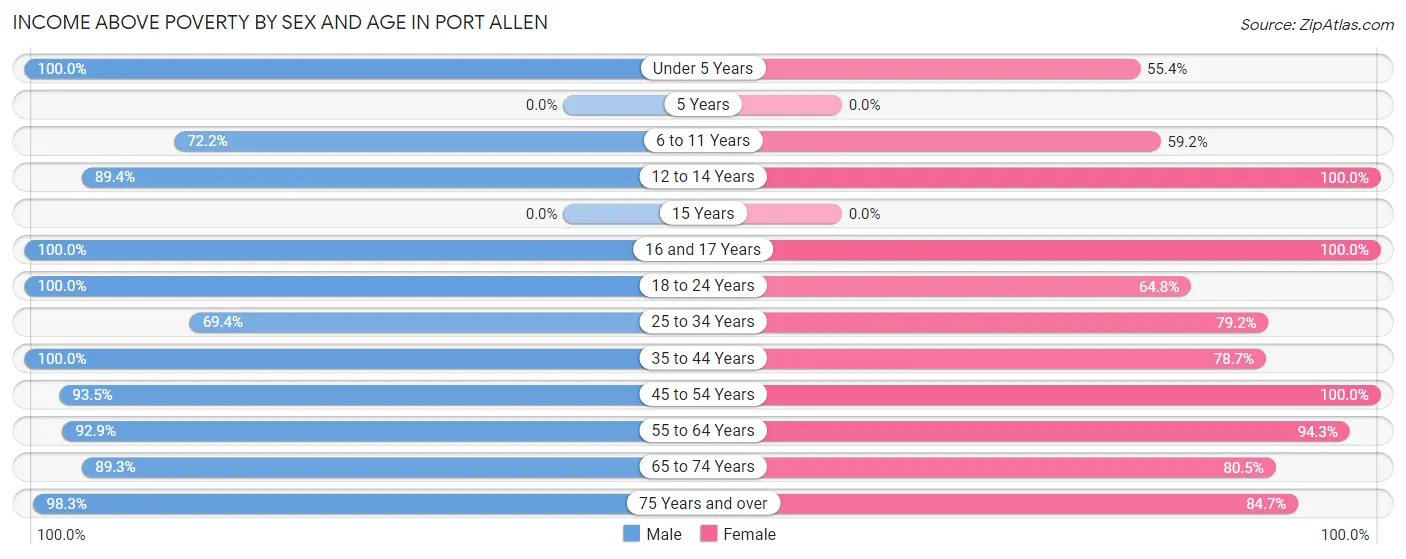
| Age Bracket | Male | Female |
| Under 5 Years | 17 (100.0%) | 103 (55.4%) |
| 5 Years | 0 (0.0%) | 0 (0.0%) |
| 6 to 11 Years | 143 (72.2%) | 129 (59.2%) |
| 12 to 14 Years | 42 (89.4%) | 92 (100.0%) |
| 15 Years | 0 (0.0%) | 0 (0.0%) |
| 16 and 17 Years | 62 (100.0%) | 50 (100.0%) |
| 18 to 24 Years | 105 (100.0%) | 94 (64.8%) |
| 25 to 34 Years | 181 (69.4%) | 194 (79.2%) |
| 35 to 44 Years | 347 (100.0%) | 392 (78.7%) |
| 45 to 54 Years | 318 (93.5%) | 345 (100.0%) |
| 55 to 64 Years | 237 (92.9%) | 314 (94.3%) |
| 65 to 74 Years | 158 (89.3%) | 310 (80.5%) |
| 75 Years and over | 236 (98.3%) | 338 (84.7%) |
| Total | 1,846 (90.1%) | 2,361 (81.5%) |
Income Below Poverty Among Married-Couple Families in Port Allen
The poverty statistics for married-couple families in Port Allen show that 5.8% or 44 of the total 756 families live below the poverty line. Families with 1 or 2 children have the highest poverty rate of 19.3%, comprising of 44 families. On the other hand, families with no children have the lowest poverty rate of 0.0%, which includes 0 families.
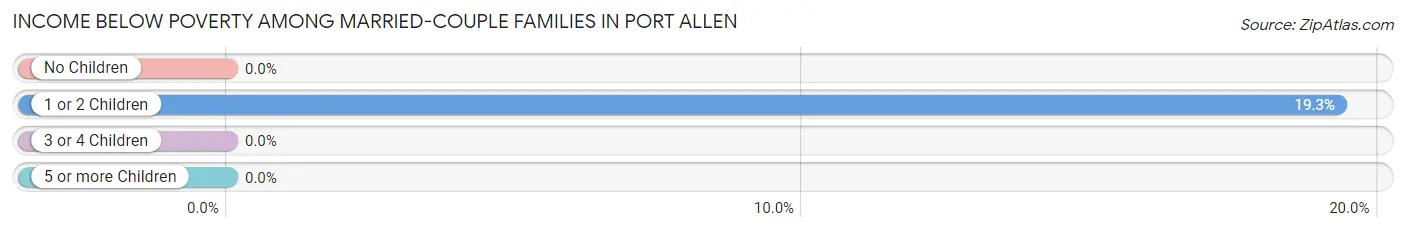
| Children | Above Poverty | Below Poverty |
| No Children | 496 (100.0%) | 0 (0.0%) |
| 1 or 2 Children | 184 (80.7%) | 44 (19.3%) |
| 3 or 4 Children | 25 (100.0%) | 0 (0.0%) |
| 5 or more Children | 7 (100.0%) | 0 (0.0%) |
| Total | 712 (94.2%) | 44 (5.8%) |
Income Below Poverty Among Single-Parent Households in Port Allen
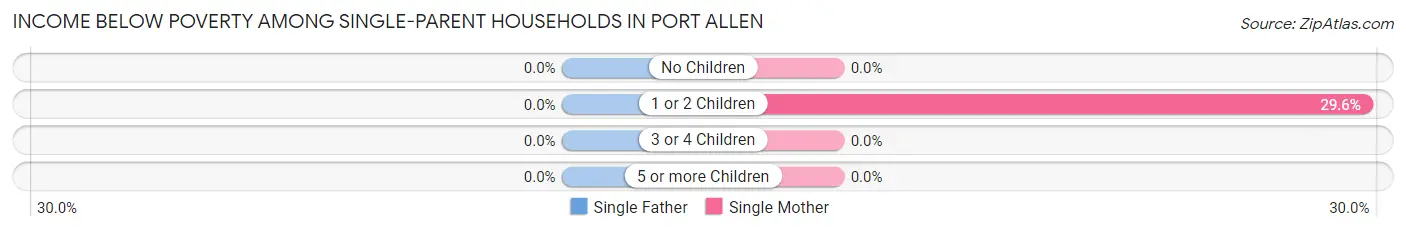
| Children | Single Father | Single Mother |
| No Children | 0 (0.0%) | 0 (0.0%) |
| 1 or 2 Children | 0 (0.0%) | 78 (29.5%) |
| 3 or 4 Children | 0 (0.0%) | 0 (0.0%) |
| 5 or more Children | 0 (0.0%) | 0 (0.0%) |
| Total | 0 (0.0%) | 78 (20.0%) |
Income Below Poverty Among Married-Couple vs Single-Parent Households in Port Allen
The poverty data for Port Allen shows that 44 of the married-couple family households (5.8%) and 78 of the single-parent households (14.7%) are living below the poverty level. Within the married-couple family households, those with 1 or 2 children have the highest poverty rate, with 44 households (19.3%) falling below the poverty line. Among the single-parent households, those with 1 or 2 children have the highest poverty rate, with 78 household (26.2%) living below poverty.
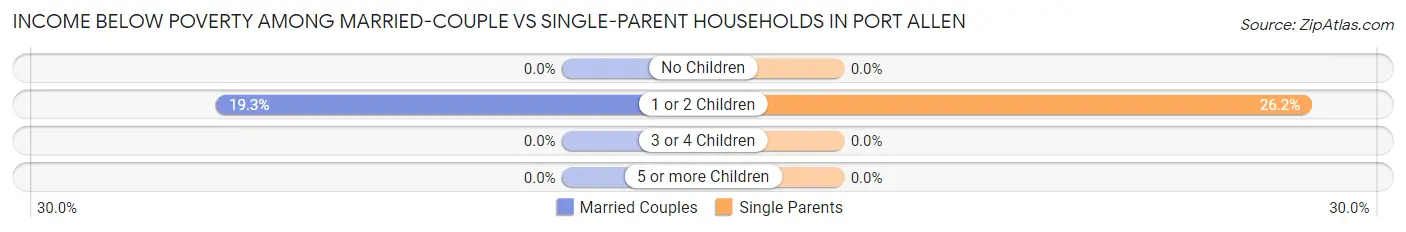
| Children | Married-Couple Families | Single-Parent Households |
| No Children | 0 (0.0%) | 0 (0.0%) |
| 1 or 2 Children | 44 (19.3%) | 78 (26.2%) |
| 3 or 4 Children | 0 (0.0%) | 0 (0.0%) |
| 5 or more Children | 0 (0.0%) | 0 (0.0%) |
| Total | 44 (5.8%) | 78 (14.7%) |
Race in Port Allen
The most populous races in Port Allen are Black / African American (2,601 | 52.5%), White / Caucasian (2,251 | 45.4%), and Asian (82 | 1.7%).
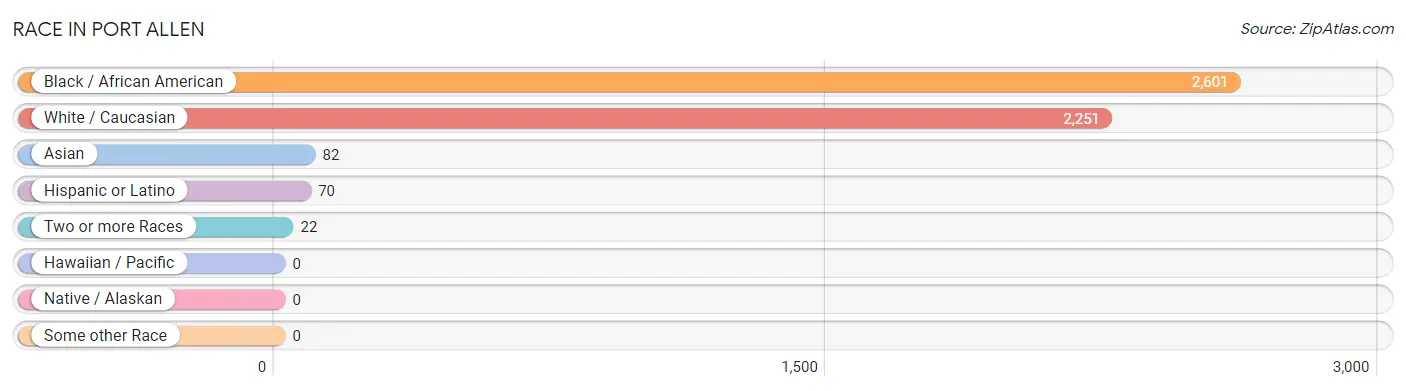
| Race | # Population | % Population |
| Asian | 82 | 1.7% |
| Black / African American | 2,601 | 52.5% |
| Hawaiian / Pacific | 0 | 0.0% |
| Hispanic or Latino | 70 | 1.4% |
| Native / Alaskan | 0 | 0.0% |
| White / Caucasian | 2,251 | 45.4% |
| Two or more Races | 22 | 0.4% |
| Some other Race | 0 | 0.0% |
| Total | 4,956 | 100.0% |
Ancestry in Port Allen
The most populous ancestries reported in Port Allen are French (1,006 | 20.3%), American (270 | 5.4%), Italian (218 | 4.4%), Irish (216 | 4.4%), and German (160 | 3.2%), together accounting for 37.7% of all Port Allen residents.
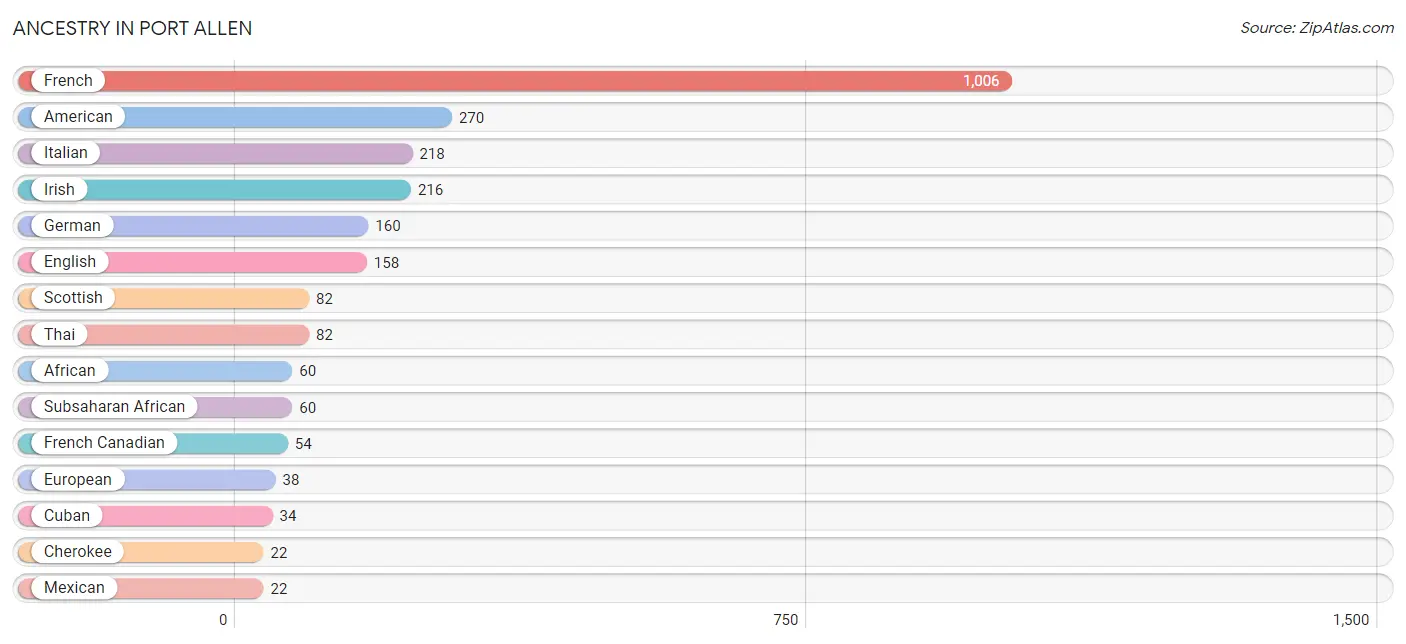
| Ancestry | # Population | % Population |
| African | 60 | 1.2% |
| American | 270 | 5.4% |
| Arab | 9 | 0.2% |
| Austrian | 10 | 0.2% |
| Cajun | 18 | 0.4% |
| Canadian | 11 | 0.2% |
| Cherokee | 22 | 0.4% |
| Cuban | 34 | 0.7% |
| Danish | 12 | 0.2% |
| Dominican | 14 | 0.3% |
| Dutch | 10 | 0.2% |
| English | 158 | 3.2% |
| European | 38 | 0.8% |
| French | 1,006 | 20.3% |
| French Canadian | 54 | 1.1% |
| German | 160 | 3.2% |
| Greek | 8 | 0.2% |
| Irish | 216 | 4.4% |
| Italian | 218 | 4.4% |
| Lebanese | 9 | 0.2% |
| Mexican | 22 | 0.4% |
| Navajo | 22 | 0.4% |
| Scotch-Irish | 10 | 0.2% |
| Scottish | 82 | 1.7% |
| Subsaharan African | 60 | 1.2% |
| Thai | 82 | 1.7% | View All 26 Rows |
Immigrants in Port Allen
The most numerous immigrant groups reported in Port Allen came from Asia (82 | 1.7%), India (82 | 1.7%), and South Central Asia (82 | 1.7%), together accounting for 5.0% of all Port Allen residents.
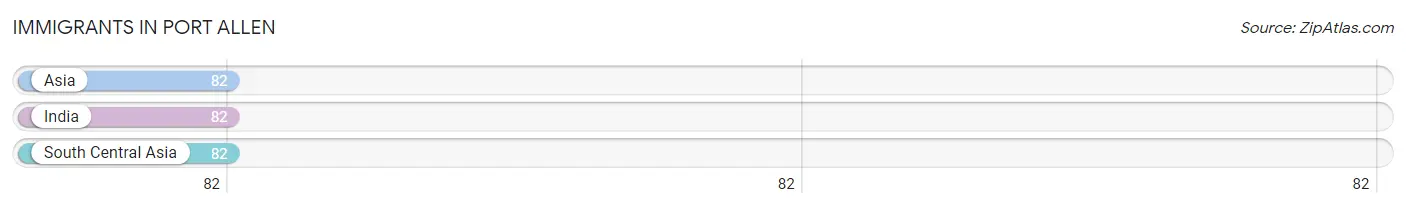
| Immigration Origin | # Population | % Population |
| Asia | 82 | 1.7% |
| India | 82 | 1.7% |
| South Central Asia | 82 | 1.7% | View All 3 Rows |
Sex and Age in Port Allen
Sex and Age in Port Allen
The most populous age groups in Port Allen are 50 to 54 Years (210 | 10.2%) for men and 35 to 39 Years (316 | 10.9%) for women.
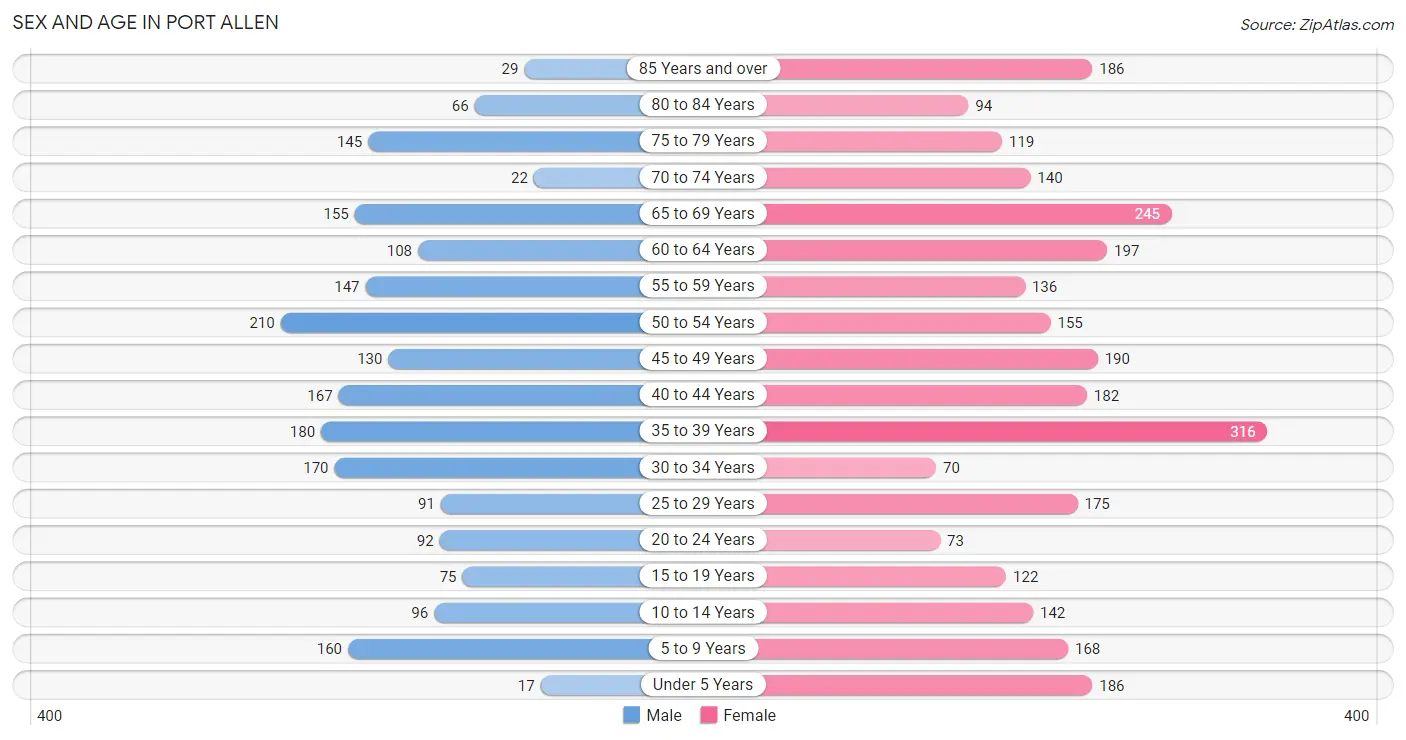
| Age Bracket | Male | Female |
| Under 5 Years | 17 (0.8%) | 186 (6.4%) |
| 5 to 9 Years | 160 (7.8%) | 168 (5.8%) |
| 10 to 14 Years | 96 (4.7%) | 142 (4.9%) |
| 15 to 19 Years | 75 (3.6%) | 122 (4.2%) |
| 20 to 24 Years | 92 (4.5%) | 73 (2.5%) |
| 25 to 29 Years | 91 (4.4%) | 175 (6.0%) |
| 30 to 34 Years | 170 (8.3%) | 70 (2.4%) |
| 35 to 39 Years | 180 (8.7%) | 316 (10.9%) |
| 40 to 44 Years | 167 (8.1%) | 182 (6.3%) |
| 45 to 49 Years | 130 (6.3%) | 190 (6.6%) |
| 50 to 54 Years | 210 (10.2%) | 155 (5.3%) |
| 55 to 59 Years | 147 (7.1%) | 136 (4.7%) |
| 60 to 64 Years | 108 (5.2%) | 197 (6.8%) |
| 65 to 69 Years | 155 (7.5%) | 245 (8.5%) |
| 70 to 74 Years | 22 (1.1%) | 140 (4.8%) |
| 75 to 79 Years | 145 (7.0%) | 119 (4.1%) |
| 80 to 84 Years | 66 (3.2%) | 94 (3.3%) |
| 85 Years and over | 29 (1.4%) | 186 (6.4%) |
| Total | 2,060 (100.0%) | 2,896 (100.0%) |
Families and Households in Port Allen
Median Family Size in Port Allen
The median family size in Port Allen is 2.86 persons per family, with married-couple families (756 | 58.7%) accounting for the largest median family size of 2.89 persons per family. On the other hand, single male/father families (142 | 11.0%) represent the smallest median family size with 2.65 persons per family.
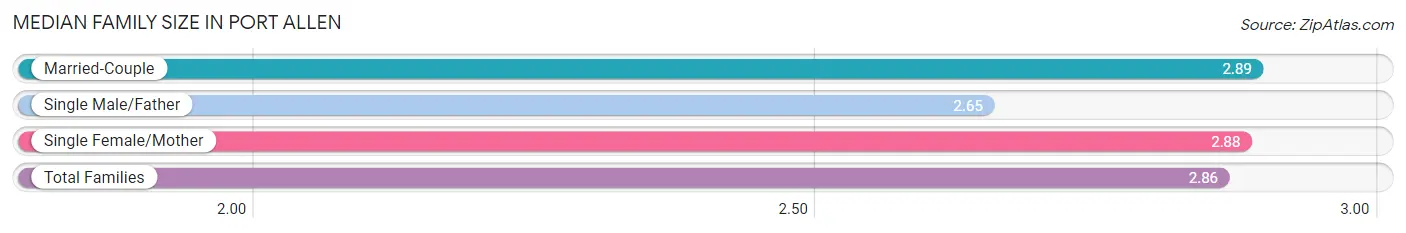
| Family Type | # Families | Family Size |
| Married-Couple | 756 (58.7%) | 2.89 |
| Single Male/Father | 142 (11.0%) | 2.65 |
| Single Female/Mother | 390 (30.3%) | 2.88 |
| Total Families | 1,288 (100.0%) | 2.86 |
Median Household Size in Port Allen
The median household size in Port Allen is 2.21 persons per household, with single female/mother households (390 | 17.9%) accounting for the largest median household size of 2.95 persons per household. non-family households (895 | 41.0%) represent the smallest median household size with 1.21 persons per household.
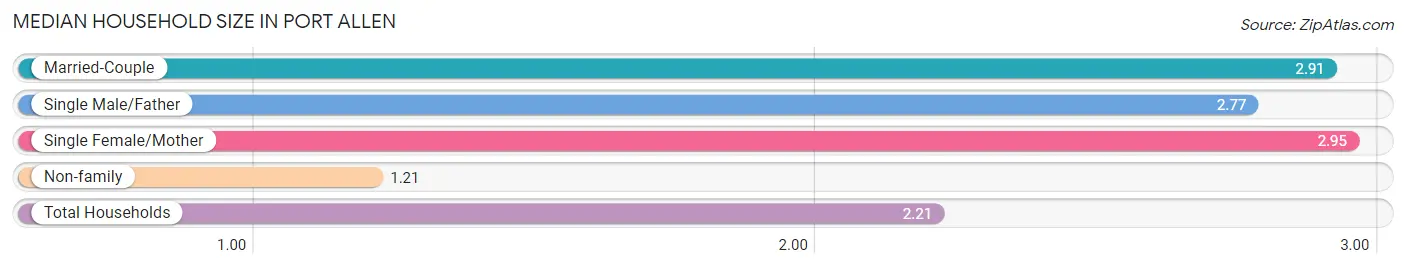
| Household Type | # Households | Household Size |
| Married-Couple | 756 (34.6%) | 2.91 |
| Single Male/Father | 142 (6.5%) | 2.77 |
| Single Female/Mother | 390 (17.9%) | 2.95 |
| Non-family | 895 (41.0%) | 1.21 |
| Total Households | 2,183 (100.0%) | 2.21 |
Household Size by Marriage Status in Port Allen
Out of a total of 2,183 households in Port Allen, 1,288 (59.0%) are family households, while 895 (41.0%) are nonfamily households. The most numerous type of family households are 2-person households, comprising 698, and the most common type of nonfamily households are 1-person households, comprising 764.
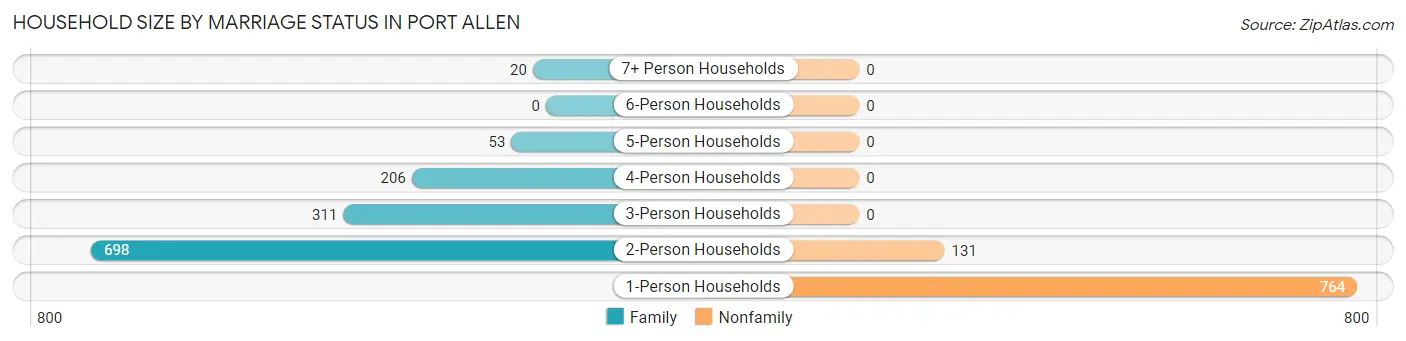
| Household Size | Family Households | Nonfamily Households |
| 1-Person Households | - | 764 (35.0%) |
| 2-Person Households | 698 (32.0%) | 131 (6.0%) |
| 3-Person Households | 311 (14.2%) | 0 (0.0%) |
| 4-Person Households | 206 (9.4%) | 0 (0.0%) |
| 5-Person Households | 53 (2.4%) | 0 (0.0%) |
| 6-Person Households | 0 (0.0%) | 0 (0.0%) |
| 7+ Person Households | 20 (0.9%) | 0 (0.0%) |
| Total | 1,288 (59.0%) | 895 (41.0%) |
Female Fertility in Port Allen
Fertility by Age in Port Allen
Average fertility rate in Port Allen is 53.0 births per 1,000 women. Women in the age bracket of 35 to 50 years have the highest fertility rate with 86.0 births per 1,000 women. Women in the age bracket of 35 to 50 years acount for 100.0% of all women with births.
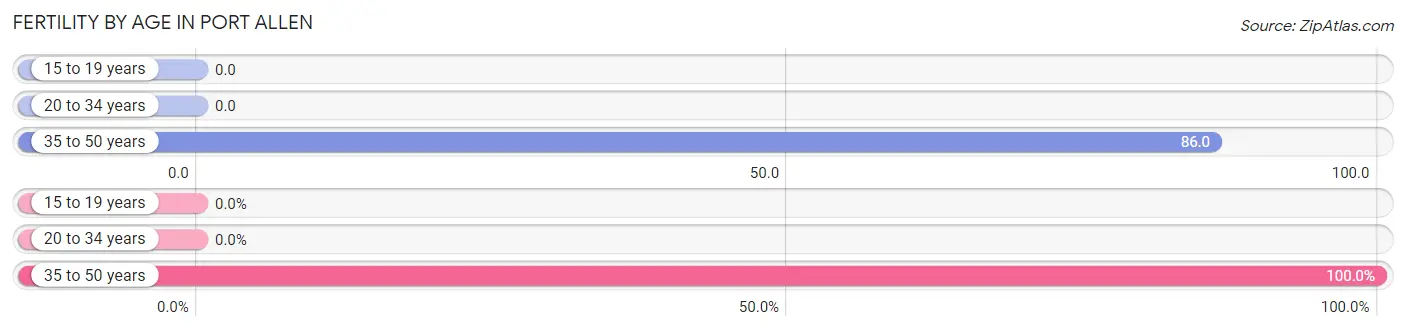
| Age Bracket | Women with Births | Births / 1,000 Women |
| 15 to 19 years | 0 (0.0%) | 0.0 |
| 20 to 34 years | 0 (0.0%) | 0.0 |
| 35 to 50 years | 60 (100.0%) | 86.0 |
| Total | 60 (100.0%) | 53.0 |
Fertility by Age by Marriage Status in Port Allen
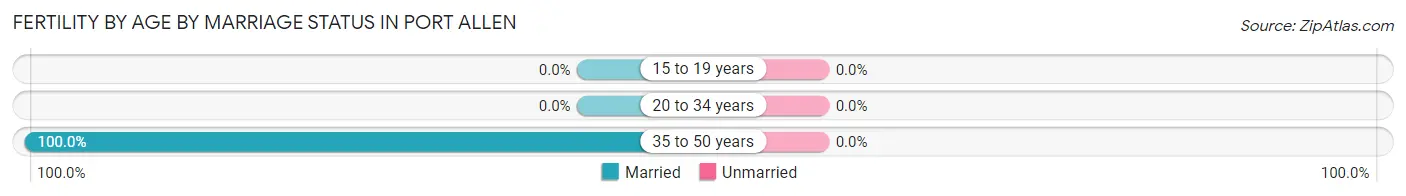
| Age Bracket | Married | Unmarried |
| 15 to 19 years | 0 (0.0%) | 0 (0.0%) |
| 20 to 34 years | 0 (0.0%) | 0 (0.0%) |
| 35 to 50 years | 60 (100.0%) | 0 (0.0%) |
| Total | 60 (100.0%) | 0 (0.0%) |
Fertility by Education in Port Allen
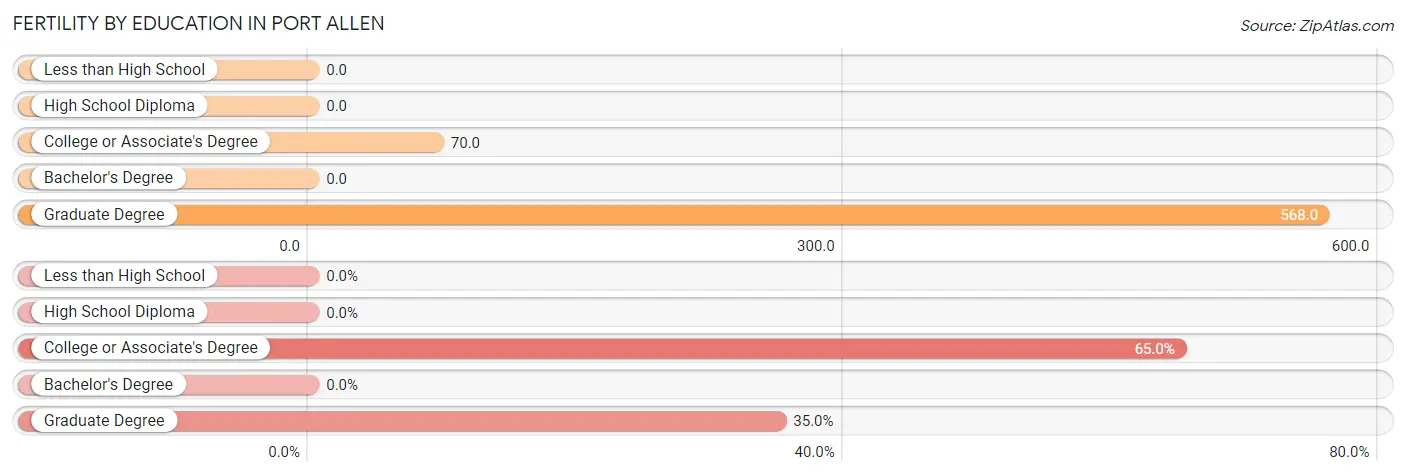
| Educational Attainment | Women with Births | Births / 1,000 Women |
| Less than High School | 0 (0.0%) | 0.0 |
| High School Diploma | 0 (0.0%) | 0.0 |
| College or Associate's Degree | 39 (65.0%) | 70.0 |
| Bachelor's Degree | 0 (0.0%) | 0.0 |
| Graduate Degree | 21 (35.0%) | 568.0 |
| Total | 60 (100.0%) | 53.0 |
Fertility by Education by Marriage Status in Port Allen
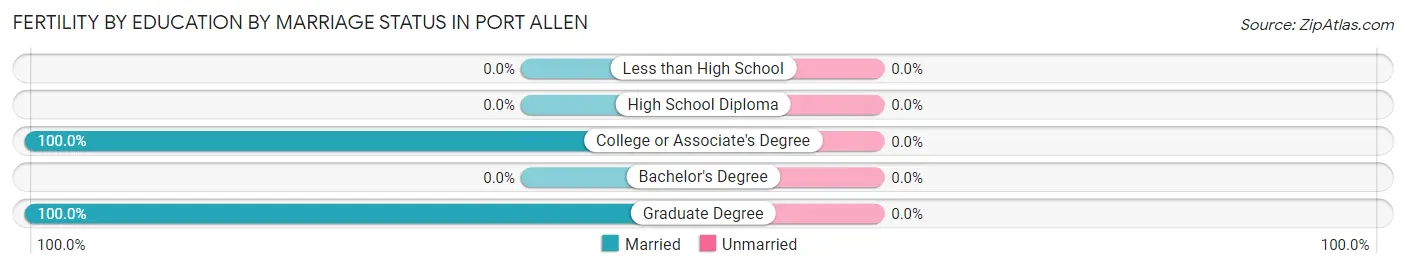
| Educational Attainment | Married | Unmarried |
| Less than High School | 0 (0.0%) | 0 (0.0%) |
| High School Diploma | 0 (0.0%) | 0 (0.0%) |
| College or Associate's Degree | 39 (100.0%) | 0 (0.0%) |
| Bachelor's Degree | 0 (0.0%) | 0 (0.0%) |
| Graduate Degree | 21 (100.0%) | 0 (0.0%) |
| Total | 60 (100.0%) | 0 (0.0%) |
Employment Characteristics in Port Allen
Employment by Class of Employer in Port Allen
Among the 2,253 employed individuals in Port Allen, private company employees (1,670 | 74.1%), state government employees (192 | 8.5%), and local government employees (108 | 4.8%) make up the most common classes of employment.
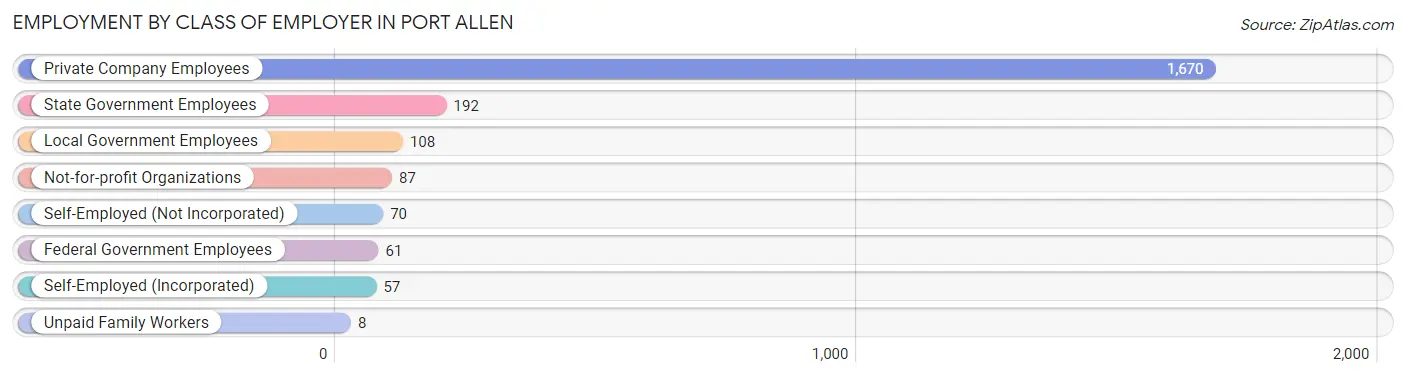
| Employer Class | # Employees | % Employees |
| Private Company Employees | 1,670 | 74.1% |
| Self-Employed (Incorporated) | 57 | 2.5% |
| Self-Employed (Not Incorporated) | 70 | 3.1% |
| Not-for-profit Organizations | 87 | 3.9% |
| Local Government Employees | 108 | 4.8% |
| State Government Employees | 192 | 8.5% |
| Federal Government Employees | 61 | 2.7% |
| Unpaid Family Workers | 8 | 0.4% |
| Total | 2,253 | 100.0% |
Employment Status by Age in Port Allen
According to the labor force statistics for Port Allen, out of the total population over 16 years of age (4,187), 58.8% or 2,462 individuals are in the labor force, with 8.5% or 209 of them unemployed. The age group with the highest labor force participation rate is 20 to 24 years, with 100.0% or 165 individuals in the labor force. Within the labor force, the 30 to 34 years age range has the highest percentage of unemployed individuals, with 35.5% or 49 of them being unemployed.
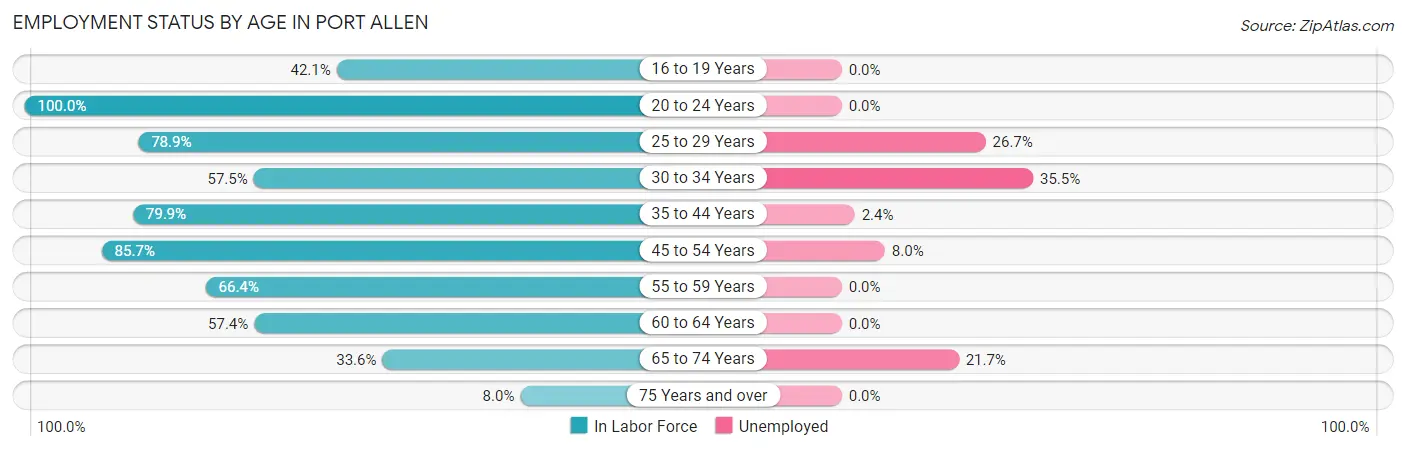
| Age Bracket | In Labor Force | Unemployed |
| 16 to 19 Years | 83 (42.1%) | 0 (0.0%) |
| 20 to 24 Years | 165 (100.0%) | 0 (0.0%) |
| 25 to 29 Years | 210 (78.9%) | 56 (26.7%) |
| 30 to 34 Years | 138 (57.5%) | 49 (35.5%) |
| 35 to 44 Years | 675 (79.9%) | 16 (2.4%) |
| 45 to 54 Years | 587 (85.7%) | 47 (8.0%) |
| 55 to 59 Years | 188 (66.4%) | 0 (0.0%) |
| 60 to 64 Years | 175 (57.4%) | 0 (0.0%) |
| 65 to 74 Years | 189 (33.6%) | 41 (21.7%) |
| 75 Years and over | 51 (8.0%) | 0 (0.0%) |
| Total | 2,462 (58.8%) | 209 (8.5%) |
Employment Status by Educational Attainment in Port Allen
According to labor force statistics for Port Allen, 75.2% of individuals (1,973) out of the total population between 25 and 64 years of age (2,624) are in the labor force, with 8.5% or 168 of them being unemployed. The group with the highest labor force participation rate are those with the educational attainment of bachelor's degree or higher, with 95.6% or 460 individuals in the labor force. Within the labor force, individuals with bachelor's degree or higher education have the highest percentage of unemployment, with 18.2% or 84 of them being unemployed.
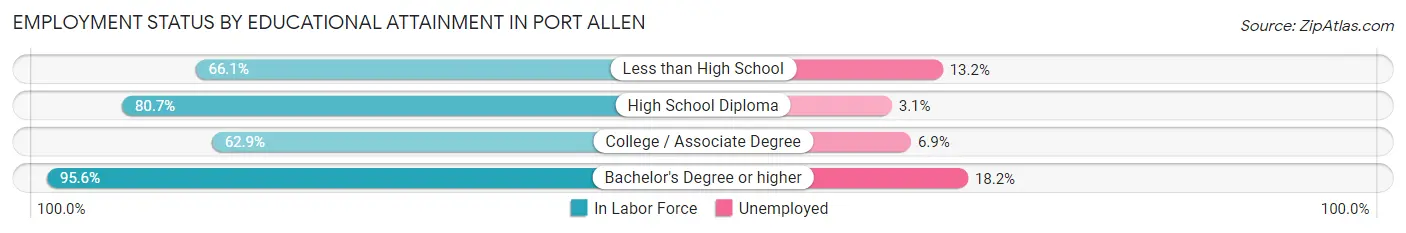
| Educational Attainment | In Labor Force | Unemployed |
| Less than High School | 144 (66.1%) | 29 (13.2%) |
| High School Diploma | 716 (80.7%) | 27 (3.1%) |
| College / Associate Degree | 653 (62.9%) | 72 (6.9%) |
| Bachelor's Degree or higher | 460 (95.6%) | 88 (18.2%) |
| Total | 1,973 (75.2%) | 223 (8.5%) |
Employment Occupations by Sex in Port Allen
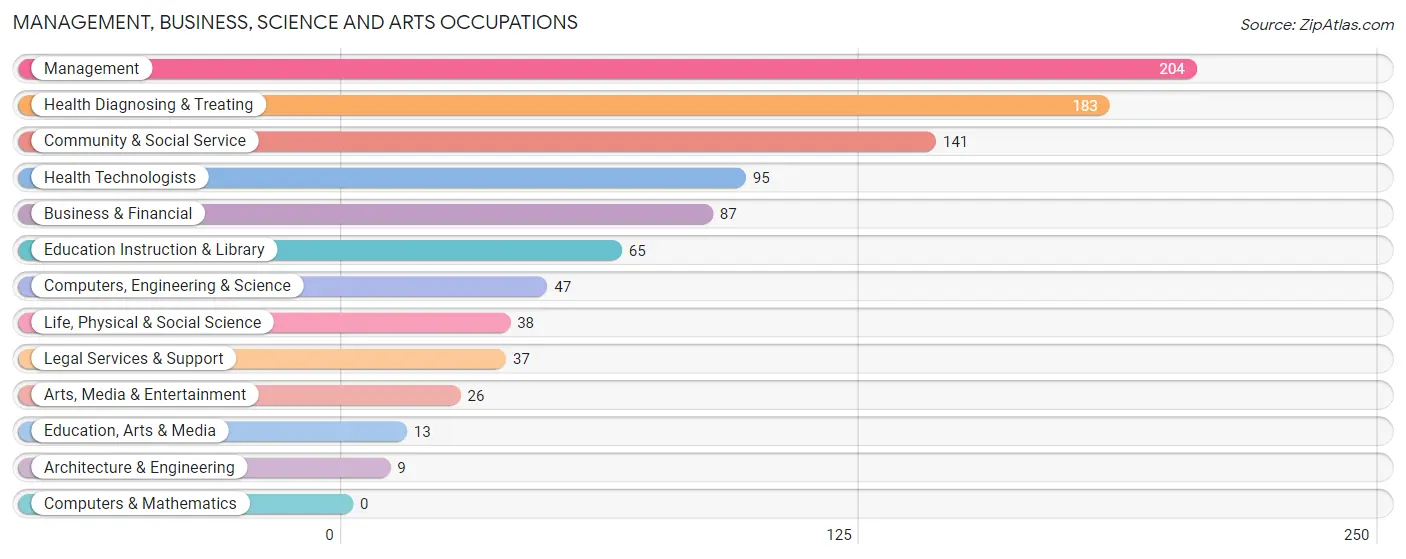
Management, Business, Science and Arts Occupations
The most common Management, Business, Science and Arts occupations in Port Allen are Management (204 | 9.1%), Health Diagnosing & Treating (183 | 8.2%), Community & Social Service (141 | 6.3%), Health Technologists (95 | 4.2%), and Business & Financial (87 | 3.9%).
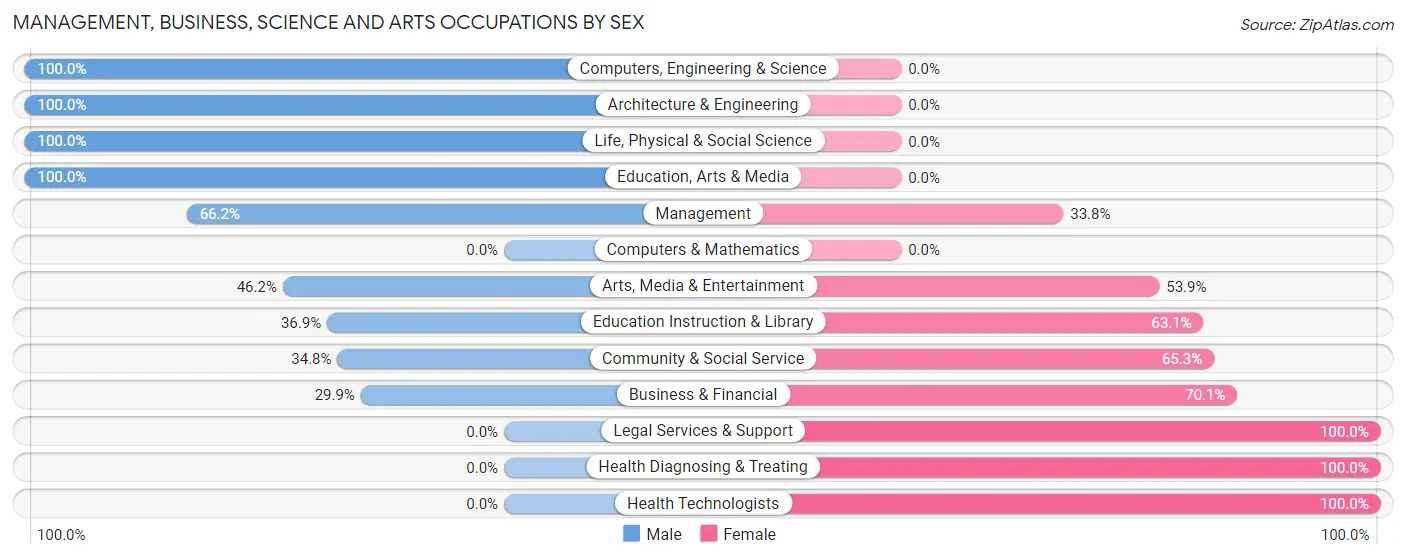
Management, Business, Science and Arts Occupations by Sex
Within the Management, Business, Science and Arts occupations in Port Allen, the most male-oriented occupations are Computers, Engineering & Science (100.0%), Architecture & Engineering (100.0%), and Life, Physical & Social Science (100.0%), while the most female-oriented occupations are Legal Services & Support (100.0%), Health Diagnosing & Treating (100.0%), and Health Technologists (100.0%).
| Occupation | Male | Female |
| Management | 135 (66.2%) | 69 (33.8%) |
| Business & Financial | 26 (29.9%) | 61 (70.1%) |
| Computers, Engineering & Science | 47 (100.0%) | 0 (0.0%) |
| Computers & Mathematics | 0 (0.0%) | 0 (0.0%) |
| Architecture & Engineering | 9 (100.0%) | 0 (0.0%) |
| Life, Physical & Social Science | 38 (100.0%) | 0 (0.0%) |
| Community & Social Service | 49 (34.7%) | 92 (65.2%) |
| Education, Arts & Media | 13 (100.0%) | 0 (0.0%) |
| Legal Services & Support | 0 (0.0%) | 37 (100.0%) |
| Education Instruction & Library | 24 (36.9%) | 41 (63.1%) |
| Arts, Media & Entertainment | 12 (46.2%) | 14 (53.8%) |
| Health Diagnosing & Treating | 0 (0.0%) | 183 (100.0%) |
| Health Technologists | 0 (0.0%) | 95 (100.0%) |
| Total (Category) | 257 (38.8%) | 405 (61.2%) |
| Total (Overall) | 1,082 (48.3%) | 1,156 (51.6%) |
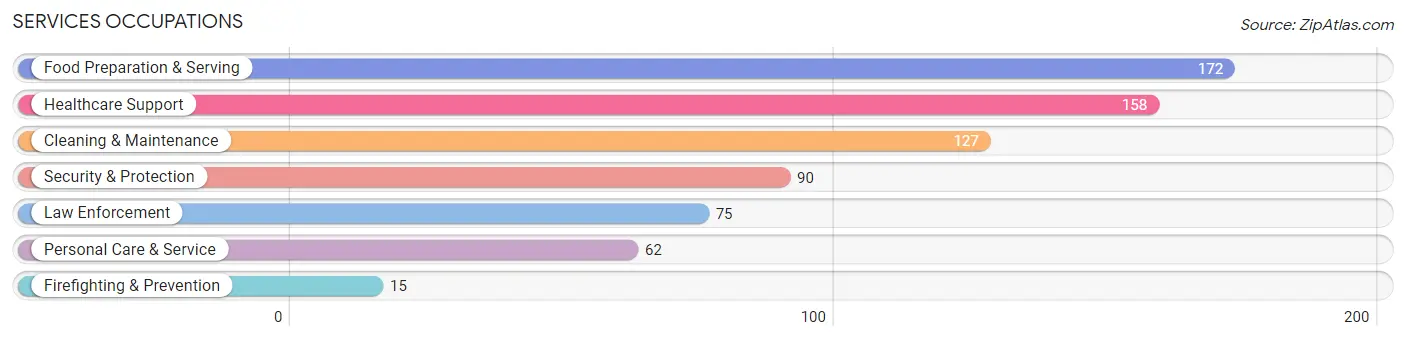
Services Occupations
The most common Services occupations in Port Allen are Food Preparation & Serving (172 | 7.7%), Healthcare Support (158 | 7.1%), Cleaning & Maintenance (127 | 5.7%), Security & Protection (90 | 4.0%), and Law Enforcement (75 | 3.4%).
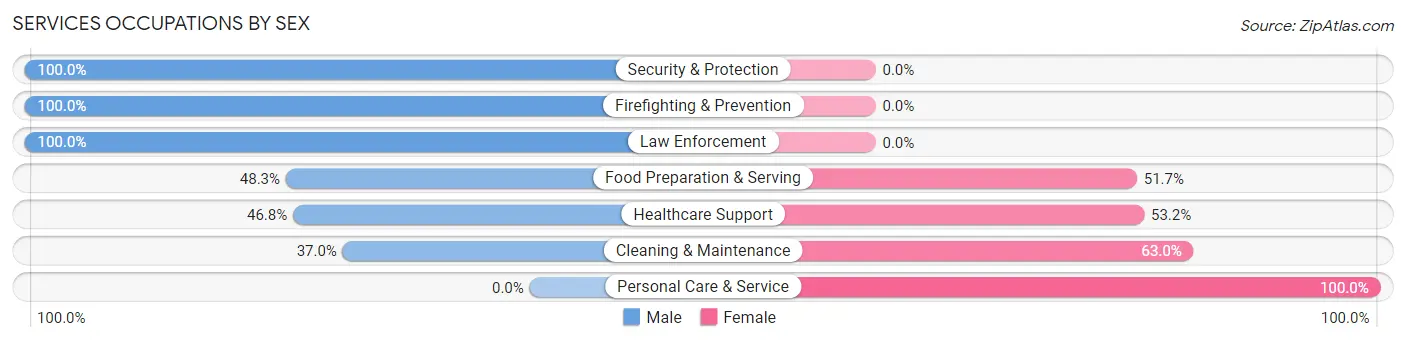
Services Occupations by Sex
Within the Services occupations in Port Allen, the most male-oriented occupations are Security & Protection (100.0%), Firefighting & Prevention (100.0%), and Law Enforcement (100.0%), while the most female-oriented occupations are Personal Care & Service (100.0%), Cleaning & Maintenance (63.0%), and Healthcare Support (53.2%).
| Occupation | Male | Female |
| Healthcare Support | 74 (46.8%) | 84 (53.2%) |
| Security & Protection | 90 (100.0%) | 0 (0.0%) |
| Firefighting & Prevention | 15 (100.0%) | 0 (0.0%) |
| Law Enforcement | 75 (100.0%) | 0 (0.0%) |
| Food Preparation & Serving | 83 (48.3%) | 89 (51.7%) |
| Cleaning & Maintenance | 47 (37.0%) | 80 (63.0%) |
| Personal Care & Service | 0 (0.0%) | 62 (100.0%) |
| Total (Category) | 294 (48.3%) | 315 (51.7%) |
| Total (Overall) | 1,082 (48.3%) | 1,156 (51.6%) |
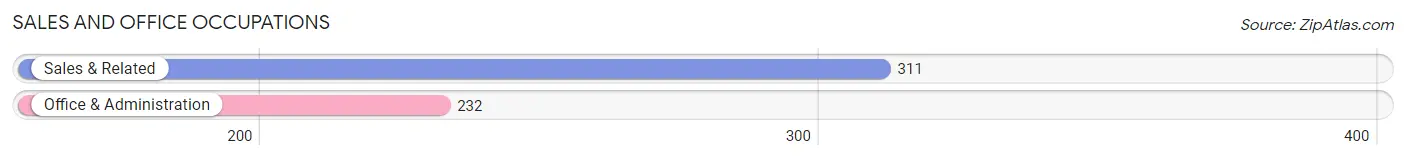
Sales and Office Occupations
The most common Sales and Office occupations in Port Allen are Sales & Related (311 | 13.9%), and Office & Administration (232 | 10.4%).
Sales and Office Occupations by Sex
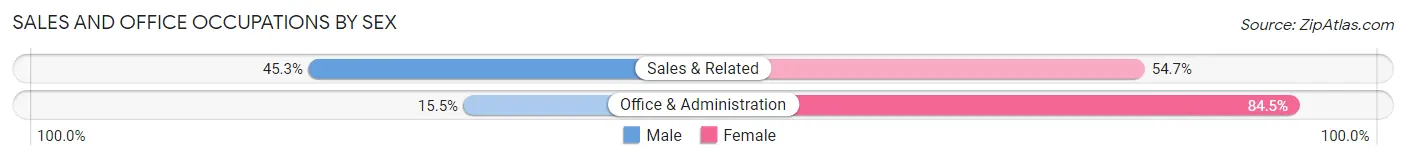
| Occupation | Male | Female |
| Sales & Related | 141 (45.3%) | 170 (54.7%) |
| Office & Administration | 36 (15.5%) | 196 (84.5%) |
| Total (Category) | 177 (32.6%) | 366 (67.4%) |
| Total (Overall) | 1,082 (48.3%) | 1,156 (51.6%) |
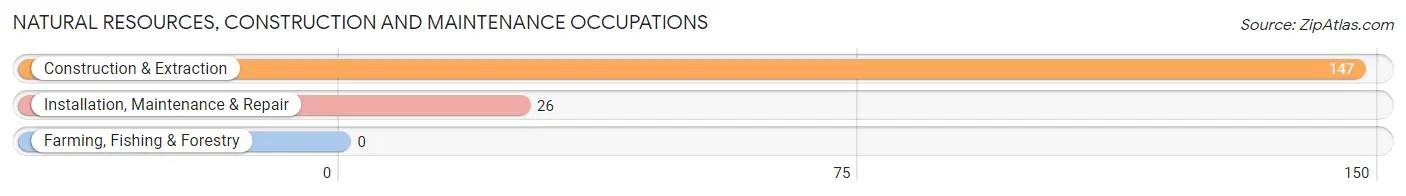
Natural Resources, Construction and Maintenance Occupations
The most common Natural Resources, Construction and Maintenance occupations in Port Allen are Construction & Extraction (147 | 6.6%), and Installation, Maintenance & Repair (26 | 1.2%).
Natural Resources, Construction and Maintenance Occupations by Sex
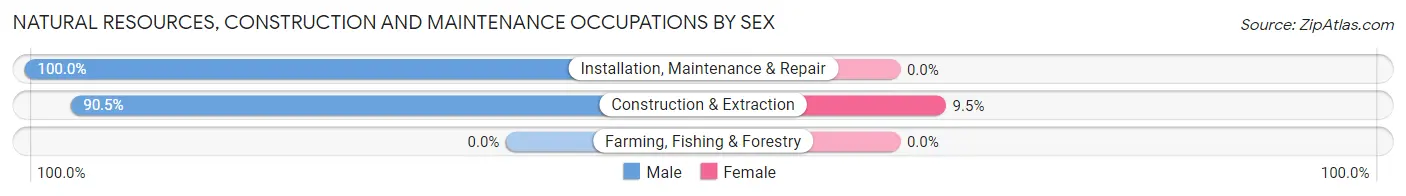
| Occupation | Male | Female |
| Farming, Fishing & Forestry | 0 (0.0%) | 0 (0.0%) |
| Construction & Extraction | 133 (90.5%) | 14 (9.5%) |
| Installation, Maintenance & Repair | 26 (100.0%) | 0 (0.0%) |
| Total (Category) | 159 (91.9%) | 14 (8.1%) |
| Total (Overall) | 1,082 (48.3%) | 1,156 (51.6%) |
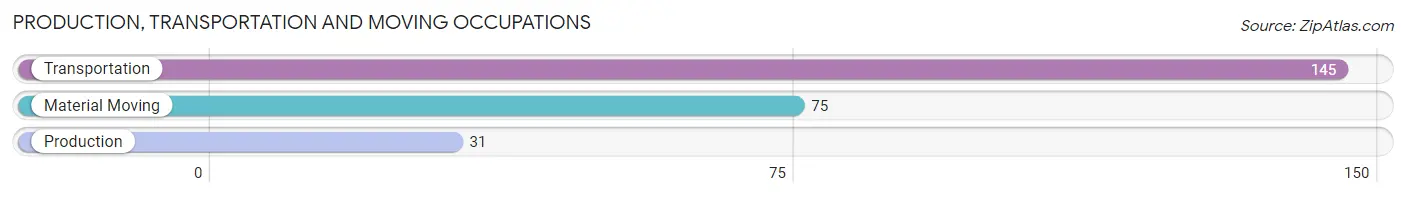
Production, Transportation and Moving Occupations
The most common Production, Transportation and Moving occupations in Port Allen are Transportation (145 | 6.5%), Material Moving (75 | 3.4%), and Production (31 | 1.4%).
Production, Transportation and Moving Occupations by Sex
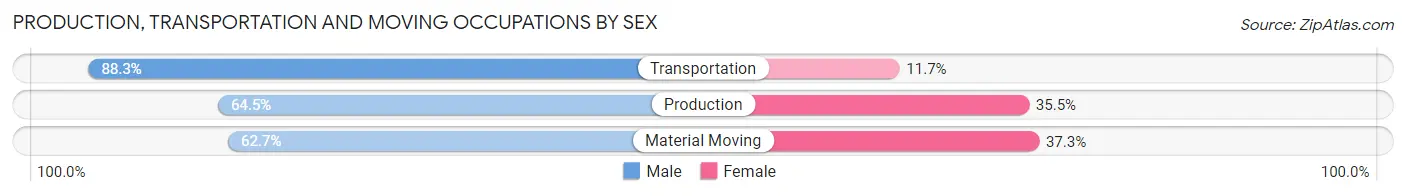
| Occupation | Male | Female |
| Production | 20 (64.5%) | 11 (35.5%) |
| Transportation | 128 (88.3%) | 17 (11.7%) |
| Material Moving | 47 (62.7%) | 28 (37.3%) |
| Total (Category) | 195 (77.7%) | 56 (22.3%) |
| Total (Overall) | 1,082 (48.3%) | 1,156 (51.6%) |
Employment Industries by Sex in Port Allen
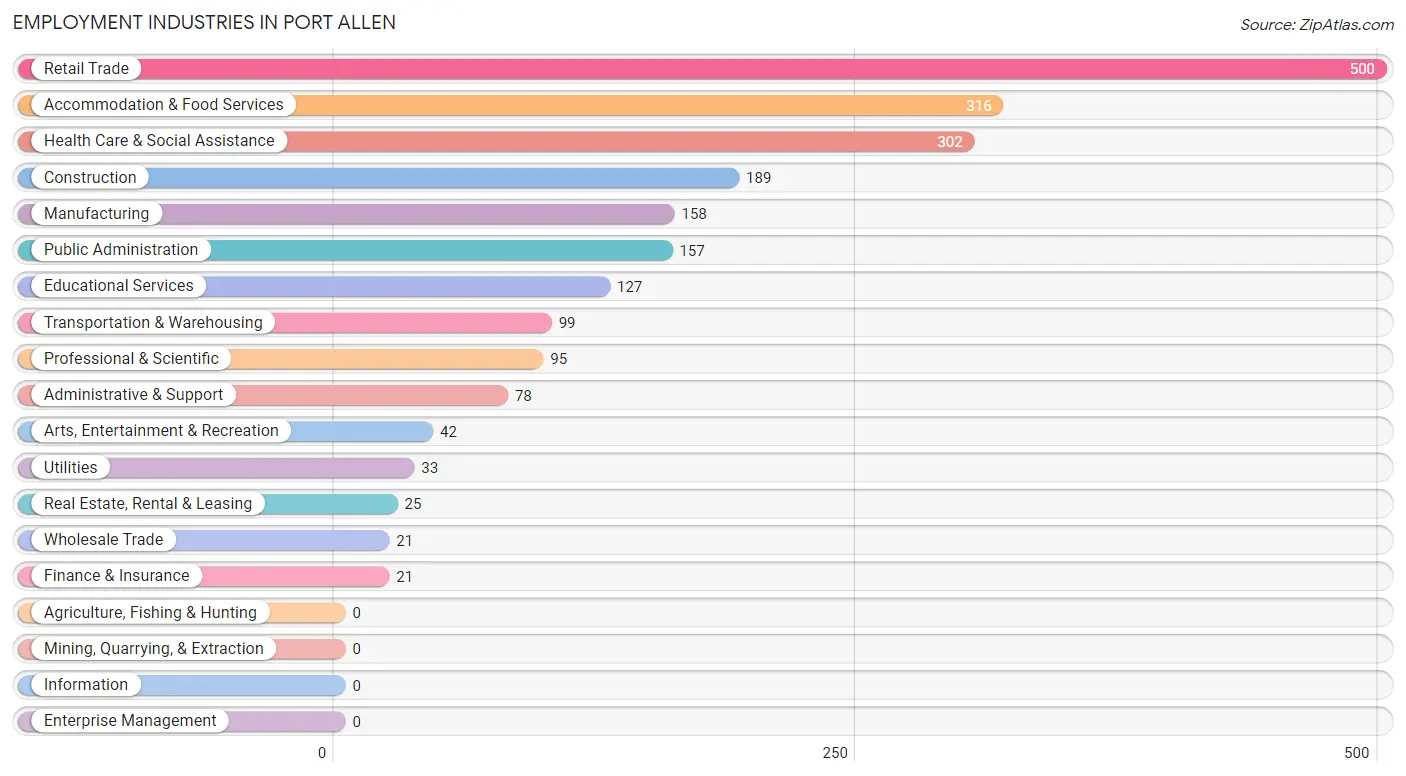
Employment Industries in Port Allen
The major employment industries in Port Allen include Retail Trade (500 | 22.3%), Accommodation & Food Services (316 | 14.1%), Health Care & Social Assistance (302 | 13.5%), Construction (189 | 8.5%), and Manufacturing (158 | 7.1%).
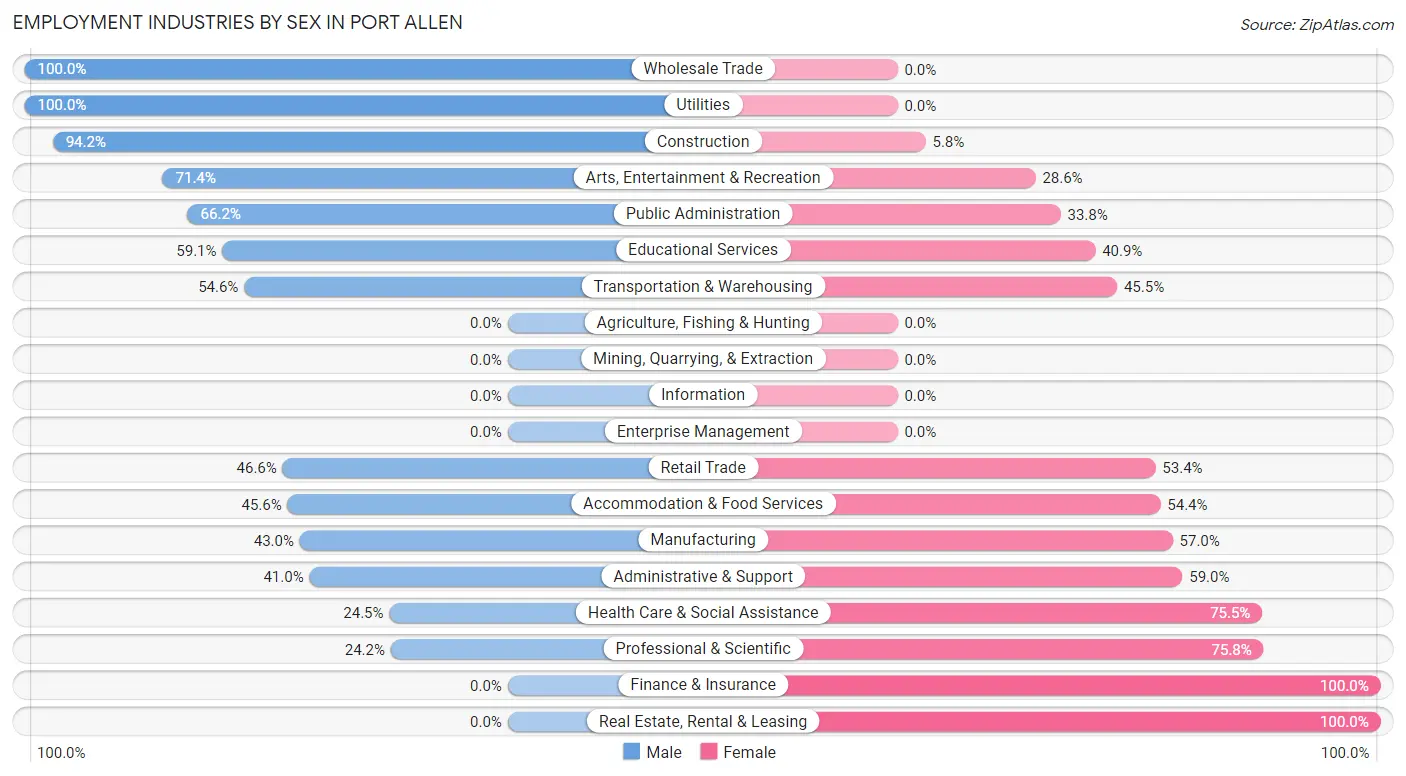
Employment Industries by Sex in Port Allen
The Port Allen industries that see more men than women are Wholesale Trade (100.0%), Utilities (100.0%), and Construction (94.2%), whereas the industries that tend to have a higher number of women are Finance & Insurance (100.0%), Real Estate, Rental & Leasing (100.0%), and Professional & Scientific (75.8%).
| Industry | Male | Female |
| Agriculture, Fishing & Hunting | 0 (0.0%) | 0 (0.0%) |
| Mining, Quarrying, & Extraction | 0 (0.0%) | 0 (0.0%) |
| Construction | 178 (94.2%) | 11 (5.8%) |
| Manufacturing | 68 (43.0%) | 90 (57.0%) |
| Wholesale Trade | 21 (100.0%) | 0 (0.0%) |
| Retail Trade | 233 (46.6%) | 267 (53.4%) |
| Transportation & Warehousing | 54 (54.5%) | 45 (45.5%) |
| Utilities | 33 (100.0%) | 0 (0.0%) |
| Information | 0 (0.0%) | 0 (0.0%) |
| Finance & Insurance | 0 (0.0%) | 21 (100.0%) |
| Real Estate, Rental & Leasing | 0 (0.0%) | 25 (100.0%) |
| Professional & Scientific | 23 (24.2%) | 72 (75.8%) |
| Enterprise Management | 0 (0.0%) | 0 (0.0%) |
| Administrative & Support | 32 (41.0%) | 46 (59.0%) |
| Educational Services | 75 (59.1%) | 52 (40.9%) |
| Health Care & Social Assistance | 74 (24.5%) | 228 (75.5%) |
| Arts, Entertainment & Recreation | 30 (71.4%) | 12 (28.6%) |
| Accommodation & Food Services | 144 (45.6%) | 172 (54.4%) |
| Public Administration | 104 (66.2%) | 53 (33.8%) |
| Total | 1,082 (48.3%) | 1,156 (51.6%) |
Education in Port Allen
School Enrollment in Port Allen
The most common levels of schooling among the 1,145 students in Port Allen are elementary school (287 | 25.1%), college / undergraduate (287 | 25.1%), and middle school (222 | 19.4%).
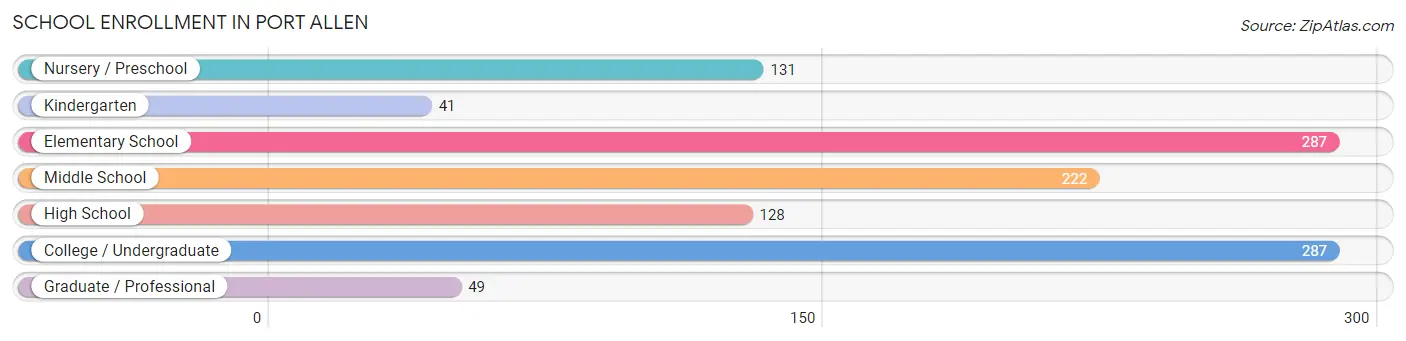
| School Level | # Students | % Students |
| Nursery / Preschool | 131 | 11.4% |
| Kindergarten | 41 | 3.6% |
| Elementary School | 287 | 25.1% |
| Middle School | 222 | 19.4% |
| High School | 128 | 11.2% |
| College / Undergraduate | 287 | 25.1% |
| Graduate / Professional | 49 | 4.3% |
| Total | 1,145 | 100.0% |
School Enrollment by Age by Funding Source in Port Allen
Out of a total of 1,145 students who are enrolled in schools in Port Allen, 169 (14.8%) attend a private institution, while the remaining 976 (85.2%) are enrolled in public schools. The age group of 10 to 14 year olds has the highest likelihood of being enrolled in private schools, with 79 (33.2% in the age bracket) enrolled. Conversely, the age group of 3 to 4 year olds has the lowest likelihood of being enrolled in a private school, with 131 (100.0% in the age bracket) attending a public institution.
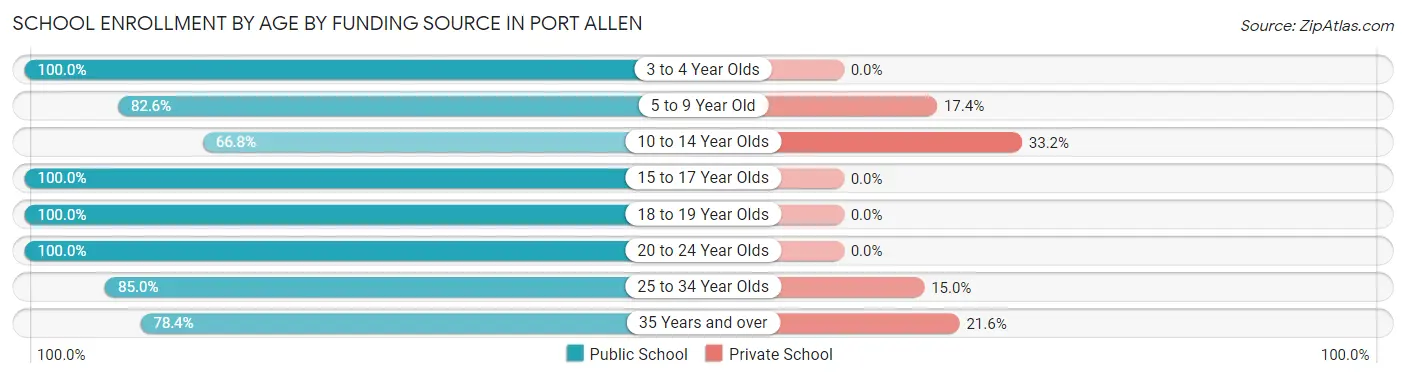
| Age Bracket | Public School | Private School |
| 3 to 4 Year Olds | 131 (100.0%) | 0 (0.0%) |
| 5 to 9 Year Old | 271 (82.6%) | 57 (17.4%) |
| 10 to 14 Year Olds | 159 (66.8%) | 79 (33.2%) |
| 15 to 17 Year Olds | 112 (100.0%) | 0 (0.0%) |
| 18 to 19 Year Olds | 85 (100.0%) | 0 (0.0%) |
| 20 to 24 Year Olds | 69 (100.0%) | 0 (0.0%) |
| 25 to 34 Year Olds | 68 (85.0%) | 12 (15.0%) |
| 35 Years and over | 80 (78.4%) | 22 (21.6%) |
| Total | 976 (85.2%) | 169 (14.8%) |
Educational Attainment by Field of Study in Port Allen
Business (220 | 34.2%), liberal arts & history (92 | 14.3%), education (90 | 14.0%), arts & humanities (49 | 7.6%), and visual & performing arts (48 | 7.4%) are the most common fields of study among 644 individuals in Port Allen who have obtained a bachelor's degree or higher.
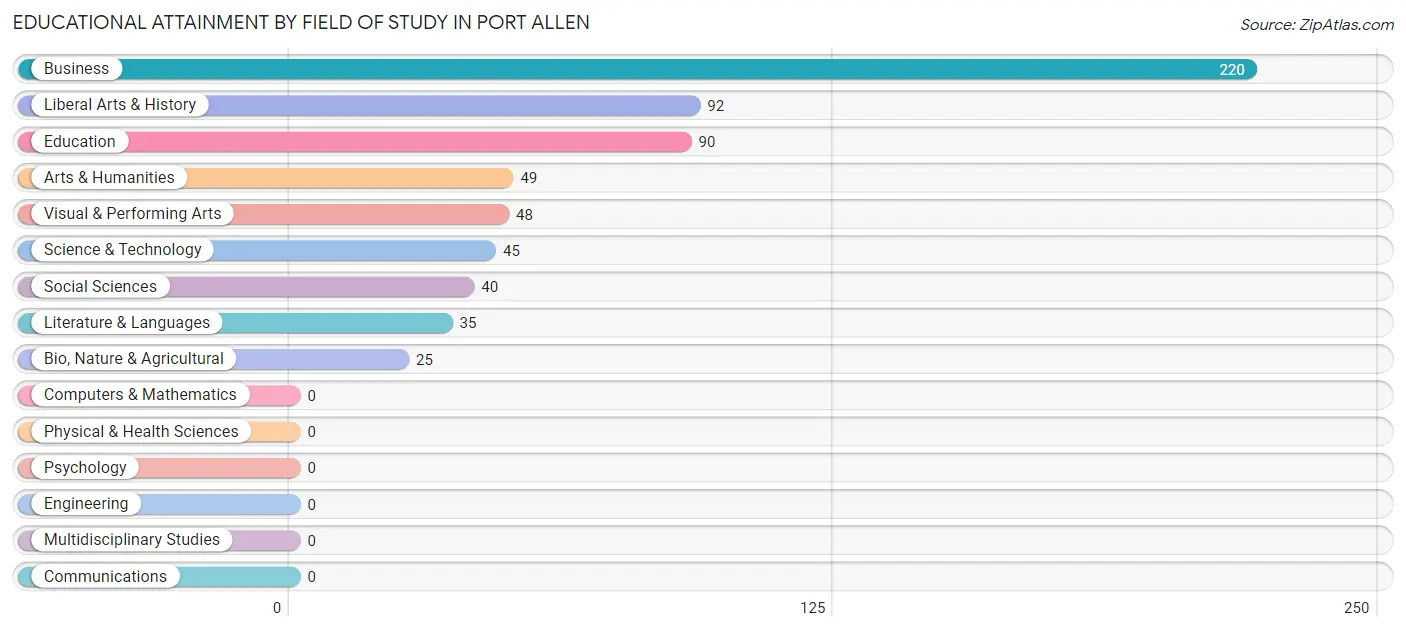
| Field of Study | # Graduates | % Graduates |
| Computers & Mathematics | 0 | 0.0% |
| Bio, Nature & Agricultural | 25 | 3.9% |
| Physical & Health Sciences | 0 | 0.0% |
| Psychology | 0 | 0.0% |
| Social Sciences | 40 | 6.2% |
| Engineering | 0 | 0.0% |
| Multidisciplinary Studies | 0 | 0.0% |
| Science & Technology | 45 | 7.0% |
| Business | 220 | 34.2% |
| Education | 90 | 14.0% |
| Literature & Languages | 35 | 5.4% |
| Liberal Arts & History | 92 | 14.3% |
| Visual & Performing Arts | 48 | 7.4% |
| Communications | 0 | 0.0% |
| Arts & Humanities | 49 | 7.6% |
| Total | 644 | 100.0% |
Transportation & Commute in Port Allen
Vehicle Availability by Sex in Port Allen
The most prevalent vehicle ownership categories in Port Allen are males with 2 vehicles (412, accounting for 37.7%) and females with 2 vehicles (495, making up 35.7%).
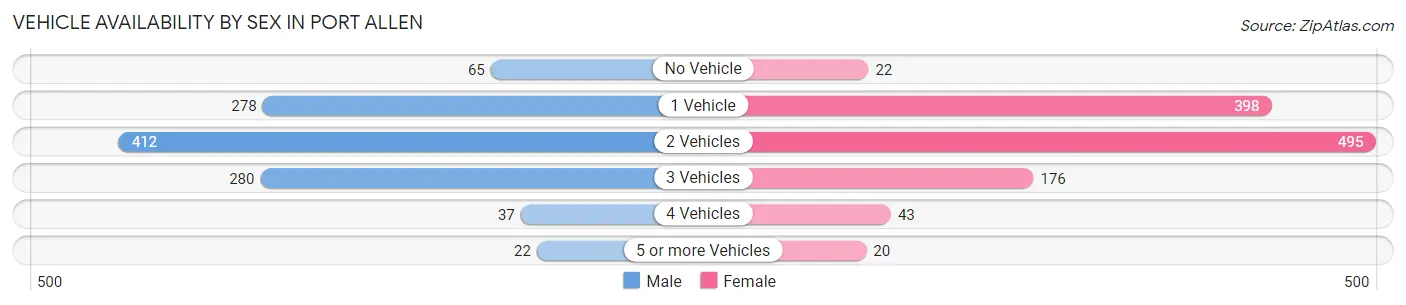
| Vehicles Available | Male | Female |
| No Vehicle | 65 (5.9%) | 22 (1.9%) |
| 1 Vehicle | 278 (25.4%) | 398 (34.5%) |
| 2 Vehicles | 412 (37.7%) | 495 (42.9%) |
| 3 Vehicles | 280 (25.6%) | 176 (15.2%) |
| 4 Vehicles | 37 (3.4%) | 43 (3.7%) |
| 5 or more Vehicles | 22 (2.0%) | 20 (1.7%) |
| Total | 1,094 (100.0%) | 1,154 (100.0%) |
Commute Time in Port Allen
The most frequently occuring commute durations in Port Allen are 20 to 24 minutes (461 commuters, 21.7%), 5 to 9 minutes (452 commuters, 21.3%), and 15 to 19 minutes (357 commuters, 16.8%).
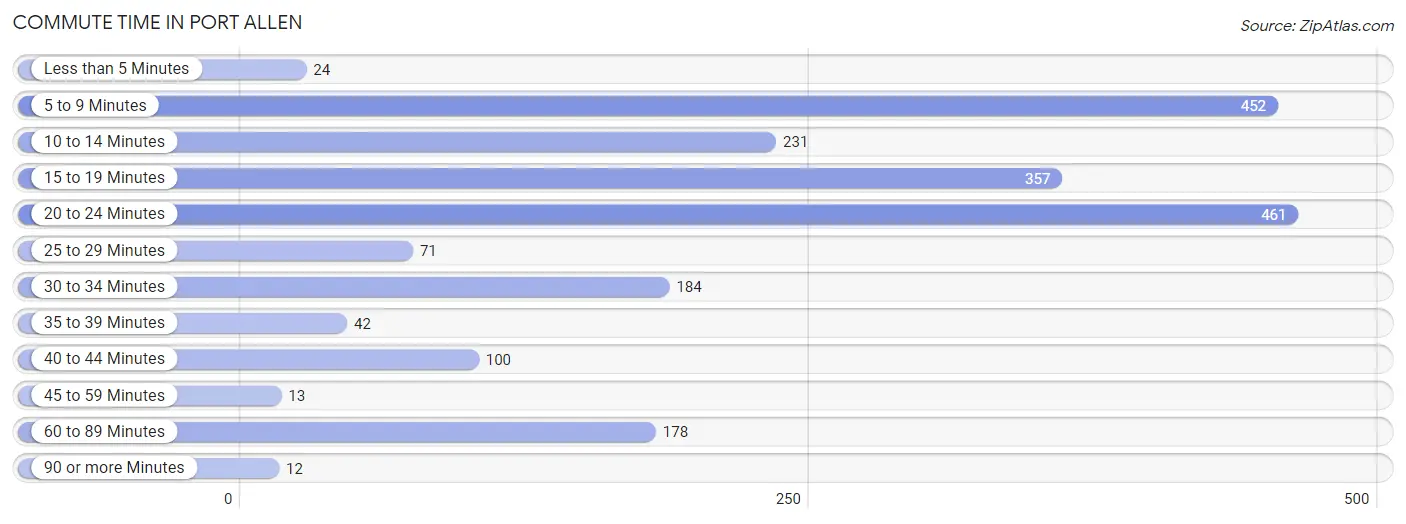
| Commute Time | # Commuters | % Commuters |
| Less than 5 Minutes | 24 | 1.1% |
| 5 to 9 Minutes | 452 | 21.3% |
| 10 to 14 Minutes | 231 | 10.9% |
| 15 to 19 Minutes | 357 | 16.8% |
| 20 to 24 Minutes | 461 | 21.7% |
| 25 to 29 Minutes | 71 | 3.3% |
| 30 to 34 Minutes | 184 | 8.7% |
| 35 to 39 Minutes | 42 | 2.0% |
| 40 to 44 Minutes | 100 | 4.7% |
| 45 to 59 Minutes | 13 | 0.6% |
| 60 to 89 Minutes | 178 | 8.4% |
| 90 or more Minutes | 12 | 0.6% |
Commute Time by Sex in Port Allen
The most common commute times in Port Allen are 20 to 24 minutes (256 commuters, 25.1%) for males and 15 to 19 minutes (282 commuters, 25.5%) for females.
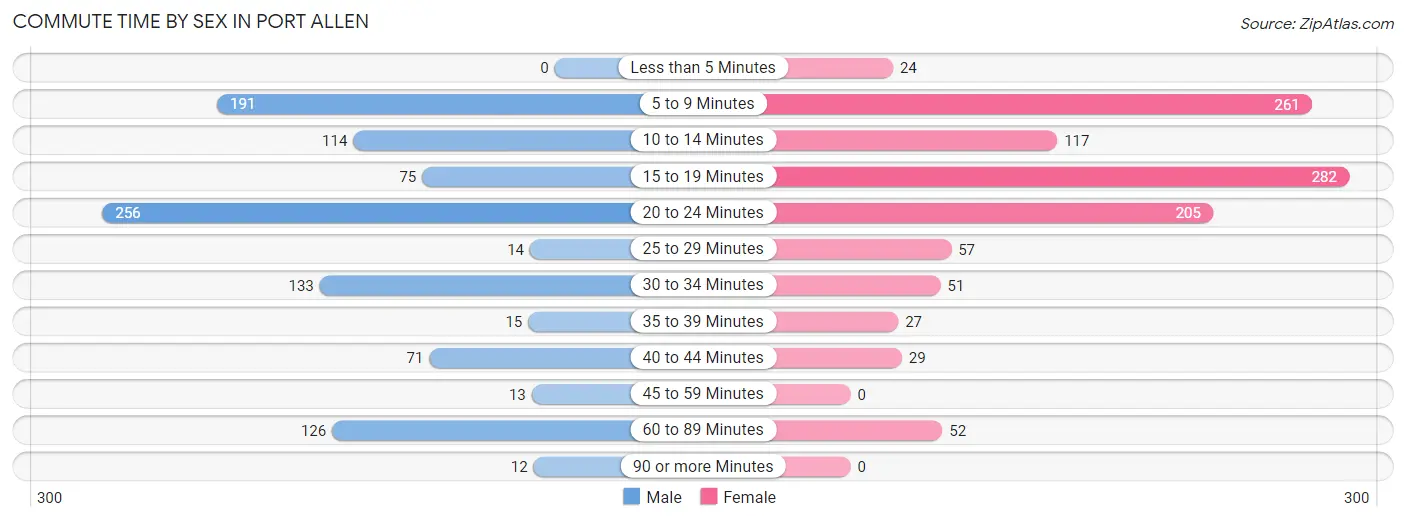
| Commute Time | Male | Female |
| Less than 5 Minutes | 0 (0.0%) | 24 (2.2%) |
| 5 to 9 Minutes | 191 (18.7%) | 261 (23.6%) |
| 10 to 14 Minutes | 114 (11.2%) | 117 (10.6%) |
| 15 to 19 Minutes | 75 (7.3%) | 282 (25.5%) |
| 20 to 24 Minutes | 256 (25.1%) | 205 (18.5%) |
| 25 to 29 Minutes | 14 (1.4%) | 57 (5.2%) |
| 30 to 34 Minutes | 133 (13.0%) | 51 (4.6%) |
| 35 to 39 Minutes | 15 (1.5%) | 27 (2.4%) |
| 40 to 44 Minutes | 71 (7.0%) | 29 (2.6%) |
| 45 to 59 Minutes | 13 (1.3%) | 0 (0.0%) |
| 60 to 89 Minutes | 126 (12.3%) | 52 (4.7%) |
| 90 or more Minutes | 12 (1.2%) | 0 (0.0%) |
Time of Departure to Work by Sex in Port Allen
The most frequent times of departure to work in Port Allen are 12:00 AM to 4:59 AM (171, 16.8%) for males and 7:30 AM to 7:59 AM (231, 20.9%) for females.
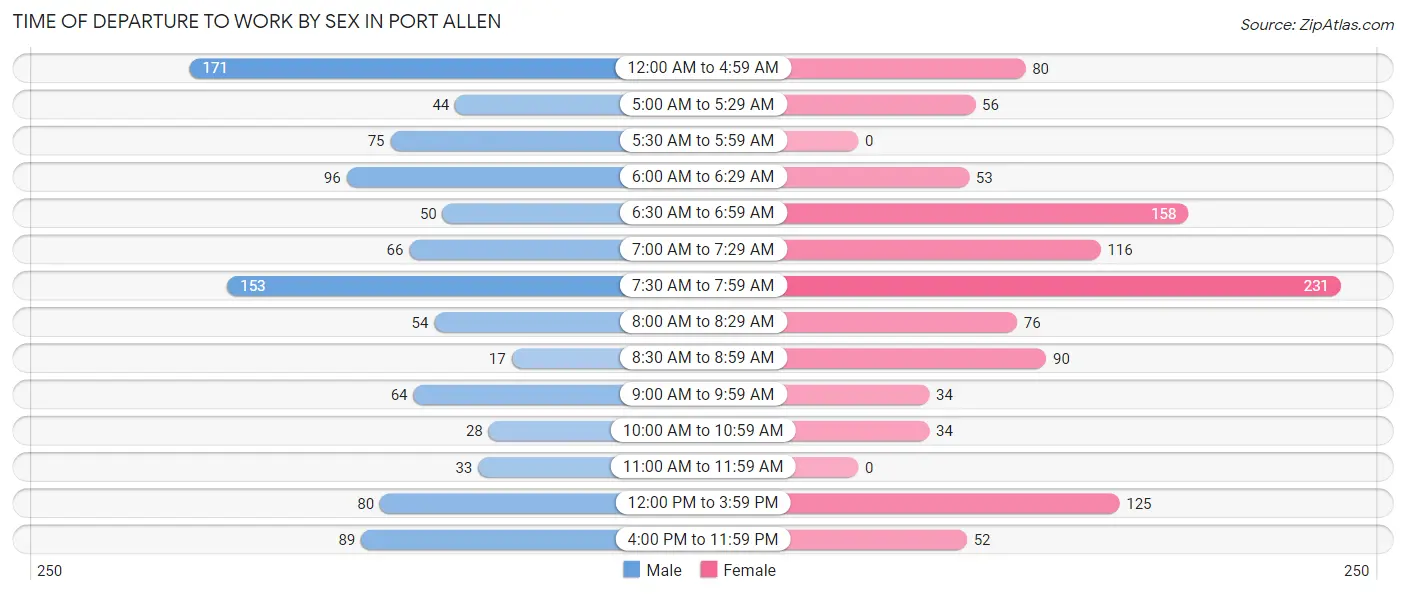
| Time of Departure | Male | Female |
| 12:00 AM to 4:59 AM | 171 (16.8%) | 80 (7.2%) |
| 5:00 AM to 5:29 AM | 44 (4.3%) | 56 (5.1%) |
| 5:30 AM to 5:59 AM | 75 (7.3%) | 0 (0.0%) |
| 6:00 AM to 6:29 AM | 96 (9.4%) | 53 (4.8%) |
| 6:30 AM to 6:59 AM | 50 (4.9%) | 158 (14.3%) |
| 7:00 AM to 7:29 AM | 66 (6.5%) | 116 (10.5%) |
| 7:30 AM to 7:59 AM | 153 (15.0%) | 231 (20.9%) |
| 8:00 AM to 8:29 AM | 54 (5.3%) | 76 (6.9%) |
| 8:30 AM to 8:59 AM | 17 (1.7%) | 90 (8.1%) |
| 9:00 AM to 9:59 AM | 64 (6.3%) | 34 (3.1%) |
| 10:00 AM to 10:59 AM | 28 (2.8%) | 34 (3.1%) |
| 11:00 AM to 11:59 AM | 33 (3.2%) | 0 (0.0%) |
| 12:00 PM to 3:59 PM | 80 (7.8%) | 125 (11.3%) |
| 4:00 PM to 11:59 PM | 89 (8.7%) | 52 (4.7%) |
| Total | 1,020 (100.0%) | 1,105 (100.0%) |
Housing Occupancy in Port Allen
Occupancy by Ownership in Port Allen
Of the total 2,183 dwellings in Port Allen, owner-occupied units account for 1,286 (58.9%), while renter-occupied units make up 897 (41.1%).
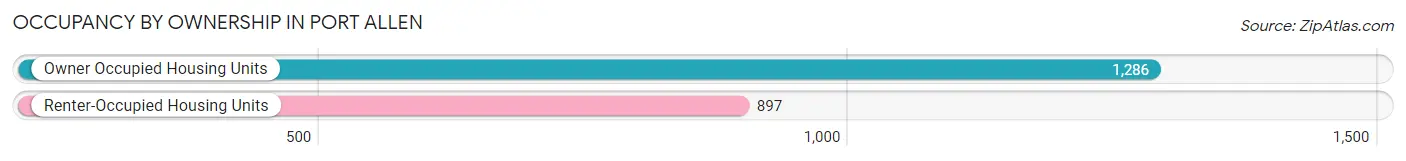
| Occupancy | # Housing Units | % Housing Units |
| Owner Occupied Housing Units | 1,286 | 58.9% |
| Renter-Occupied Housing Units | 897 | 41.1% |
| Total Occupied Housing Units | 2,183 | 100.0% |
Occupancy by Household Size in Port Allen
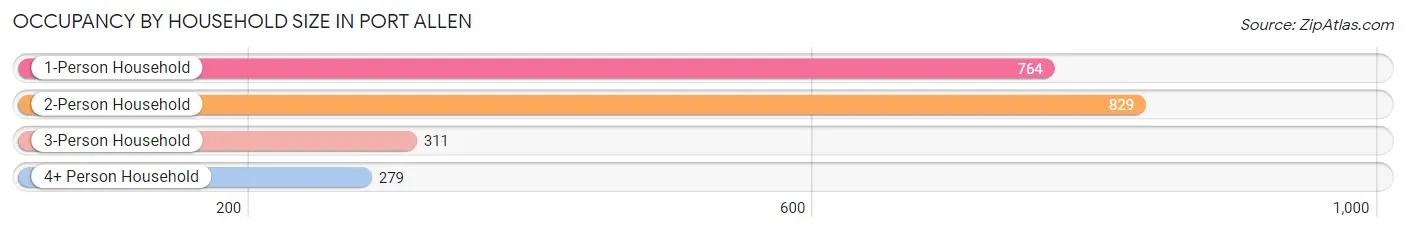
| Household Size | # Housing Units | % Housing Units |
| 1-Person Household | 764 | 35.0% |
| 2-Person Household | 829 | 38.0% |
| 3-Person Household | 311 | 14.2% |
| 4+ Person Household | 279 | 12.8% |
| Total Housing Units | 2,183 | 100.0% |
Occupancy by Ownership by Household Size in Port Allen
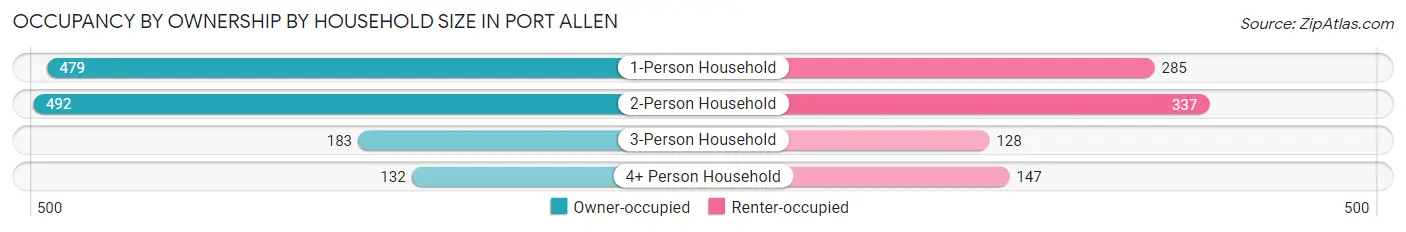
| Household Size | Owner-occupied | Renter-occupied |
| 1-Person Household | 479 (62.7%) | 285 (37.3%) |
| 2-Person Household | 492 (59.4%) | 337 (40.6%) |
| 3-Person Household | 183 (58.8%) | 128 (41.2%) |
| 4+ Person Household | 132 (47.3%) | 147 (52.7%) |
| Total Housing Units | 1,286 (58.9%) | 897 (41.1%) |
Occupancy by Educational Attainment in Port Allen
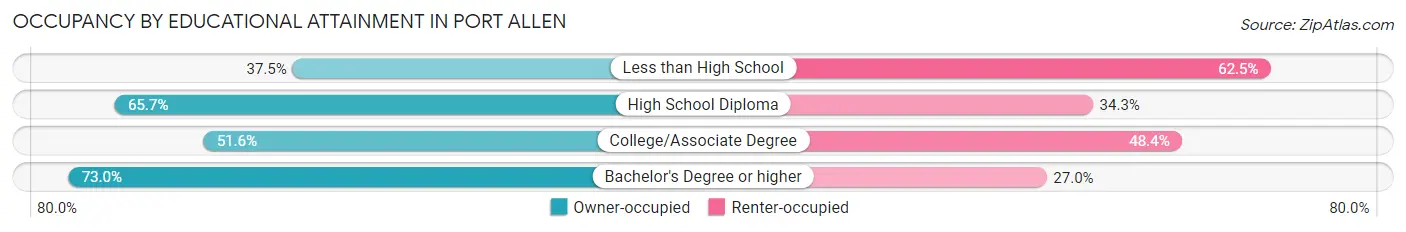
| Household Size | Owner-occupied | Renter-occupied |
| Less than High School | 75 (37.5%) | 125 (62.5%) |
| High School Diploma | 415 (65.7%) | 217 (34.3%) |
| College/Associate Degree | 458 (51.6%) | 430 (48.4%) |
| Bachelor's Degree or higher | 338 (73.0%) | 125 (27.0%) |
Occupancy by Age of Householder in Port Allen
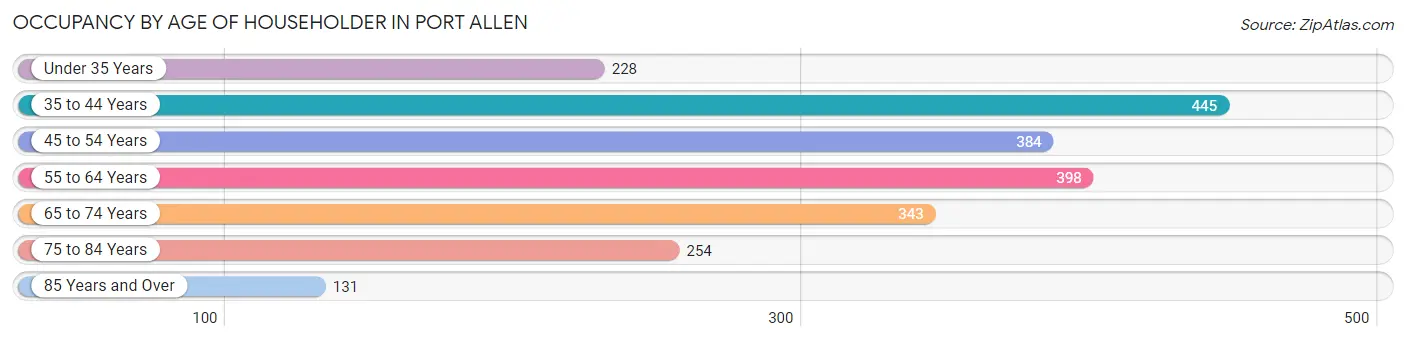
| Age Bracket | # Households | % Households |
| Under 35 Years | 228 | 10.4% |
| 35 to 44 Years | 445 | 20.4% |
| 45 to 54 Years | 384 | 17.6% |
| 55 to 64 Years | 398 | 18.2% |
| 65 to 74 Years | 343 | 15.7% |
| 75 to 84 Years | 254 | 11.6% |
| 85 Years and Over | 131 | 6.0% |
| Total | 2,183 | 100.0% |
Housing Finances in Port Allen
Median Income by Occupancy in Port Allen
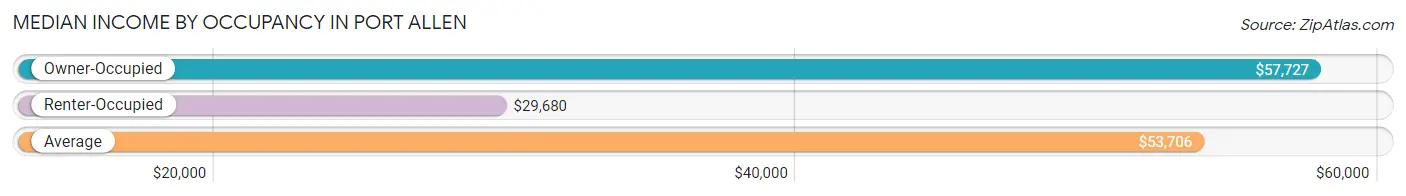
| Occupancy Type | # Households | Median Income |
| Owner-Occupied | 1,286 (58.9%) | $57,727 |
| Renter-Occupied | 897 (41.1%) | $29,680 |
| Average | 2,183 (100.0%) | $53,706 |
Occupancy by Householder Income Bracket in Port Allen
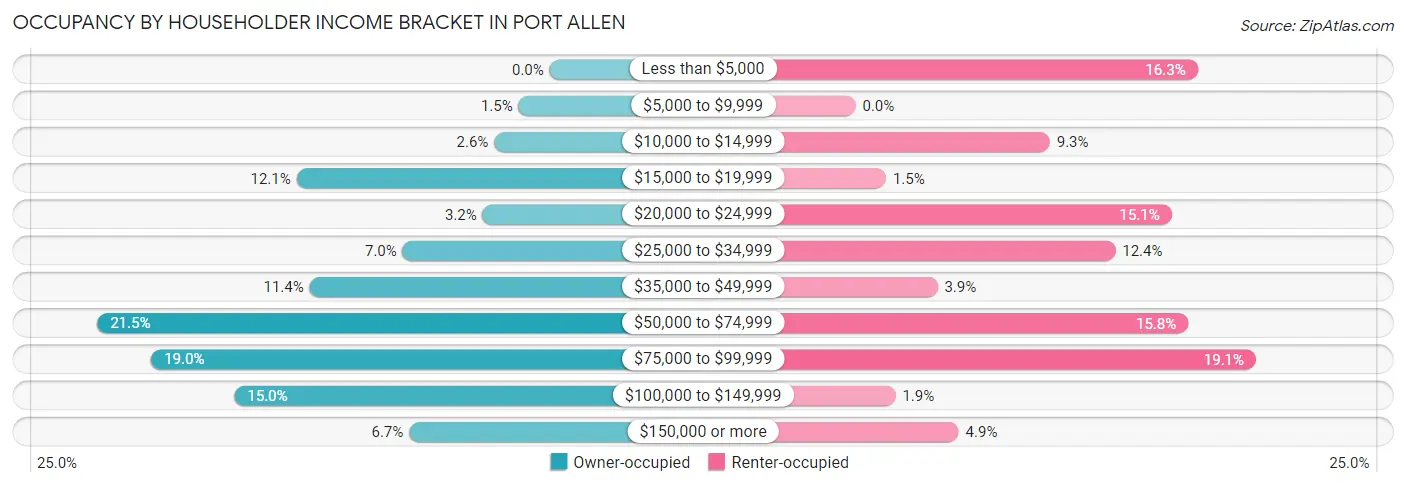
| Income Bracket | Owner-occupied | Renter-occupied |
| Less than $5,000 | 0 (0.0%) | 146 (16.3%) |
| $5,000 to $9,999 | 19 (1.5%) | 0 (0.0%) |
| $10,000 to $14,999 | 34 (2.6%) | 83 (9.2%) |
| $15,000 to $19,999 | 155 (12.0%) | 13 (1.5%) |
| $20,000 to $24,999 | 41 (3.2%) | 135 (15.0%) |
| $25,000 to $34,999 | 90 (7.0%) | 111 (12.4%) |
| $35,000 to $49,999 | 147 (11.4%) | 35 (3.9%) |
| $50,000 to $74,999 | 277 (21.5%) | 142 (15.8%) |
| $75,000 to $99,999 | 244 (19.0%) | 171 (19.1%) |
| $100,000 to $149,999 | 193 (15.0%) | 17 (1.9%) |
| $150,000 or more | 86 (6.7%) | 44 (4.9%) |
| Total | 1,286 (100.0%) | 897 (100.0%) |
Monthly Housing Cost Tiers in Port Allen
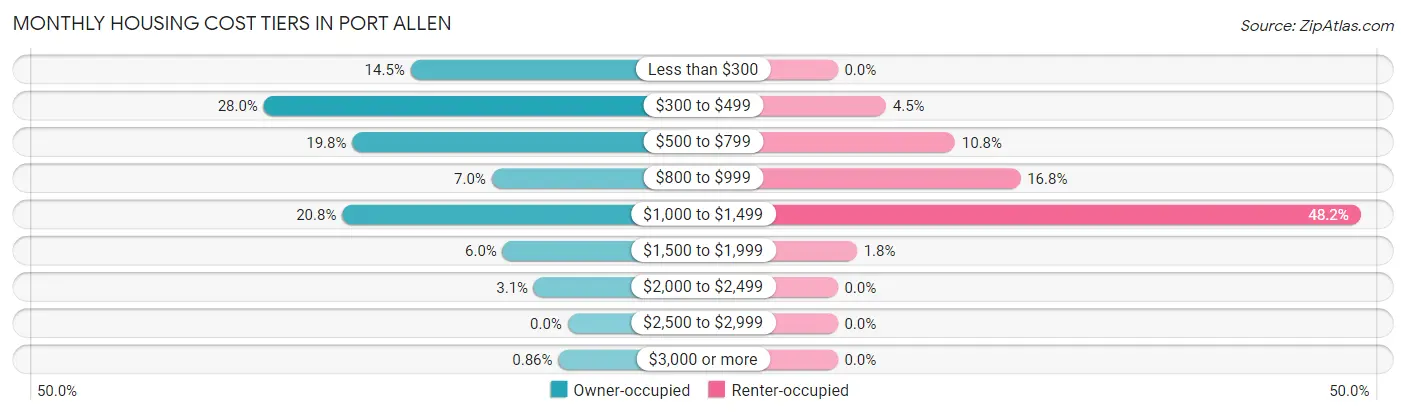
| Monthly Cost | Owner-occupied | Renter-occupied |
| Less than $300 | 186 (14.5%) | 0 (0.0%) |
| $300 to $499 | 360 (28.0%) | 40 (4.5%) |
| $500 to $799 | 255 (19.8%) | 97 (10.8%) |
| $800 to $999 | 90 (7.0%) | 151 (16.8%) |
| $1,000 to $1,499 | 267 (20.8%) | 432 (48.2%) |
| $1,500 to $1,999 | 77 (6.0%) | 16 (1.8%) |
| $2,000 to $2,499 | 40 (3.1%) | 0 (0.0%) |
| $2,500 to $2,999 | 0 (0.0%) | 0 (0.0%) |
| $3,000 or more | 11 (0.9%) | 0 (0.0%) |
| Total | 1,286 (100.0%) | 897 (100.0%) |
Physical Housing Characteristics in Port Allen
Housing Structures in Port Allen
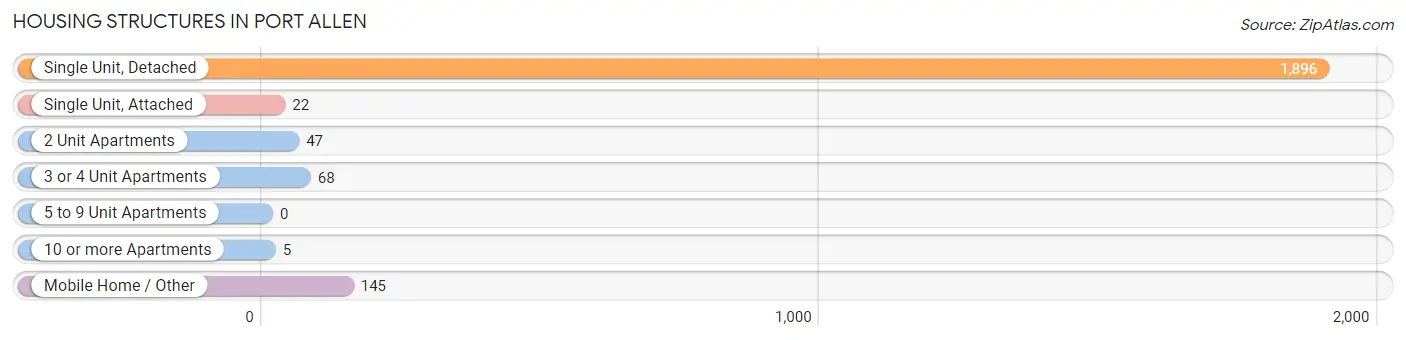
| Structure Type | # Housing Units | % Housing Units |
| Single Unit, Detached | 1,896 | 86.9% |
| Single Unit, Attached | 22 | 1.0% |
| 2 Unit Apartments | 47 | 2.1% |
| 3 or 4 Unit Apartments | 68 | 3.1% |
| 5 to 9 Unit Apartments | 0 | 0.0% |
| 10 or more Apartments | 5 | 0.2% |
| Mobile Home / Other | 145 | 6.6% |
| Total | 2,183 | 100.0% |
Housing Structures by Occupancy in Port Allen
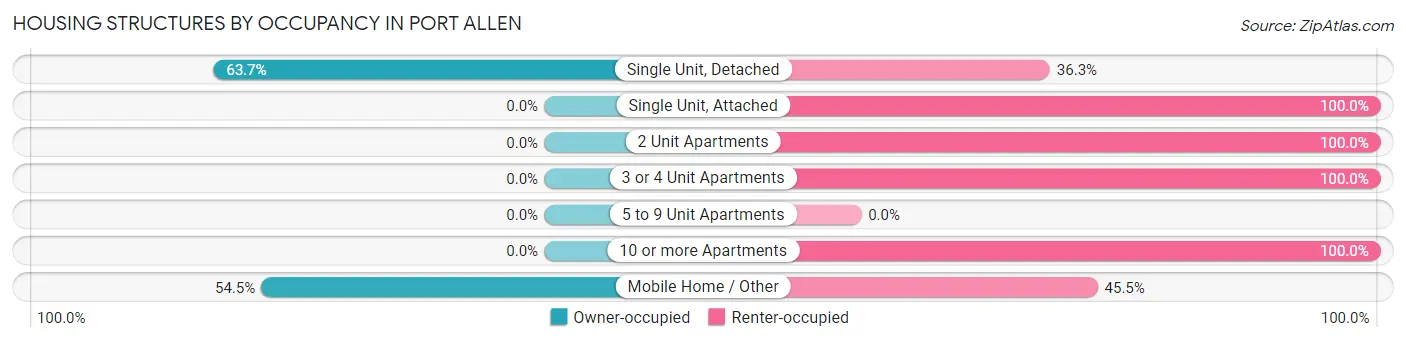
| Structure Type | Owner-occupied | Renter-occupied |
| Single Unit, Detached | 1,207 (63.7%) | 689 (36.3%) |
| Single Unit, Attached | 0 (0.0%) | 22 (100.0%) |
| 2 Unit Apartments | 0 (0.0%) | 47 (100.0%) |
| 3 or 4 Unit Apartments | 0 (0.0%) | 68 (100.0%) |
| 5 to 9 Unit Apartments | 0 (0.0%) | 0 (0.0%) |
| 10 or more Apartments | 0 (0.0%) | 5 (100.0%) |
| Mobile Home / Other | 79 (54.5%) | 66 (45.5%) |
| Total | 1,286 (58.9%) | 897 (41.1%) |
Housing Structures by Number of Rooms in Port Allen
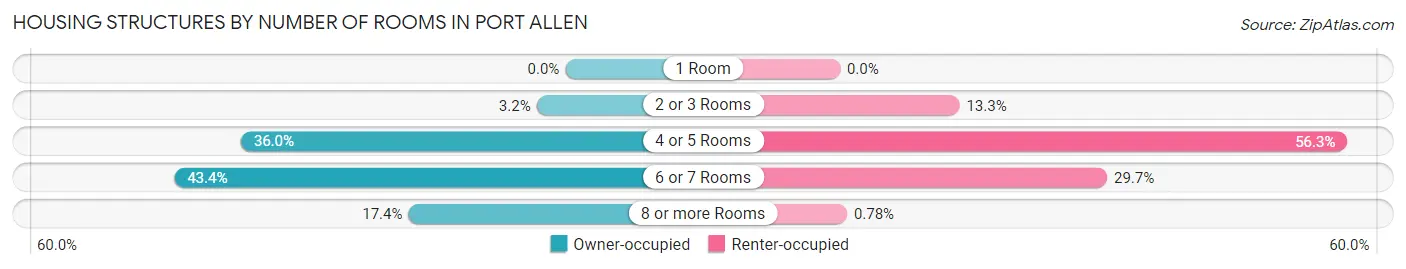
| Number of Rooms | Owner-occupied | Renter-occupied |
| 1 Room | 0 (0.0%) | 0 (0.0%) |
| 2 or 3 Rooms | 41 (3.2%) | 119 (13.3%) |
| 4 or 5 Rooms | 463 (36.0%) | 505 (56.3%) |
| 6 or 7 Rooms | 558 (43.4%) | 266 (29.6%) |
| 8 or more Rooms | 224 (17.4%) | 7 (0.8%) |
| Total | 1,286 (100.0%) | 897 (100.0%) |
Housing Structure by Heating Type in Port Allen
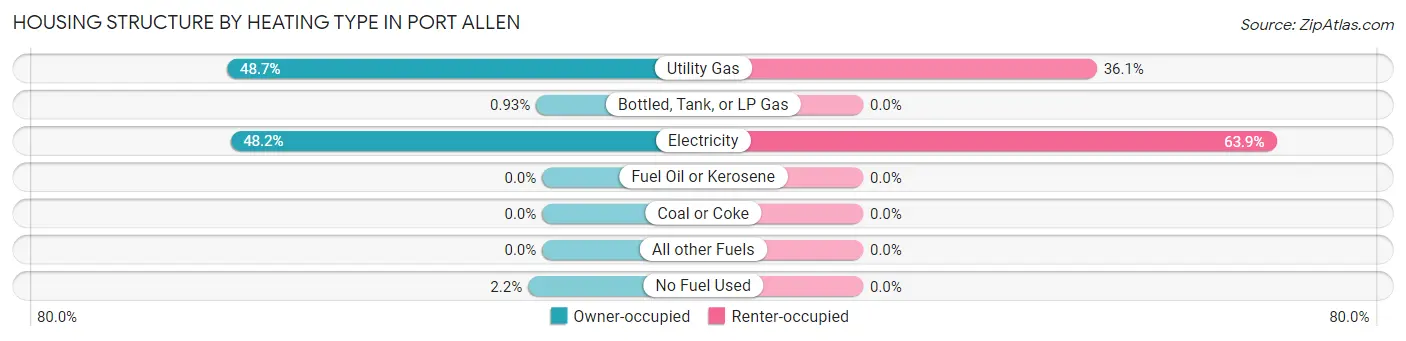
| Heating Type | Owner-occupied | Renter-occupied |
| Utility Gas | 626 (48.7%) | 324 (36.1%) |
| Bottled, Tank, or LP Gas | 12 (0.9%) | 0 (0.0%) |
| Electricity | 620 (48.2%) | 573 (63.9%) |
| Fuel Oil or Kerosene | 0 (0.0%) | 0 (0.0%) |
| Coal or Coke | 0 (0.0%) | 0 (0.0%) |
| All other Fuels | 0 (0.0%) | 0 (0.0%) |
| No Fuel Used | 28 (2.2%) | 0 (0.0%) |
| Total | 1,286 (100.0%) | 897 (100.0%) |
Household Vehicle Usage in Port Allen
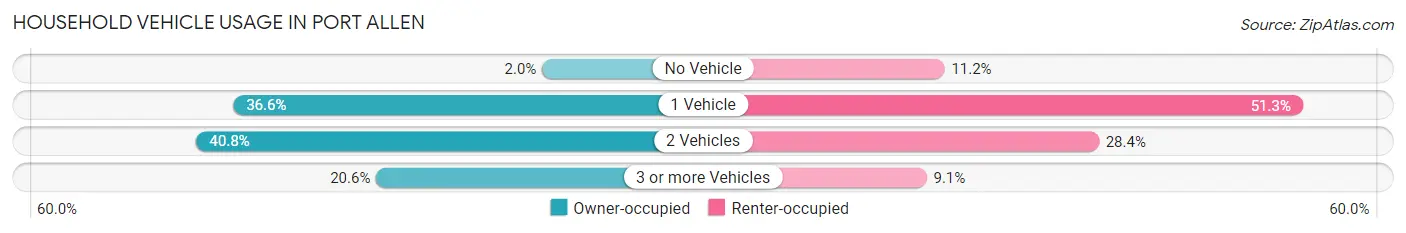
| Vehicles per Household | Owner-occupied | Renter-occupied |
| No Vehicle | 26 (2.0%) | 100 (11.2%) |
| 1 Vehicle | 471 (36.6%) | 460 (51.3%) |
| 2 Vehicles | 524 (40.7%) | 255 (28.4%) |
| 3 or more Vehicles | 265 (20.6%) | 82 (9.1%) |
| Total | 1,286 (100.0%) | 897 (100.0%) |
Real Estate & Mortgages in Port Allen
Real Estate and Mortgage Overview in Port Allen
| Characteristic | Without Mortgage | With Mortgage |
| Housing Units | 799 | 487 |
| Median Property Value | $146,300 | $166,800 |
| Median Household Income | $55,440 | $56 |
| Monthly Housing Costs | $396 | $11 |
| Real Estate Taxes | $199 | $31 |
Property Value by Mortgage Status in Port Allen
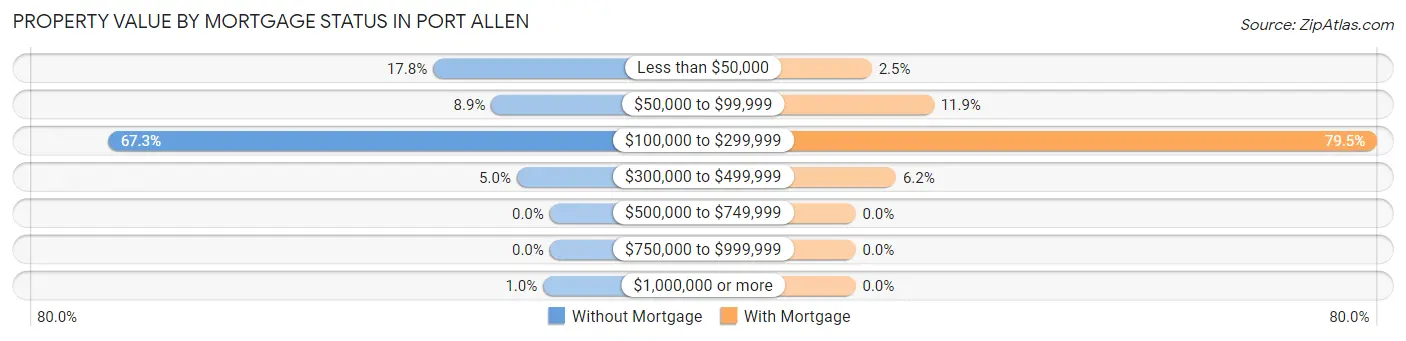
| Property Value | Without Mortgage | With Mortgage |
| Less than $50,000 | 142 (17.8%) | 12 (2.5%) |
| $50,000 to $99,999 | 71 (8.9%) | 58 (11.9%) |
| $100,000 to $299,999 | 538 (67.3%) | 387 (79.5%) |
| $300,000 to $499,999 | 40 (5.0%) | 30 (6.2%) |
| $500,000 to $749,999 | 0 (0.0%) | 0 (0.0%) |
| $750,000 to $999,999 | 0 (0.0%) | 0 (0.0%) |
| $1,000,000 or more | 8 (1.0%) | 0 (0.0%) |
| Total | 799 (100.0%) | 487 (100.0%) |
Household Income by Mortgage Status in Port Allen
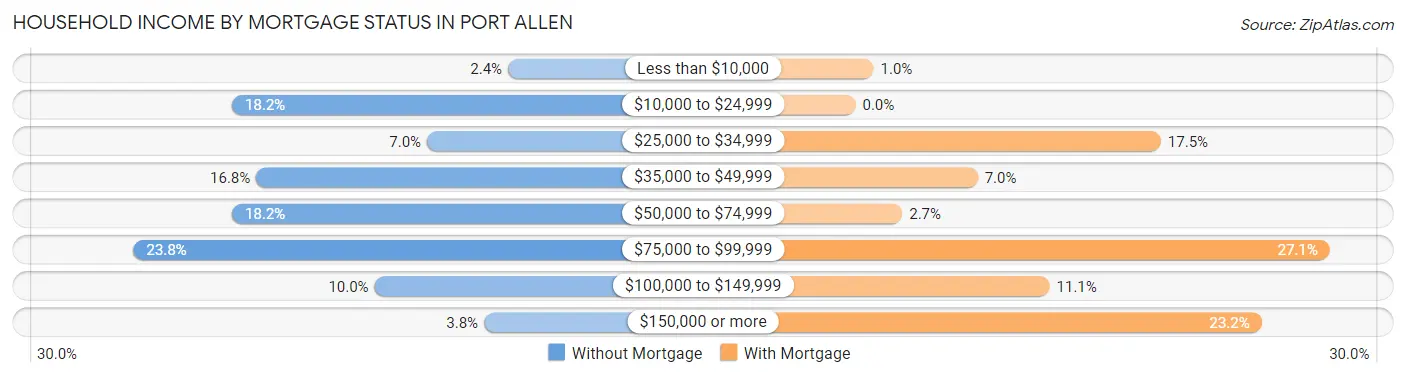
| Household Income | Without Mortgage | With Mortgage |
| Less than $10,000 | 19 (2.4%) | 5 (1.0%) |
| $10,000 to $24,999 | 145 (18.1%) | 0 (0.0%) |
| $25,000 to $34,999 | 56 (7.0%) | 85 (17.4%) |
| $35,000 to $49,999 | 134 (16.8%) | 34 (7.0%) |
| $50,000 to $74,999 | 145 (18.1%) | 13 (2.7%) |
| $75,000 to $99,999 | 190 (23.8%) | 132 (27.1%) |
| $100,000 to $149,999 | 80 (10.0%) | 54 (11.1%) |
| $150,000 or more | 30 (3.7%) | 113 (23.2%) |
| Total | 799 (100.0%) | 487 (100.0%) |
Property Value to Household Income Ratio in Port Allen
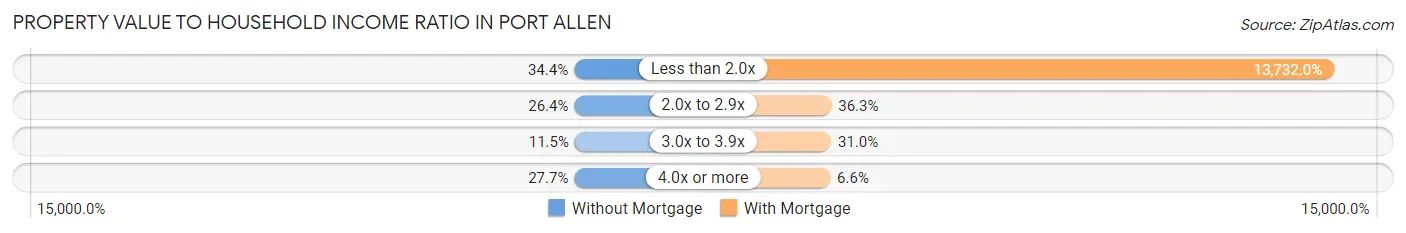
| Value-to-Income Ratio | Without Mortgage | With Mortgage |
| Less than 2.0x | 275 (34.4%) | 66,875 (13,732.0%) |
| 2.0x to 2.9x | 211 (26.4%) | 177 (36.3%) |
| 3.0x to 3.9x | 92 (11.5%) | 151 (31.0%) |
| 4.0x or more | 221 (27.7%) | 32 (6.6%) |
| Total | 799 (100.0%) | 487 (100.0%) |
Real Estate Taxes by Mortgage Status in Port Allen
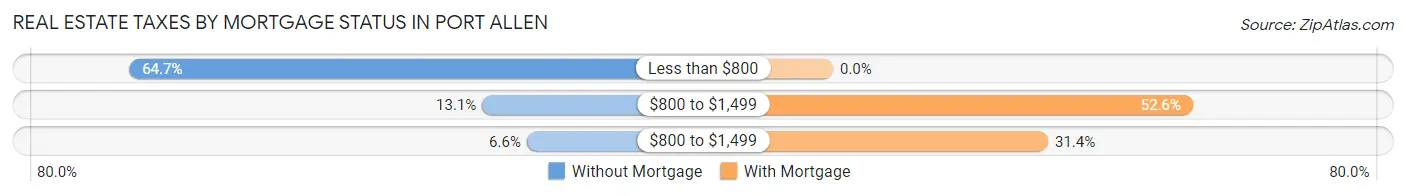
| Property Taxes | Without Mortgage | With Mortgage |
| Less than $800 | 517 (64.7%) | 0 (0.0%) |
| $800 to $1,499 | 105 (13.1%) | 256 (52.6%) |
| $800 to $1,499 | 53 (6.6%) | 153 (31.4%) |
| Total | 799 (100.0%) | 487 (100.0%) |
Health & Disability in Port Allen
Health Insurance Coverage by Age in Port Allen
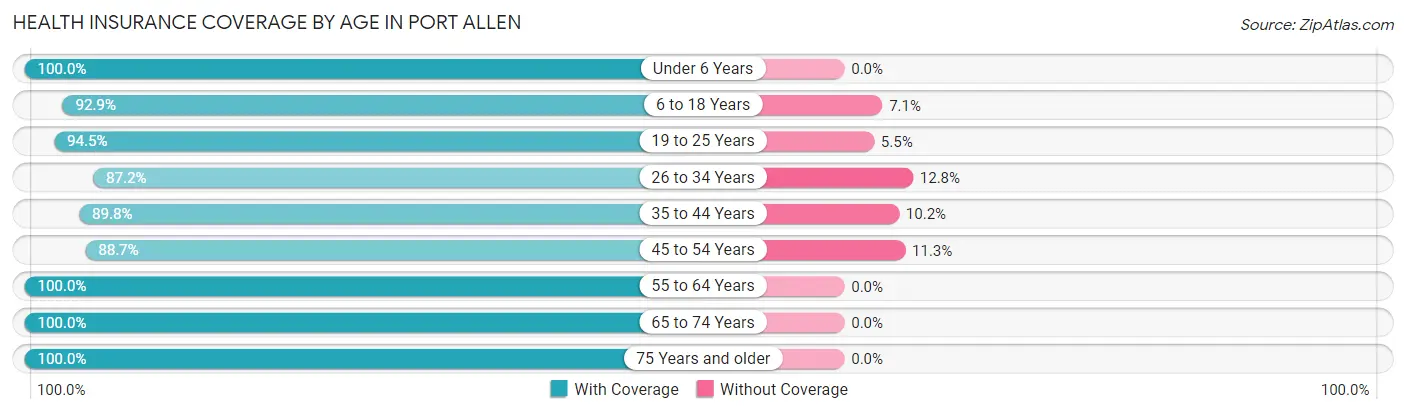
| Age Bracket | With Coverage | Without Coverage |
| Under 6 Years | 203 (100.0%) | 0 (0.0%) |
| 6 to 18 Years | 630 (92.9%) | 48 (7.1%) |
| 19 to 25 Years | 308 (94.5%) | 18 (5.5%) |
| 26 to 34 Years | 375 (87.2%) | 55 (12.8%) |
| 35 to 44 Years | 759 (89.8%) | 86 (10.2%) |
| 45 to 54 Years | 594 (88.7%) | 76 (11.3%) |
| 55 to 64 Years | 588 (100.0%) | 0 (0.0%) |
| 65 to 74 Years | 562 (100.0%) | 0 (0.0%) |
| 75 Years and older | 639 (100.0%) | 0 (0.0%) |
| Total | 4,658 (94.3%) | 283 (5.7%) |
Health Insurance Coverage by Citizenship Status in Port Allen
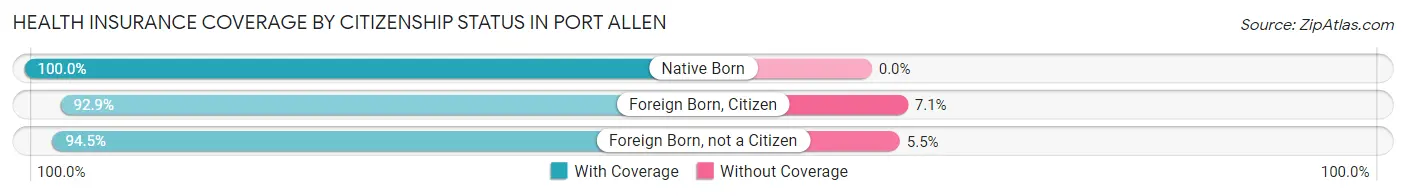
| Citizenship Status | With Coverage | Without Coverage |
| Native Born | 203 (100.0%) | 0 (0.0%) |
| Foreign Born, Citizen | 630 (92.9%) | 48 (7.1%) |
| Foreign Born, not a Citizen | 308 (94.5%) | 18 (5.5%) |
Health Insurance Coverage by Household Income in Port Allen
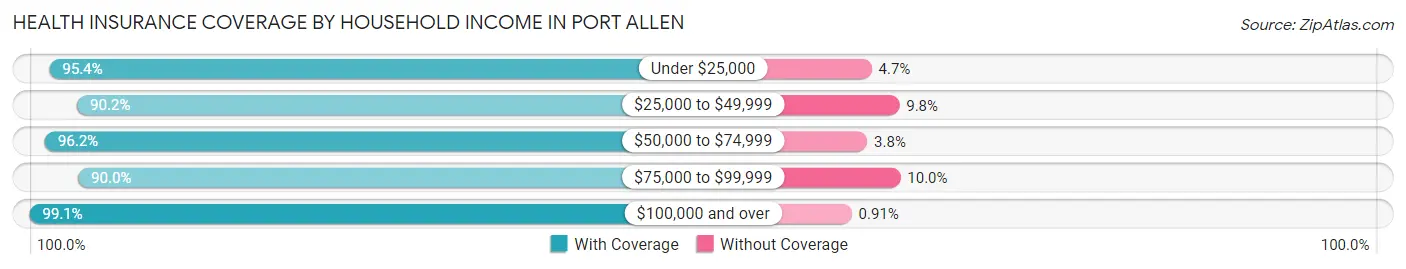
| Household Income | With Coverage | Without Coverage |
| Under $25,000 | 964 (95.4%) | 47 (4.6%) |
| $25,000 to $49,999 | 743 (90.2%) | 81 (9.8%) |
| $50,000 to $74,999 | 1,034 (96.2%) | 41 (3.8%) |
| $75,000 to $99,999 | 923 (90.0%) | 103 (10.0%) |
| $100,000 and over | 870 (99.1%) | 8 (0.9%) |
Public vs Private Health Insurance Coverage by Age in Port Allen
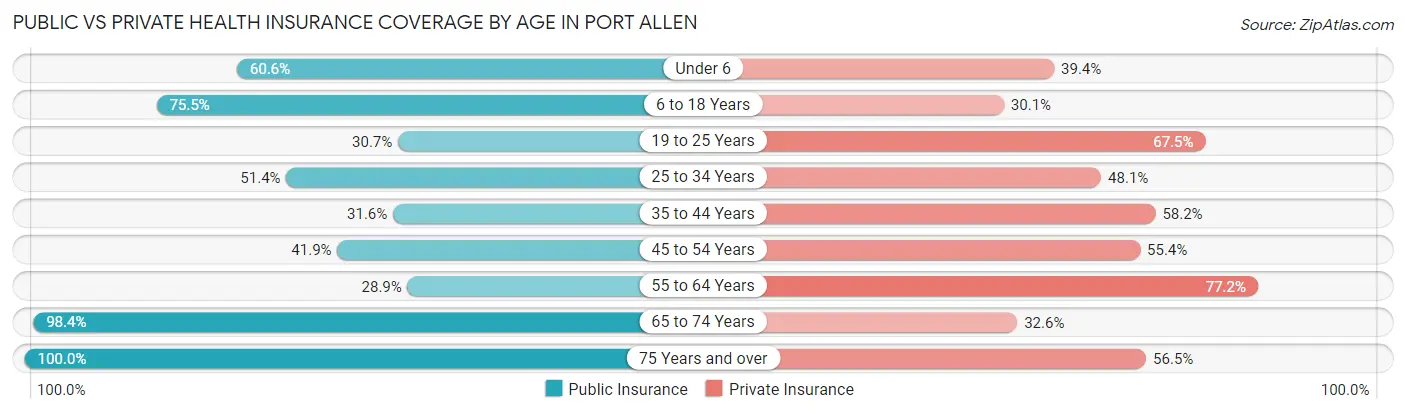
| Age Bracket | Public Insurance | Private Insurance |
| Under 6 | 123 (60.6%) | 80 (39.4%) |
| 6 to 18 Years | 512 (75.5%) | 204 (30.1%) |
| 19 to 25 Years | 100 (30.7%) | 220 (67.5%) |
| 25 to 34 Years | 221 (51.4%) | 207 (48.1%) |
| 35 to 44 Years | 267 (31.6%) | 492 (58.2%) |
| 45 to 54 Years | 281 (41.9%) | 371 (55.4%) |
| 55 to 64 Years | 170 (28.9%) | 454 (77.2%) |
| 65 to 74 Years | 553 (98.4%) | 183 (32.6%) |
| 75 Years and over | 639 (100.0%) | 361 (56.5%) |
| Total | 2,866 (58.0%) | 2,572 (52.0%) |
Disability Status by Sex by Age in Port Allen
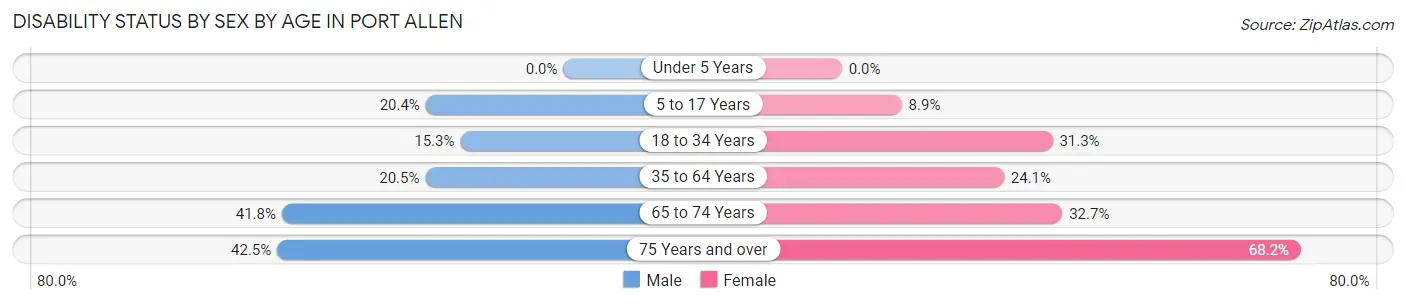
| Age Bracket | Male | Female |
| Under 5 Years | 0 (0.0%) | 0 (0.0%) |
| 5 to 17 Years | 65 (20.4%) | 32 (8.9%) |
| 18 to 34 Years | 56 (15.3%) | 122 (31.3%) |
| 35 to 64 Years | 190 (20.5%) | 283 (24.1%) |
| 65 to 74 Years | 74 (41.8%) | 126 (32.7%) |
| 75 Years and over | 102 (42.5%) | 272 (68.2%) |
Disability Class by Sex by Age in Port Allen
Disability Class: Hearing Difficulty
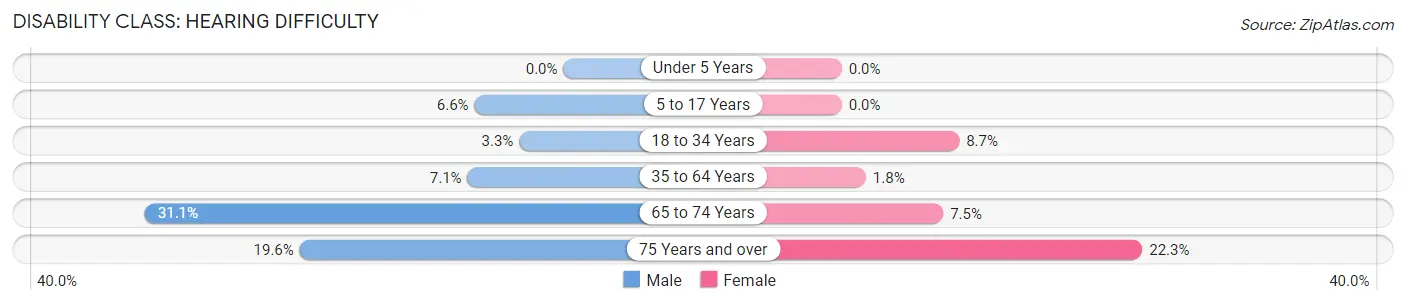
| Age Bracket | Male | Female |
| Under 5 Years | 0 (0.0%) | 0 (0.0%) |
| 5 to 17 Years | 21 (6.6%) | 0 (0.0%) |
| 18 to 34 Years | 12 (3.3%) | 34 (8.7%) |
| 35 to 64 Years | 66 (7.1%) | 21 (1.8%) |
| 65 to 74 Years | 55 (31.1%) | 29 (7.5%) |
| 75 Years and over | 47 (19.6%) | 89 (22.3%) |
Disability Class: Vision Difficulty
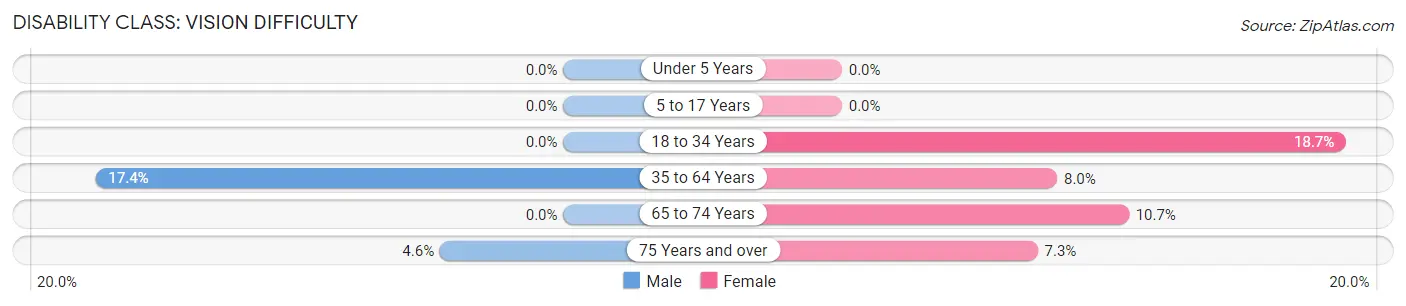
| Age Bracket | Male | Female |
| Under 5 Years | 0 (0.0%) | 0 (0.0%) |
| 5 to 17 Years | 0 (0.0%) | 0 (0.0%) |
| 18 to 34 Years | 0 (0.0%) | 73 (18.7%) |
| 35 to 64 Years | 161 (17.4%) | 94 (8.0%) |
| 65 to 74 Years | 0 (0.0%) | 41 (10.6%) |
| 75 Years and over | 11 (4.6%) | 29 (7.3%) |
Disability Class: Cognitive Difficulty
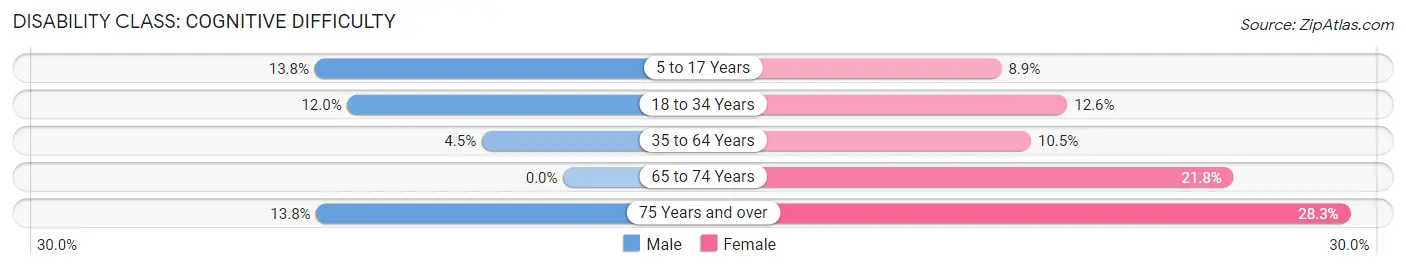
| Age Bracket | Male | Female |
| 5 to 17 Years | 44 (13.8%) | 32 (8.9%) |
| 18 to 34 Years | 44 (12.0%) | 49 (12.6%) |
| 35 to 64 Years | 42 (4.5%) | 124 (10.5%) |
| 65 to 74 Years | 0 (0.0%) | 84 (21.8%) |
| 75 Years and over | 33 (13.8%) | 113 (28.3%) |
Disability Class: Ambulatory Difficulty
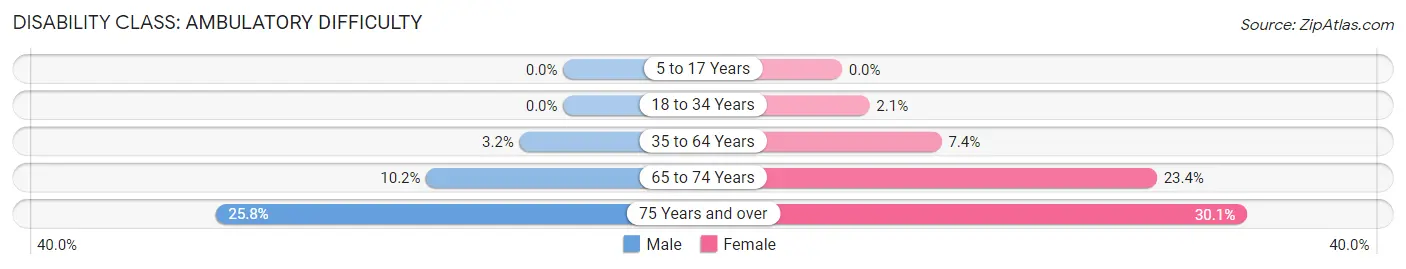
| Age Bracket | Male | Female |
| 5 to 17 Years | 0 (0.0%) | 0 (0.0%) |
| 18 to 34 Years | 0 (0.0%) | 8 (2.1%) |
| 35 to 64 Years | 30 (3.2%) | 87 (7.4%) |
| 65 to 74 Years | 18 (10.2%) | 90 (23.4%) |
| 75 Years and over | 62 (25.8%) | 120 (30.1%) |
Disability Class: Self-Care Difficulty
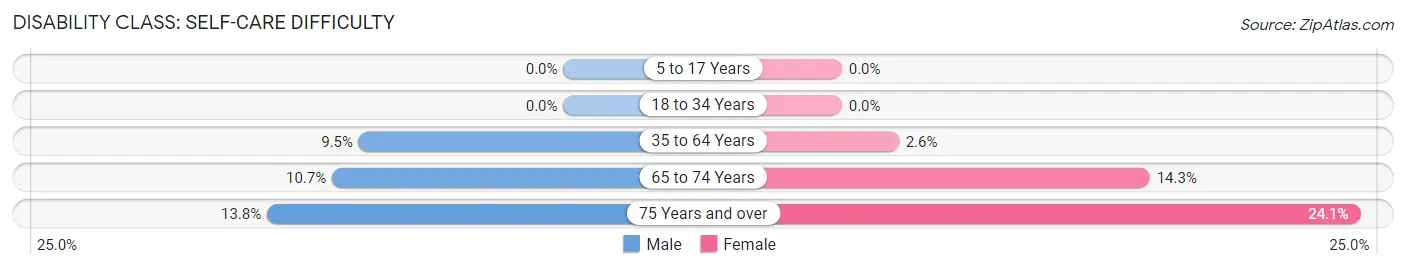
| Age Bracket | Male | Female |
| 5 to 17 Years | 0 (0.0%) | 0 (0.0%) |
| 18 to 34 Years | 0 (0.0%) | 0 (0.0%) |
| 35 to 64 Years | 88 (9.5%) | 31 (2.6%) |
| 65 to 74 Years | 19 (10.7%) | 55 (14.3%) |
| 75 Years and over | 33 (13.8%) | 96 (24.1%) |
Technology Access in Port Allen
Computing Device Access in Port Allen
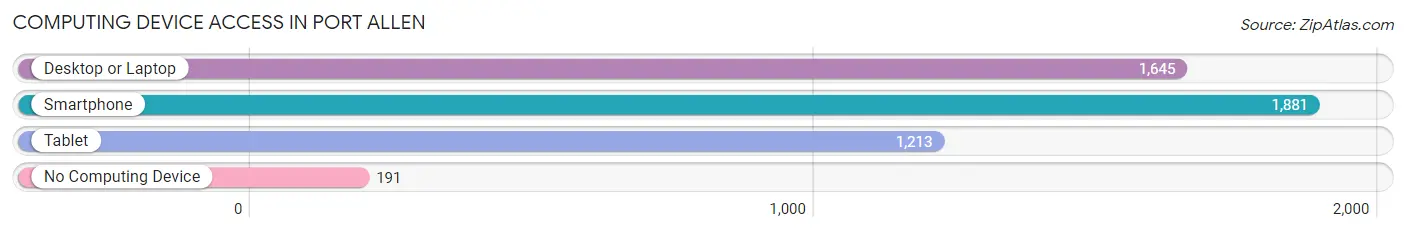
| Device Type | # Households | % Households |
| Desktop or Laptop | 1,645 | 75.4% |
| Smartphone | 1,881 | 86.2% |
| Tablet | 1,213 | 55.6% |
| No Computing Device | 191 | 8.7% |
| Total | 2,183 | 100.0% |
Internet Access in Port Allen
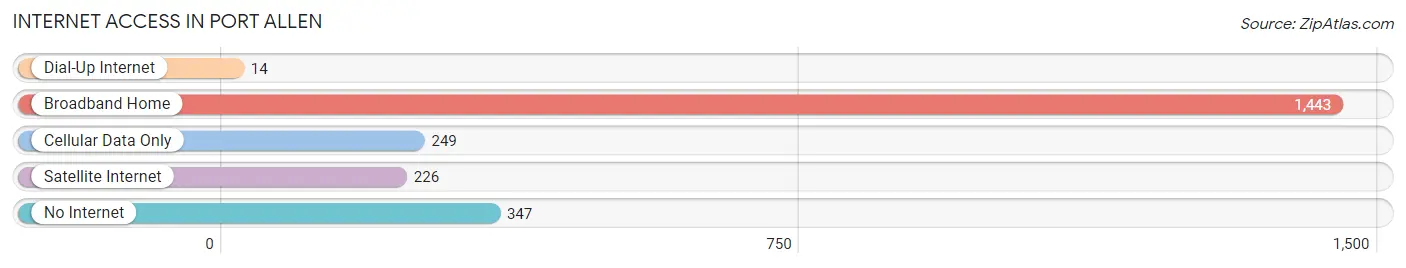
| Internet Type | # Households | % Households |
| Dial-Up Internet | 14 | 0.6% |
| Broadband Home | 1,443 | 66.1% |
| Cellular Data Only | 249 | 11.4% |
| Satellite Internet | 226 | 10.3% |
| No Internet | 347 | 15.9% |
| Total | 2,183 | 100.0% |
Port Allen Summary
History
Port Allen is a city located in West Baton Rouge Parish, Louisiana. It is situated on the west bank of the Mississippi River, across from the city of Baton Rouge. The city was founded in 1809 and incorporated in 1838. It was named after Governor Henry Watkins Allen, who served as the state's governor from 1864 to 1868.
Port Allen has a rich history that dates back to the early 1800s. The city was originally inhabited by Native Americans, including the Chitimacha and Houma tribes. The first European settlers arrived in the area in the late 1700s, and the city was officially founded in 1809.
In the early 1800s, Port Allen was a bustling port town, with a thriving economy based on the shipping and trading of goods. The city was also home to a number of plantations, which produced cotton, sugar, and other crops.
In the mid-1800s, the city experienced a period of growth and prosperity. The city was home to a number of businesses, including a cotton gin, a sawmill, and a brickyard. The city also had a number of churches, schools, and other institutions.
In the late 1800s, the city experienced a period of decline. The economy shifted away from shipping and trading, and the city's population began to decline. The city was also hit hard by the Great Depression, and many of the businesses and institutions in the city closed.
In the mid-1900s, the city experienced a period of revitalization. The economy shifted back to shipping and trading, and the city's population began to grow again. The city also experienced a period of growth in the late 1900s, as new businesses and institutions opened in the city.
Geography
Port Allen is located in West Baton Rouge Parish, Louisiana. It is situated on the west bank of the Mississippi River, across from the city of Baton Rouge. The city covers an area of 4.2 square miles, and has a population of 5,180 people, as of the 2010 census.
The city is located in a flat, low-lying area, with an elevation of just 10 feet above sea level. The city is bordered by the Mississippi River to the east, and the city of Baton Rouge to the west. The city is also bordered by the cities of Addis and Brusly to the north, and the city of Port Vincent to the south.
The climate in Port Allen is humid subtropical, with hot, humid summers and mild winters. The average temperature in the summer is around 90 degrees Fahrenheit, and the average temperature in the winter is around 50 degrees Fahrenheit.
Economy
The economy of Port Allen is largely based on shipping and trading. The city is home to a number of businesses, including a cotton gin, a sawmill, and a brickyard. The city is also home to a number of manufacturing companies, including a paper mill and a chemical plant.
The city is also home to a number of retail stores, restaurants, and other businesses. The city is also home to a number of government offices, including the West Baton Rouge Parish Courthouse.
The city is also home to a number of educational institutions, including the West Baton Rouge Parish School System, the West Baton Rouge Parish Community College, and the Louisiana State University Agricultural Center.
Demographics
As of the 2010 census, the population of Port Allen was 5,180 people. The racial makeup of the city was 65.3% White, 30.2% African American, 0.3% Native American, 0.7% Asian, 0.1% Pacific Islander, and 3.4% from other races.
The median household income in the city was $37,917, and the median family income was $45,938. The per capita income in the city was $19,945. The poverty rate in the city was 22.3%.
Conclusion
Port Allen is a city located in West Baton Rouge Parish, Louisiana. It is situated on the west bank of the Mississippi River, across from the city of Baton Rouge. The city was founded in 1809 and incorporated in 1838. It has a rich history that dates back to the early 1800s, and has experienced periods of growth and decline throughout its history. The economy of the city is largely based on shipping and trading, and the city is home to a number of businesses, government offices, and educational institutions. As of the 2010 census, the population of Port Allen was 5,180 people, with a median household income of $37,917 and a poverty rate of 22.3%.
Common Questions
What is Per Capita Income in Port Allen?
Per Capita income in Port Allen is $27,621.
What is the Median Family Income in Port Allen?
Median Family Income in Port Allen is $57,409.
What is the Median Household income in Port Allen?
Median Household Income in Port Allen is $53,706.
What is Income or Wage Gap in Port Allen?
Income or Wage Gap in Port Allen is 13.9%.
Women in Port Allen earn 86.1 cents for every dollar earned by a man.
What is Inequality or Gini Index in Port Allen?
Inequality or Gini Index in Port Allen is 0.44.
What is the Total Population of Port Allen?
Total Population of Port Allen is 4,956.
What is the Total Male Population of Port Allen?
Total Male Population of Port Allen is 2,060.
What is the Total Female Population of Port Allen?
Total Female Population of Port Allen is 2,896.
What is the Ratio of Males per 100 Females in Port Allen?
There are 71.13 Males per 100 Females in Port Allen.
What is the Ratio of Females per 100 Males in Port Allen?
There are 140.58 Females per 100 Males in Port Allen.
What is the Median Population Age in Port Allen?
Median Population Age in Port Allen is 44.9 Years.
What is the Average Family Size in Port Allen
Average Family Size in Port Allen is 2.9 People.
What is the Average Household Size in Port Allen
Average Household Size in Port Allen is 2.2 People.
How Large is the Labor Force in Port Allen?
There are 2,462 People in the Labor Forcein in Port Allen.
What is the Percentage of People in the Labor Force in Port Allen?
58.8% of People are in the Labor Force in Port Allen.
What is the Unemployment Rate in Port Allen?
Unemployment Rate in Port Allen is 8.5%.