Pitkin, LA Map & Demographics
Pitkin Map
Pitkin Overview
$44,481
PER CAPITA INCOME
$84,167
AVG FAMILY INCOME
$105,610
AVG HOUSEHOLD INCOME
0.20
INEQUALITY / GINI INDEX
381
TOTAL POPULATION
282
MALE POPULATION
99
FEMALE POPULATION
284.85
MALES / 100 FEMALES
35.11
FEMALES / 100 MALES
41.6
MEDIAN AGE
2.8
AVG FAMILY SIZE
2.6
AVG HOUSEHOLD SIZE
200
LABOR FORCE [ PEOPLE ]
62.9%
PERCENT IN LABOR FORCE
Pitkin Zip Codes
Pitkin Area Codes
Income in Pitkin
Income Overview in Pitkin
Per Capita Income in Pitkin is $44,481, while median incomes of families and households are $84,167 and $105,610 respectively.
| Characteristic | Number | Measure |
| Per Capita Income | 381 | $44,481 |
| Median Family Income | 64 | $84,167 |
| Mean Family Income | 64 | $78,478 |
| Median Household Income | 146 | $105,610 |
| Mean Household Income | 146 | $94,751 |
| Income Deficit | 64 | $0 |
| Wage / Income Gap (%) | 381 | 0.00% |
| Wage / Income Gap ($) | 381 | 100.00¢ per $1 |
| Gini / Inequality Index | 381 | 0.20 |
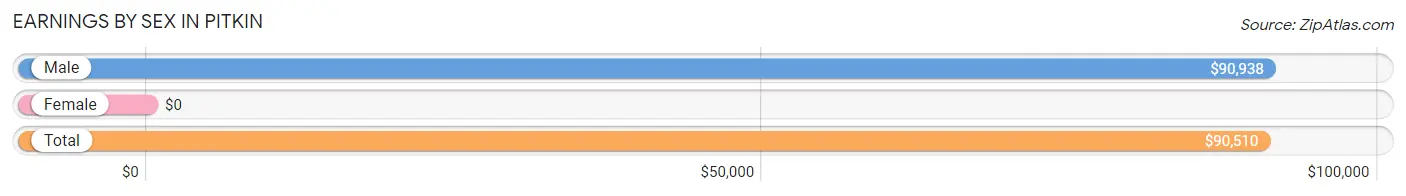
Earnings by Sex in Pitkin
| Sex | Number | Average Earnings |
| Male | 172 (80.7%) | $90,938 |
| Female | 41 (19.3%) | $0 |
| Total | 213 (100.0%) | $90,510 |
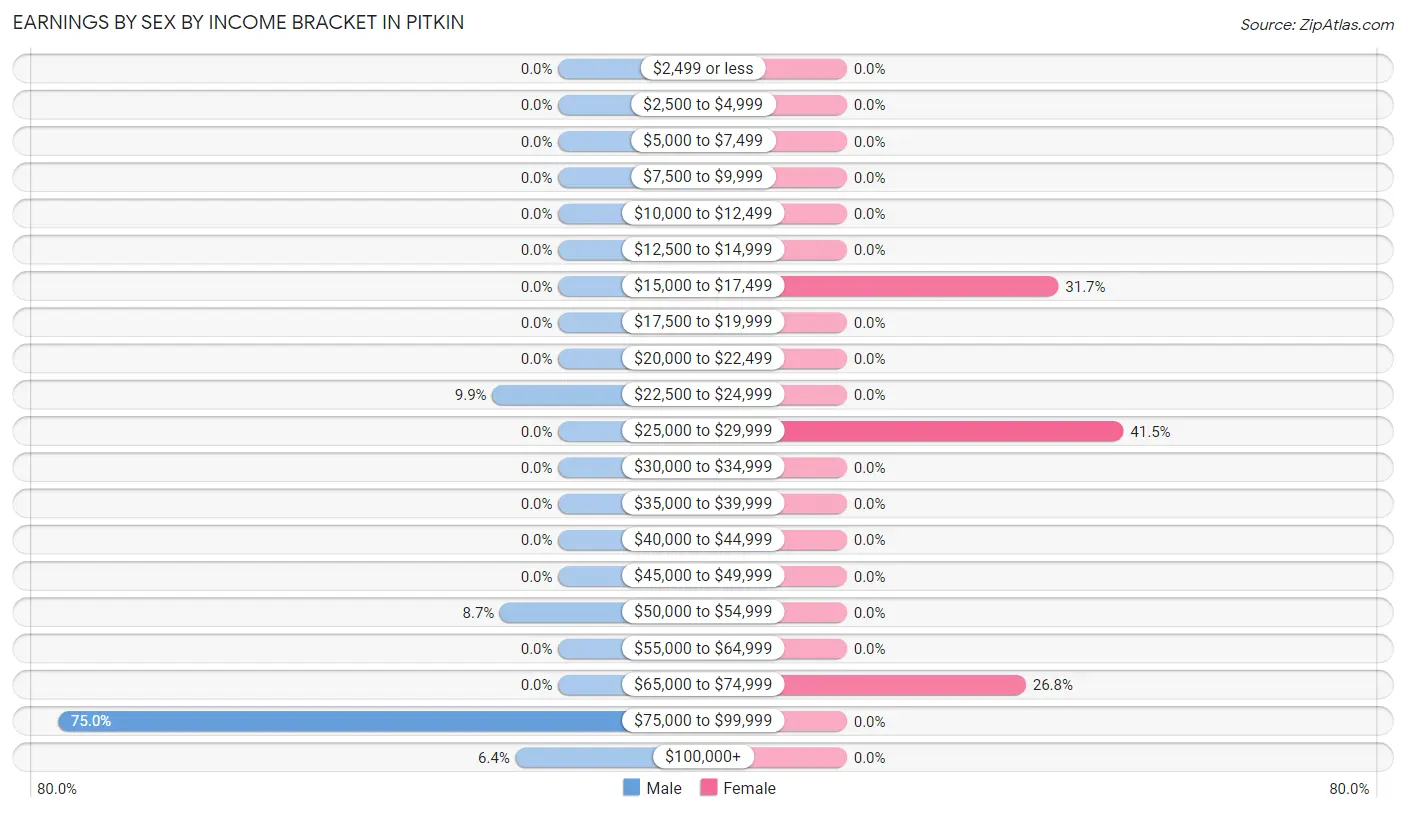
Earnings by Sex by Income Bracket in Pitkin
The most common earnings brackets in Pitkin are $75,000 to $99,999 for men (129 | 75.0%) and $25,000 to $29,999 for women (17 | 41.5%).
| Income | Male | Female |
| $2,499 or less | 0 (0.0%) | 0 (0.0%) |
| $2,500 to $4,999 | 0 (0.0%) | 0 (0.0%) |
| $5,000 to $7,499 | 0 (0.0%) | 0 (0.0%) |
| $7,500 to $9,999 | 0 (0.0%) | 0 (0.0%) |
| $10,000 to $12,499 | 0 (0.0%) | 0 (0.0%) |
| $12,500 to $14,999 | 0 (0.0%) | 0 (0.0%) |
| $15,000 to $17,499 | 0 (0.0%) | 13 (31.7%) |
| $17,500 to $19,999 | 0 (0.0%) | 0 (0.0%) |
| $20,000 to $22,499 | 0 (0.0%) | 0 (0.0%) |
| $22,500 to $24,999 | 17 (9.9%) | 0 (0.0%) |
| $25,000 to $29,999 | 0 (0.0%) | 17 (41.5%) |
| $30,000 to $34,999 | 0 (0.0%) | 0 (0.0%) |
| $35,000 to $39,999 | 0 (0.0%) | 0 (0.0%) |
| $40,000 to $44,999 | 0 (0.0%) | 0 (0.0%) |
| $45,000 to $49,999 | 0 (0.0%) | 0 (0.0%) |
| $50,000 to $54,999 | 15 (8.7%) | 0 (0.0%) |
| $55,000 to $64,999 | 0 (0.0%) | 0 (0.0%) |
| $65,000 to $74,999 | 0 (0.0%) | 11 (26.8%) |
| $75,000 to $99,999 | 129 (75.0%) | 0 (0.0%) |
| $100,000+ | 11 (6.4%) | 0 (0.0%) |
| Total | 172 (100.0%) | 41 (100.0%) |
Earnings by Sex by Educational Attainment in Pitkin
| Educational Attainment | Male Income | Female Income |
| Less than High School | - | - |
| High School Diploma | - | - |
| College or Associate's Degree | - | - |
| Bachelor's Degree | - | - |
| Graduate Degree | - | - |
| Total | $91,115 | $0 |
Family Income in Pitkin
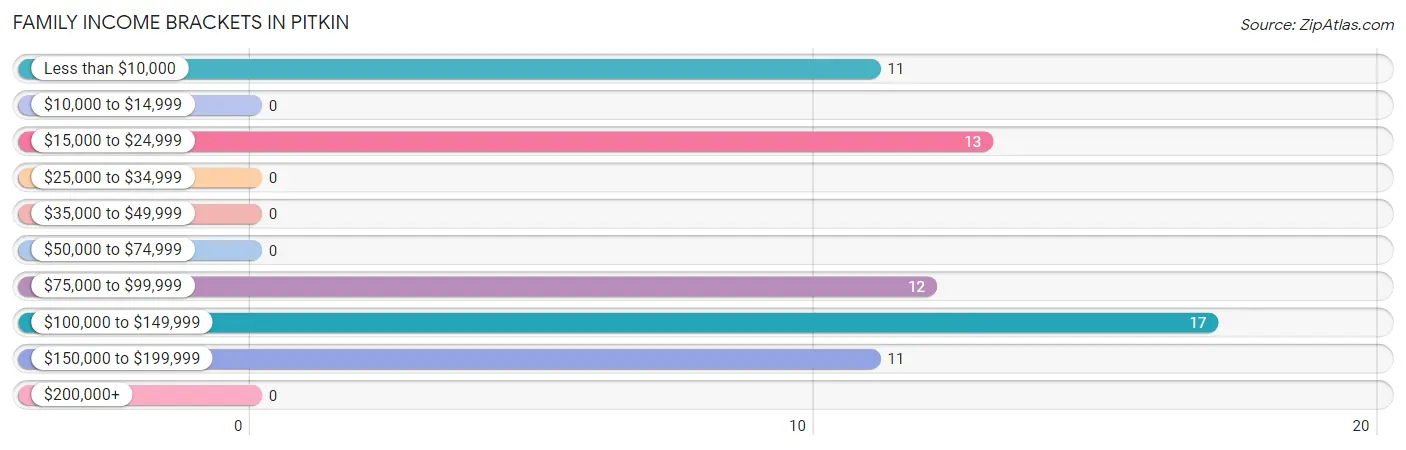
Family Income Brackets in Pitkin
According to the Pitkin family income data, there are 17 families falling into the $100,000 to $149,999 income range, which is the most common income bracket and makes up 26.6% of all families.
| Income Bracket | # Families | % Families |
| Less than $10,000 | 11 | 17.2% |
| $10,000 to $14,999 | 0 | 0.0% |
| $15,000 to $24,999 | 13 | 20.3% |
| $25,000 to $34,999 | 0 | 0.0% |
| $35,000 to $49,999 | 0 | 0.0% |
| $50,000 to $74,999 | 0 | 0.0% |
| $75,000 to $99,999 | 12 | 18.8% |
| $100,000 to $149,999 | 17 | 26.6% |
| $150,000 to $199,999 | 11 | 17.2% |
| $200,000+ | 0 | 0.0% |
Family Income by Famaliy Size in Pitkin
| Income Bracket | # Families | Median Income |
| 2-Person Families | 24 (37.5%) | $0 |
| 3-Person Families | 17 (26.6%) | $0 |
| 4-Person Families | 23 (35.9%) | $0 |
| 5-Person Families | 0 (0.0%) | $0 |
| 6-Person Families | 0 (0.0%) | $0 |
| 7+ Person Families | 0 (0.0%) | $0 |
| Total | 64 (100.0%) | $84,167 |
Family Income by Number of Earners in Pitkin
| Number of Earners | # Families | Median Income |
| No Earners | 11 (17.2%) | $0 |
| 1 Earner | 25 (39.1%) | $0 |
| 2 Earners | 11 (17.2%) | $0 |
| 3+ Earners | 17 (26.6%) | $0 |
| Total | 64 (100.0%) | $84,167 |
Household Income in Pitkin
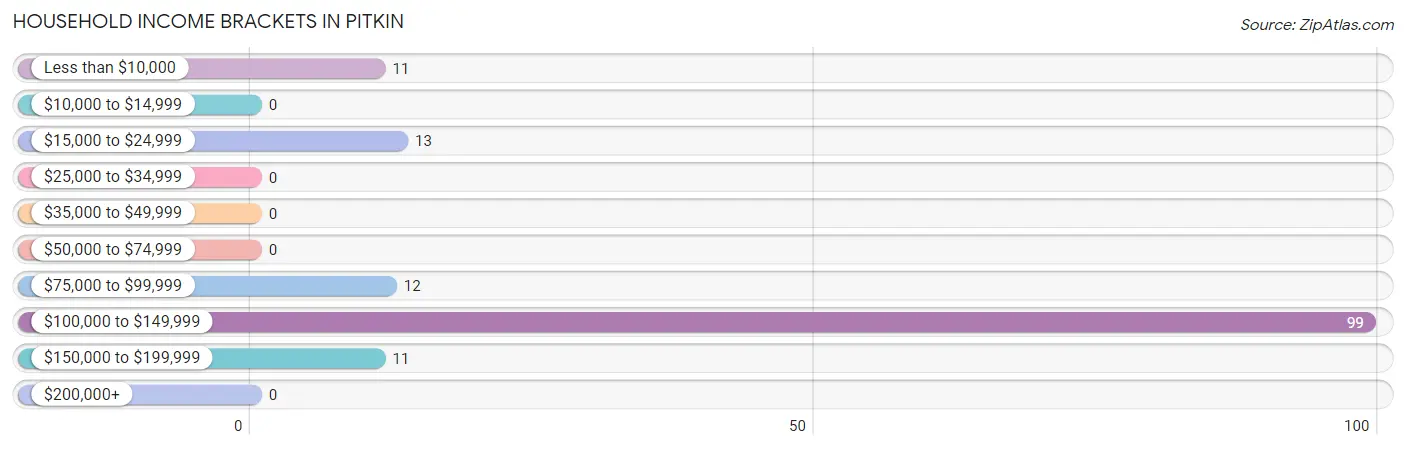
Household Income Brackets in Pitkin
With 99 households falling in the category, the $100,000 to $149,999 income range is the most frequent in Pitkin, accounting for 67.8% of all households.
| Income Bracket | # Households | % Households |
| Less than $10,000 | 11 | 7.5% |
| $10,000 to $14,999 | 0 | 0.0% |
| $15,000 to $24,999 | 13 | 8.9% |
| $25,000 to $34,999 | 0 | 0.0% |
| $35,000 to $49,999 | 0 | 0.0% |
| $50,000 to $74,999 | 0 | 0.0% |
| $75,000 to $99,999 | 12 | 8.2% |
| $100,000 to $149,999 | 99 | 67.8% |
| $150,000 to $199,999 | 11 | 7.5% |
| $200,000+ | 0 | 0.0% |
Household Income by Householder Age in Pitkin
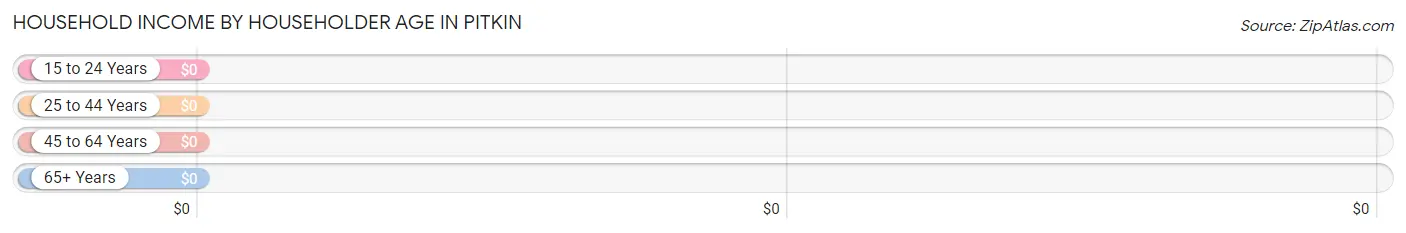
| Income Bracket | # Households | Median Income |
| 15 to 24 Years | 13 (8.9%) | $0 |
| 25 to 44 Years | 12 (8.2%) | $0 |
| 45 to 64 Years | 28 (19.2%) | $0 |
| 65+ Years | 93 (63.7%) | $0 |
| Total | 146 (100.0%) | $105,610 |
Poverty in Pitkin
Income Below Poverty by Sex and Age in Pitkin
With 7.8% poverty level for males and 46.5% for females among the residents of Pitkin, 6 to 11 year old males and 6 to 11 year old females are the most vulnerable to poverty, with 10 males (100.0%) and 22 females (100.0%) in their respective age groups living below the poverty level.
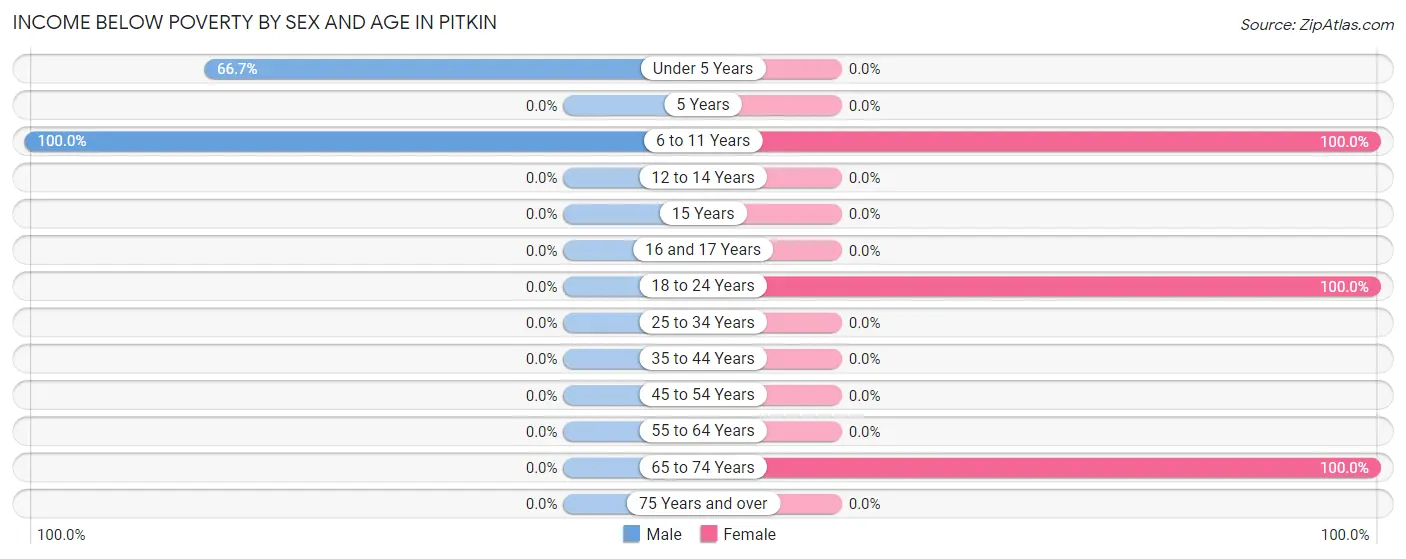
| Age Bracket | Male | Female |
| Under 5 Years | 12 (66.7%) | 0 (0.0%) |
| 5 Years | 0 (0.0%) | 0 (0.0%) |
| 6 to 11 Years | 10 (100.0%) | 22 (100.0%) |
| 12 to 14 Years | 0 (0.0%) | 0 (0.0%) |
| 15 Years | 0 (0.0%) | 0 (0.0%) |
| 16 and 17 Years | 0 (0.0%) | 0 (0.0%) |
| 18 to 24 Years | 0 (0.0%) | 13 (100.0%) |
| 25 to 34 Years | 0 (0.0%) | 0 (0.0%) |
| 35 to 44 Years | 0 (0.0%) | 0 (0.0%) |
| 45 to 54 Years | 0 (0.0%) | 0 (0.0%) |
| 55 to 64 Years | 0 (0.0%) | 0 (0.0%) |
| 65 to 74 Years | 0 (0.0%) | 11 (100.0%) |
| 75 Years and over | 0 (0.0%) | 0 (0.0%) |
| Total | 22 (7.8%) | 46 (46.5%) |
Income Above Poverty by Sex and Age in Pitkin
According to the poverty statistics in Pitkin, males aged 18 to 24 years and females aged under 5 years are the age groups that are most secure financially, with 100.0% of males and 100.0% of females in these age groups living above the poverty line.
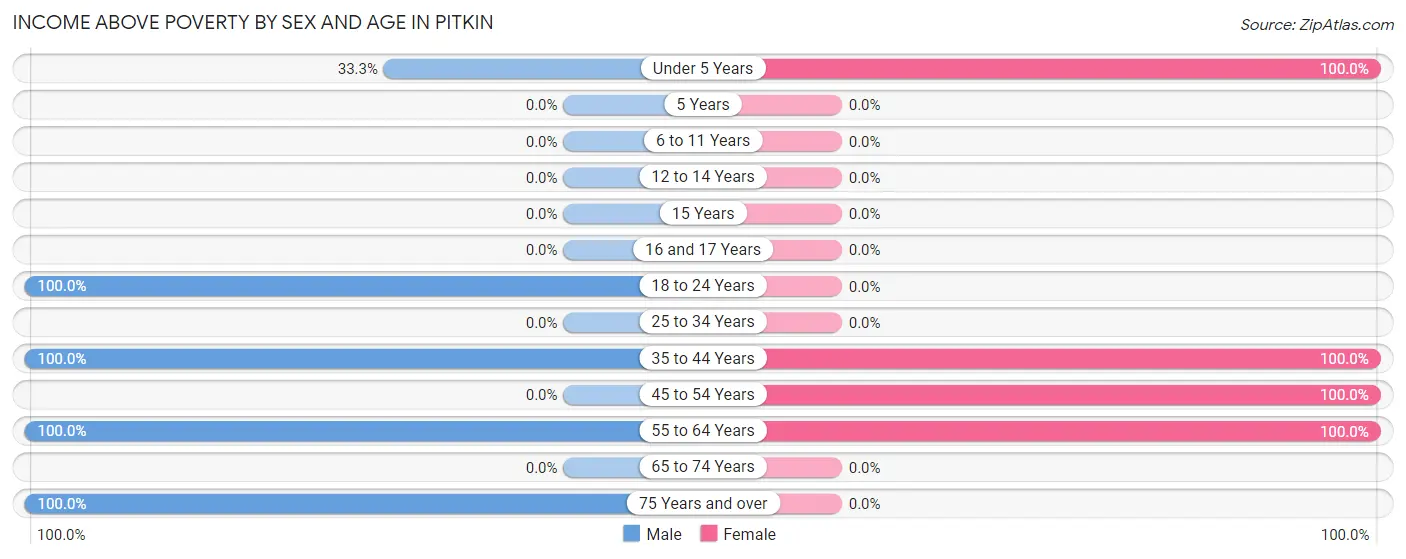
| Age Bracket | Male | Female |
| Under 5 Years | 6 (33.3%) | 13 (100.0%) |
| 5 Years | 0 (0.0%) | 0 (0.0%) |
| 6 to 11 Years | 0 (0.0%) | 0 (0.0%) |
| 12 to 14 Years | 0 (0.0%) | 0 (0.0%) |
| 15 Years | 0 (0.0%) | 0 (0.0%) |
| 16 and 17 Years | 0 (0.0%) | 0 (0.0%) |
| 18 to 24 Years | 17 (100.0%) | 0 (0.0%) |
| 25 to 34 Years | 0 (0.0%) | 0 (0.0%) |
| 35 to 44 Years | 144 (100.0%) | 12 (100.0%) |
| 45 to 54 Years | 0 (0.0%) | 17 (100.0%) |
| 55 to 64 Years | 11 (100.0%) | 11 (100.0%) |
| 65 to 74 Years | 0 (0.0%) | 0 (0.0%) |
| 75 Years and over | 82 (100.0%) | 0 (0.0%) |
| Total | 260 (92.2%) | 53 (53.5%) |
Income Below Poverty Among Married-Couple Families in Pitkin
| Children | Above Poverty | Below Poverty |
| No Children | 28 (100.0%) | 0 (0.0%) |
| 1 or 2 Children | 12 (100.0%) | 0 (0.0%) |
| 3 or 4 Children | 0 (0.0%) | 0 (0.0%) |
| 5 or more Children | 0 (0.0%) | 0 (0.0%) |
| Total | 40 (100.0%) | 0 (0.0%) |
Income Below Poverty Among Single-Parent Households in Pitkin
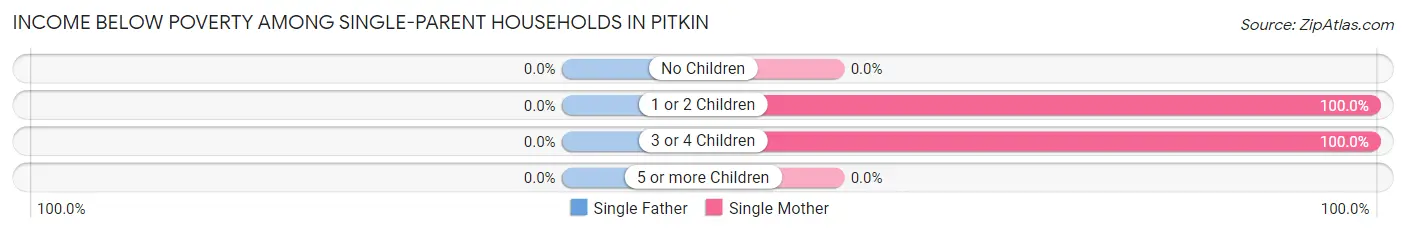
| Children | Single Father | Single Mother |
| No Children | 0 (0.0%) | 0 (0.0%) |
| 1 or 2 Children | 0 (0.0%) | 13 (100.0%) |
| 3 or 4 Children | 0 (0.0%) | 11 (100.0%) |
| 5 or more Children | 0 (0.0%) | 0 (0.0%) |
| Total | 0 (0.0%) | 24 (100.0%) |
Income Below Poverty Among Married-Couple vs Single-Parent Households in Pitkin
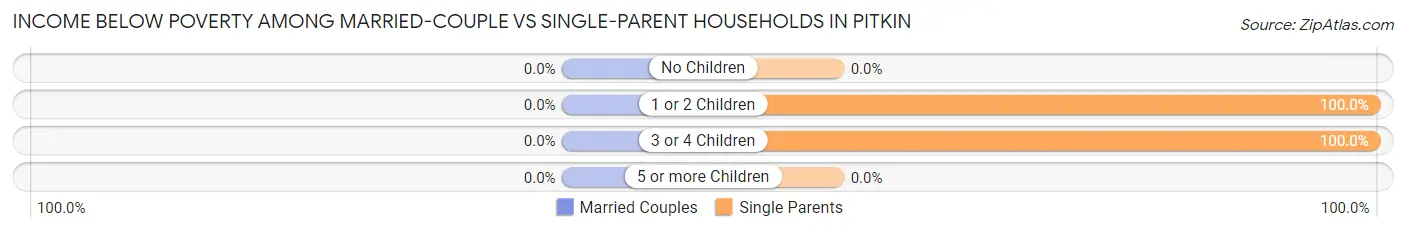
| Children | Married-Couple Families | Single-Parent Households |
| No Children | 0 (0.0%) | 0 (0.0%) |
| 1 or 2 Children | 0 (0.0%) | 13 (100.0%) |
| 3 or 4 Children | 0 (0.0%) | 11 (100.0%) |
| 5 or more Children | 0 (0.0%) | 0 (0.0%) |
| Total | 0 (0.0%) | 24 (100.0%) |
Race in Pitkin
The most populous races in Pitkin are White / Caucasian (350 | 91.9%), Hispanic or Latino (31 | 8.1%), and Two or more Races (31 | 8.1%).
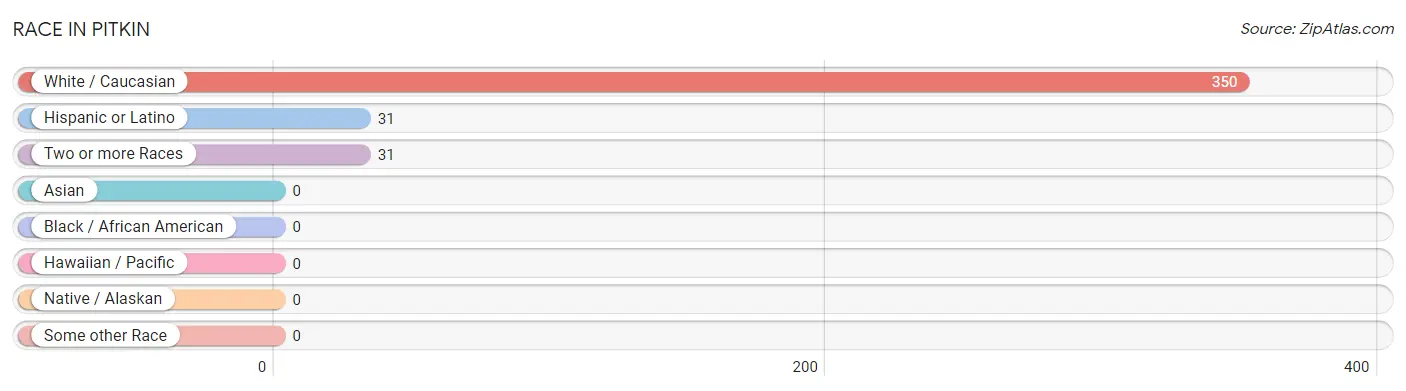
| Race | # Population | % Population |
| Asian | 0 | 0.0% |
| Black / African American | 0 | 0.0% |
| Hawaiian / Pacific | 0 | 0.0% |
| Hispanic or Latino | 31 | 8.1% |
| Native / Alaskan | 0 | 0.0% |
| White / Caucasian | 350 | 91.9% |
| Two or more Races | 31 | 8.1% |
| Some other Race | 0 | 0.0% |
| Total | 381 | 100.0% |
Ancestry in Pitkin
The most populous ancestries reported in Pitkin are American (147 | 38.6%), Irish (49 | 12.9%), Italian (34 | 8.9%), German (25 | 6.6%), and South American (19 | 5.0%), together accounting for 71.9% of all Pitkin residents.
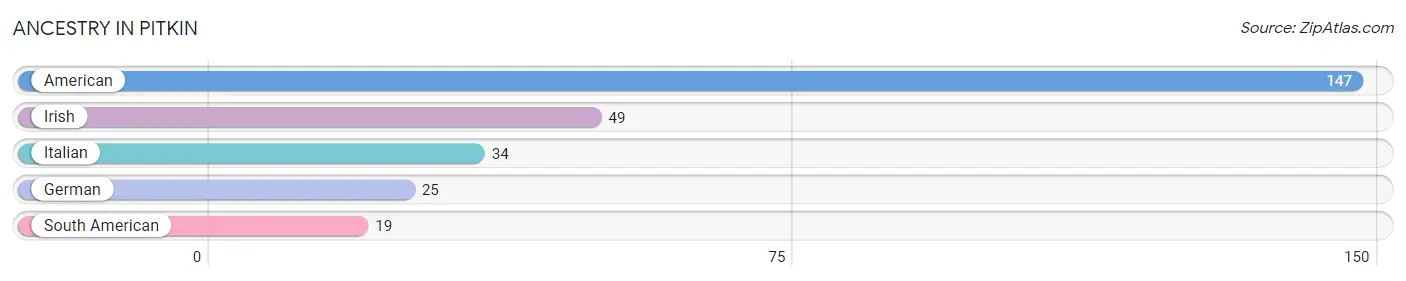
| Ancestry | # Population | % Population |
| American | 147 | 38.6% |
| German | 25 | 6.6% |
| Irish | 49 | 12.9% |
| Italian | 34 | 8.9% |
| South American | 19 | 5.0% | View All 5 Rows |
Immigrants in Pitkin

| Immigration Origin | # Population | % Population | View All 0 Rows |
Sex and Age in Pitkin
Sex and Age in Pitkin
The most populous age groups in Pitkin are 40 to 44 Years (135 | 47.9%) for men and 5 to 9 Years (22 | 22.2%) for women.
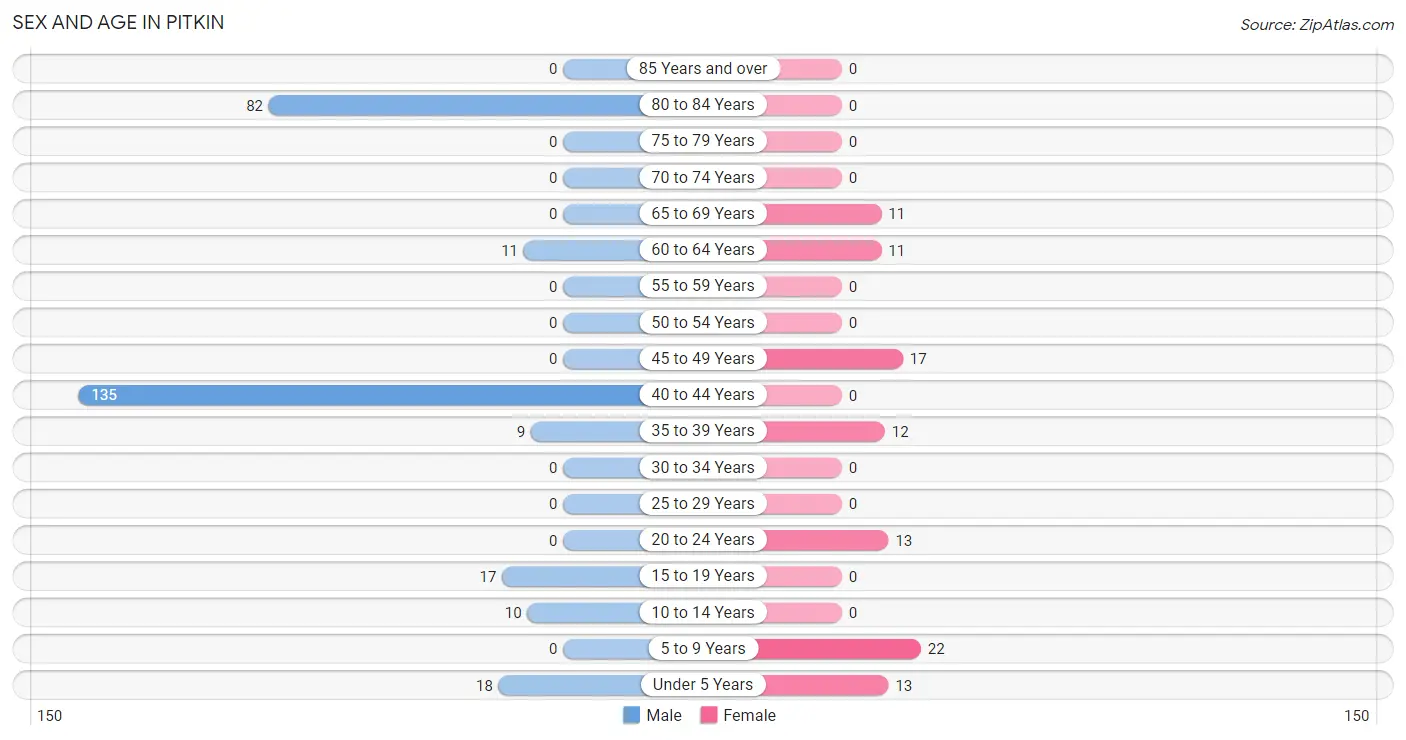
| Age Bracket | Male | Female |
| Under 5 Years | 18 (6.4%) | 13 (13.1%) |
| 5 to 9 Years | 0 (0.0%) | 22 (22.2%) |
| 10 to 14 Years | 10 (3.5%) | 0 (0.0%) |
| 15 to 19 Years | 17 (6.0%) | 0 (0.0%) |
| 20 to 24 Years | 0 (0.0%) | 13 (13.1%) |
| 25 to 29 Years | 0 (0.0%) | 0 (0.0%) |
| 30 to 34 Years | 0 (0.0%) | 0 (0.0%) |
| 35 to 39 Years | 9 (3.2%) | 12 (12.1%) |
| 40 to 44 Years | 135 (47.9%) | 0 (0.0%) |
| 45 to 49 Years | 0 (0.0%) | 17 (17.2%) |
| 50 to 54 Years | 0 (0.0%) | 0 (0.0%) |
| 55 to 59 Years | 0 (0.0%) | 0 (0.0%) |
| 60 to 64 Years | 11 (3.9%) | 11 (11.1%) |
| 65 to 69 Years | 0 (0.0%) | 11 (11.1%) |
| 70 to 74 Years | 0 (0.0%) | 0 (0.0%) |
| 75 to 79 Years | 0 (0.0%) | 0 (0.0%) |
| 80 to 84 Years | 82 (29.1%) | 0 (0.0%) |
| 85 Years and over | 0 (0.0%) | 0 (0.0%) |
| Total | 282 (100.0%) | 99 (100.0%) |
Families and Households in Pitkin
Median Family Size in Pitkin
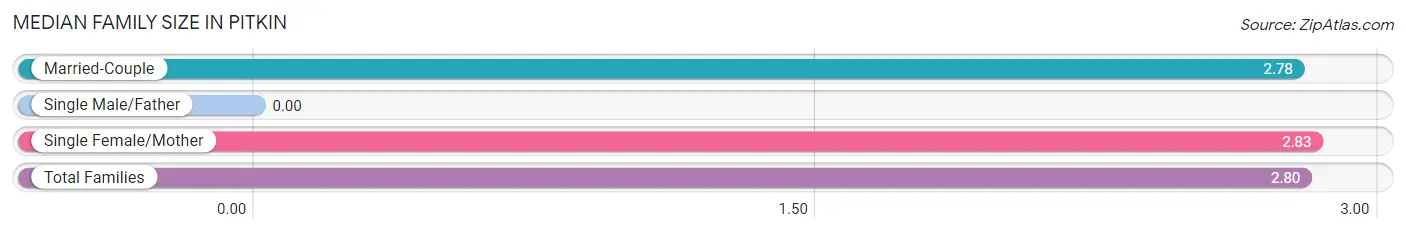
| Family Type | # Families | Family Size |
| Married-Couple | 40 (62.5%) | 2.78 |
| Single Male/Father | 0 (0.0%) | - |
| Single Female/Mother | 24 (37.5%) | 2.83 |
| Total Families | 64 (100.0%) | 2.80 |
Median Household Size in Pitkin
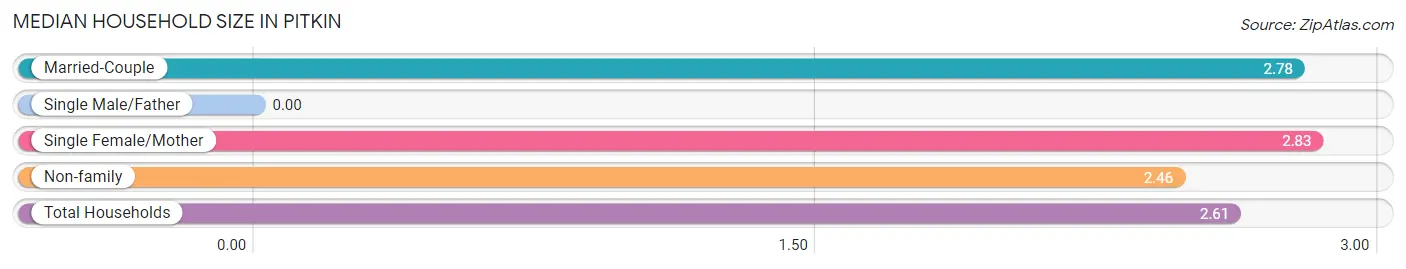
| Household Type | # Households | Household Size |
| Married-Couple | 40 (27.4%) | 2.78 |
| Single Male/Father | 0 (0.0%) | - |
| Single Female/Mother | 24 (16.4%) | 2.83 |
| Non-family | 82 (56.2%) | 2.46 |
| Total Households | 146 (100.0%) | 2.61 |
Household Size by Marriage Status in Pitkin
Out of a total of 146 households in Pitkin, 64 (43.8%) are family households, while 82 (56.2%) are nonfamily households. The most numerous type of family households are 2-person households, comprising 24, and the most common type of nonfamily households are 2-person households, comprising 82.
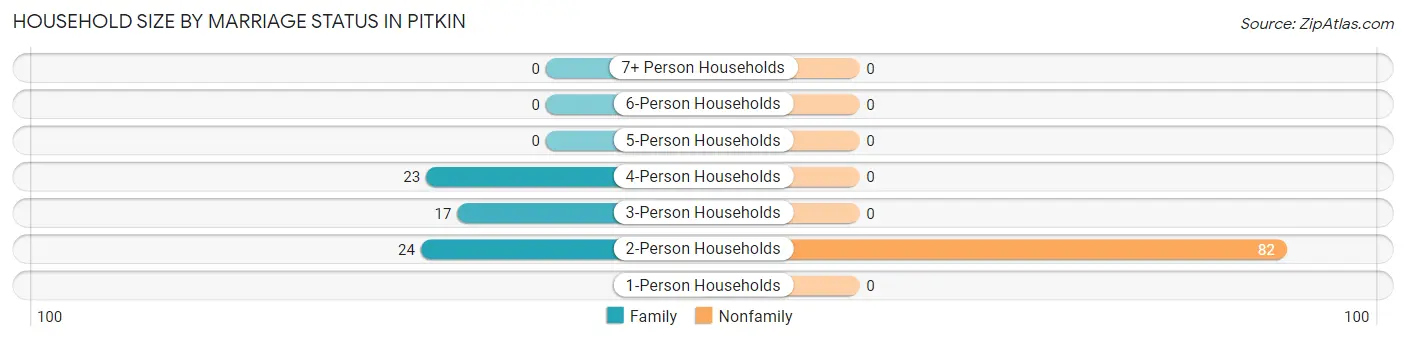
| Household Size | Family Households | Nonfamily Households |
| 1-Person Households | - | 0 (0.0%) |
| 2-Person Households | 24 (16.4%) | 82 (56.2%) |
| 3-Person Households | 17 (11.6%) | 0 (0.0%) |
| 4-Person Households | 23 (15.8%) | 0 (0.0%) |
| 5-Person Households | 0 (0.0%) | 0 (0.0%) |
| 6-Person Households | 0 (0.0%) | 0 (0.0%) |
| 7+ Person Households | 0 (0.0%) | 0 (0.0%) |
| Total | 64 (43.8%) | 82 (56.2%) |
Female Fertility in Pitkin
Fertility by Age in Pitkin
| Age Bracket | Women with Births | Births / 1,000 Women |
| 15 to 19 years | 0 (0.0%) | 0.0 |
| 20 to 34 years | 0 (0.0%) | 0.0 |
| 35 to 50 years | 0 (0.0%) | 0.0 |
| Total | 0 (0.0%) | 0.0 |
Fertility by Age by Marriage Status in Pitkin
| Age Bracket | Married | Unmarried |
| 15 to 19 years | 0 (0.0%) | 0 (0.0%) |
| 20 to 34 years | 0 (0.0%) | 0 (0.0%) |
| 35 to 50 years | 0 (0.0%) | 0 (0.0%) |
| Total | 0 (0.0%) | 0 (0.0%) |
Fertility by Education in Pitkin
| Educational Attainment | Women with Births | Births / 1,000 Women |
| Less than High School | 0 (0.0%) | 0.0 |
| High School Diploma | 0 (0.0%) | 0.0 |
| College or Associate's Degree | 0 (0.0%) | 0.0 |
| Bachelor's Degree | 0 (0.0%) | 0.0 |
| Graduate Degree | 0 (0.0%) | 0.0 |
| Total | 0 (0.0%) | 0.0 |
Fertility by Education by Marriage Status in Pitkin
| Educational Attainment | Married | Unmarried |
| Less than High School | 0 (0.0%) | 0 (0.0%) |
| High School Diploma | 0 (0.0%) | 0 (0.0%) |
| College or Associate's Degree | 0 (0.0%) | 0 (0.0%) |
| Bachelor's Degree | 0 (0.0%) | 0 (0.0%) |
| Graduate Degree | 0 (0.0%) | 0 (0.0%) |
| Total | 0 (0.0%) | 0 (0.0%) |
Employment Characteristics in Pitkin
Employment by Class of Employer in Pitkin
Among the 200 employed individuals in Pitkin, federal government employees (131 | 65.5%), private company employees (60 | 30.0%), and self-employed (not incorporated) (9 | 4.5%) make up the most common classes of employment.
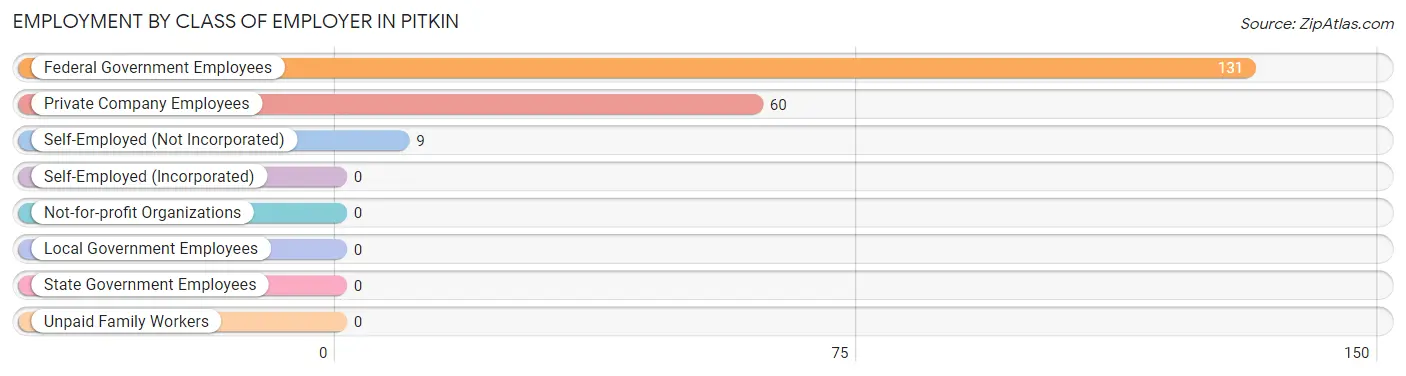
| Employer Class | # Employees | % Employees |
| Private Company Employees | 60 | 30.0% |
| Self-Employed (Incorporated) | 0 | 0.0% |
| Self-Employed (Not Incorporated) | 9 | 4.5% |
| Not-for-profit Organizations | 0 | 0.0% |
| Local Government Employees | 0 | 0.0% |
| State Government Employees | 0 | 0.0% |
| Federal Government Employees | 131 | 65.5% |
| Unpaid Family Workers | 0 | 0.0% |
| Total | 200 | 100.0% |
Employment Status by Age in Pitkin
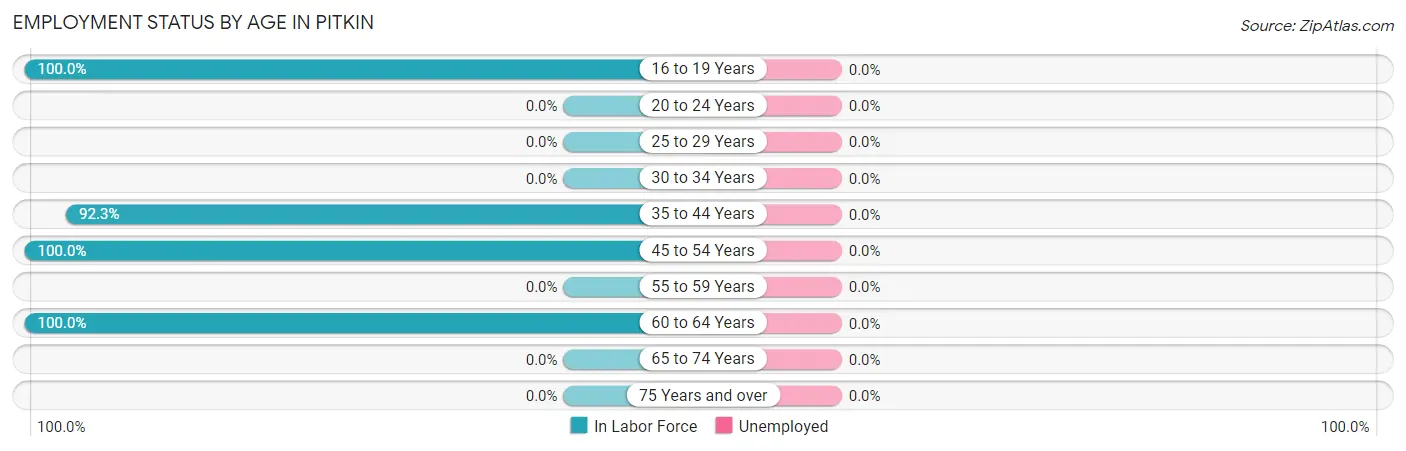
| Age Bracket | In Labor Force | Unemployed |
| 16 to 19 Years | 17 (100.0%) | 0 (0.0%) |
| 20 to 24 Years | 0 (0.0%) | 0 (0.0%) |
| 25 to 29 Years | 0 (0.0%) | 0 (0.0%) |
| 30 to 34 Years | 0 (0.0%) | 0 (0.0%) |
| 35 to 44 Years | 144 (92.3%) | 0 (0.0%) |
| 45 to 54 Years | 17 (100.0%) | 0 (0.0%) |
| 55 to 59 Years | 0 (0.0%) | 0 (0.0%) |
| 60 to 64 Years | 22 (100.0%) | 0 (0.0%) |
| 65 to 74 Years | 0 (0.0%) | 0 (0.0%) |
| 75 Years and over | 0 (0.0%) | 0 (0.0%) |
| Total | 200 (62.9%) | 0 (0.0%) |
Employment Status by Educational Attainment in Pitkin
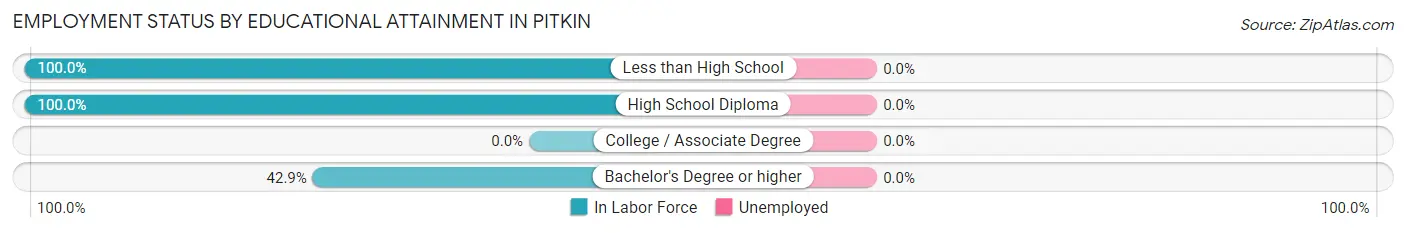
| Educational Attainment | In Labor Force | Unemployed |
| Less than High School | 15 (100.0%) | 0 (0.0%) |
| High School Diploma | 159 (100.0%) | 0 (0.0%) |
| College / Associate Degree | 0 (0.0%) | 0 (0.0%) |
| Bachelor's Degree or higher | 9 (42.9%) | 0 (0.0%) |
| Total | 183 (93.8%) | 0 (0.0%) |
Employment Occupations by Sex in Pitkin
Management, Business, Science and Arts Occupations
The most common Management, Business, Science and Arts occupations in Pitkin are , and Management (17 | 21.2%).
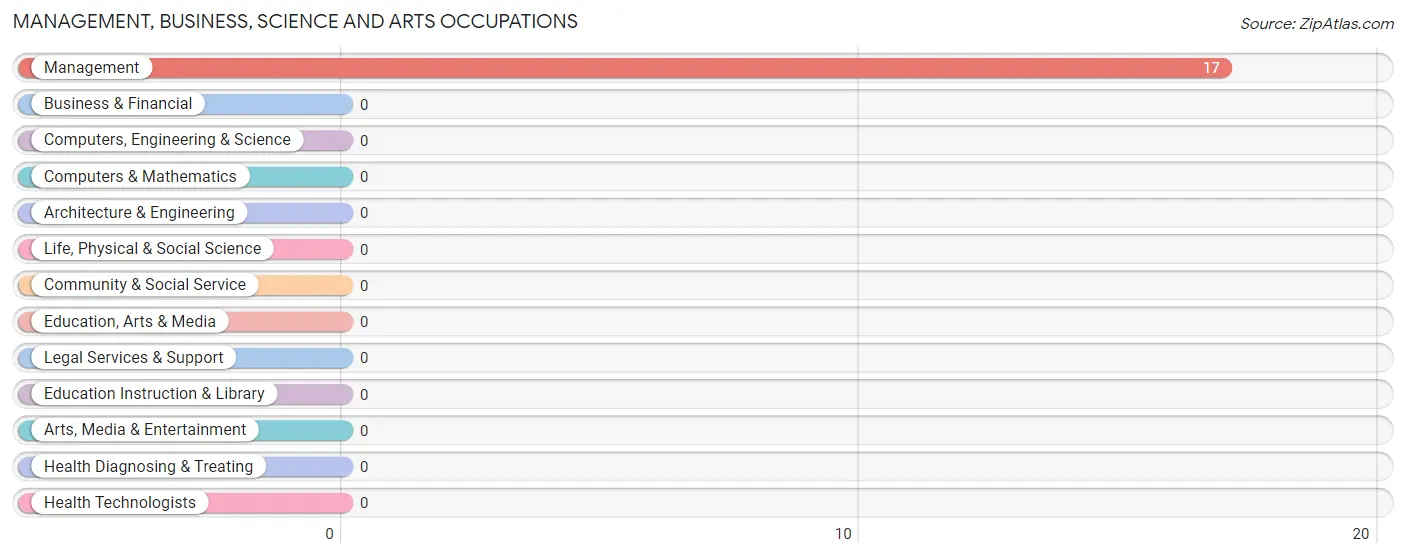
Management, Business, Science and Arts Occupations by Sex
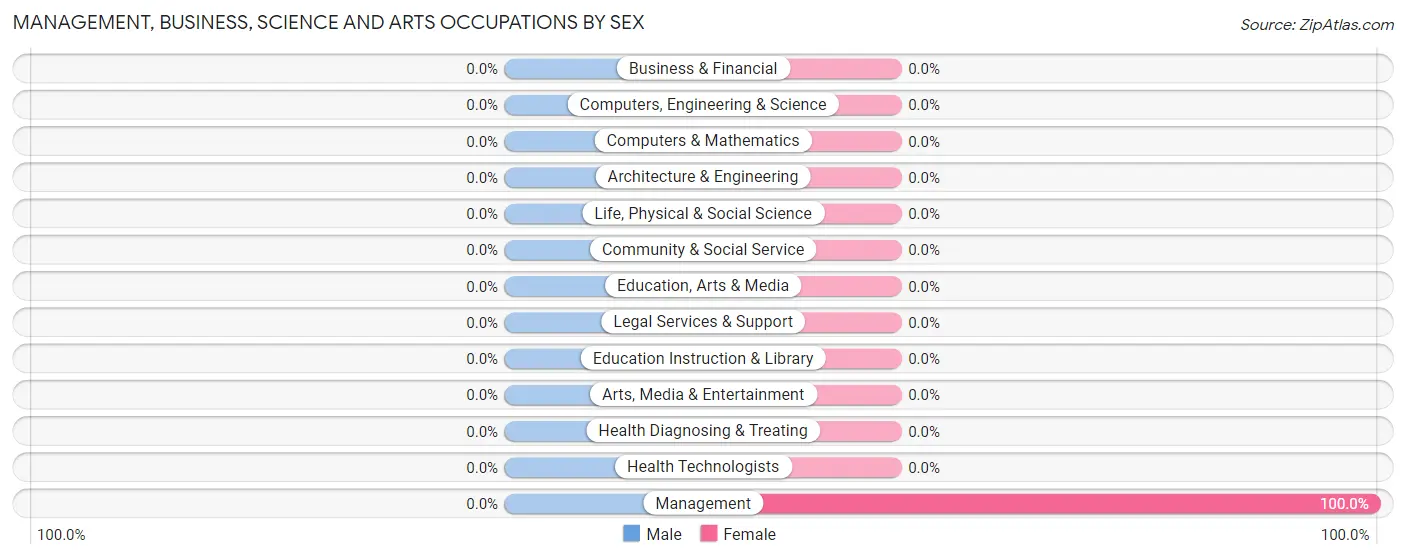
| Occupation | Male | Female |
| Management | 0 (0.0%) | 17 (100.0%) |
| Business & Financial | 0 (0.0%) | 0 (0.0%) |
| Computers, Engineering & Science | 0 (0.0%) | 0 (0.0%) |
| Computers & Mathematics | 0 (0.0%) | 0 (0.0%) |
| Architecture & Engineering | 0 (0.0%) | 0 (0.0%) |
| Life, Physical & Social Science | 0 (0.0%) | 0 (0.0%) |
| Community & Social Service | 0 (0.0%) | 0 (0.0%) |
| Education, Arts & Media | 0 (0.0%) | 0 (0.0%) |
| Legal Services & Support | 0 (0.0%) | 0 (0.0%) |
| Education Instruction & Library | 0 (0.0%) | 0 (0.0%) |
| Arts, Media & Entertainment | 0 (0.0%) | 0 (0.0%) |
| Health Diagnosing & Treating | 0 (0.0%) | 0 (0.0%) |
| Health Technologists | 0 (0.0%) | 0 (0.0%) |
| Total (Category) | 0 (0.0%) | 17 (100.0%) |
| Total (Overall) | 52 (65.0%) | 28 (35.0%) |
Services Occupations
Services Occupations by Sex
| Occupation | Male | Female |
| Healthcare Support | 0 (0.0%) | 0 (0.0%) |
| Security & Protection | 0 (0.0%) | 0 (0.0%) |
| Firefighting & Prevention | 0 (0.0%) | 0 (0.0%) |
| Law Enforcement | 0 (0.0%) | 0 (0.0%) |
| Food Preparation & Serving | 0 (0.0%) | 0 (0.0%) |
| Cleaning & Maintenance | 0 (0.0%) | 0 (0.0%) |
| Personal Care & Service | 0 (0.0%) | 0 (0.0%) |
| Total (Category) | 0 (0.0%) | 0 (0.0%) |
| Total (Overall) | 52 (65.0%) | 28 (35.0%) |
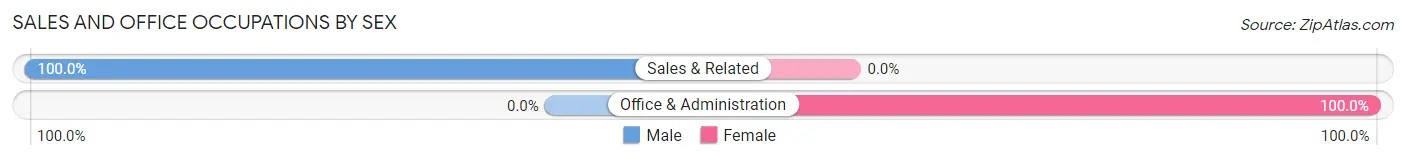
Sales and Office Occupations
The most common Sales and Office occupations in Pitkin are Office & Administration (11 | 13.8%), and Sales & Related (9 | 11.3%).
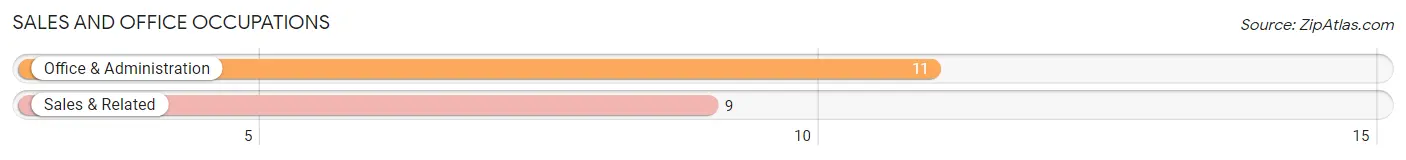
Sales and Office Occupations by Sex
| Occupation | Male | Female |
| Sales & Related | 9 (100.0%) | 0 (0.0%) |
| Office & Administration | 0 (0.0%) | 11 (100.0%) |
| Total (Category) | 9 (45.0%) | 11 (55.0%) |
| Total (Overall) | 52 (65.0%) | 28 (35.0%) |
Natural Resources, Construction and Maintenance Occupations
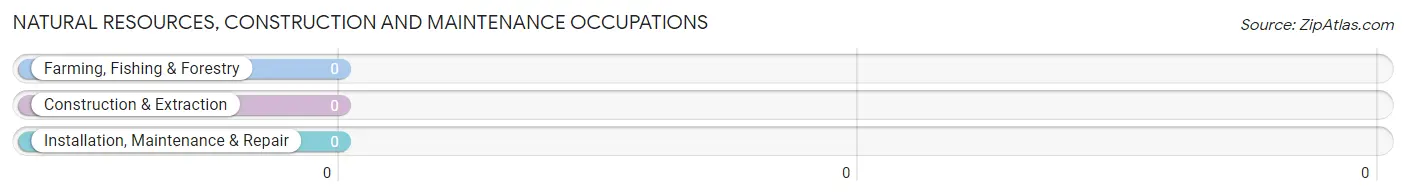
Natural Resources, Construction and Maintenance Occupations by Sex
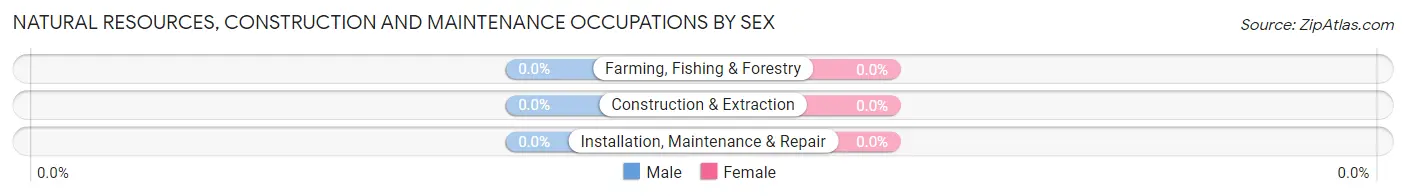
| Occupation | Male | Female |
| Farming, Fishing & Forestry | 0 (0.0%) | 0 (0.0%) |
| Construction & Extraction | 0 (0.0%) | 0 (0.0%) |
| Installation, Maintenance & Repair | 0 (0.0%) | 0 (0.0%) |
| Total (Category) | 0 (0.0%) | 0 (0.0%) |
| Total (Overall) | 52 (65.0%) | 28 (35.0%) |
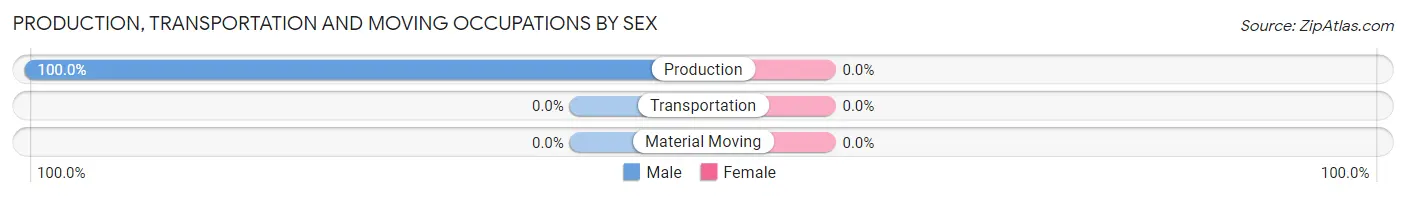
Production, Transportation and Moving Occupations
The most common Production, Transportation and Moving occupations in Pitkin are , and Production (43 | 53.7%).
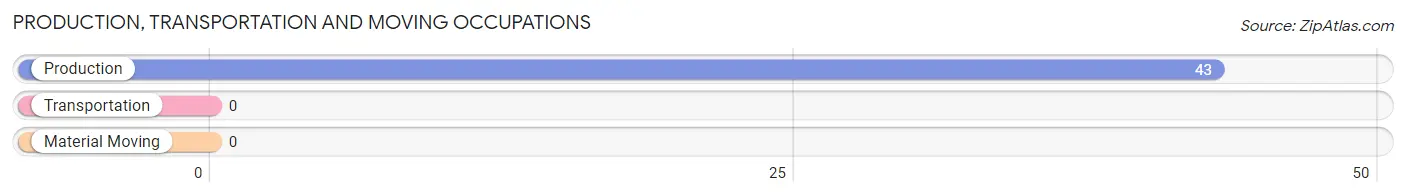
Production, Transportation and Moving Occupations by Sex
| Occupation | Male | Female |
| Production | 43 (100.0%) | 0 (0.0%) |
| Transportation | 0 (0.0%) | 0 (0.0%) |
| Material Moving | 0 (0.0%) | 0 (0.0%) |
| Total (Category) | 43 (100.0%) | 0 (0.0%) |
| Total (Overall) | 52 (65.0%) | 28 (35.0%) |
Employment Industries by Sex in Pitkin
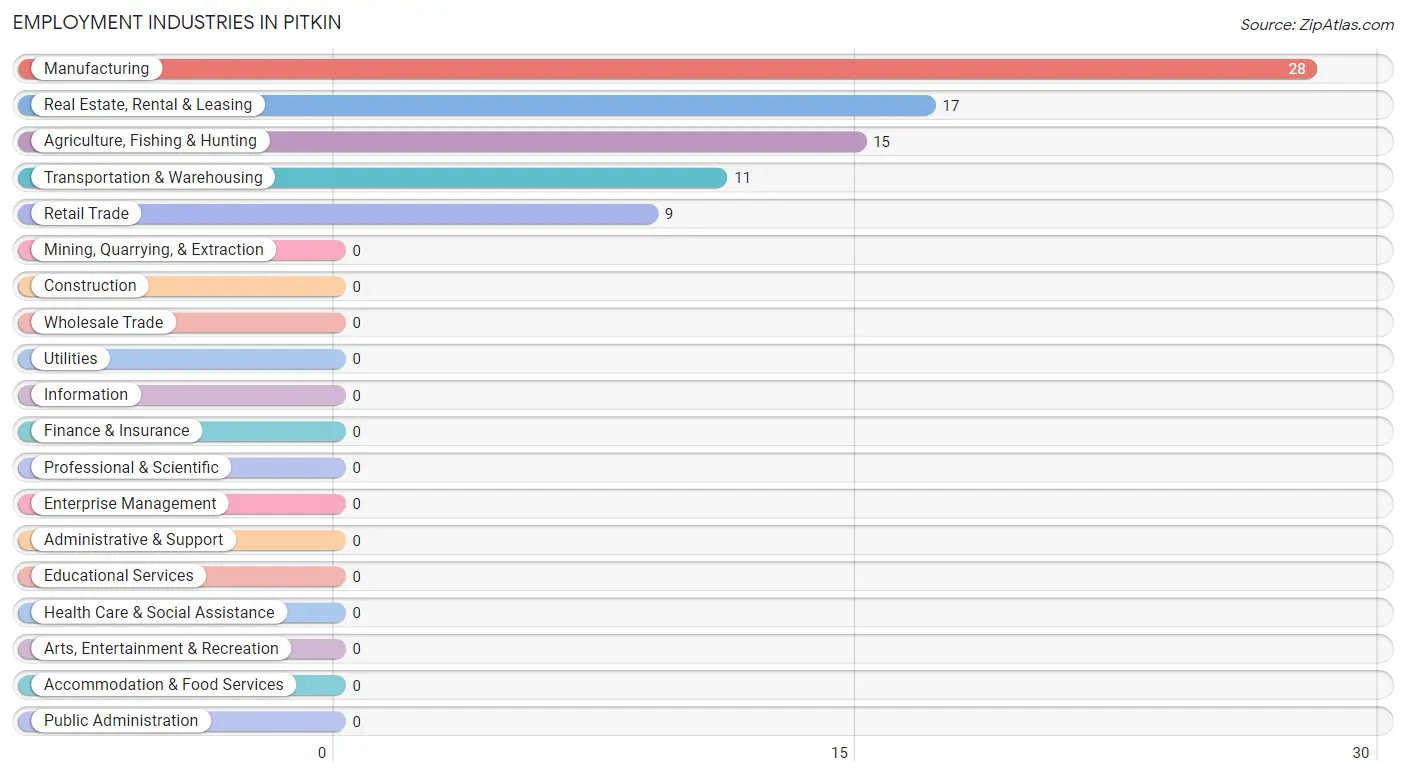
Employment Industries in Pitkin
The major employment industries in Pitkin include Manufacturing (28 | 35.0%), Real Estate, Rental & Leasing (17 | 21.2%), Agriculture, Fishing & Hunting (15 | 18.8%), Transportation & Warehousing (11 | 13.8%), and Retail Trade (9 | 11.3%).
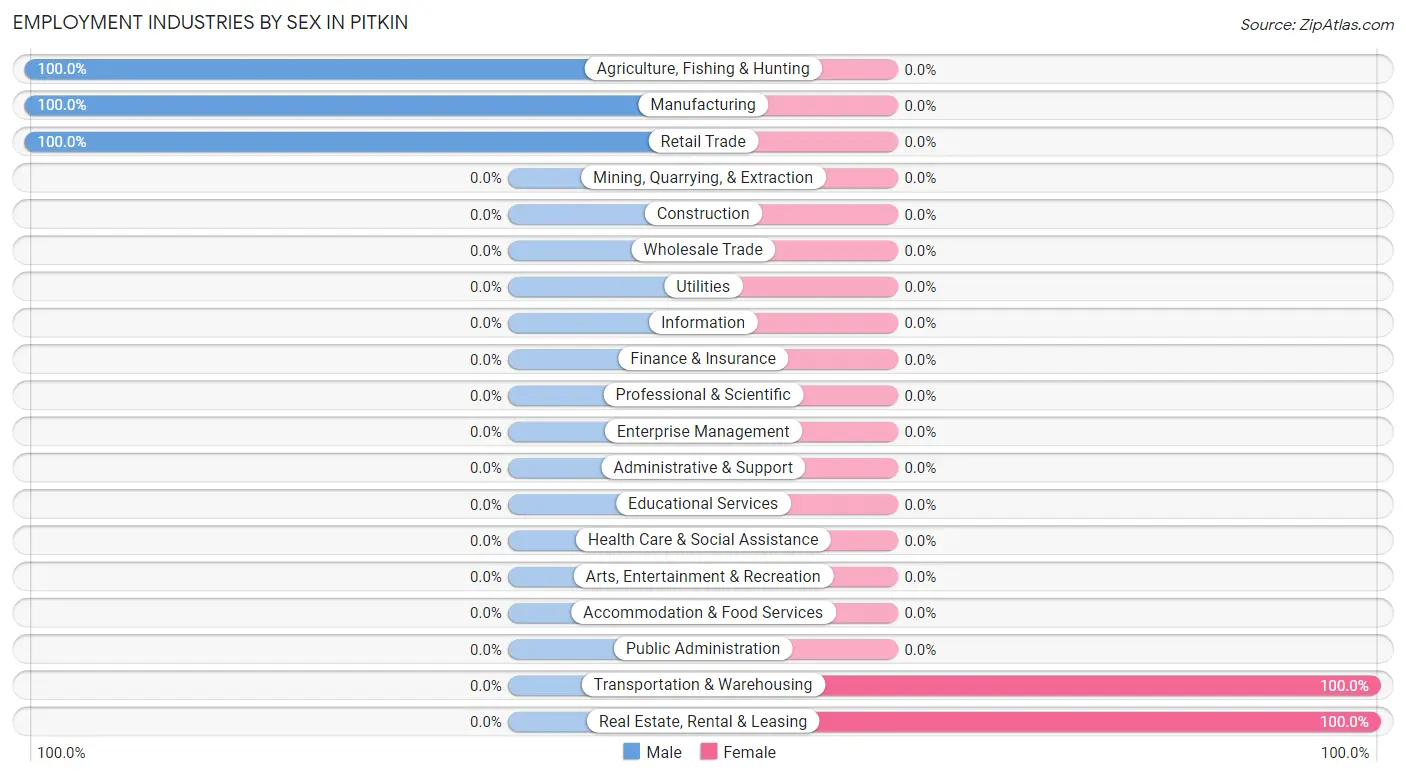
Employment Industries by Sex in Pitkin
The Pitkin industries that see more men than women are Agriculture, Fishing & Hunting (100.0%), Manufacturing (100.0%), and Retail Trade (100.0%), whereas the industries that tend to have a higher number of women are Transportation & Warehousing (100.0%), and Real Estate, Rental & Leasing (100.0%).
| Industry | Male | Female |
| Agriculture, Fishing & Hunting | 15 (100.0%) | 0 (0.0%) |
| Mining, Quarrying, & Extraction | 0 (0.0%) | 0 (0.0%) |
| Construction | 0 (0.0%) | 0 (0.0%) |
| Manufacturing | 28 (100.0%) | 0 (0.0%) |
| Wholesale Trade | 0 (0.0%) | 0 (0.0%) |
| Retail Trade | 9 (100.0%) | 0 (0.0%) |
| Transportation & Warehousing | 0 (0.0%) | 11 (100.0%) |
| Utilities | 0 (0.0%) | 0 (0.0%) |
| Information | 0 (0.0%) | 0 (0.0%) |
| Finance & Insurance | 0 (0.0%) | 0 (0.0%) |
| Real Estate, Rental & Leasing | 0 (0.0%) | 17 (100.0%) |
| Professional & Scientific | 0 (0.0%) | 0 (0.0%) |
| Enterprise Management | 0 (0.0%) | 0 (0.0%) |
| Administrative & Support | 0 (0.0%) | 0 (0.0%) |
| Educational Services | 0 (0.0%) | 0 (0.0%) |
| Health Care & Social Assistance | 0 (0.0%) | 0 (0.0%) |
| Arts, Entertainment & Recreation | 0 (0.0%) | 0 (0.0%) |
| Accommodation & Food Services | 0 (0.0%) | 0 (0.0%) |
| Public Administration | 0 (0.0%) | 0 (0.0%) |
| Total | 52 (65.0%) | 28 (35.0%) |
Education in Pitkin
School Enrollment in Pitkin
The most common levels of schooling among the 32 students in Pitkin are elementary school (21 | 65.6%), and kindergarten (11 | 34.4%).

| School Level | # Students | % Students |
| Nursery / Preschool | 0 | 0.0% |
| Kindergarten | 11 | 34.4% |
| Elementary School | 21 | 65.6% |
| Middle School | 0 | 0.0% |
| High School | 0 | 0.0% |
| College / Undergraduate | 0 | 0.0% |
| Graduate / Professional | 0 | 0.0% |
| Total | 32 | 100.0% |
School Enrollment by Age by Funding Source in Pitkin
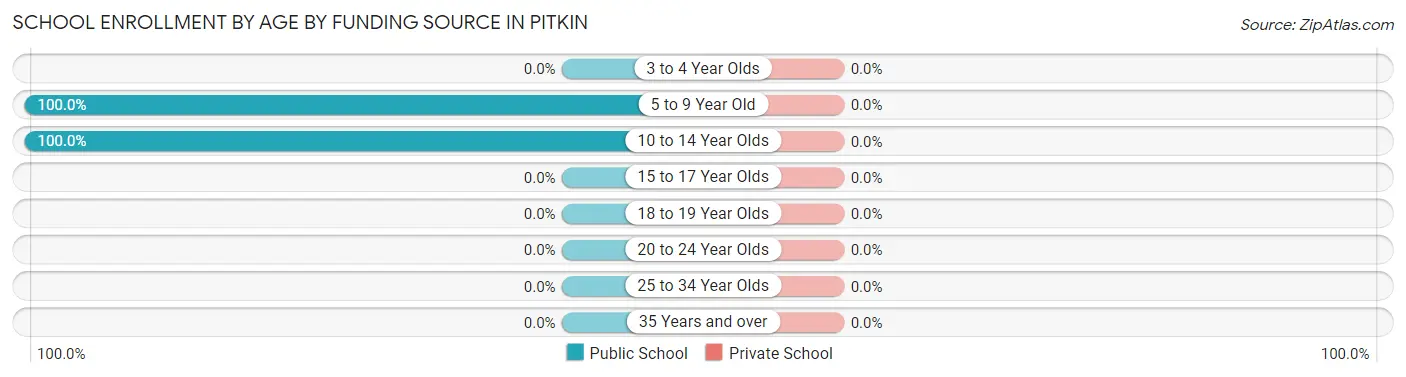
| Age Bracket | Public School | Private School |
| 3 to 4 Year Olds | 0 (0.0%) | 0 (0.0%) |
| 5 to 9 Year Old | 22 (100.0%) | 0 (0.0%) |
| 10 to 14 Year Olds | 10 (100.0%) | 0 (0.0%) |
| 15 to 17 Year Olds | 0 (0.0%) | 0 (0.0%) |
| 18 to 19 Year Olds | 0 (0.0%) | 0 (0.0%) |
| 20 to 24 Year Olds | 0 (0.0%) | 0 (0.0%) |
| 25 to 34 Year Olds | 0 (0.0%) | 0 (0.0%) |
| 35 Years and over | 0 (0.0%) | 0 (0.0%) |
| Total | 32 (100.0%) | 0 (0.0%) |
Educational Attainment by Field of Study in Pitkin
, and liberal arts & history (21 | 100.0%) are the most common fields of study among 21 individuals in Pitkin who have obtained a bachelor's degree or higher.
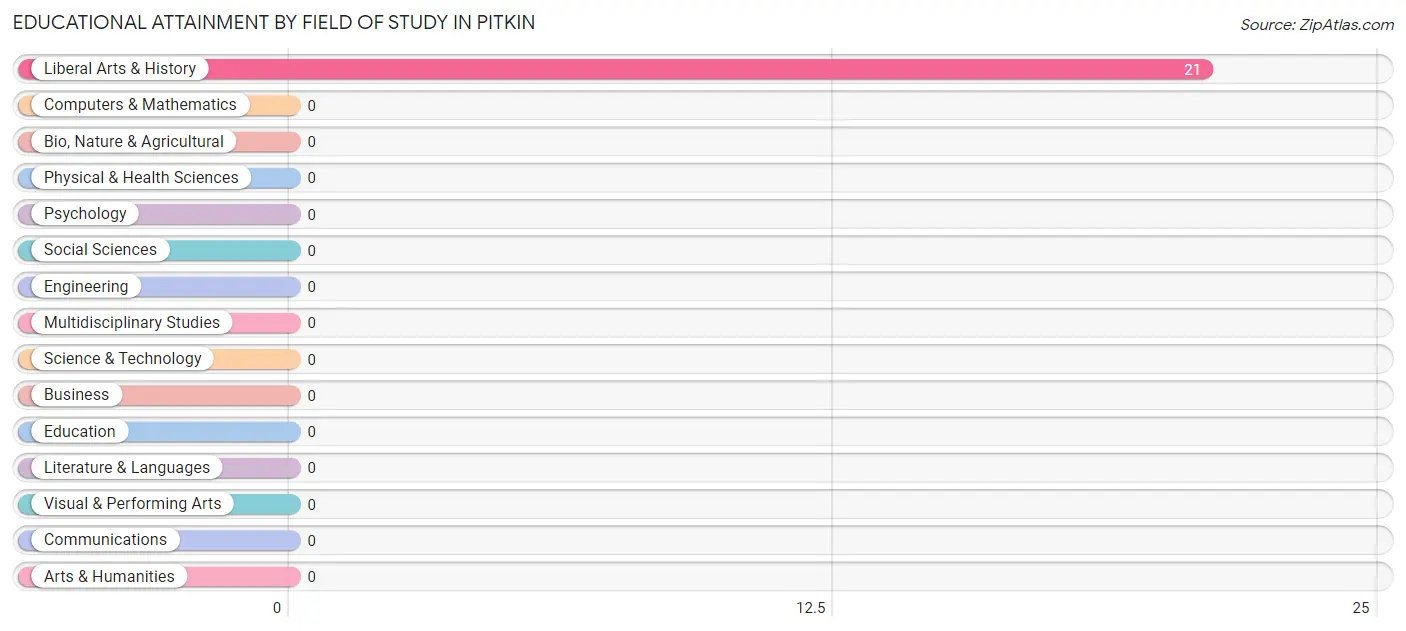
| Field of Study | # Graduates | % Graduates |
| Computers & Mathematics | 0 | 0.0% |
| Bio, Nature & Agricultural | 0 | 0.0% |
| Physical & Health Sciences | 0 | 0.0% |
| Psychology | 0 | 0.0% |
| Social Sciences | 0 | 0.0% |
| Engineering | 0 | 0.0% |
| Multidisciplinary Studies | 0 | 0.0% |
| Science & Technology | 0 | 0.0% |
| Business | 0 | 0.0% |
| Education | 0 | 0.0% |
| Literature & Languages | 0 | 0.0% |
| Liberal Arts & History | 21 | 100.0% |
| Visual & Performing Arts | 0 | 0.0% |
| Communications | 0 | 0.0% |
| Arts & Humanities | 0 | 0.0% |
| Total | 21 | 100.0% |
Transportation & Commute in Pitkin
Vehicle Availability by Sex in Pitkin
The most prevalent vehicle ownership categories in Pitkin are males with 1 vehicle (120, accounting for 69.8%) and females with 1 vehicle (0, making up 428.6%).
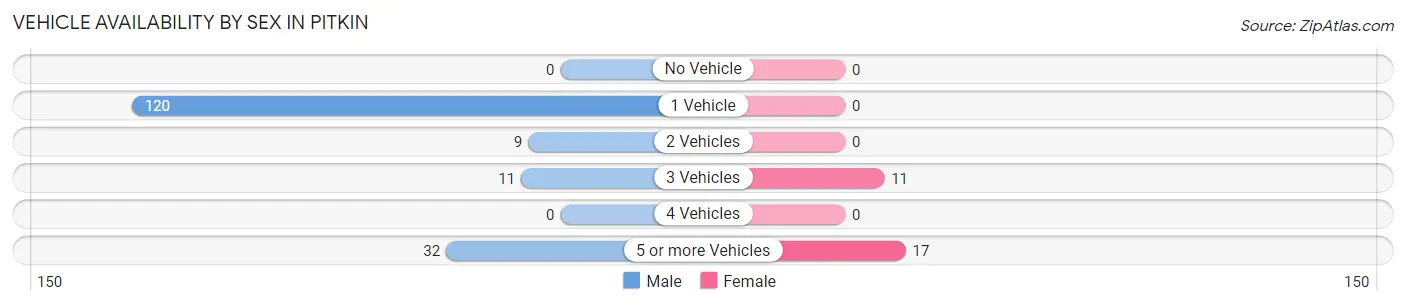
| Vehicles Available | Male | Female |
| No Vehicle | 0 (0.0%) | 0 (0.0%) |
| 1 Vehicle | 120 (69.8%) | 0 (0.0%) |
| 2 Vehicles | 9 (5.2%) | 0 (0.0%) |
| 3 Vehicles | 11 (6.4%) | 11 (39.3%) |
| 4 Vehicles | 0 (0.0%) | 0 (0.0%) |
| 5 or more Vehicles | 32 (18.6%) | 17 (60.7%) |
| Total | 172 (100.0%) | 28 (100.0%) |
Commute Time in Pitkin
The most frequently occuring commute durations in Pitkin are 40 to 44 minutes (163 commuters, 81.5%), 45 to 59 minutes (17 commuters, 8.5%), and 5 to 9 minutes (11 commuters, 5.5%).
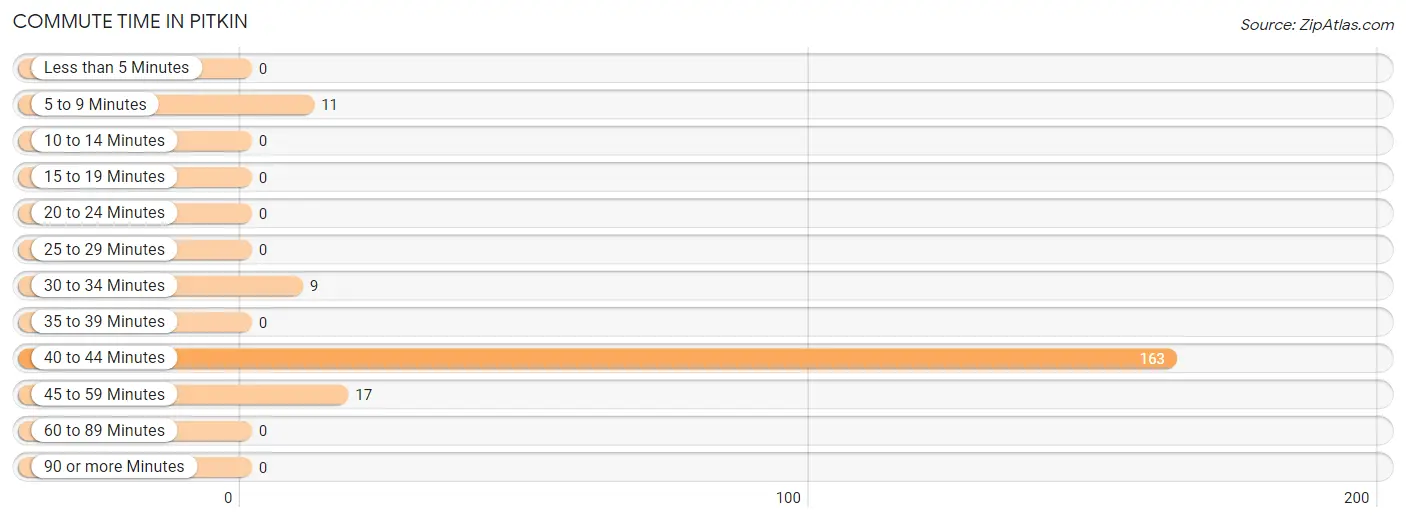
| Commute Time | # Commuters | % Commuters |
| Less than 5 Minutes | 0 | 0.0% |
| 5 to 9 Minutes | 11 | 5.5% |
| 10 to 14 Minutes | 0 | 0.0% |
| 15 to 19 Minutes | 0 | 0.0% |
| 20 to 24 Minutes | 0 | 0.0% |
| 25 to 29 Minutes | 0 | 0.0% |
| 30 to 34 Minutes | 9 | 4.5% |
| 35 to 39 Minutes | 0 | 0.0% |
| 40 to 44 Minutes | 163 | 81.5% |
| 45 to 59 Minutes | 17 | 8.5% |
| 60 to 89 Minutes | 0 | 0.0% |
| 90 or more Minutes | 0 | 0.0% |
Commute Time by Sex in Pitkin
The most common commute times in Pitkin are 40 to 44 minutes (163 commuters, 94.8%) for males and 45 to 59 minutes (17 commuters, 60.7%) for females.
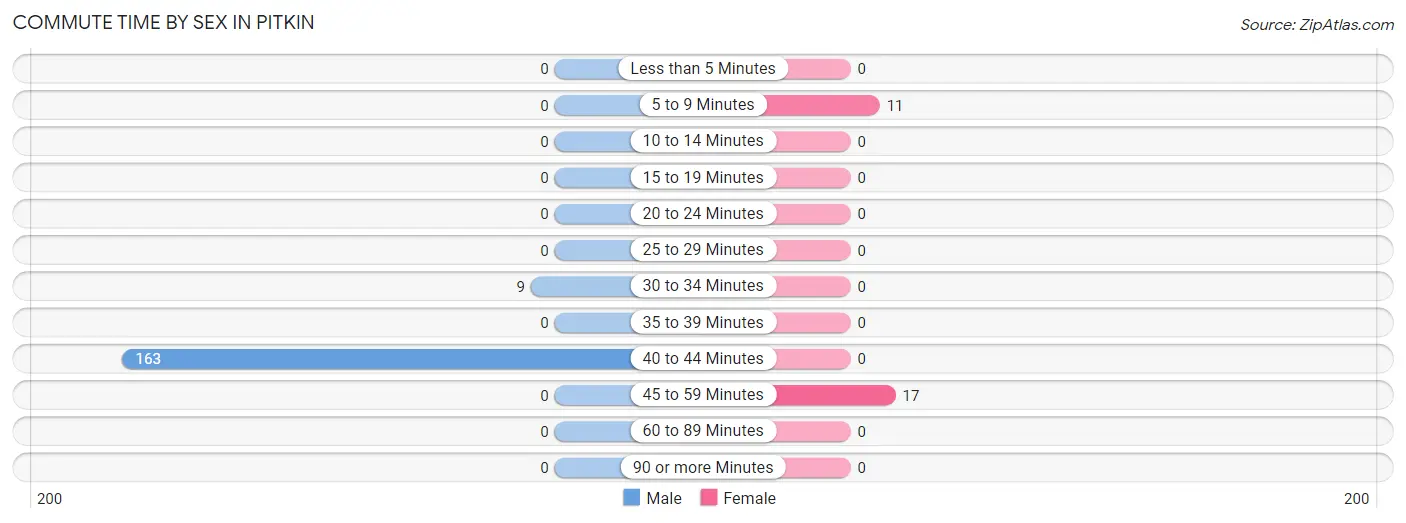
| Commute Time | Male | Female |
| Less than 5 Minutes | 0 (0.0%) | 0 (0.0%) |
| 5 to 9 Minutes | 0 (0.0%) | 11 (39.3%) |
| 10 to 14 Minutes | 0 (0.0%) | 0 (0.0%) |
| 15 to 19 Minutes | 0 (0.0%) | 0 (0.0%) |
| 20 to 24 Minutes | 0 (0.0%) | 0 (0.0%) |
| 25 to 29 Minutes | 0 (0.0%) | 0 (0.0%) |
| 30 to 34 Minutes | 9 (5.2%) | 0 (0.0%) |
| 35 to 39 Minutes | 0 (0.0%) | 0 (0.0%) |
| 40 to 44 Minutes | 163 (94.8%) | 0 (0.0%) |
| 45 to 59 Minutes | 0 (0.0%) | 17 (60.7%) |
| 60 to 89 Minutes | 0 (0.0%) | 0 (0.0%) |
| 90 or more Minutes | 0 (0.0%) | 0 (0.0%) |
Time of Departure to Work by Sex in Pitkin
The most frequent times of departure to work in Pitkin are 6:30 AM to 6:59 AM (120, 69.8%) for males and 7:00 AM to 7:29 AM (28, 100.0%) for females.
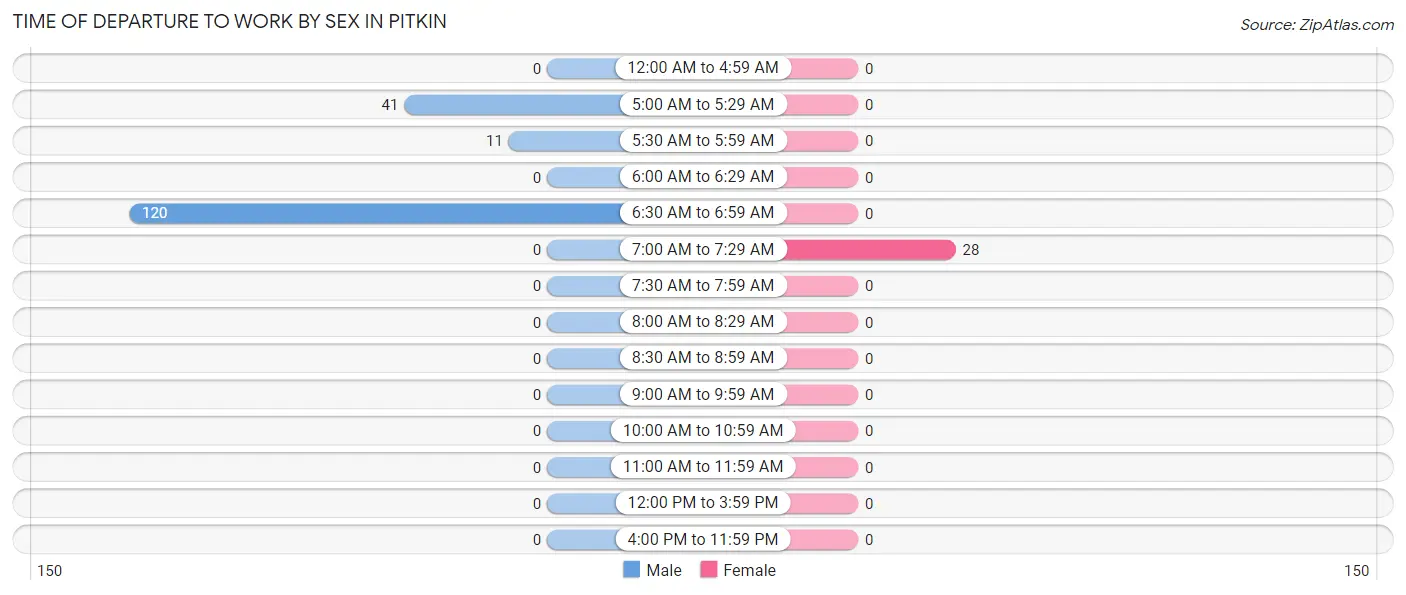
| Time of Departure | Male | Female |
| 12:00 AM to 4:59 AM | 0 (0.0%) | 0 (0.0%) |
| 5:00 AM to 5:29 AM | 41 (23.8%) | 0 (0.0%) |
| 5:30 AM to 5:59 AM | 11 (6.4%) | 0 (0.0%) |
| 6:00 AM to 6:29 AM | 0 (0.0%) | 0 (0.0%) |
| 6:30 AM to 6:59 AM | 120 (69.8%) | 0 (0.0%) |
| 7:00 AM to 7:29 AM | 0 (0.0%) | 28 (100.0%) |
| 7:30 AM to 7:59 AM | 0 (0.0%) | 0 (0.0%) |
| 8:00 AM to 8:29 AM | 0 (0.0%) | 0 (0.0%) |
| 8:30 AM to 8:59 AM | 0 (0.0%) | 0 (0.0%) |
| 9:00 AM to 9:59 AM | 0 (0.0%) | 0 (0.0%) |
| 10:00 AM to 10:59 AM | 0 (0.0%) | 0 (0.0%) |
| 11:00 AM to 11:59 AM | 0 (0.0%) | 0 (0.0%) |
| 12:00 PM to 3:59 PM | 0 (0.0%) | 0 (0.0%) |
| 4:00 PM to 11:59 PM | 0 (0.0%) | 0 (0.0%) |
| Total | 172 (100.0%) | 28 (100.0%) |
Housing Occupancy in Pitkin
Occupancy by Ownership in Pitkin
Of the total 146 dwellings in Pitkin, owner-occupied units account for 122 (83.6%), while renter-occupied units make up 24 (16.4%).
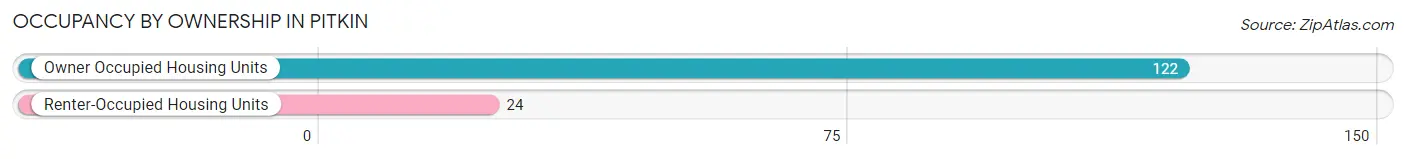
| Occupancy | # Housing Units | % Housing Units |
| Owner Occupied Housing Units | 122 | 83.6% |
| Renter-Occupied Housing Units | 24 | 16.4% |
| Total Occupied Housing Units | 146 | 100.0% |
Occupancy by Household Size in Pitkin
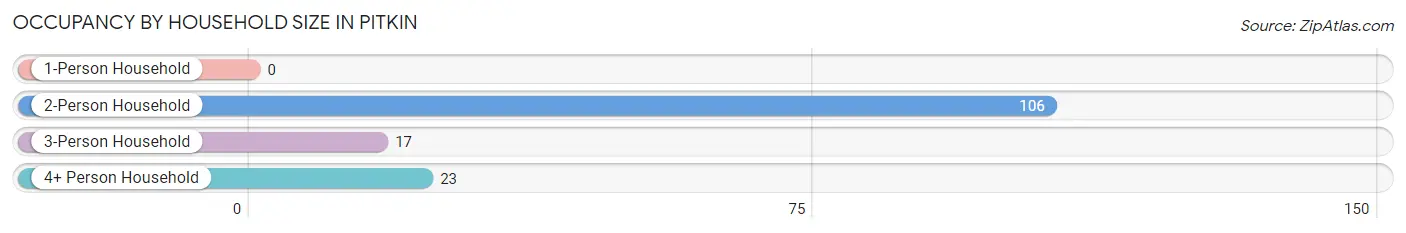
| Household Size | # Housing Units | % Housing Units |
| 1-Person Household | 0 | 0.0% |
| 2-Person Household | 106 | 72.6% |
| 3-Person Household | 17 | 11.6% |
| 4+ Person Household | 23 | 15.8% |
| Total Housing Units | 146 | 100.0% |
Occupancy by Ownership by Household Size in Pitkin
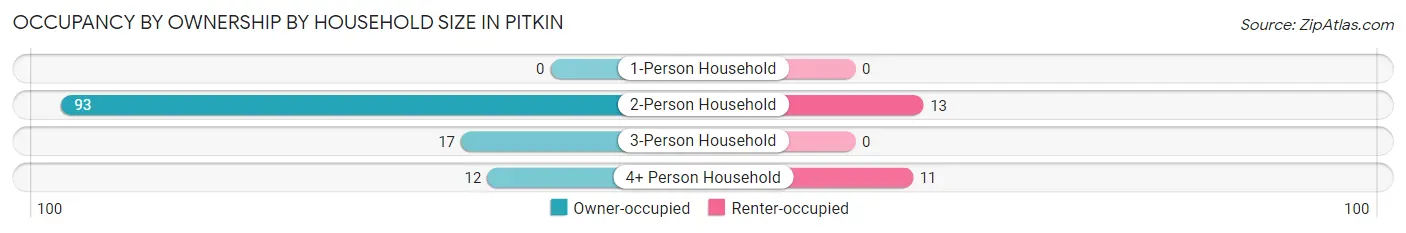
| Household Size | Owner-occupied | Renter-occupied |
| 1-Person Household | 0 (0.0%) | 0 (0.0%) |
| 2-Person Household | 93 (87.7%) | 13 (12.3%) |
| 3-Person Household | 17 (100.0%) | 0 (0.0%) |
| 4+ Person Household | 12 (52.2%) | 11 (47.8%) |
| Total Housing Units | 122 (83.6%) | 24 (16.4%) |
Occupancy by Educational Attainment in Pitkin
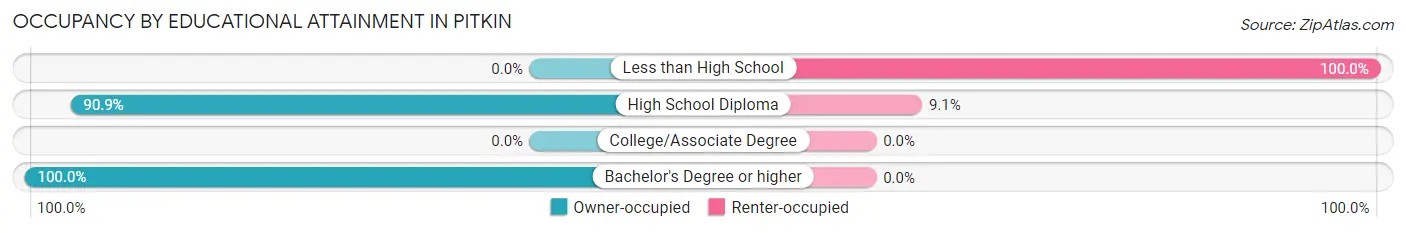
| Household Size | Owner-occupied | Renter-occupied |
| Less than High School | 0 (0.0%) | 13 (100.0%) |
| High School Diploma | 110 (90.9%) | 11 (9.1%) |
| College/Associate Degree | 0 (0.0%) | 0 (0.0%) |
| Bachelor's Degree or higher | 12 (100.0%) | 0 (0.0%) |
Occupancy by Age of Householder in Pitkin
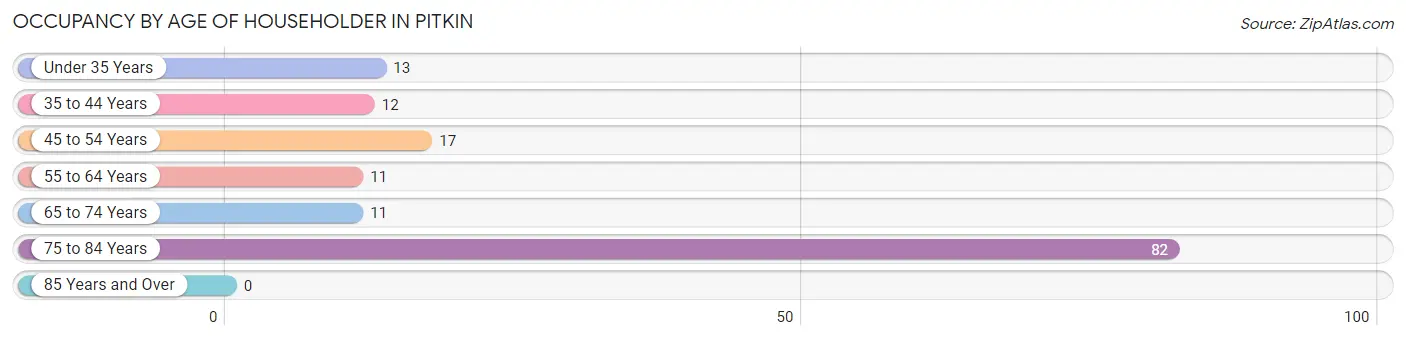
| Age Bracket | # Households | % Households |
| Under 35 Years | 13 | 8.9% |
| 35 to 44 Years | 12 | 8.2% |
| 45 to 54 Years | 17 | 11.6% |
| 55 to 64 Years | 11 | 7.5% |
| 65 to 74 Years | 11 | 7.5% |
| 75 to 84 Years | 82 | 56.2% |
| 85 Years and Over | 0 | 0.0% |
| Total | 146 | 100.0% |
Housing Finances in Pitkin
Median Income by Occupancy in Pitkin
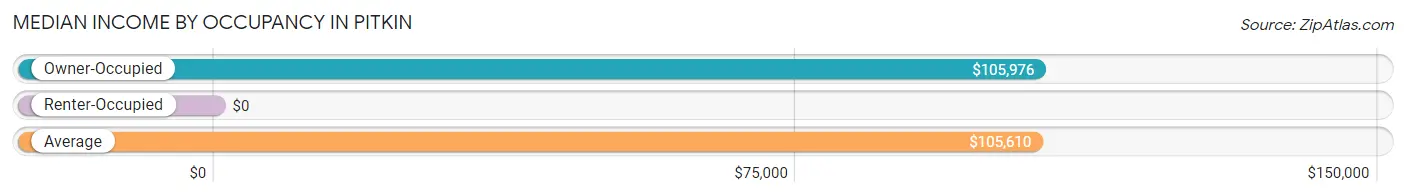
| Occupancy Type | # Households | Median Income |
| Owner-Occupied | 122 (83.6%) | $105,976 |
| Renter-Occupied | 24 (16.4%) | $0 |
| Average | 146 (100.0%) | $105,610 |
Occupancy by Householder Income Bracket in Pitkin
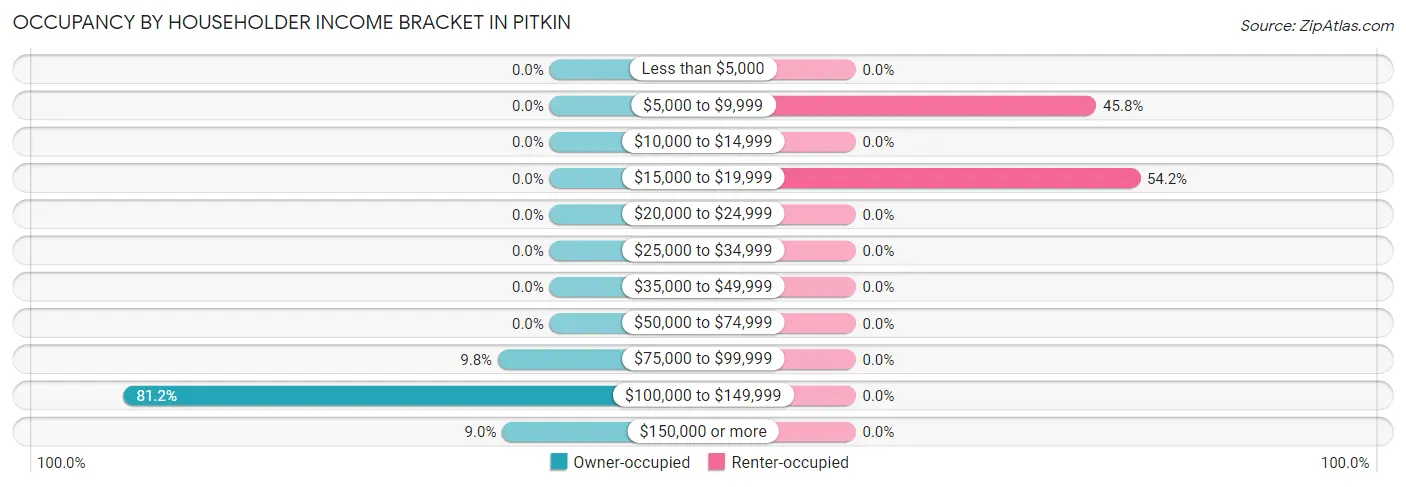
| Income Bracket | Owner-occupied | Renter-occupied |
| Less than $5,000 | 0 (0.0%) | 0 (0.0%) |
| $5,000 to $9,999 | 0 (0.0%) | 11 (45.8%) |
| $10,000 to $14,999 | 0 (0.0%) | 0 (0.0%) |
| $15,000 to $19,999 | 0 (0.0%) | 13 (54.2%) |
| $20,000 to $24,999 | 0 (0.0%) | 0 (0.0%) |
| $25,000 to $34,999 | 0 (0.0%) | 0 (0.0%) |
| $35,000 to $49,999 | 0 (0.0%) | 0 (0.0%) |
| $50,000 to $74,999 | 0 (0.0%) | 0 (0.0%) |
| $75,000 to $99,999 | 12 (9.8%) | 0 (0.0%) |
| $100,000 to $149,999 | 99 (81.1%) | 0 (0.0%) |
| $150,000 or more | 11 (9.0%) | 0 (0.0%) |
| Total | 122 (100.0%) | 24 (100.0%) |
Monthly Housing Cost Tiers in Pitkin
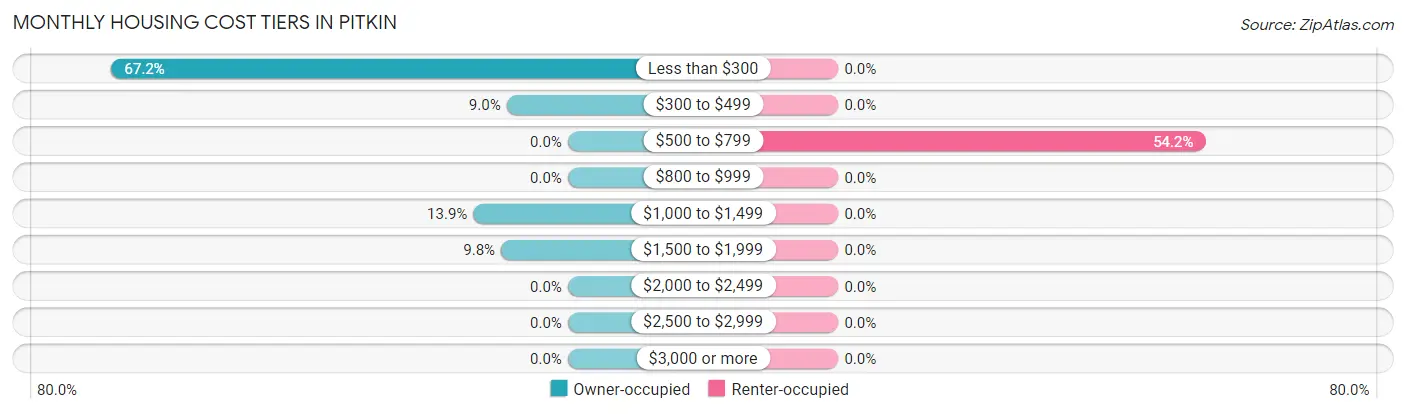
| Monthly Cost | Owner-occupied | Renter-occupied |
| Less than $300 | 82 (67.2%) | 0 (0.0%) |
| $300 to $499 | 11 (9.0%) | 0 (0.0%) |
| $500 to $799 | 0 (0.0%) | 13 (54.2%) |
| $800 to $999 | 0 (0.0%) | 0 (0.0%) |
| $1,000 to $1,499 | 17 (13.9%) | 0 (0.0%) |
| $1,500 to $1,999 | 12 (9.8%) | 0 (0.0%) |
| $2,000 to $2,499 | 0 (0.0%) | 0 (0.0%) |
| $2,500 to $2,999 | 0 (0.0%) | 0 (0.0%) |
| $3,000 or more | 0 (0.0%) | 0 (0.0%) |
| Total | 122 (100.0%) | 24 (100.0%) |
Physical Housing Characteristics in Pitkin
Housing Structures in Pitkin
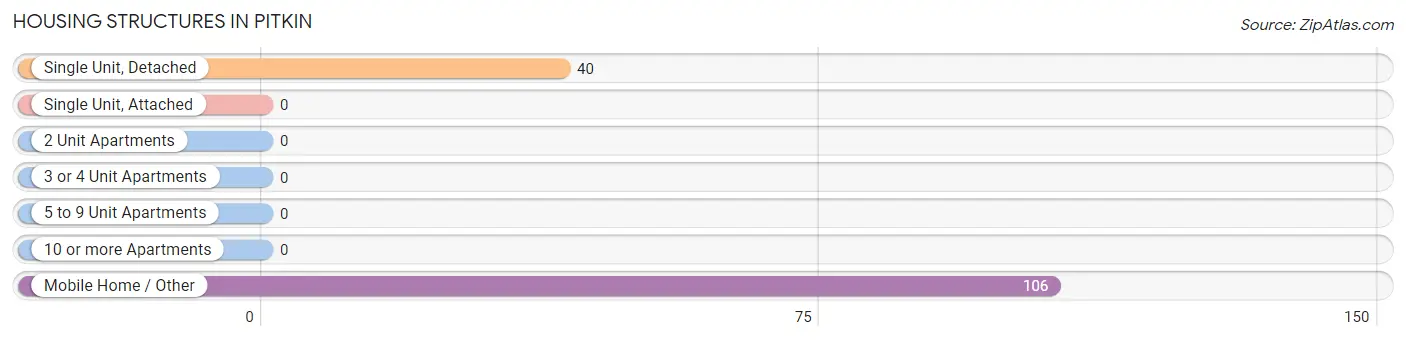
| Structure Type | # Housing Units | % Housing Units |
| Single Unit, Detached | 40 | 27.4% |
| Single Unit, Attached | 0 | 0.0% |
| 2 Unit Apartments | 0 | 0.0% |
| 3 or 4 Unit Apartments | 0 | 0.0% |
| 5 to 9 Unit Apartments | 0 | 0.0% |
| 10 or more Apartments | 0 | 0.0% |
| Mobile Home / Other | 106 | 72.6% |
| Total | 146 | 100.0% |
Housing Structures by Occupancy in Pitkin
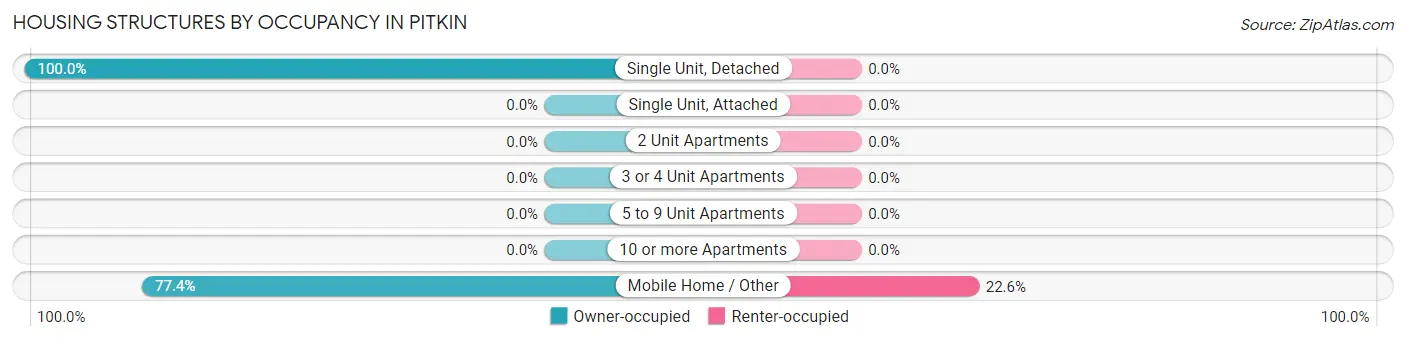
| Structure Type | Owner-occupied | Renter-occupied |
| Single Unit, Detached | 40 (100.0%) | 0 (0.0%) |
| Single Unit, Attached | 0 (0.0%) | 0 (0.0%) |
| 2 Unit Apartments | 0 (0.0%) | 0 (0.0%) |
| 3 or 4 Unit Apartments | 0 (0.0%) | 0 (0.0%) |
| 5 to 9 Unit Apartments | 0 (0.0%) | 0 (0.0%) |
| 10 or more Apartments | 0 (0.0%) | 0 (0.0%) |
| Mobile Home / Other | 82 (77.4%) | 24 (22.6%) |
| Total | 122 (83.6%) | 24 (16.4%) |
Housing Structures by Number of Rooms in Pitkin
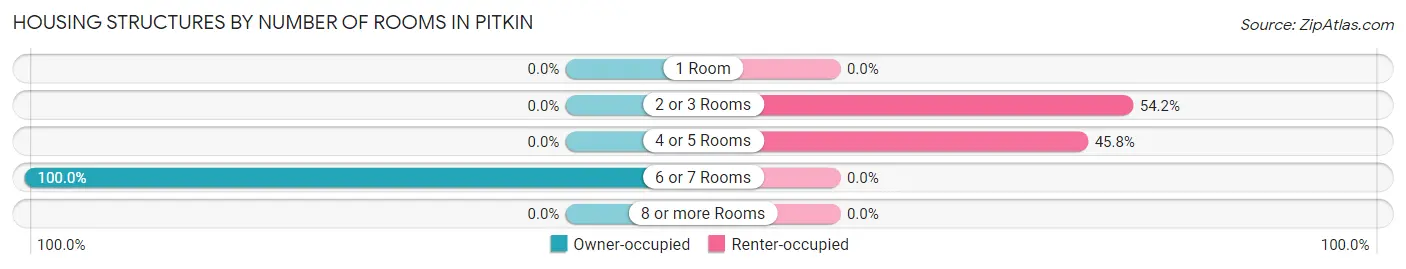
| Number of Rooms | Owner-occupied | Renter-occupied |
| 1 Room | 0 (0.0%) | 0 (0.0%) |
| 2 or 3 Rooms | 0 (0.0%) | 13 (54.2%) |
| 4 or 5 Rooms | 0 (0.0%) | 11 (45.8%) |
| 6 or 7 Rooms | 122 (100.0%) | 0 (0.0%) |
| 8 or more Rooms | 0 (0.0%) | 0 (0.0%) |
| Total | 122 (100.0%) | 24 (100.0%) |
Housing Structure by Heating Type in Pitkin
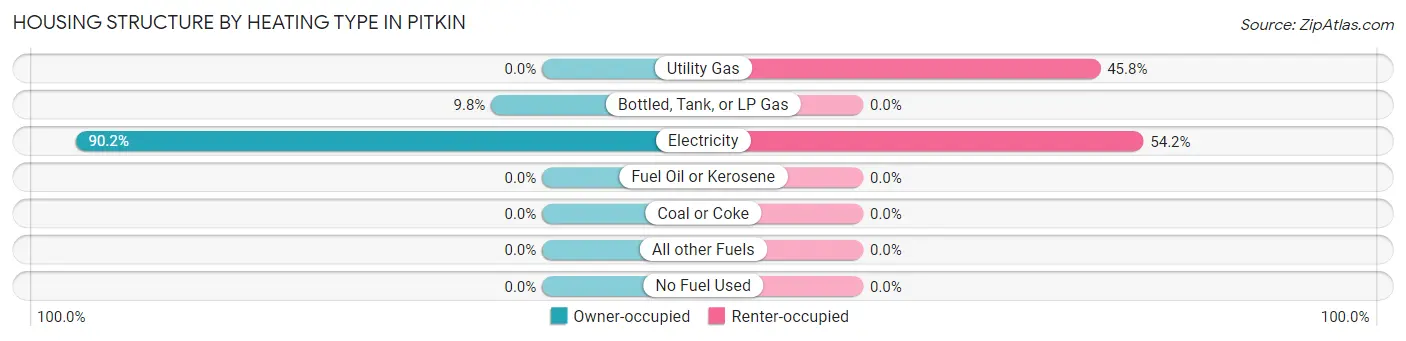
| Heating Type | Owner-occupied | Renter-occupied |
| Utility Gas | 0 (0.0%) | 11 (45.8%) |
| Bottled, Tank, or LP Gas | 12 (9.8%) | 0 (0.0%) |
| Electricity | 110 (90.2%) | 13 (54.2%) |
| Fuel Oil or Kerosene | 0 (0.0%) | 0 (0.0%) |
| Coal or Coke | 0 (0.0%) | 0 (0.0%) |
| All other Fuels | 0 (0.0%) | 0 (0.0%) |
| No Fuel Used | 0 (0.0%) | 0 (0.0%) |
| Total | 122 (100.0%) | 24 (100.0%) |
Household Vehicle Usage in Pitkin
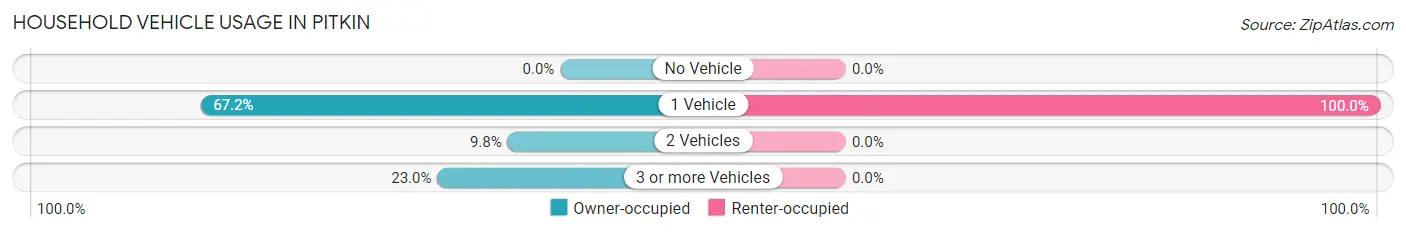
| Vehicles per Household | Owner-occupied | Renter-occupied |
| No Vehicle | 0 (0.0%) | 0 (0.0%) |
| 1 Vehicle | 82 (67.2%) | 24 (100.0%) |
| 2 Vehicles | 12 (9.8%) | 0 (0.0%) |
| 3 or more Vehicles | 28 (23.0%) | 0 (0.0%) |
| Total | 122 (100.0%) | 24 (100.0%) |
Real Estate & Mortgages in Pitkin
Real Estate and Mortgage Overview in Pitkin
| Characteristic | Without Mortgage | With Mortgage |
| Housing Units | 93 | 29 |
| Median Property Value | - | - |
| Median Household Income | - | - |
| Monthly Housing Costs | - | - |
| Real Estate Taxes | - | - |
Property Value by Mortgage Status in Pitkin
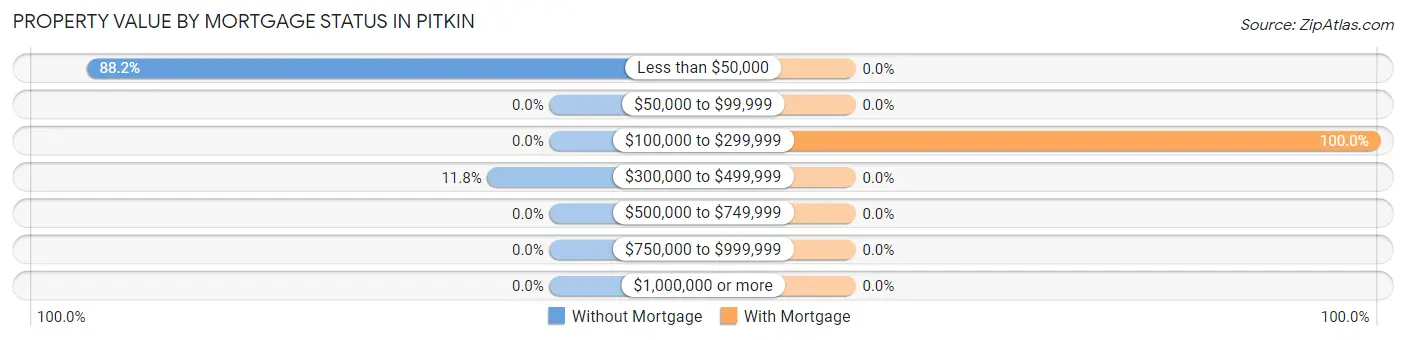
| Property Value | Without Mortgage | With Mortgage |
| Less than $50,000 | 82 (88.2%) | 0 (0.0%) |
| $50,000 to $99,999 | 0 (0.0%) | 0 (0.0%) |
| $100,000 to $299,999 | 0 (0.0%) | 29 (100.0%) |
| $300,000 to $499,999 | 11 (11.8%) | 0 (0.0%) |
| $500,000 to $749,999 | 0 (0.0%) | 0 (0.0%) |
| $750,000 to $999,999 | 0 (0.0%) | 0 (0.0%) |
| $1,000,000 or more | 0 (0.0%) | 0 (0.0%) |
| Total | 93 (100.0%) | 29 (100.0%) |
Household Income by Mortgage Status in Pitkin
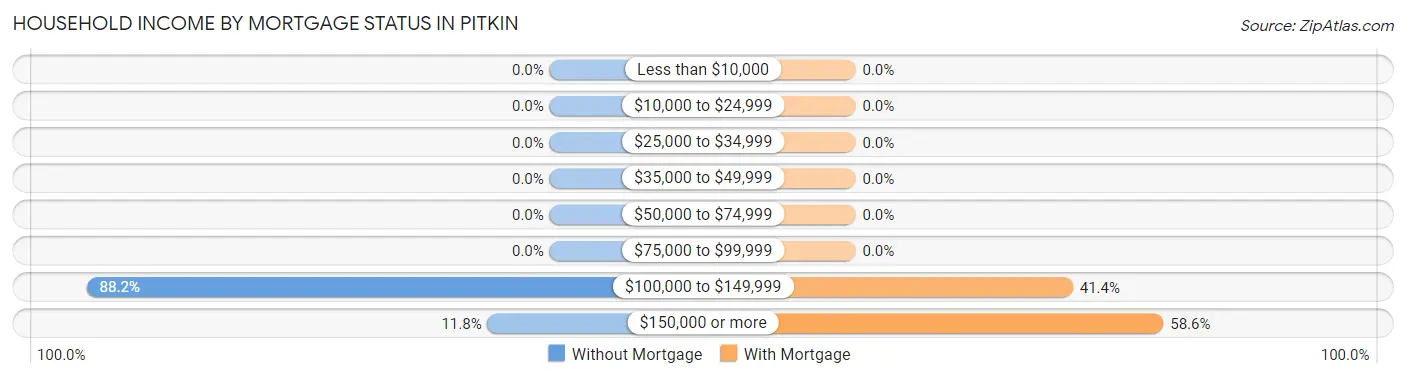
| Household Income | Without Mortgage | With Mortgage |
| Less than $10,000 | 0 (0.0%) | 0 (0.0%) |
| $10,000 to $24,999 | 0 (0.0%) | 0 (0.0%) |
| $25,000 to $34,999 | 0 (0.0%) | 0 (0.0%) |
| $35,000 to $49,999 | 0 (0.0%) | 0 (0.0%) |
| $50,000 to $74,999 | 0 (0.0%) | 0 (0.0%) |
| $75,000 to $99,999 | 0 (0.0%) | 0 (0.0%) |
| $100,000 to $149,999 | 82 (88.2%) | 12 (41.4%) |
| $150,000 or more | 11 (11.8%) | 17 (58.6%) |
| Total | 93 (100.0%) | 29 (100.0%) |
Property Value to Household Income Ratio in Pitkin
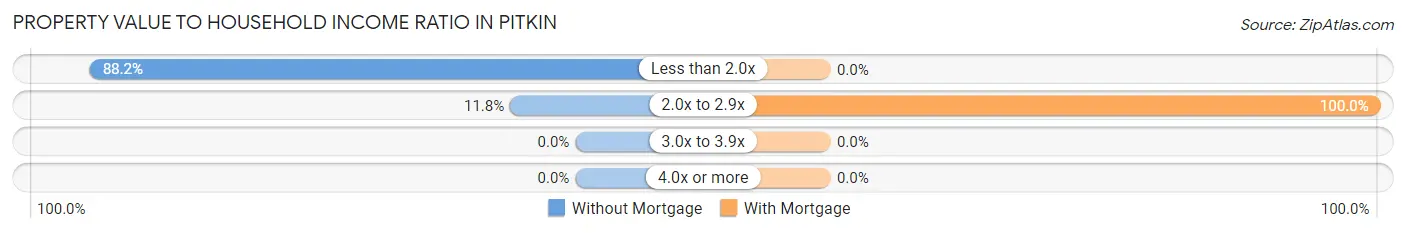
| Value-to-Income Ratio | Without Mortgage | With Mortgage |
| Less than 2.0x | 82 (88.2%) | 0 (0.0%) |
| 2.0x to 2.9x | 11 (11.8%) | 29 (100.0%) |
| 3.0x to 3.9x | 0 (0.0%) | 0 (0.0%) |
| 4.0x or more | 0 (0.0%) | 0 (0.0%) |
| Total | 93 (100.0%) | 29 (100.0%) |
Real Estate Taxes by Mortgage Status in Pitkin
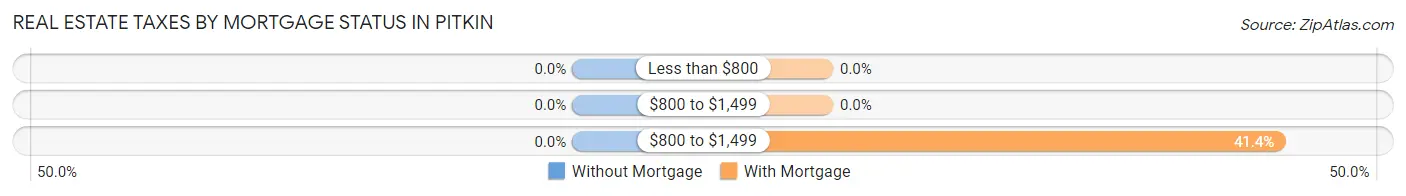
| Property Taxes | Without Mortgage | With Mortgage |
| Less than $800 | 0 (0.0%) | 0 (0.0%) |
| $800 to $1,499 | 0 (0.0%) | 0 (0.0%) |
| $800 to $1,499 | 0 (0.0%) | 12 (41.4%) |
| Total | 93 (100.0%) | 29 (100.0%) |
Health & Disability in Pitkin
Health Insurance Coverage by Age in Pitkin
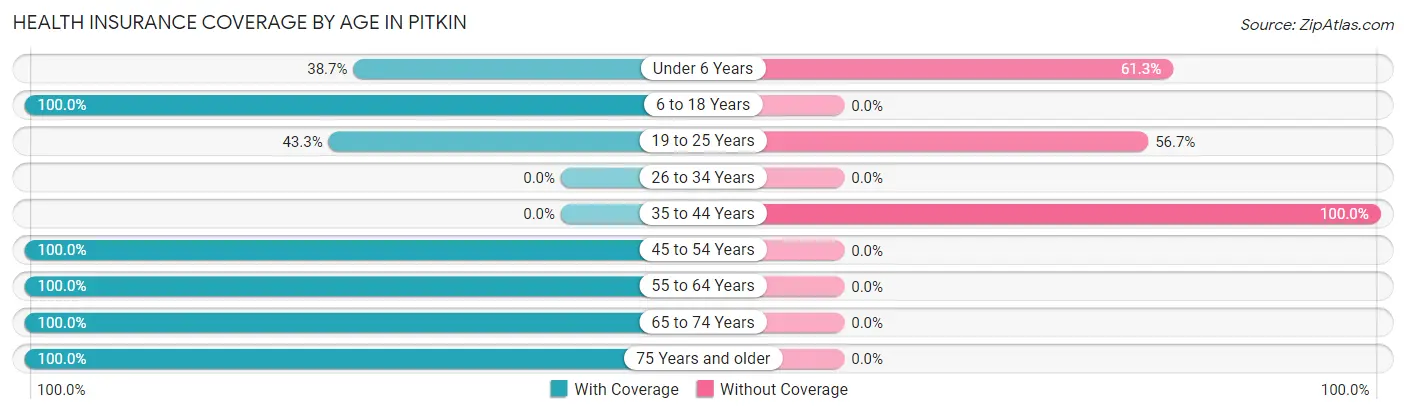
| Age Bracket | With Coverage | Without Coverage |
| Under 6 Years | 12 (38.7%) | 19 (61.3%) |
| 6 to 18 Years | 32 (100.0%) | 0 (0.0%) |
| 19 to 25 Years | 13 (43.3%) | 17 (56.7%) |
| 26 to 34 Years | 0 (0.0%) | 0 (0.0%) |
| 35 to 44 Years | 0 (0.0%) | 36 (100.0%) |
| 45 to 54 Years | 17 (100.0%) | 0 (0.0%) |
| 55 to 64 Years | 22 (100.0%) | 0 (0.0%) |
| 65 to 74 Years | 11 (100.0%) | 0 (0.0%) |
| 75 Years and older | 82 (100.0%) | 0 (0.0%) |
| Total | 189 (72.4%) | 72 (27.6%) |
Health Insurance Coverage by Citizenship Status in Pitkin
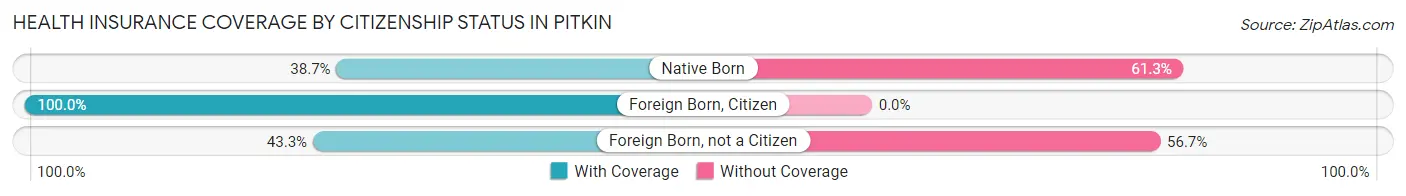
| Citizenship Status | With Coverage | Without Coverage |
| Native Born | 12 (38.7%) | 19 (61.3%) |
| Foreign Born, Citizen | 32 (100.0%) | 0 (0.0%) |
| Foreign Born, not a Citizen | 13 (43.3%) | 17 (56.7%) |
Health Insurance Coverage by Household Income in Pitkin
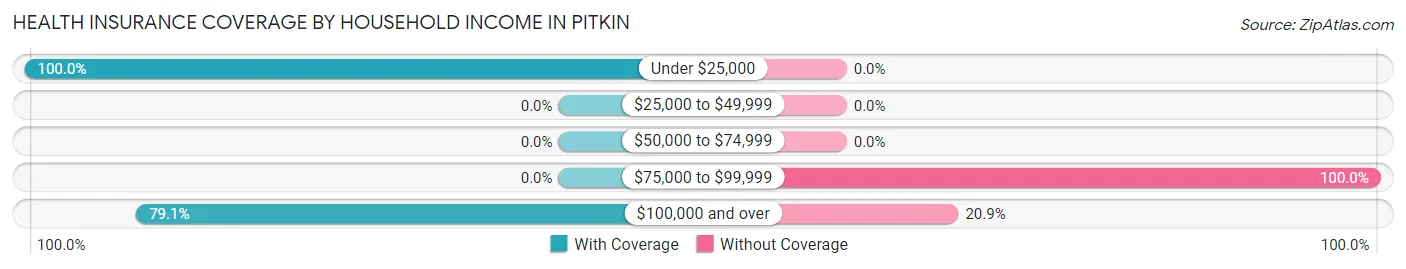
| Household Income | With Coverage | Without Coverage |
| Under $25,000 | 68 (100.0%) | 0 (0.0%) |
| $25,000 to $49,999 | 0 (0.0%) | 0 (0.0%) |
| $50,000 to $74,999 | 0 (0.0%) | 0 (0.0%) |
| $75,000 to $99,999 | 0 (0.0%) | 40 (100.0%) |
| $100,000 and over | 121 (79.1%) | 32 (20.9%) |
Public vs Private Health Insurance Coverage by Age in Pitkin
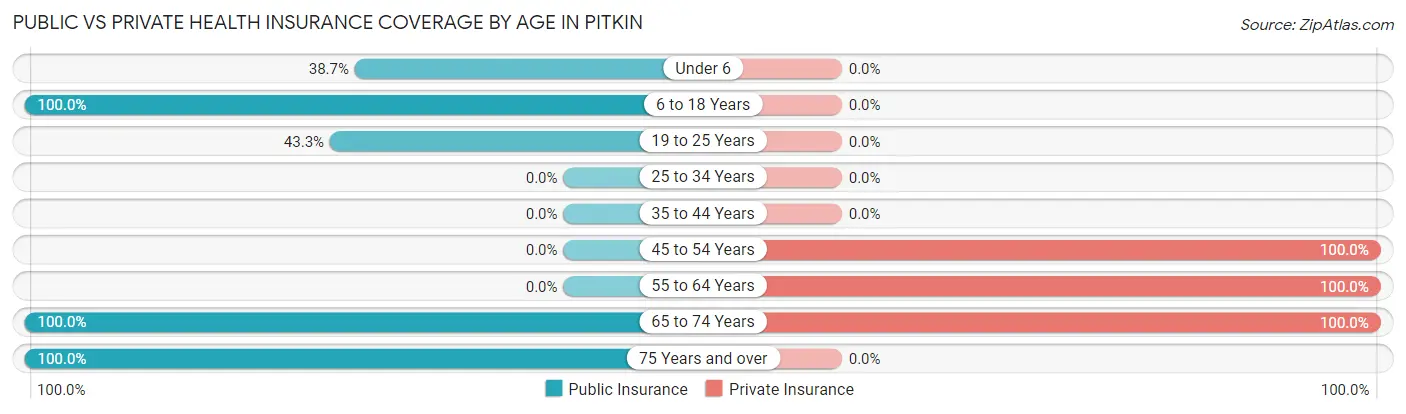
| Age Bracket | Public Insurance | Private Insurance |
| Under 6 | 12 (38.7%) | 0 (0.0%) |
| 6 to 18 Years | 32 (100.0%) | 0 (0.0%) |
| 19 to 25 Years | 13 (43.3%) | 0 (0.0%) |
| 25 to 34 Years | 0 (0.0%) | 0 (0.0%) |
| 35 to 44 Years | 0 (0.0%) | 0 (0.0%) |
| 45 to 54 Years | 0 (0.0%) | 17 (100.0%) |
| 55 to 64 Years | 0 (0.0%) | 22 (100.0%) |
| 65 to 74 Years | 11 (100.0%) | 11 (100.0%) |
| 75 Years and over | 82 (100.0%) | 0 (0.0%) |
| Total | 150 (57.5%) | 50 (19.2%) |
Disability Status by Sex by Age in Pitkin
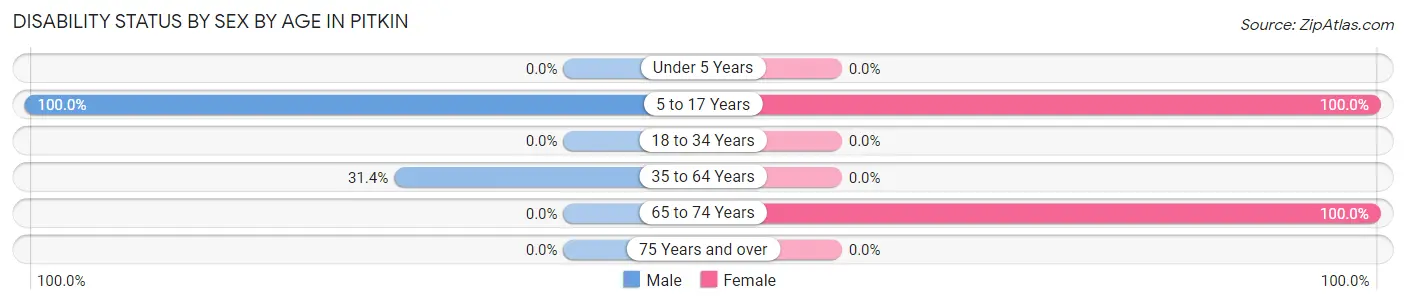
| Age Bracket | Male | Female |
| Under 5 Years | 0 (0.0%) | 0 (0.0%) |
| 5 to 17 Years | 10 (100.0%) | 22 (100.0%) |
| 18 to 34 Years | 0 (0.0%) | 0 (0.0%) |
| 35 to 64 Years | 11 (31.4%) | 0 (0.0%) |
| 65 to 74 Years | 0 (0.0%) | 11 (100.0%) |
| 75 Years and over | 0 (0.0%) | 0 (0.0%) |
Disability Class by Sex by Age in Pitkin
Disability Class: Hearing Difficulty
| Age Bracket | Male | Female |
| Under 5 Years | 0 (0.0%) | 0 (0.0%) |
| 5 to 17 Years | 0 (0.0%) | 0 (0.0%) |
| 18 to 34 Years | 0 (0.0%) | 0 (0.0%) |
| 35 to 64 Years | 0 (0.0%) | 0 (0.0%) |
| 65 to 74 Years | 0 (0.0%) | 0 (0.0%) |
| 75 Years and over | 0 (0.0%) | 0 (0.0%) |
Disability Class: Vision Difficulty
| Age Bracket | Male | Female |
| Under 5 Years | 0 (0.0%) | 0 (0.0%) |
| 5 to 17 Years | 0 (0.0%) | 0 (0.0%) |
| 18 to 34 Years | 0 (0.0%) | 0 (0.0%) |
| 35 to 64 Years | 0 (0.0%) | 0 (0.0%) |
| 65 to 74 Years | 0 (0.0%) | 0 (0.0%) |
| 75 Years and over | 0 (0.0%) | 0 (0.0%) |
Disability Class: Cognitive Difficulty
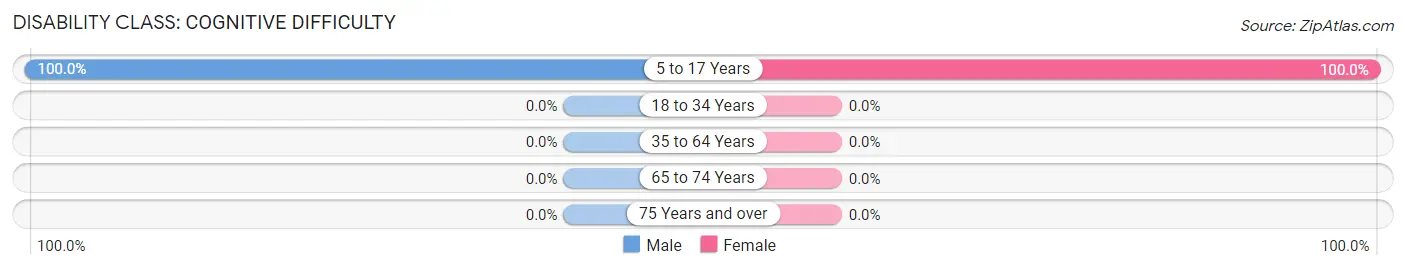
| Age Bracket | Male | Female |
| 5 to 17 Years | 10 (100.0%) | 22 (100.0%) |
| 18 to 34 Years | 0 (0.0%) | 0 (0.0%) |
| 35 to 64 Years | 0 (0.0%) | 0 (0.0%) |
| 65 to 74 Years | 0 (0.0%) | 0 (0.0%) |
| 75 Years and over | 0 (0.0%) | 0 (0.0%) |
Disability Class: Ambulatory Difficulty
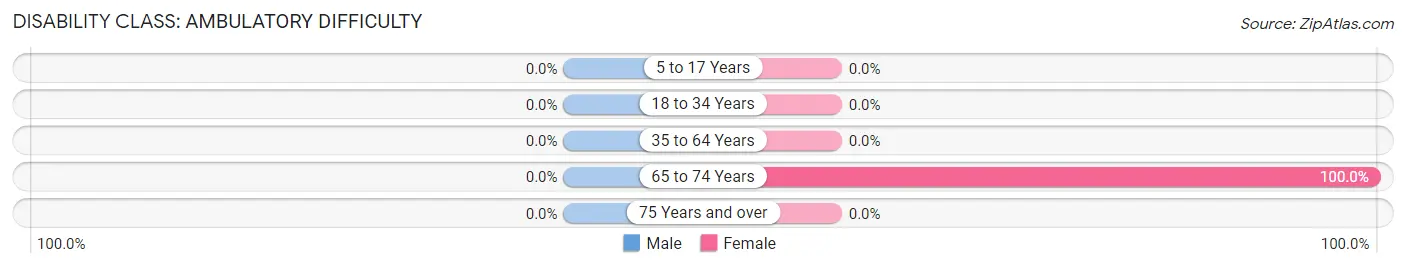
| Age Bracket | Male | Female |
| 5 to 17 Years | 0 (0.0%) | 0 (0.0%) |
| 18 to 34 Years | 0 (0.0%) | 0 (0.0%) |
| 35 to 64 Years | 0 (0.0%) | 0 (0.0%) |
| 65 to 74 Years | 0 (0.0%) | 11 (100.0%) |
| 75 Years and over | 0 (0.0%) | 0 (0.0%) |
Disability Class: Self-Care Difficulty
| Age Bracket | Male | Female |
| 5 to 17 Years | 0 (0.0%) | 0 (0.0%) |
| 18 to 34 Years | 0 (0.0%) | 0 (0.0%) |
| 35 to 64 Years | 0 (0.0%) | 0 (0.0%) |
| 65 to 74 Years | 0 (0.0%) | 0 (0.0%) |
| 75 Years and over | 0 (0.0%) | 0 (0.0%) |
Technology Access in Pitkin
Computing Device Access in Pitkin
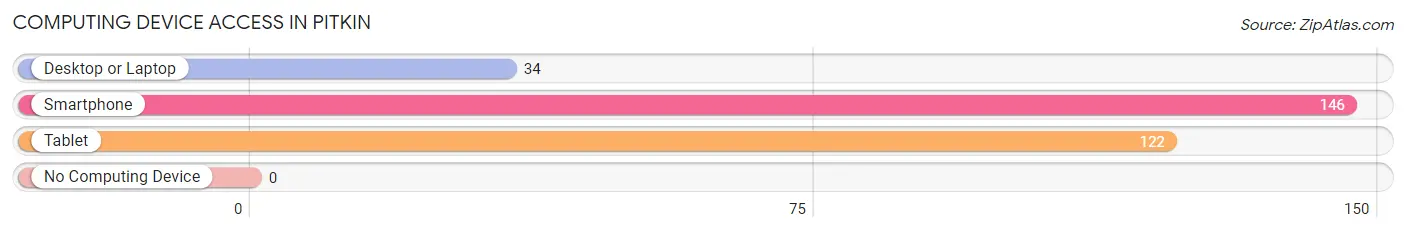
| Device Type | # Households | % Households |
| Desktop or Laptop | 34 | 23.3% |
| Smartphone | 146 | 100.0% |
| Tablet | 122 | 83.6% |
| No Computing Device | 0 | 0.0% |
| Total | 146 | 100.0% |
Internet Access in Pitkin
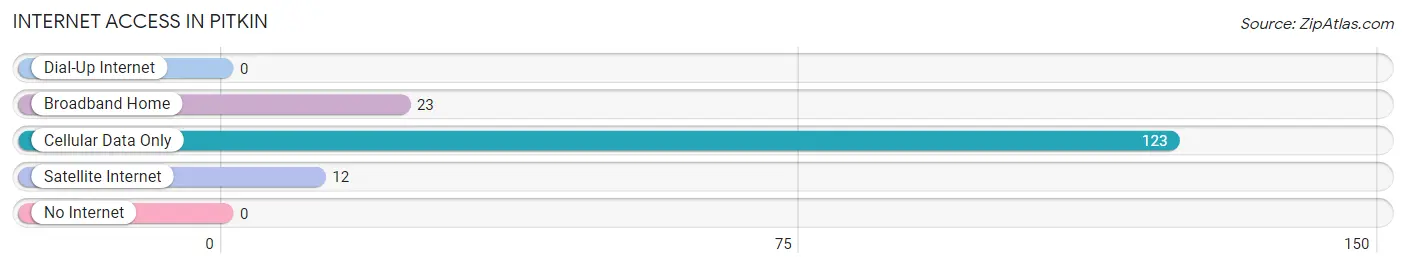
| Internet Type | # Households | % Households |
| Dial-Up Internet | 0 | 0.0% |
| Broadband Home | 23 | 15.8% |
| Cellular Data Only | 123 | 84.3% |
| Satellite Internet | 12 | 8.2% |
| No Internet | 0 | 0.0% |
| Total | 146 | 100.0% |
Pitkin Summary
Pitkin is a small town located in Vernon Parish, Louisiana. It is situated in the northwest corner of the state, near the Texas border. The town has a population of approximately 1,000 people and is part of the Leesville-Fort Polk Metropolitan Statistical Area.
History
Pitkin was founded in 1883 by a group of settlers from the nearby town of Leesville. The town was named after the nearby Pitkin Creek, which was named after a local family. The town was originally a farming community, but it soon developed into a small trading center. In the early 1900s, the town was home to several stores, a post office, a bank, and a hotel.
In the 1920s, the town began to experience a period of growth. The population increased from around 500 to over 1,000. The town also saw the construction of several new buildings, including a school, a church, and a movie theater.
In the 1950s, the town experienced a decline in population as many of its residents moved away in search of better economic opportunities. The population decreased to around 500 by the 1970s.
Geography
Pitkin is located in the northwest corner of Louisiana, near the Texas border. The town is situated in the Kisatchie National Forest, which is the largest national forest in the state. The town is surrounded by rolling hills and is home to several small lakes and streams.
The climate in Pitkin is humid subtropical, with hot summers and mild winters. The average annual temperature is around 70 degrees Fahrenheit. The town receives an average of 48 inches of rain per year.
Economy
The economy of Pitkin is largely based on agriculture. The town is home to several farms, which produce a variety of crops, including corn, soybeans, and cotton. The town also has a small manufacturing sector, which produces a variety of products, including furniture and clothing.
The town is also home to several small businesses, including restaurants, stores, and service providers. The town is also home to a small airport, which serves the surrounding area.
Demographics
As of the 2010 census, the population of Pitkin was 1,000. The racial makeup of the town was 95.2% White, 0.7% African American, 0.7% Native American, 0.3% Asian, and 2.1% from other races. The median household income was $30,000, and the median family income was $35,000.
The town is home to several churches, including Baptist, Methodist, and Catholic. The town also has a public library and a museum. The town is served by the Vernon Parish School District.
Conclusion
Pitkin is a small town located in Vernon Parish, Louisiana. The town has a population of approximately 1,000 people and is part of the Leesville-Fort Polk Metropolitan Statistical Area. The town was founded in 1883 and was originally a farming community. The town has since developed into a small trading center and is home to several small businesses. The economy of Pitkin is largely based on agriculture, and the town is home to several churches, a public library, and a museum. The population of Pitkin is mostly White, with a small percentage of African American, Native American, and Asian residents.
Common Questions
What is Per Capita Income in Pitkin?
Per Capita income in Pitkin is $44,481.
What is the Median Family Income in Pitkin?
Median Family Income in Pitkin is $84,167.
What is the Median Household income in Pitkin?
Median Household Income in Pitkin is $105,610.
What is Inequality or Gini Index in Pitkin?
Inequality or Gini Index in Pitkin is 0.20.
What is the Total Population of Pitkin?
Total Population of Pitkin is 381.
What is the Total Male Population of Pitkin?
Total Male Population of Pitkin is 282.
What is the Total Female Population of Pitkin?
Total Female Population of Pitkin is 99.
What is the Ratio of Males per 100 Females in Pitkin?
There are 284.85 Males per 100 Females in Pitkin.
What is the Ratio of Females per 100 Males in Pitkin?
There are 35.11 Females per 100 Males in Pitkin.
What is the Median Population Age in Pitkin?
Median Population Age in Pitkin is 41.6 Years.
What is the Average Family Size in Pitkin
Average Family Size in Pitkin is 2.8 People.
What is the Average Household Size in Pitkin
Average Household Size in Pitkin is 2.6 People.
How Large is the Labor Force in Pitkin?
There are 200 People in the Labor Forcein in Pitkin.
What is the Percentage of People in the Labor Force in Pitkin?
62.9% of People are in the Labor Force in Pitkin.