Pioneer, LA Map & Demographics
Pioneer Map
Pioneer Overview
$23,026
PER CAPITA INCOME
$76,201
AVG FAMILY INCOME
$75,539
AVG HOUSEHOLD INCOME
66.3%
WAGE / INCOME GAP [ % ]
33.7¢/ $1
WAGE / INCOME GAP [ $ ]
0.27
INEQUALITY / GINI INDEX
489
TOTAL POPULATION
155
MALE POPULATION
334
FEMALE POPULATION
46.41
MALES / 100 FEMALES
215.48
FEMALES / 100 MALES
28.4
MEDIAN AGE
4.1
AVG FAMILY SIZE
3.5
AVG HOUSEHOLD SIZE
251
LABOR FORCE [ PEOPLE ]
76.5%
PERCENT IN LABOR FORCE
0.8%
UNEMPLOYMENT RATE
Pioneer Zip Codes
Pioneer Area Codes
Income in Pioneer
Income Overview in Pioneer
Per Capita Income in Pioneer is $23,026, while median incomes of families and households are $76,201 and $75,539 respectively.
| Characteristic | Number | Measure |
| Per Capita Income | 489 | $23,026 |
| Median Family Income | 113 | $76,201 |
| Mean Family Income | 113 | $68,627 |
| Median Household Income | 140 | $75,539 |
| Mean Household Income | 140 | $61,296 |
| Income Deficit | 113 | $0 |
| Wage / Income Gap (%) | 489 | 66.29% |
| Wage / Income Gap ($) | 489 | 33.71¢ per $1 |
| Gini / Inequality Index | 489 | 0.27 |
Earnings by Sex in Pioneer
Average Earnings in Pioneer are $51,786, $19,665 for men and $58,329 for women, a difference of 66.3%.
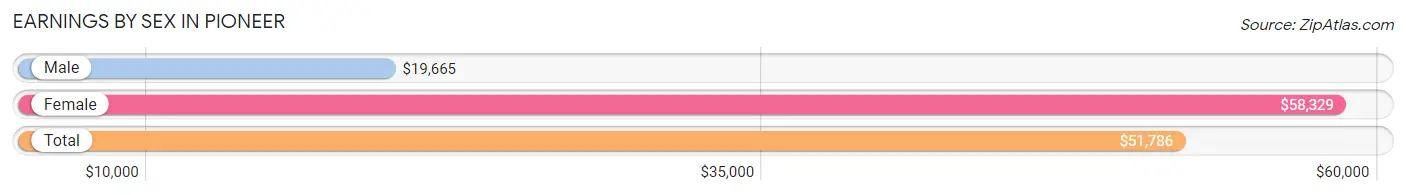
| Sex | Number | Average Earnings |
| Male | 109 (43.2%) | $19,665 |
| Female | 143 (56.8%) | $58,329 |
| Total | 252 (100.0%) | $51,786 |
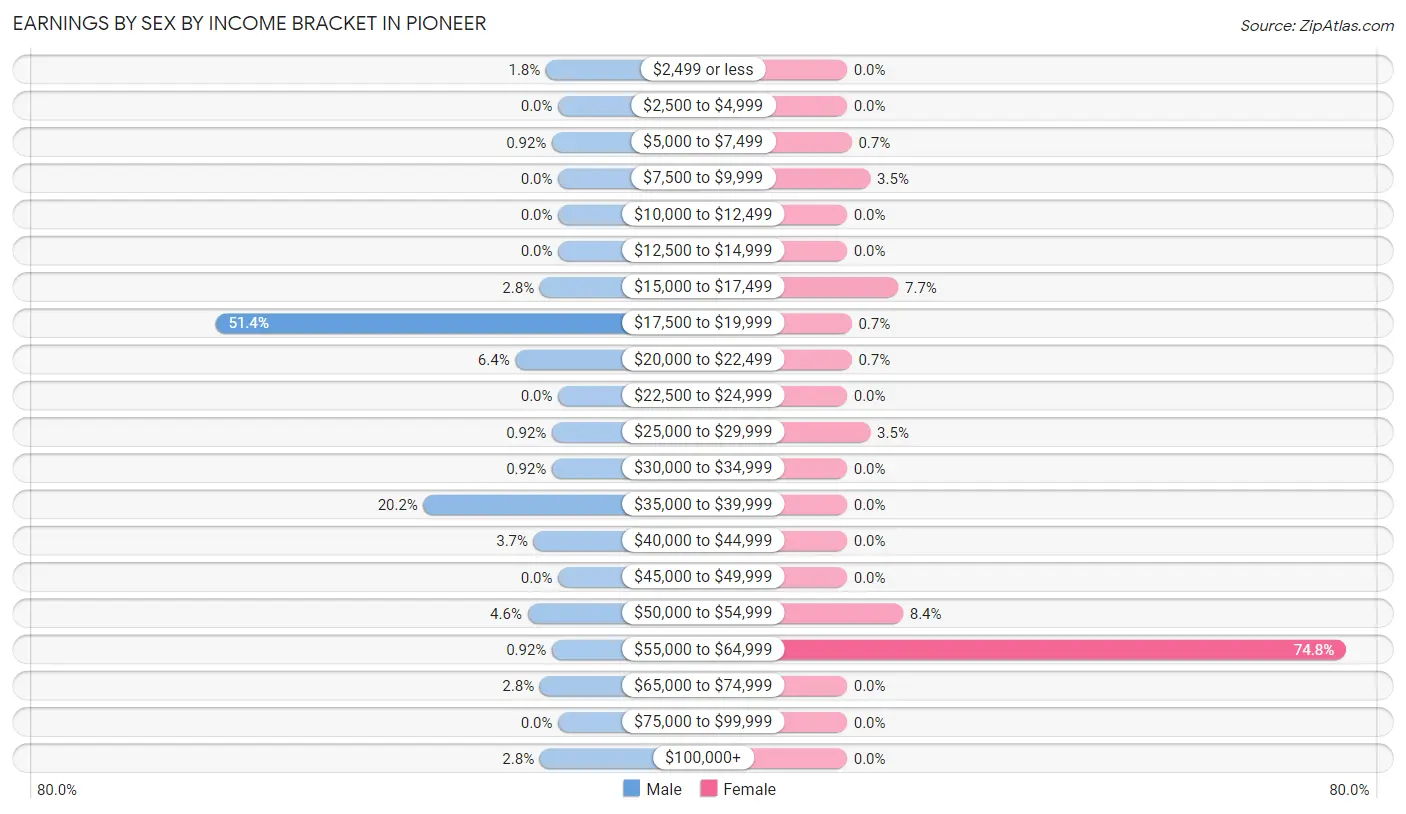
Earnings by Sex by Income Bracket in Pioneer
The most common earnings brackets in Pioneer are $17,500 to $19,999 for men (56 | 51.4%) and $55,000 to $64,999 for women (107 | 74.8%).
| Income | Male | Female |
| $2,499 or less | 2 (1.8%) | 0 (0.0%) |
| $2,500 to $4,999 | 0 (0.0%) | 0 (0.0%) |
| $5,000 to $7,499 | 1 (0.9%) | 1 (0.7%) |
| $7,500 to $9,999 | 0 (0.0%) | 5 (3.5%) |
| $10,000 to $12,499 | 0 (0.0%) | 0 (0.0%) |
| $12,500 to $14,999 | 0 (0.0%) | 0 (0.0%) |
| $15,000 to $17,499 | 3 (2.8%) | 11 (7.7%) |
| $17,500 to $19,999 | 56 (51.4%) | 1 (0.7%) |
| $20,000 to $22,499 | 7 (6.4%) | 1 (0.7%) |
| $22,500 to $24,999 | 0 (0.0%) | 0 (0.0%) |
| $25,000 to $29,999 | 1 (0.9%) | 5 (3.5%) |
| $30,000 to $34,999 | 1 (0.9%) | 0 (0.0%) |
| $35,000 to $39,999 | 22 (20.2%) | 0 (0.0%) |
| $40,000 to $44,999 | 4 (3.7%) | 0 (0.0%) |
| $45,000 to $49,999 | 0 (0.0%) | 0 (0.0%) |
| $50,000 to $54,999 | 5 (4.6%) | 12 (8.4%) |
| $55,000 to $64,999 | 1 (0.9%) | 107 (74.8%) |
| $65,000 to $74,999 | 3 (2.8%) | 0 (0.0%) |
| $75,000 to $99,999 | 0 (0.0%) | 0 (0.0%) |
| $100,000+ | 3 (2.8%) | 0 (0.0%) |
| Total | 109 (100.0%) | 143 (100.0%) |
Earnings by Sex by Educational Attainment in Pioneer
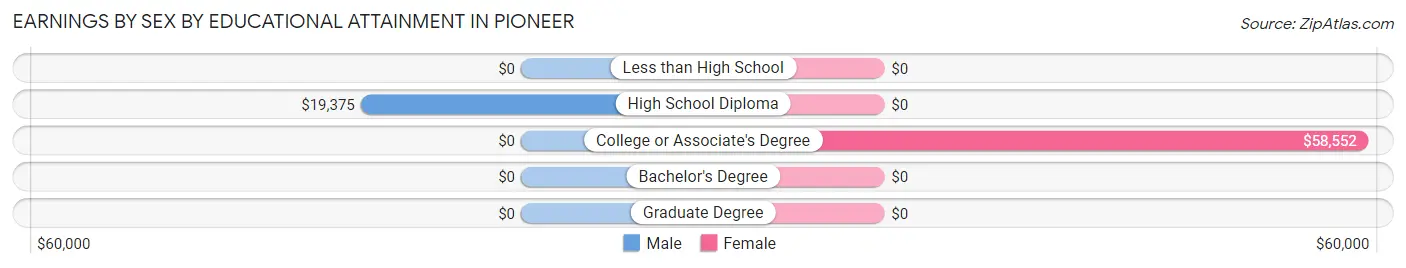
| Educational Attainment | Male Income | Female Income |
| Less than High School | - | - |
| High School Diploma | $19,375 | $0 |
| College or Associate's Degree | - | - |
| Bachelor's Degree | - | - |
| Graduate Degree | - | - |
| Total | - | - |
Family Income in Pioneer
Family Income Brackets in Pioneer
According to the Pioneer family income data, there are 75 families falling into the $75,000 to $99,999 income range, which is the most common income bracket and makes up 66.4% of all families.
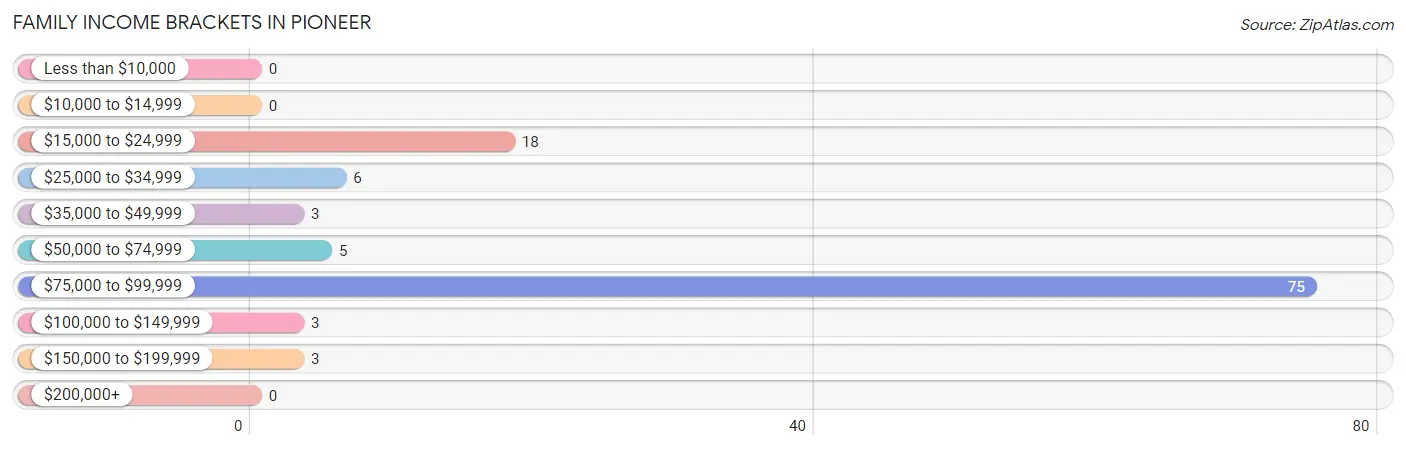
| Income Bracket | # Families | % Families |
| Less than $10,000 | 0 | 0.0% |
| $10,000 to $14,999 | 0 | 0.0% |
| $15,000 to $24,999 | 18 | 15.9% |
| $25,000 to $34,999 | 6 | 5.3% |
| $35,000 to $49,999 | 3 | 2.7% |
| $50,000 to $74,999 | 5 | 4.4% |
| $75,000 to $99,999 | 75 | 66.4% |
| $100,000 to $149,999 | 3 | 2.7% |
| $150,000 to $199,999 | 3 | 2.7% |
| $200,000+ | 0 | 0.0% |
Family Income by Famaliy Size in Pioneer
2-person families (41 | 36.3%) account for the highest median family income in Pioneer with $87,938 per family, while 2-person families (41 | 36.3%) have the highest median income of $43,969 per family member.
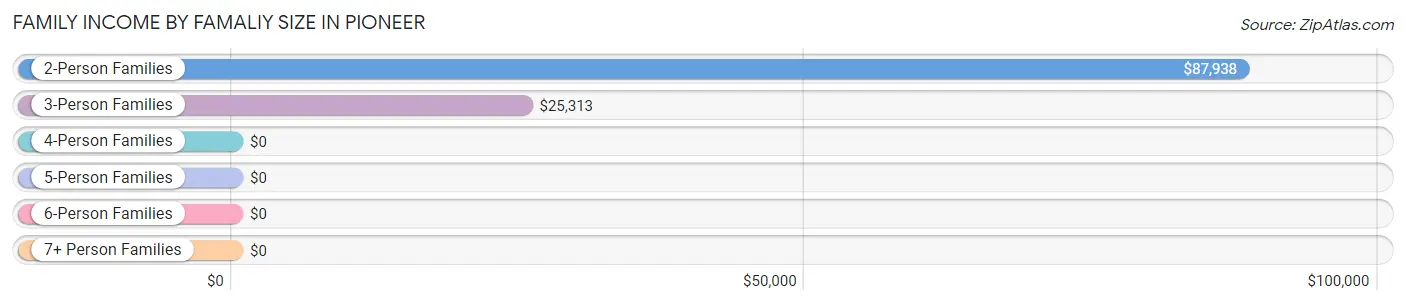
| Income Bracket | # Families | Median Income |
| 2-Person Families | 41 (36.3%) | $87,938 |
| 3-Person Families | 9 (8.0%) | $25,313 |
| 4-Person Families | 1 (0.9%) | $0 |
| 5-Person Families | 9 (8.0%) | $0 |
| 6-Person Families | 53 (46.9%) | $0 |
| 7+ Person Families | 0 (0.0%) | $0 |
| Total | 113 (100.0%) | $76,201 |
Family Income by Number of Earners in Pioneer
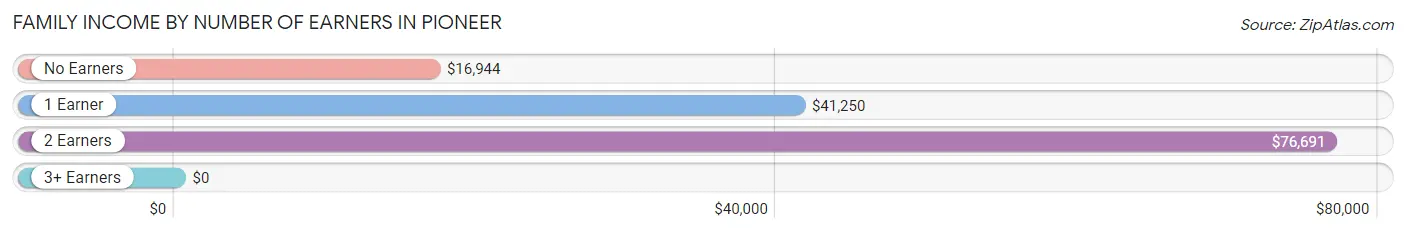
| Number of Earners | # Families | Median Income |
| No Earners | 14 (12.4%) | $16,944 |
| 1 Earner | 22 (19.5%) | $41,250 |
| 2 Earners | 73 (64.6%) | $76,691 |
| 3+ Earners | 4 (3.5%) | $0 |
| Total | 113 (100.0%) | $76,201 |
Household Income in Pioneer
Household Income Brackets in Pioneer
With 75 households falling in the category, the $75,000 to $99,999 income range is the most frequent in Pioneer, accounting for 53.6% of all households.
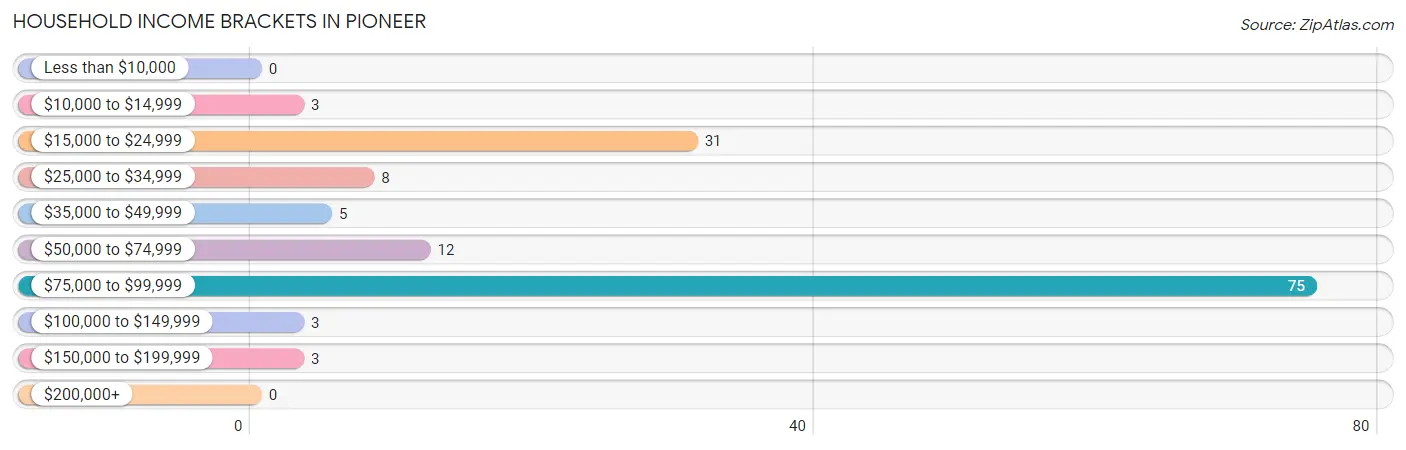
| Income Bracket | # Households | % Households |
| Less than $10,000 | 0 | 0.0% |
| $10,000 to $14,999 | 3 | 2.1% |
| $15,000 to $24,999 | 31 | 22.1% |
| $25,000 to $34,999 | 8 | 5.7% |
| $35,000 to $49,999 | 5 | 3.6% |
| $50,000 to $74,999 | 12 | 8.6% |
| $75,000 to $99,999 | 75 | 53.6% |
| $100,000 to $149,999 | 3 | 2.1% |
| $150,000 to $199,999 | 3 | 2.1% |
| $200,000+ | 0 | 0.0% |
Household Income by Householder Age in Pioneer
The median household income in Pioneer is $75,539, with the highest median household income of $75,833 found in the 25 to 44 years age bracket for the primary householder. A total of 74 households (52.9%) fall into this category.
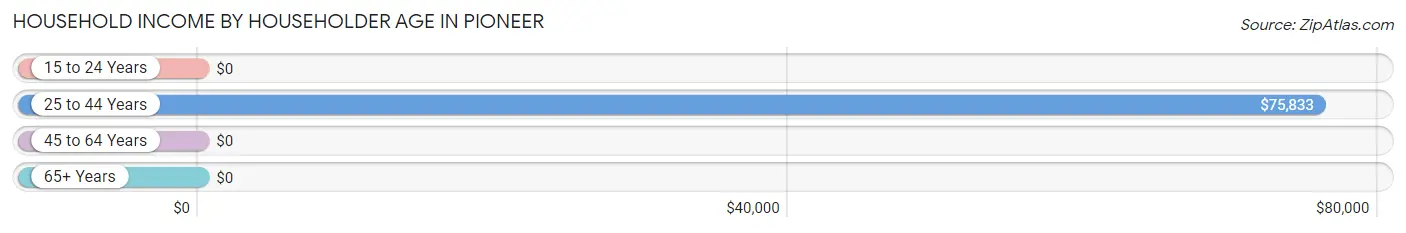
| Income Bracket | # Households | Median Income |
| 15 to 24 Years | 0 (0.0%) | $0 |
| 25 to 44 Years | 74 (52.9%) | $75,833 |
| 45 to 64 Years | 54 (38.6%) | $0 |
| 65+ Years | 12 (8.6%) | $0 |
| Total | 140 (100.0%) | $75,539 |
Poverty in Pioneer
Income Below Poverty by Sex and Age in Pioneer
With 1.3% poverty level for males and 5.7% for females among the residents of Pioneer, 55 to 64 year old males and 18 to 24 year old females are the most vulnerable to poverty, with 2 males (7.1%) and 10 females (100.0%) in their respective age groups living below the poverty level.
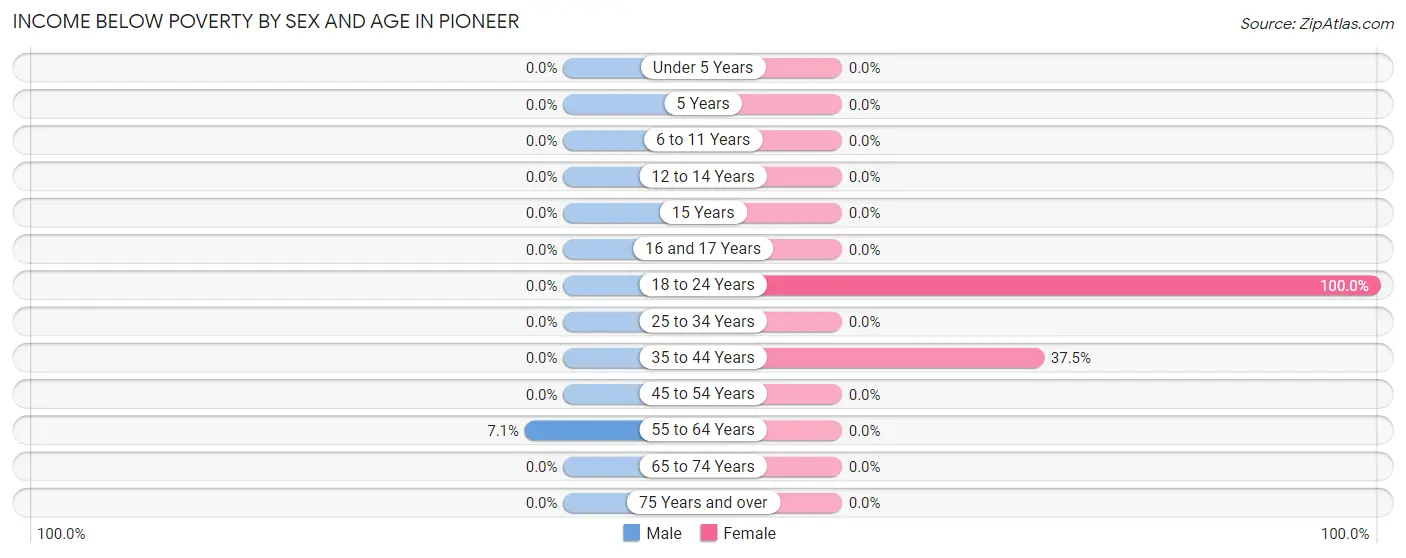
| Age Bracket | Male | Female |
| Under 5 Years | 0 (0.0%) | 0 (0.0%) |
| 5 Years | 0 (0.0%) | 0 (0.0%) |
| 6 to 11 Years | 0 (0.0%) | 0 (0.0%) |
| 12 to 14 Years | 0 (0.0%) | 0 (0.0%) |
| 15 Years | 0 (0.0%) | 0 (0.0%) |
| 16 and 17 Years | 0 (0.0%) | 0 (0.0%) |
| 18 to 24 Years | 0 (0.0%) | 10 (100.0%) |
| 25 to 34 Years | 0 (0.0%) | 0 (0.0%) |
| 35 to 44 Years | 0 (0.0%) | 9 (37.5%) |
| 45 to 54 Years | 0 (0.0%) | 0 (0.0%) |
| 55 to 64 Years | 2 (7.1%) | 0 (0.0%) |
| 65 to 74 Years | 0 (0.0%) | 0 (0.0%) |
| 75 Years and over | 0 (0.0%) | 0 (0.0%) |
| Total | 2 (1.3%) | 19 (5.7%) |
Income Above Poverty by Sex and Age in Pioneer
According to the poverty statistics in Pioneer, males aged 12 to 14 years and females aged under 5 years are the age groups that are most secure financially, with 100.0% of males and 100.0% of females in these age groups living above the poverty line.
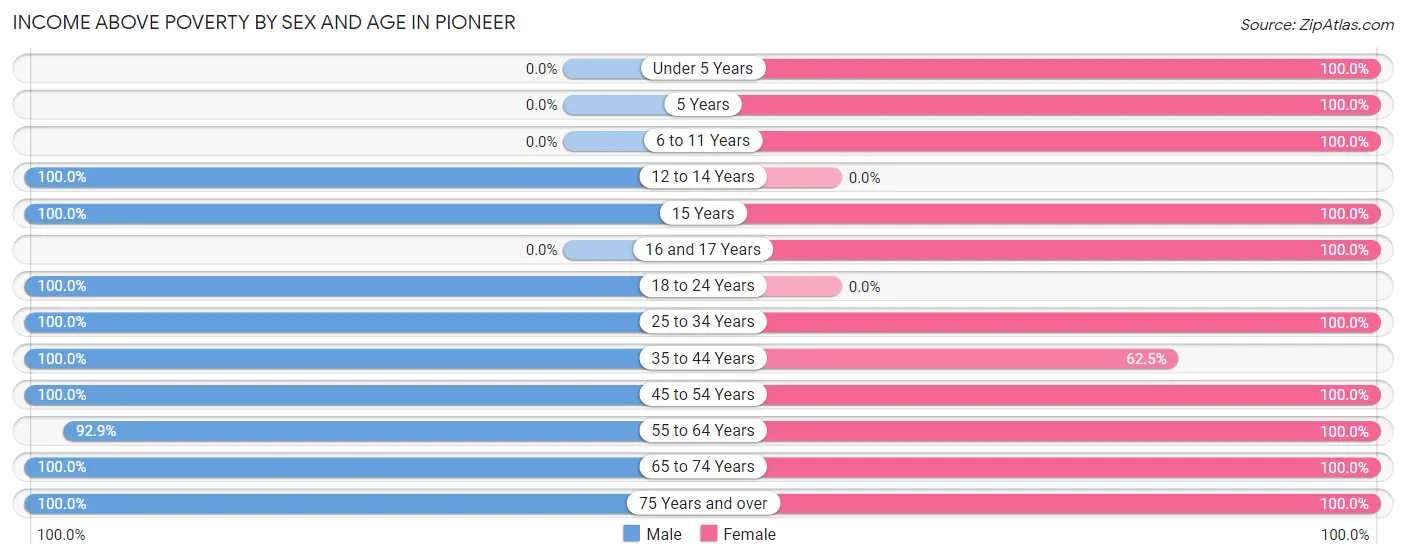
| Age Bracket | Male | Female |
| Under 5 Years | 0 (0.0%) | 68 (100.0%) |
| 5 Years | 0 (0.0%) | 3 (100.0%) |
| 6 to 11 Years | 0 (0.0%) | 62 (100.0%) |
| 12 to 14 Years | 15 (100.0%) | 0 (0.0%) |
| 15 Years | 5 (100.0%) | 8 (100.0%) |
| 16 and 17 Years | 0 (0.0%) | 4 (100.0%) |
| 18 to 24 Years | 13 (100.0%) | 0 (0.0%) |
| 25 to 34 Years | 58 (100.0%) | 109 (100.0%) |
| 35 to 44 Years | 18 (100.0%) | 15 (62.5%) |
| 45 to 54 Years | 5 (100.0%) | 19 (100.0%) |
| 55 to 64 Years | 26 (92.9%) | 20 (100.0%) |
| 65 to 74 Years | 7 (100.0%) | 5 (100.0%) |
| 75 Years and over | 6 (100.0%) | 2 (100.0%) |
| Total | 153 (98.7%) | 315 (94.3%) |
Income Below Poverty Among Married-Couple Families in Pioneer
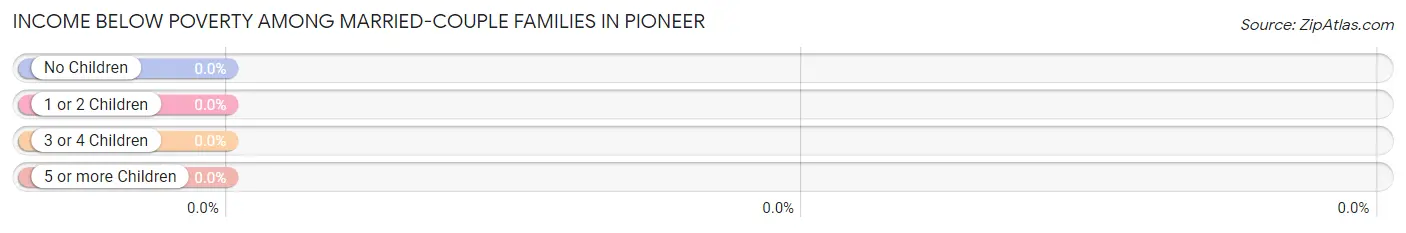
| Children | Above Poverty | Below Poverty |
| No Children | 32 (100.0%) | 0 (0.0%) |
| 1 or 2 Children | 8 (100.0%) | 0 (0.0%) |
| 3 or 4 Children | 7 (100.0%) | 0 (0.0%) |
| 5 or more Children | 0 (0.0%) | 0 (0.0%) |
| Total | 47 (100.0%) | 0 (0.0%) |
Income Below Poverty Among Single-Parent Households in Pioneer
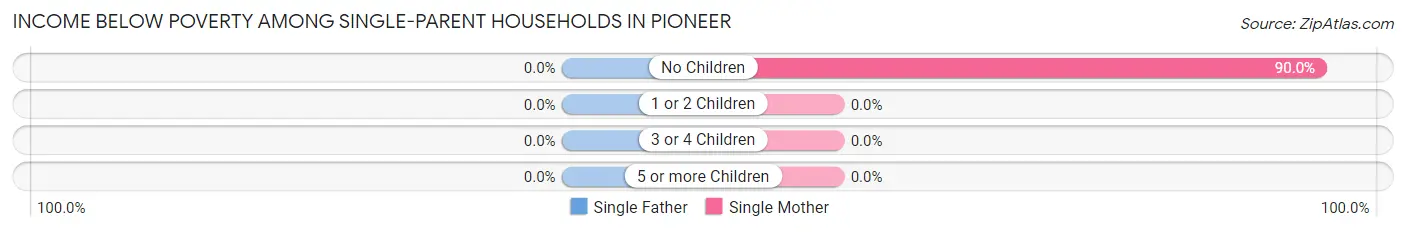
| Children | Single Father | Single Mother |
| No Children | 0 (0.0%) | 9 (90.0%) |
| 1 or 2 Children | 0 (0.0%) | 0 (0.0%) |
| 3 or 4 Children | 0 (0.0%) | 0 (0.0%) |
| 5 or more Children | 0 (0.0%) | 0 (0.0%) |
| Total | 0 (0.0%) | 9 (90.0%) |
Income Below Poverty Among Married-Couple vs Single-Parent Households in Pioneer
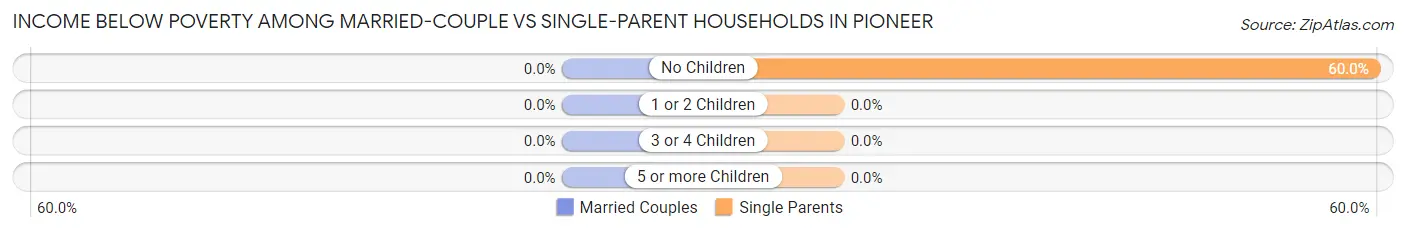
| Children | Married-Couple Families | Single-Parent Households |
| No Children | 0 (0.0%) | 9 (60.0%) |
| 1 or 2 Children | 0 (0.0%) | 0 (0.0%) |
| 3 or 4 Children | 0 (0.0%) | 0 (0.0%) |
| 5 or more Children | 0 (0.0%) | 0 (0.0%) |
| Total | 0 (0.0%) | 9 (13.6%) |
Race in Pioneer
The most populous races in Pioneer are White / Caucasian (445 | 91.0%), Black / African American (29 | 5.9%), and Hispanic or Latino (8 | 1.6%).
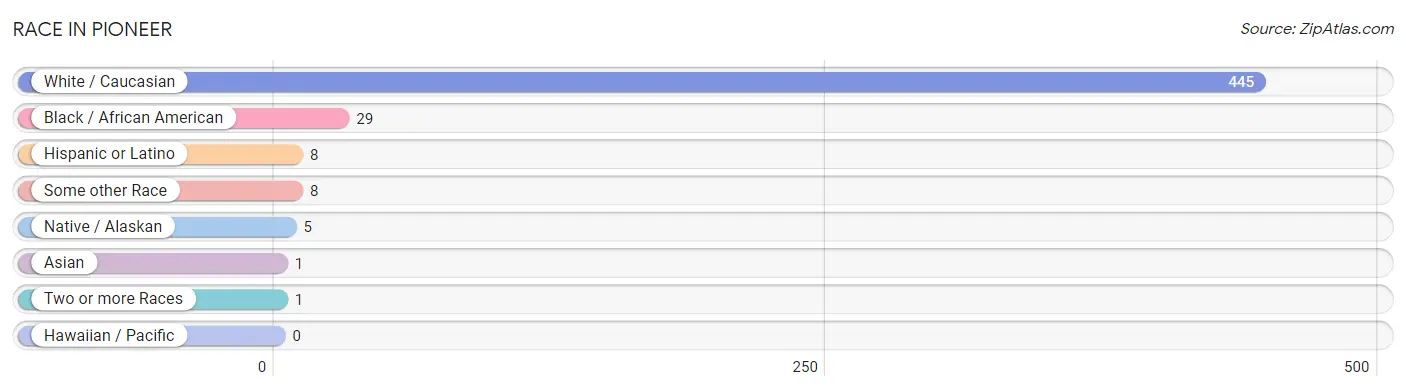
| Race | # Population | % Population |
| Asian | 1 | 0.2% |
| Black / African American | 29 | 5.9% |
| Hawaiian / Pacific | 0 | 0.0% |
| Hispanic or Latino | 8 | 1.6% |
| Native / Alaskan | 5 | 1.0% |
| White / Caucasian | 445 | 91.0% |
| Two or more Races | 1 | 0.2% |
| Some other Race | 8 | 1.6% |
| Total | 489 | 100.0% |
Ancestry in Pioneer
The most populous ancestries reported in Pioneer are Irish (45 | 9.2%), American (11 | 2.2%), Spanish (8 | 1.6%), English (7 | 1.4%), and French (6 | 1.2%), together accounting for 15.8% of all Pioneer residents.
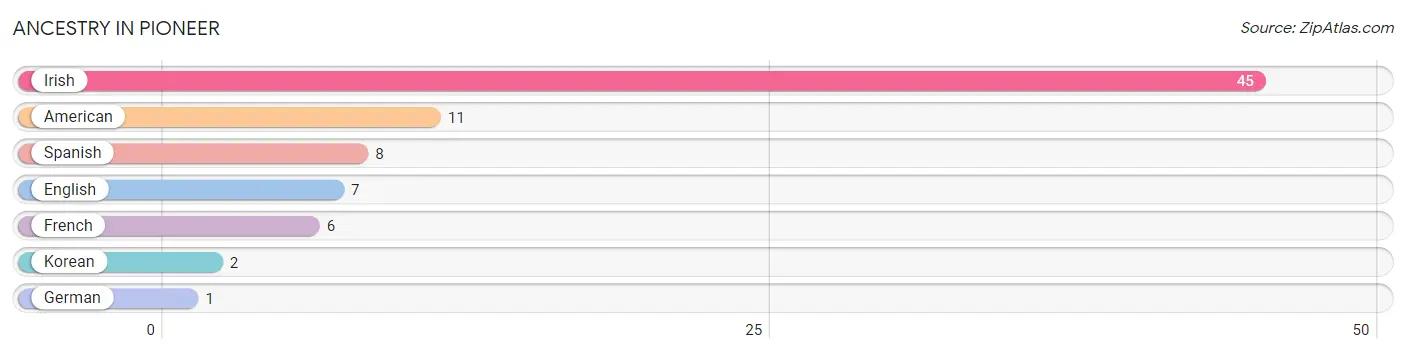
| Ancestry | # Population | % Population |
| American | 11 | 2.2% |
| English | 7 | 1.4% |
| French | 6 | 1.2% |
| German | 1 | 0.2% |
| Irish | 45 | 9.2% |
| Korean | 2 | 0.4% |
| Spanish | 8 | 1.6% | View All 7 Rows |
Immigrants in Pioneer
The most numerous immigrant groups reported in Pioneer came from Asia (1 | 0.2%), Philippines (1 | 0.2%), and South Eastern Asia (1 | 0.2%), together accounting for 0.6% of all Pioneer residents.
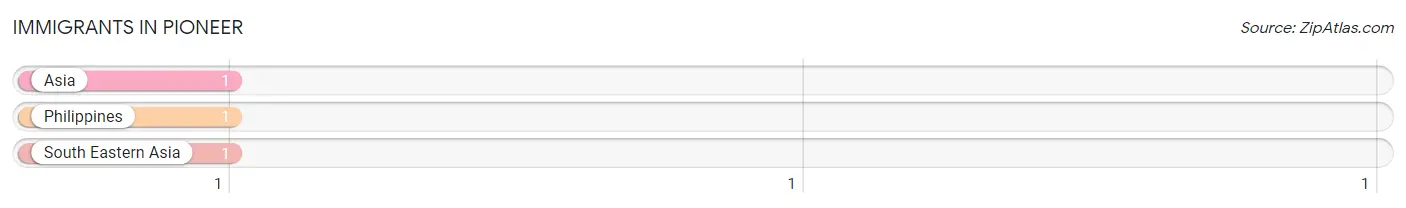
| Immigration Origin | # Population | % Population |
| Asia | 1 | 0.2% |
| Philippines | 1 | 0.2% |
| South Eastern Asia | 1 | 0.2% | View All 3 Rows |
Sex and Age in Pioneer
Sex and Age in Pioneer
The most populous age groups in Pioneer are 25 to 29 Years (54 | 34.8%) for men and 25 to 29 Years (101 | 30.2%) for women.
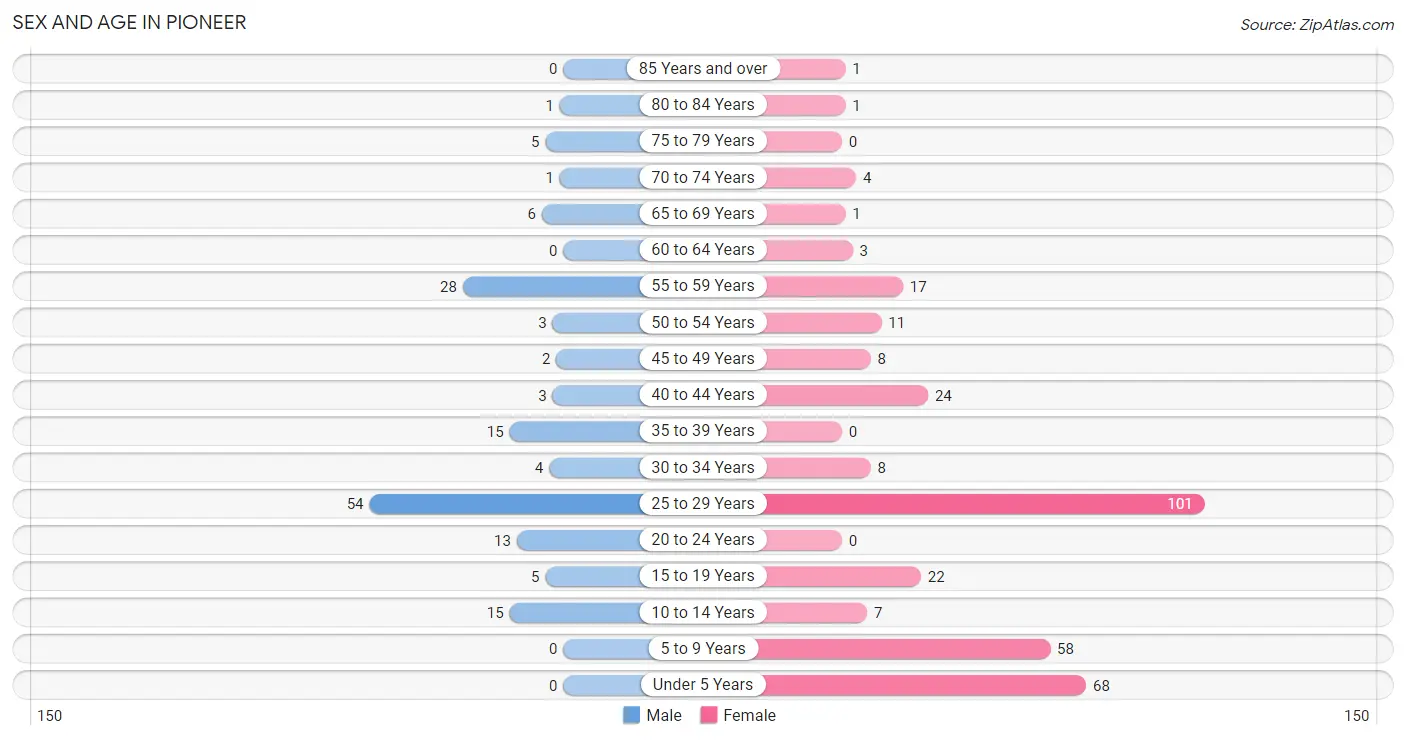
| Age Bracket | Male | Female |
| Under 5 Years | 0 (0.0%) | 68 (20.4%) |
| 5 to 9 Years | 0 (0.0%) | 58 (17.4%) |
| 10 to 14 Years | 15 (9.7%) | 7 (2.1%) |
| 15 to 19 Years | 5 (3.2%) | 22 (6.6%) |
| 20 to 24 Years | 13 (8.4%) | 0 (0.0%) |
| 25 to 29 Years | 54 (34.8%) | 101 (30.2%) |
| 30 to 34 Years | 4 (2.6%) | 8 (2.4%) |
| 35 to 39 Years | 15 (9.7%) | 0 (0.0%) |
| 40 to 44 Years | 3 (1.9%) | 24 (7.2%) |
| 45 to 49 Years | 2 (1.3%) | 8 (2.4%) |
| 50 to 54 Years | 3 (1.9%) | 11 (3.3%) |
| 55 to 59 Years | 28 (18.1%) | 17 (5.1%) |
| 60 to 64 Years | 0 (0.0%) | 3 (0.9%) |
| 65 to 69 Years | 6 (3.9%) | 1 (0.3%) |
| 70 to 74 Years | 1 (0.6%) | 4 (1.2%) |
| 75 to 79 Years | 5 (3.2%) | 0 (0.0%) |
| 80 to 84 Years | 1 (0.6%) | 1 (0.3%) |
| 85 Years and over | 0 (0.0%) | 1 (0.3%) |
| Total | 155 (100.0%) | 334 (100.0%) |
Families and Households in Pioneer
Median Family Size in Pioneer
The median family size in Pioneer is 4.08 persons per family, with single male/father families (56 | 49.6%) accounting for the largest median family size of 5.29 persons per family. On the other hand, single female/mother families (10 | 8.8%) represent the smallest median family size with 2.30 persons per family.
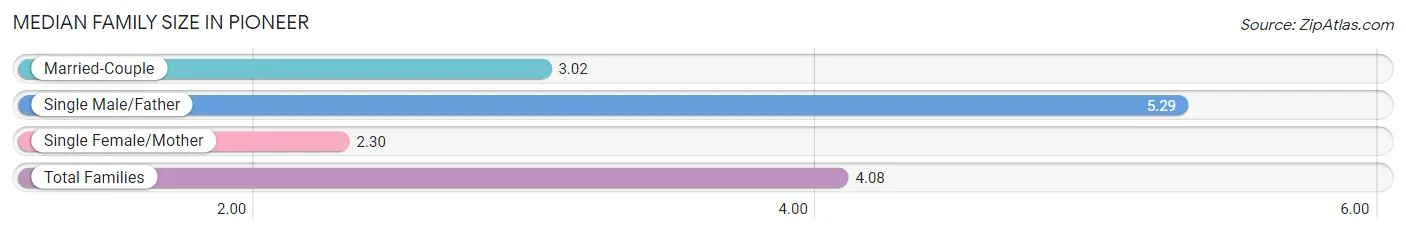
| Family Type | # Families | Family Size |
| Married-Couple | 47 (41.6%) | 3.02 |
| Single Male/Father | 56 (49.6%) | 5.29 |
| Single Female/Mother | 10 (8.8%) | 2.30 |
| Total Families | 113 (100.0%) | 4.08 |
Median Household Size in Pioneer
The median household size in Pioneer is 3.49 persons per household, with single male/father households (56 | 40.0%) accounting for the largest median household size of 5.29 persons per household. non-family households (27 | 19.3%) represent the smallest median household size with 1.04 persons per household.
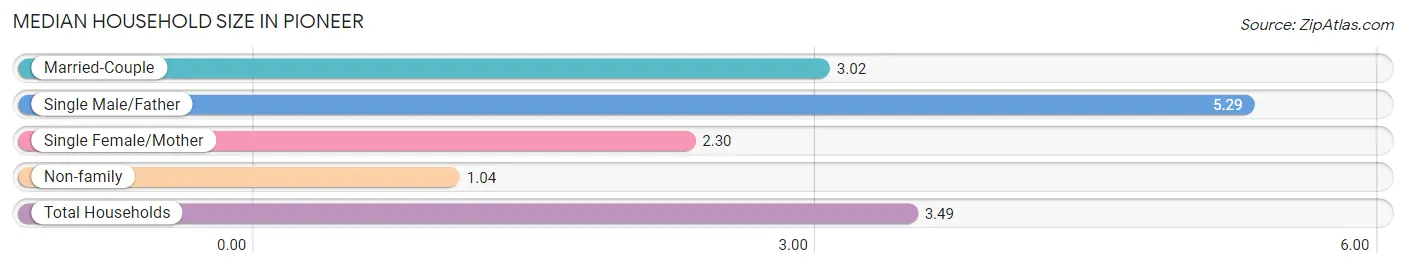
| Household Type | # Households | Household Size |
| Married-Couple | 47 (33.6%) | 3.02 |
| Single Male/Father | 56 (40.0%) | 5.29 |
| Single Female/Mother | 10 (7.1%) | 2.30 |
| Non-family | 27 (19.3%) | 1.04 |
| Total Households | 140 (100.0%) | 3.49 |
Household Size by Marriage Status in Pioneer
Out of a total of 140 households in Pioneer, 113 (80.7%) are family households, while 27 (19.3%) are nonfamily households. The most numerous type of family households are 6-person households, comprising 53, and the most common type of nonfamily households are 1-person households, comprising 25.
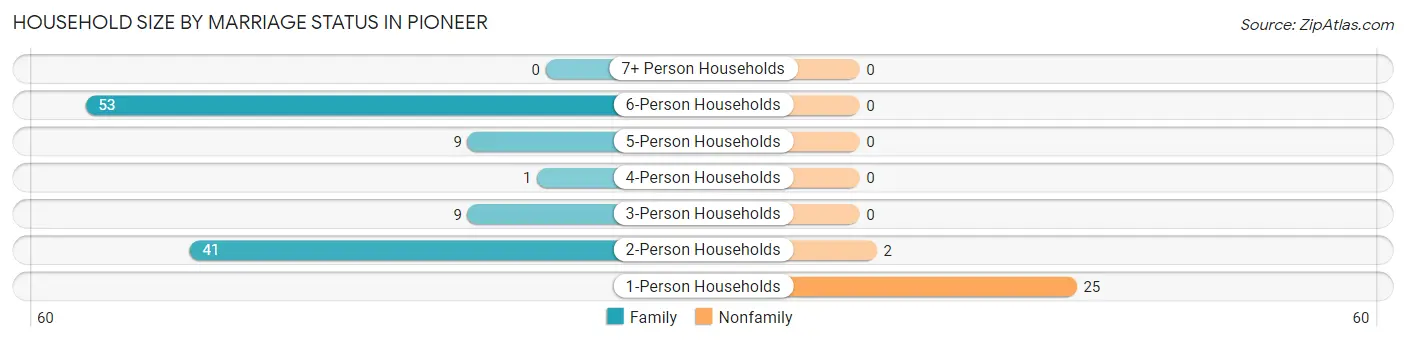
| Household Size | Family Households | Nonfamily Households |
| 1-Person Households | - | 25 (17.9%) |
| 2-Person Households | 41 (29.3%) | 2 (1.4%) |
| 3-Person Households | 9 (6.4%) | 0 (0.0%) |
| 4-Person Households | 1 (0.7%) | 0 (0.0%) |
| 5-Person Households | 9 (6.4%) | 0 (0.0%) |
| 6-Person Households | 53 (37.9%) | 0 (0.0%) |
| 7+ Person Households | 0 (0.0%) | 0 (0.0%) |
| Total | 113 (80.7%) | 27 (19.3%) |
Female Fertility in Pioneer
Fertility by Age in Pioneer
| Age Bracket | Women with Births | Births / 1,000 Women |
| 15 to 19 years | 0 (0.0%) | 0.0 |
| 20 to 34 years | 0 (0.0%) | 0.0 |
| 35 to 50 years | 0 (0.0%) | 0.0 |
| Total | 0 (0.0%) | 0.0 |
Fertility by Age by Marriage Status in Pioneer
| Age Bracket | Married | Unmarried |
| 15 to 19 years | 0 (0.0%) | 0 (0.0%) |
| 20 to 34 years | 0 (0.0%) | 0 (0.0%) |
| 35 to 50 years | 0 (0.0%) | 0 (0.0%) |
| Total | 0 (0.0%) | 0 (0.0%) |
Fertility by Education in Pioneer
| Educational Attainment | Women with Births | Births / 1,000 Women |
| Less than High School | 0 (0.0%) | 0.0 |
| High School Diploma | 0 (0.0%) | 0.0 |
| College or Associate's Degree | 0 (0.0%) | 0.0 |
| Bachelor's Degree | 0 (0.0%) | 0.0 |
| Graduate Degree | 0 (0.0%) | 0.0 |
| Total | 0 (0.0%) | 0.0 |
Fertility by Education by Marriage Status in Pioneer
| Educational Attainment | Married | Unmarried |
| Less than High School | 0 (0.0%) | 0 (0.0%) |
| High School Diploma | 0 (0.0%) | 0 (0.0%) |
| College or Associate's Degree | 0 (0.0%) | 0 (0.0%) |
| Bachelor's Degree | 0 (0.0%) | 0 (0.0%) |
| Graduate Degree | 0 (0.0%) | 0 (0.0%) |
| Total | 0 (0.0%) | 0 (0.0%) |
Employment Characteristics in Pioneer
Employment by Class of Employer in Pioneer
Among the 247 employed individuals in Pioneer, private company employees (194 | 78.5%), local government employees (35 | 14.2%), and state government employees (10 | 4.1%) make up the most common classes of employment.
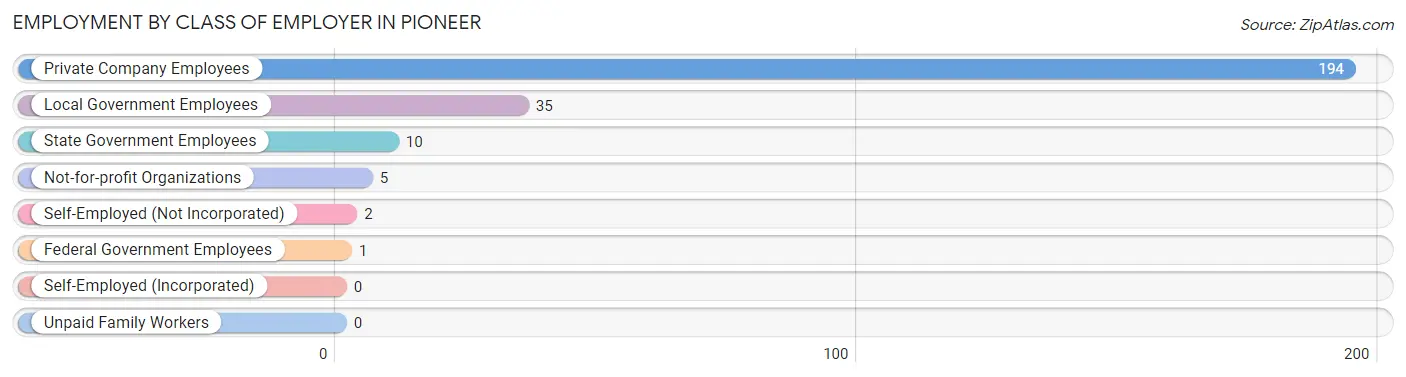
| Employer Class | # Employees | % Employees |
| Private Company Employees | 194 | 78.5% |
| Self-Employed (Incorporated) | 0 | 0.0% |
| Self-Employed (Not Incorporated) | 2 | 0.8% |
| Not-for-profit Organizations | 5 | 2.0% |
| Local Government Employees | 35 | 14.2% |
| State Government Employees | 10 | 4.1% |
| Federal Government Employees | 1 | 0.4% |
| Unpaid Family Workers | 0 | 0.0% |
| Total | 247 | 100.0% |
Employment Status by Age in Pioneer
According to the labor force statistics for Pioneer, out of the total population over 16 years of age (328), 76.5% or 251 individuals are in the labor force, with 0.8% or 2 of them unemployed. The age group with the highest labor force participation rate is 20 to 24 years, with 100.0% or 13 individuals in the labor force. Within the labor force, the 30 to 34 years age range has the highest percentage of unemployed individuals, with 16.7% or 1 of them being unemployed.
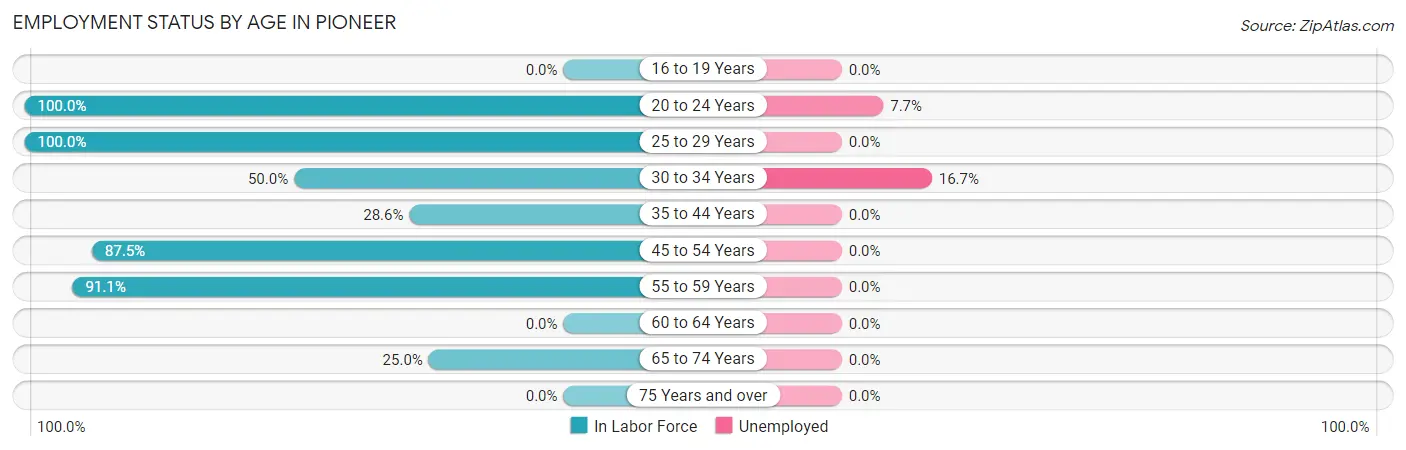
| Age Bracket | In Labor Force | Unemployed |
| 16 to 19 Years | 0 (0.0%) | 0 (0.0%) |
| 20 to 24 Years | 13 (100.0%) | 1 (7.7%) |
| 25 to 29 Years | 155 (100.0%) | 0 (0.0%) |
| 30 to 34 Years | 6 (50.0%) | 1 (16.7%) |
| 35 to 44 Years | 12 (28.6%) | 0 (0.0%) |
| 45 to 54 Years | 21 (87.5%) | 0 (0.0%) |
| 55 to 59 Years | 41 (91.1%) | 0 (0.0%) |
| 60 to 64 Years | 0 (0.0%) | 0 (0.0%) |
| 65 to 74 Years | 3 (25.0%) | 0 (0.0%) |
| 75 Years and over | 0 (0.0%) | 0 (0.0%) |
| Total | 251 (76.5%) | 2 (0.8%) |
Employment Status by Educational Attainment in Pioneer
According to labor force statistics for Pioneer, 83.6% of individuals (235) out of the total population between 25 and 64 years of age (281) are in the labor force, with 0.4% or 1 of them being unemployed. The group with the highest labor force participation rate are those with the educational attainment of bachelor's degree or higher, with 95.7% or 22 individuals in the labor force. Within the labor force, individuals with high school diploma education have the highest percentage of unemployment, with 1.1% or 1 of them being unemployed.
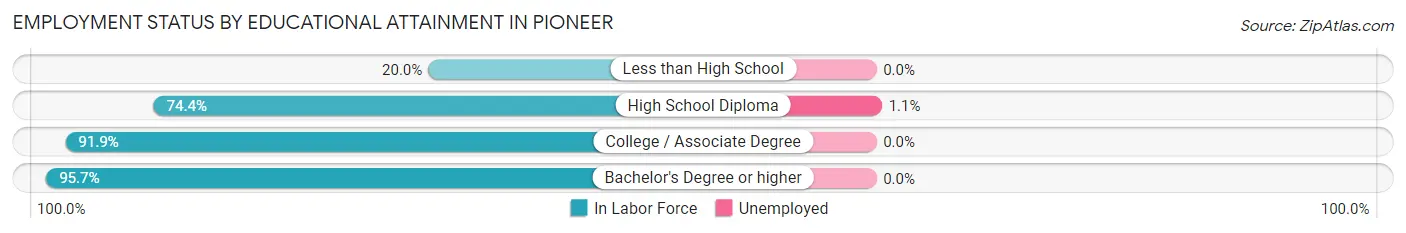
| Educational Attainment | In Labor Force | Unemployed |
| Less than High School | 1 (20.0%) | 0 (0.0%) |
| High School Diploma | 87 (74.4%) | 1 (1.1%) |
| College / Associate Degree | 125 (91.9%) | 0 (0.0%) |
| Bachelor's Degree or higher | 22 (95.7%) | 0 (0.0%) |
| Total | 235 (83.6%) | 1 (0.4%) |
Employment Occupations by Sex in Pioneer
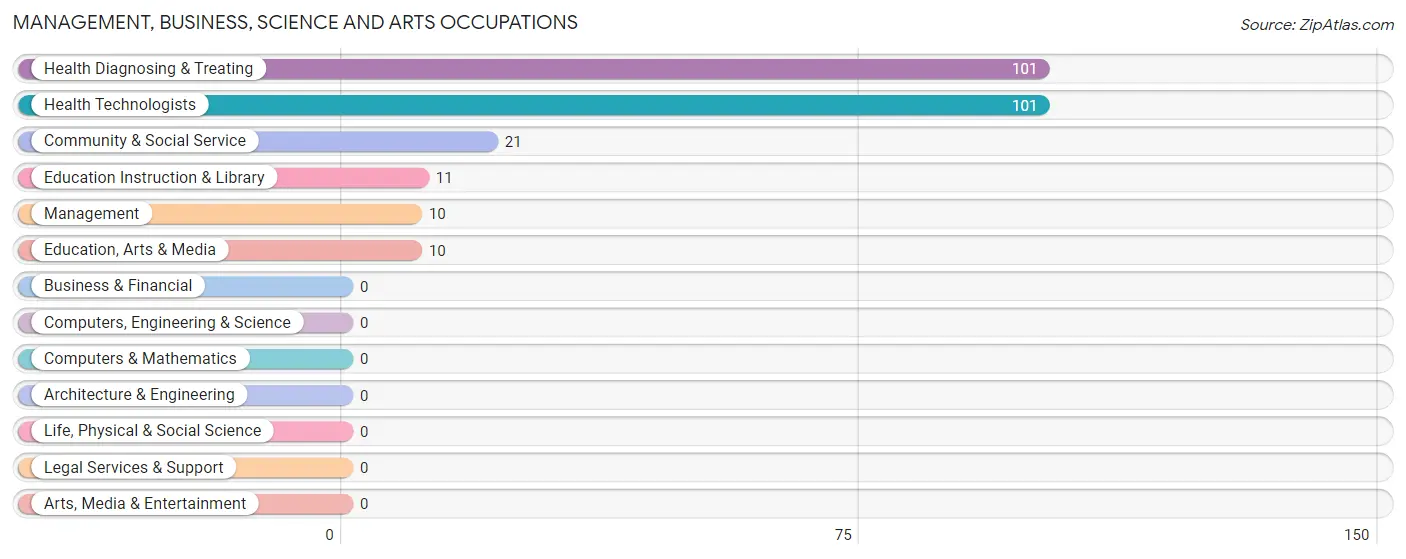
Management, Business, Science and Arts Occupations
The most common Management, Business, Science and Arts occupations in Pioneer are Health Diagnosing & Treating (101 | 40.6%), Health Technologists (101 | 40.6%), Community & Social Service (21 | 8.4%), Education Instruction & Library (11 | 4.4%), and Management (10 | 4.0%).
Management, Business, Science and Arts Occupations by Sex
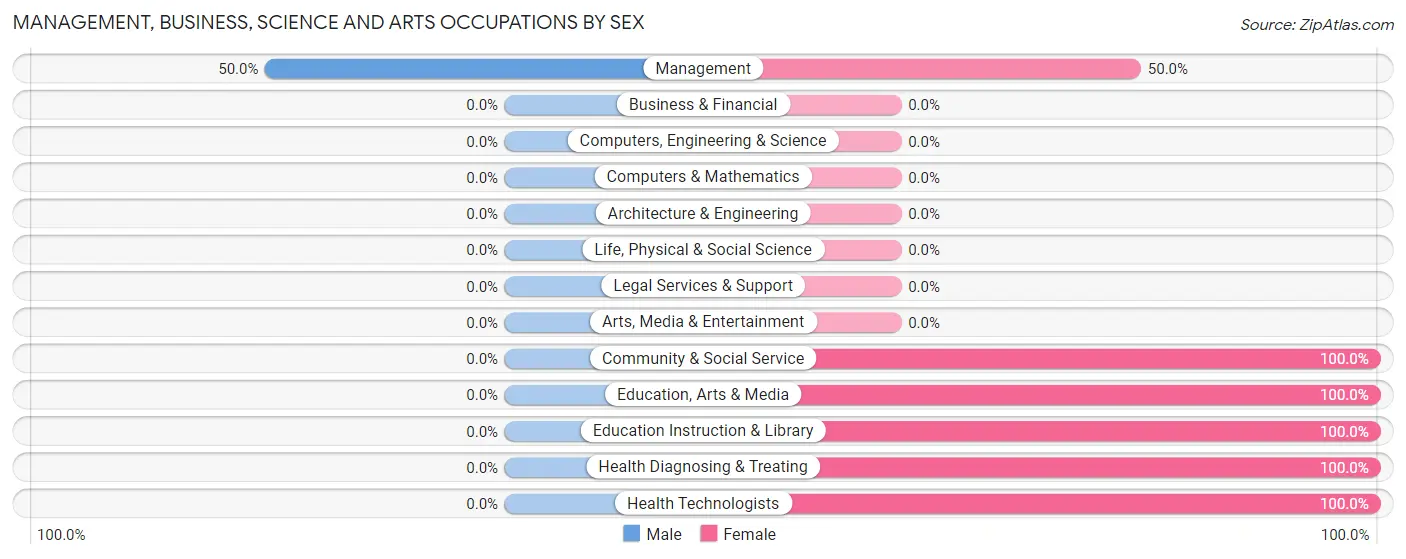
| Occupation | Male | Female |
| Management | 5 (50.0%) | 5 (50.0%) |
| Business & Financial | 0 (0.0%) | 0 (0.0%) |
| Computers, Engineering & Science | 0 (0.0%) | 0 (0.0%) |
| Computers & Mathematics | 0 (0.0%) | 0 (0.0%) |
| Architecture & Engineering | 0 (0.0%) | 0 (0.0%) |
| Life, Physical & Social Science | 0 (0.0%) | 0 (0.0%) |
| Community & Social Service | 0 (0.0%) | 21 (100.0%) |
| Education, Arts & Media | 0 (0.0%) | 10 (100.0%) |
| Legal Services & Support | 0 (0.0%) | 0 (0.0%) |
| Education Instruction & Library | 0 (0.0%) | 11 (100.0%) |
| Arts, Media & Entertainment | 0 (0.0%) | 0 (0.0%) |
| Health Diagnosing & Treating | 0 (0.0%) | 101 (100.0%) |
| Health Technologists | 0 (0.0%) | 101 (100.0%) |
| Total (Category) | 5 (3.8%) | 127 (96.2%) |
| Total (Overall) | 107 (43.0%) | 142 (57.0%) |
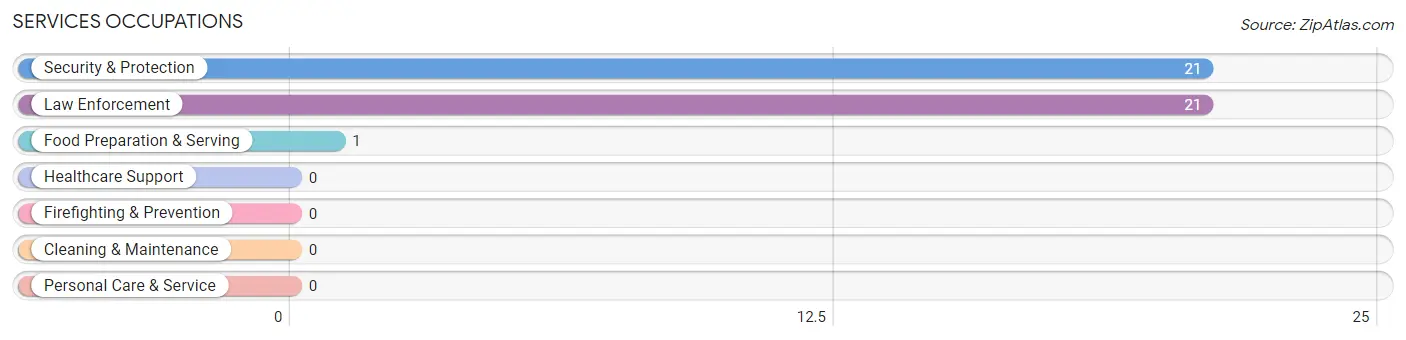
Services Occupations
The most common Services occupations in Pioneer are Security & Protection (21 | 8.4%), Law Enforcement (21 | 8.4%), and Food Preparation & Serving (1 | 0.4%).
Services Occupations by Sex
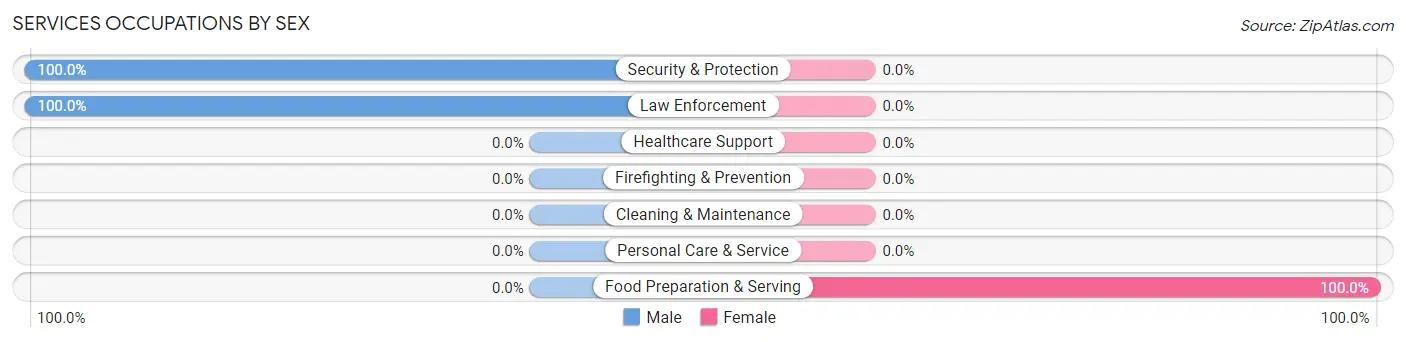
| Occupation | Male | Female |
| Healthcare Support | 0 (0.0%) | 0 (0.0%) |
| Security & Protection | 21 (100.0%) | 0 (0.0%) |
| Firefighting & Prevention | 0 (0.0%) | 0 (0.0%) |
| Law Enforcement | 21 (100.0%) | 0 (0.0%) |
| Food Preparation & Serving | 0 (0.0%) | 1 (100.0%) |
| Cleaning & Maintenance | 0 (0.0%) | 0 (0.0%) |
| Personal Care & Service | 0 (0.0%) | 0 (0.0%) |
| Total (Category) | 21 (95.5%) | 1 (4.5%) |
| Total (Overall) | 107 (43.0%) | 142 (57.0%) |
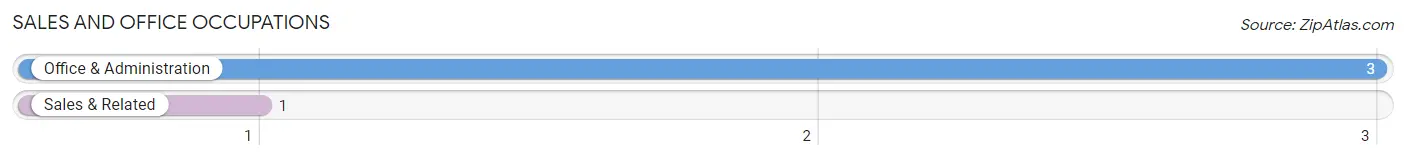
Sales and Office Occupations
The most common Sales and Office occupations in Pioneer are Office & Administration (3 | 1.2%), and Sales & Related (1 | 0.4%).
Sales and Office Occupations by Sex
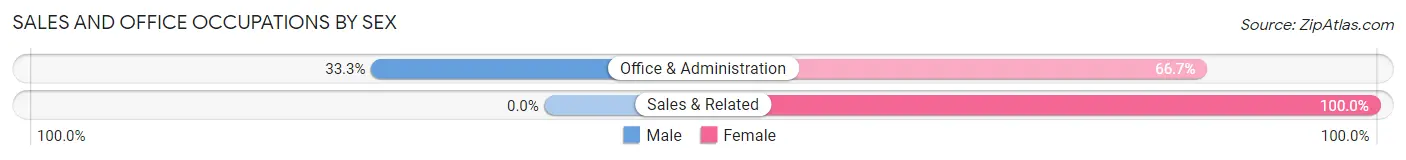
| Occupation | Male | Female |
| Sales & Related | 0 (0.0%) | 1 (100.0%) |
| Office & Administration | 1 (33.3%) | 2 (66.7%) |
| Total (Category) | 1 (25.0%) | 3 (75.0%) |
| Total (Overall) | 107 (43.0%) | 142 (57.0%) |
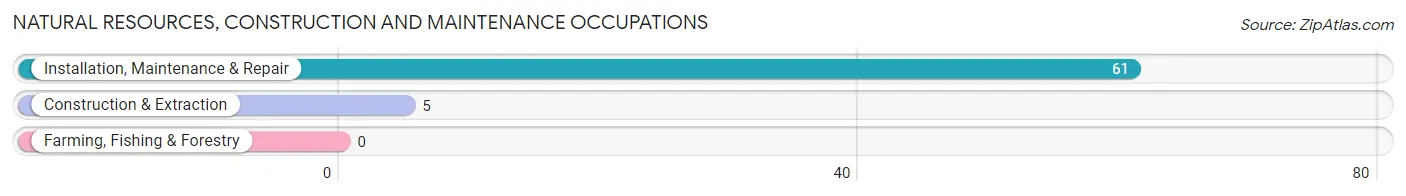
Natural Resources, Construction and Maintenance Occupations
The most common Natural Resources, Construction and Maintenance occupations in Pioneer are Installation, Maintenance & Repair (61 | 24.5%), and Construction & Extraction (5 | 2.0%).
Natural Resources, Construction and Maintenance Occupations by Sex
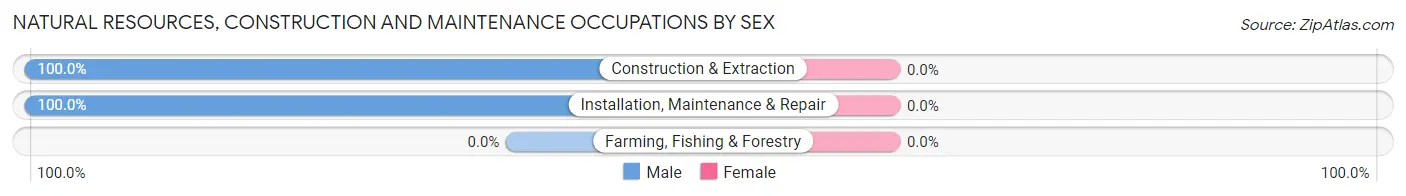
| Occupation | Male | Female |
| Farming, Fishing & Forestry | 0 (0.0%) | 0 (0.0%) |
| Construction & Extraction | 5 (100.0%) | 0 (0.0%) |
| Installation, Maintenance & Repair | 61 (100.0%) | 0 (0.0%) |
| Total (Category) | 66 (100.0%) | 0 (0.0%) |
| Total (Overall) | 107 (43.0%) | 142 (57.0%) |
Production, Transportation and Moving Occupations
The most common Production, Transportation and Moving occupations in Pioneer are Transportation (16 | 6.4%), Material Moving (5 | 2.0%), and Production (4 | 1.6%).
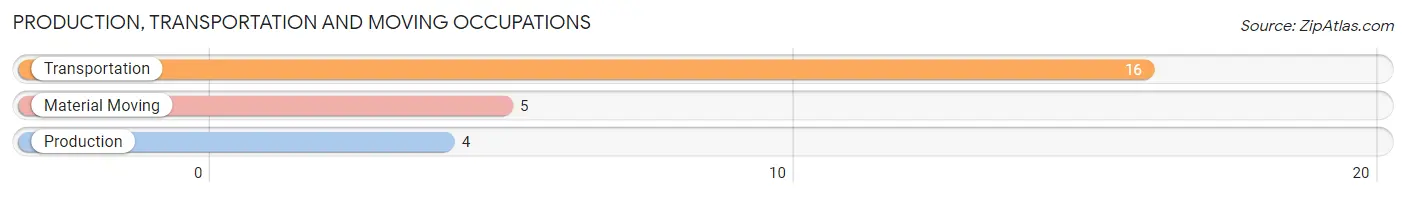
Production, Transportation and Moving Occupations by Sex
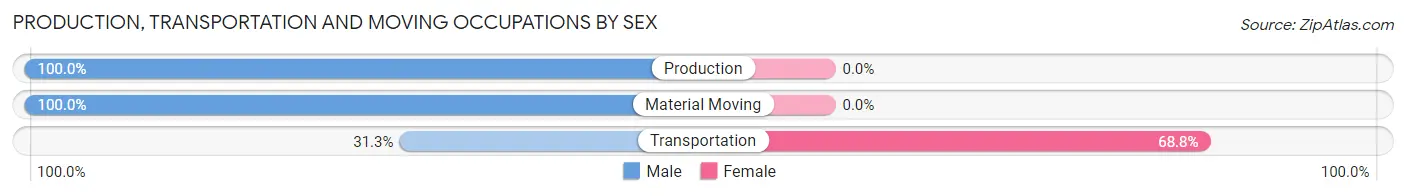
| Occupation | Male | Female |
| Production | 4 (100.0%) | 0 (0.0%) |
| Transportation | 5 (31.2%) | 11 (68.8%) |
| Material Moving | 5 (100.0%) | 0 (0.0%) |
| Total (Category) | 14 (56.0%) | 11 (44.0%) |
| Total (Overall) | 107 (43.0%) | 142 (57.0%) |
Employment Industries by Sex in Pioneer
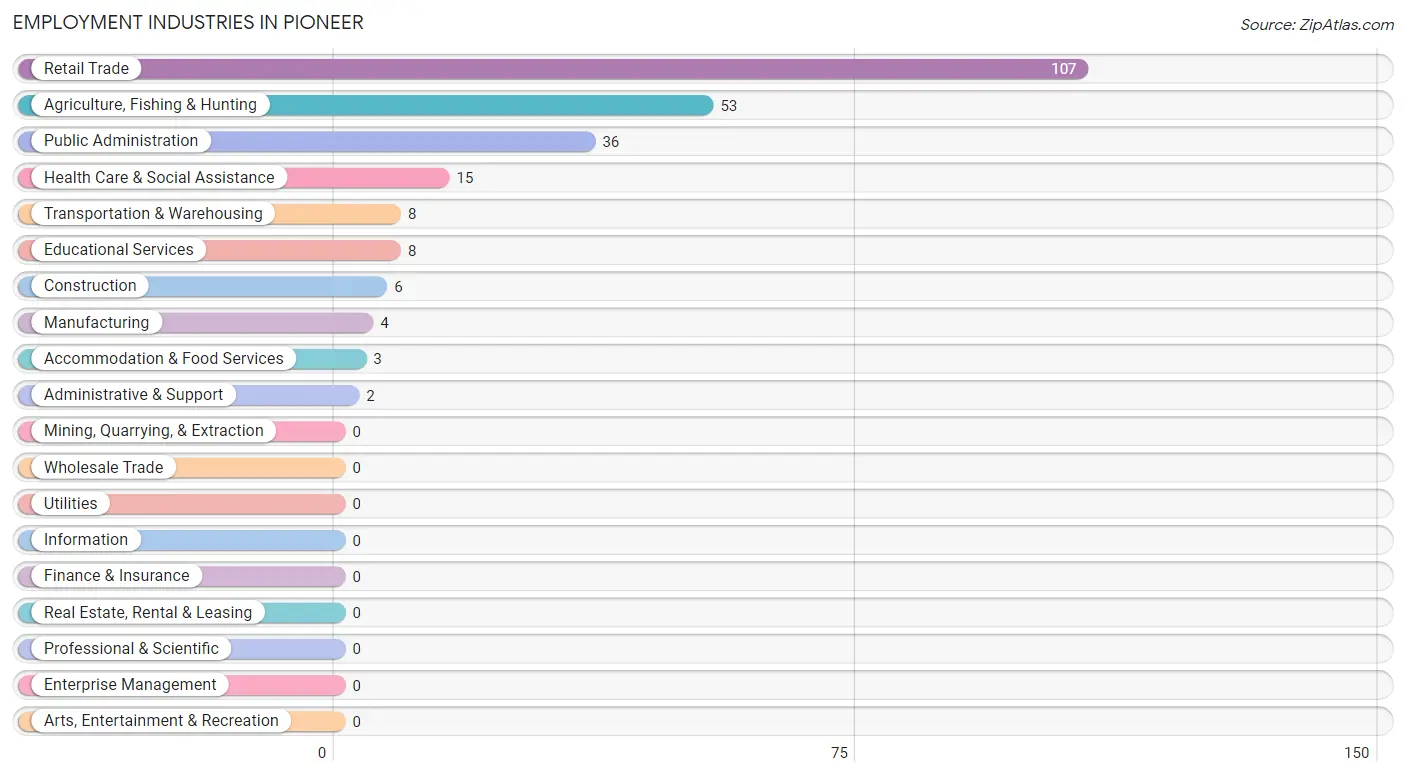
Employment Industries in Pioneer
The major employment industries in Pioneer include Retail Trade (107 | 43.0%), Agriculture, Fishing & Hunting (53 | 21.3%), Public Administration (36 | 14.5%), Health Care & Social Assistance (15 | 6.0%), and Transportation & Warehousing (8 | 3.2%).
Employment Industries by Sex in Pioneer
The Pioneer industries that see more men than women are Agriculture, Fishing & Hunting (100.0%), Construction (100.0%), and Manufacturing (100.0%), whereas the industries that tend to have a higher number of women are Educational Services (100.0%), Health Care & Social Assistance (100.0%), and Retail Trade (95.3%).
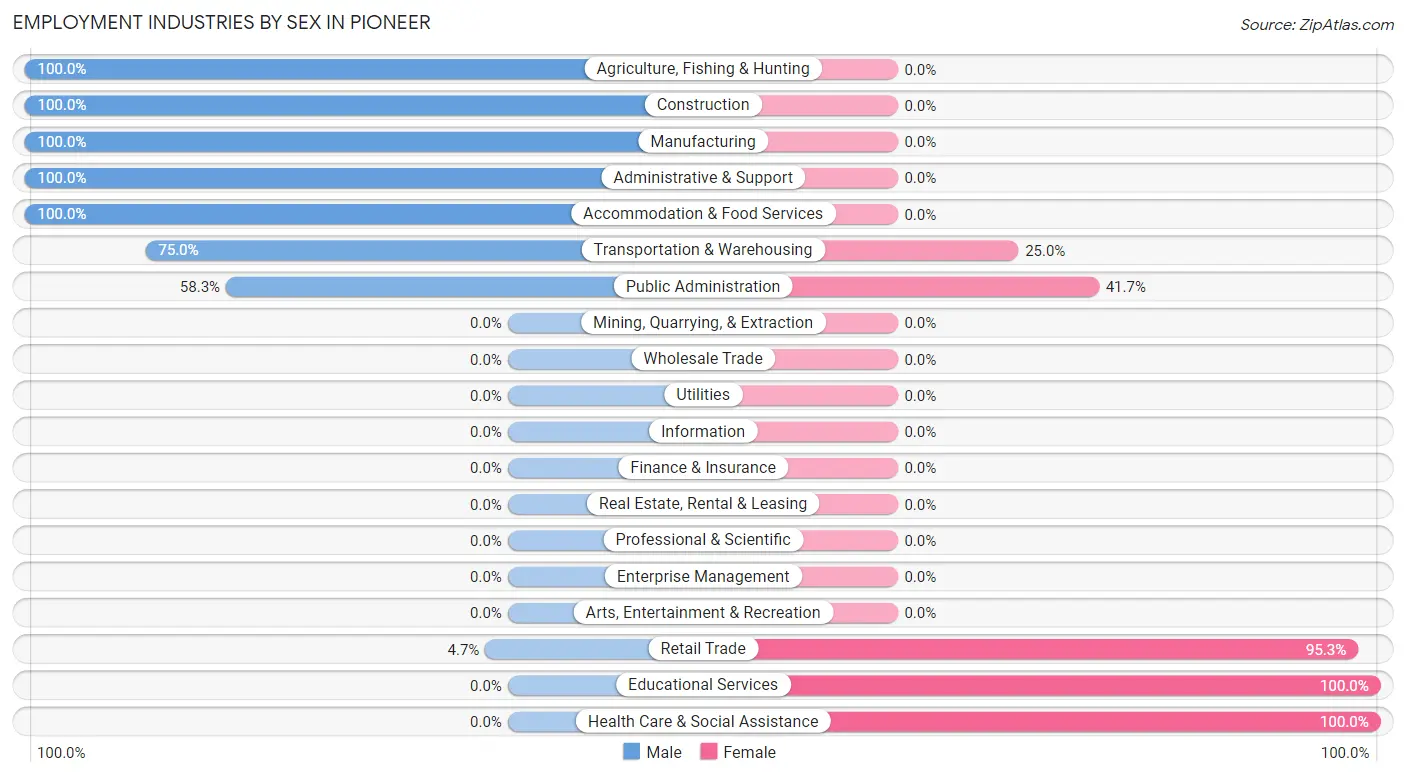
| Industry | Male | Female |
| Agriculture, Fishing & Hunting | 53 (100.0%) | 0 (0.0%) |
| Mining, Quarrying, & Extraction | 0 (0.0%) | 0 (0.0%) |
| Construction | 6 (100.0%) | 0 (0.0%) |
| Manufacturing | 4 (100.0%) | 0 (0.0%) |
| Wholesale Trade | 0 (0.0%) | 0 (0.0%) |
| Retail Trade | 5 (4.7%) | 102 (95.3%) |
| Transportation & Warehousing | 6 (75.0%) | 2 (25.0%) |
| Utilities | 0 (0.0%) | 0 (0.0%) |
| Information | 0 (0.0%) | 0 (0.0%) |
| Finance & Insurance | 0 (0.0%) | 0 (0.0%) |
| Real Estate, Rental & Leasing | 0 (0.0%) | 0 (0.0%) |
| Professional & Scientific | 0 (0.0%) | 0 (0.0%) |
| Enterprise Management | 0 (0.0%) | 0 (0.0%) |
| Administrative & Support | 2 (100.0%) | 0 (0.0%) |
| Educational Services | 0 (0.0%) | 8 (100.0%) |
| Health Care & Social Assistance | 0 (0.0%) | 15 (100.0%) |
| Arts, Entertainment & Recreation | 0 (0.0%) | 0 (0.0%) |
| Accommodation & Food Services | 3 (100.0%) | 0 (0.0%) |
| Public Administration | 21 (58.3%) | 15 (41.7%) |
| Total | 107 (43.0%) | 142 (57.0%) |
Education in Pioneer
School Enrollment in Pioneer
The most common levels of schooling among the 102 students in Pioneer are elementary school (55 | 53.9%), middle school (22 | 21.6%), and high school (17 | 16.7%).
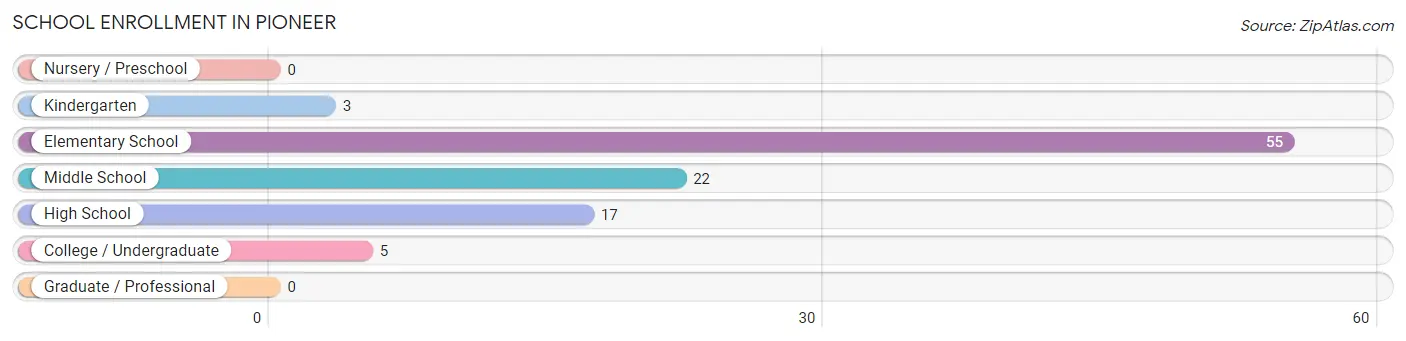
| School Level | # Students | % Students |
| Nursery / Preschool | 0 | 0.0% |
| Kindergarten | 3 | 2.9% |
| Elementary School | 55 | 53.9% |
| Middle School | 22 | 21.6% |
| High School | 17 | 16.7% |
| College / Undergraduate | 5 | 4.9% |
| Graduate / Professional | 0 | 0.0% |
| Total | 102 | 100.0% |
School Enrollment by Age by Funding Source in Pioneer
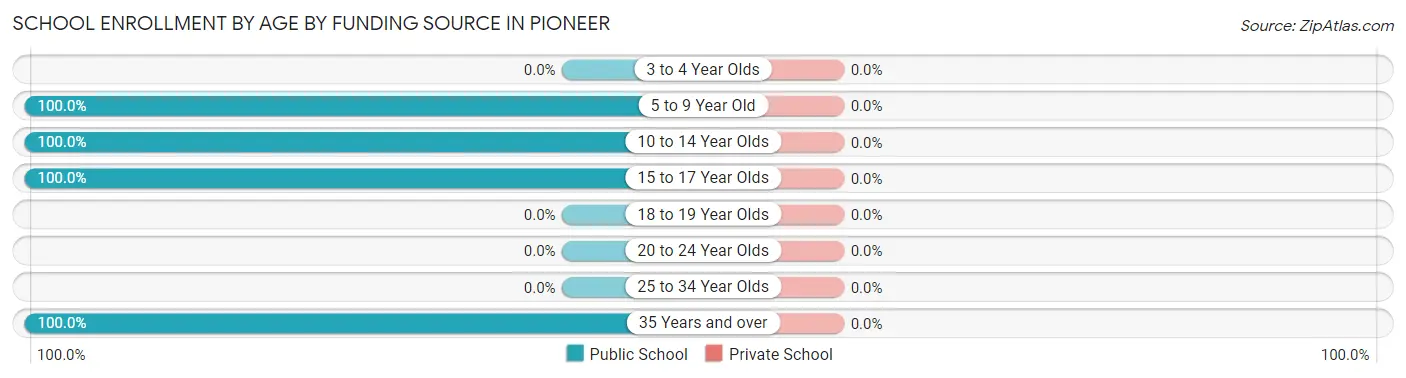
| Age Bracket | Public School | Private School |
| 3 to 4 Year Olds | 0 (0.0%) | 0 (0.0%) |
| 5 to 9 Year Old | 58 (100.0%) | 0 (0.0%) |
| 10 to 14 Year Olds | 22 (100.0%) | 0 (0.0%) |
| 15 to 17 Year Olds | 17 (100.0%) | 0 (0.0%) |
| 18 to 19 Year Olds | 0 (0.0%) | 0 (0.0%) |
| 20 to 24 Year Olds | 0 (0.0%) | 0 (0.0%) |
| 25 to 34 Year Olds | 0 (0.0%) | 0 (0.0%) |
| 35 Years and over | 5 (100.0%) | 0 (0.0%) |
| Total | 102 (100.0%) | 0 (0.0%) |
Educational Attainment by Field of Study in Pioneer
Arts & humanities (10 | 41.7%), education (8 | 33.3%), business (5 | 20.8%), and bio, nature & agricultural (1 | 4.2%) are the most common fields of study among 24 individuals in Pioneer who have obtained a bachelor's degree or higher.
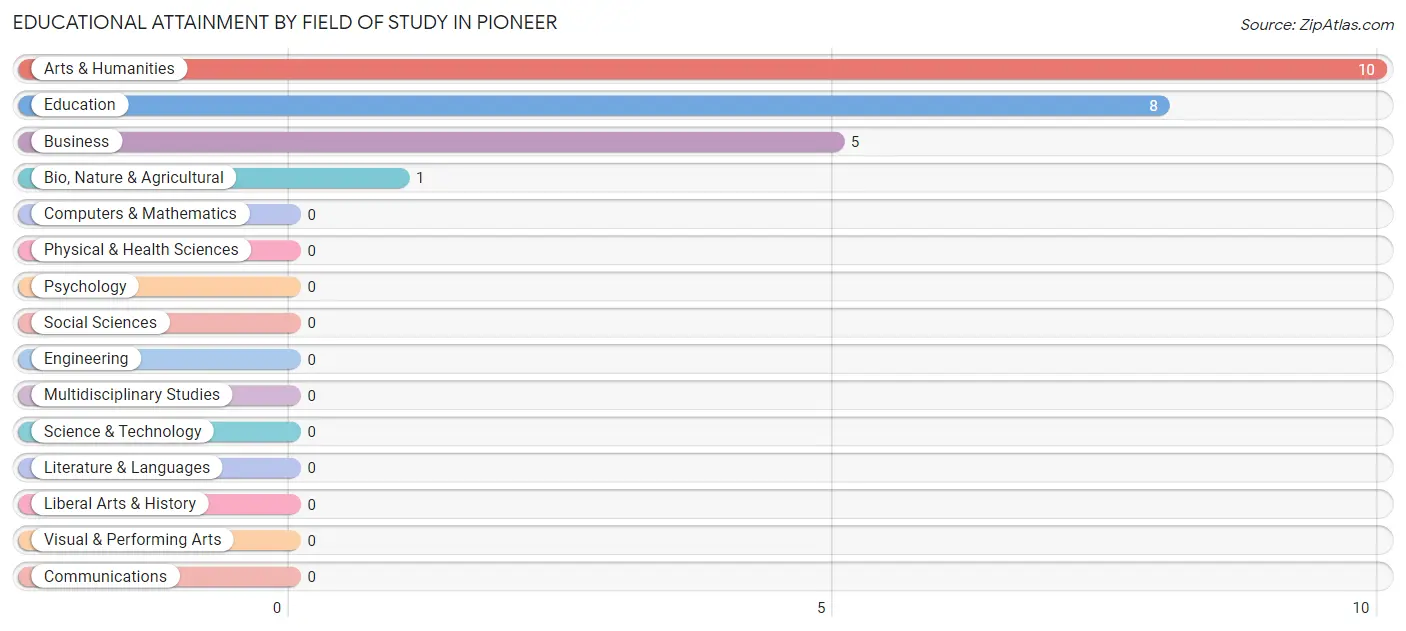
| Field of Study | # Graduates | % Graduates |
| Computers & Mathematics | 0 | 0.0% |
| Bio, Nature & Agricultural | 1 | 4.2% |
| Physical & Health Sciences | 0 | 0.0% |
| Psychology | 0 | 0.0% |
| Social Sciences | 0 | 0.0% |
| Engineering | 0 | 0.0% |
| Multidisciplinary Studies | 0 | 0.0% |
| Science & Technology | 0 | 0.0% |
| Business | 5 | 20.8% |
| Education | 8 | 33.3% |
| Literature & Languages | 0 | 0.0% |
| Liberal Arts & History | 0 | 0.0% |
| Visual & Performing Arts | 0 | 0.0% |
| Communications | 0 | 0.0% |
| Arts & Humanities | 10 | 41.7% |
| Total | 24 | 100.0% |
Transportation & Commute in Pioneer
Vehicle Availability by Sex in Pioneer
The most prevalent vehicle ownership categories in Pioneer are males with 2 vehicles (94, accounting for 87.8%) and females with 2 vehicles (114, making up 67.1%).
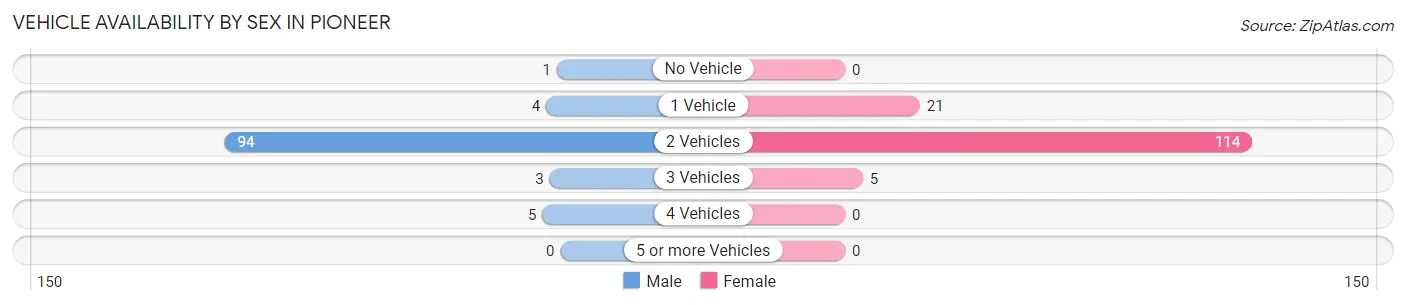
| Vehicles Available | Male | Female |
| No Vehicle | 1 (0.9%) | 0 (0.0%) |
| 1 Vehicle | 4 (3.7%) | 21 (15.0%) |
| 2 Vehicles | 94 (87.8%) | 114 (81.4%) |
| 3 Vehicles | 3 (2.8%) | 5 (3.6%) |
| 4 Vehicles | 5 (4.7%) | 0 (0.0%) |
| 5 or more Vehicles | 0 (0.0%) | 0 (0.0%) |
| Total | 107 (100.0%) | 140 (100.0%) |
Commute Time in Pioneer
The most frequently occuring commute durations in Pioneer are 10 to 14 minutes (162 commuters, 65.6%), less than 5 minutes (26 commuters, 10.5%), and 35 to 39 minutes (16 commuters, 6.5%).
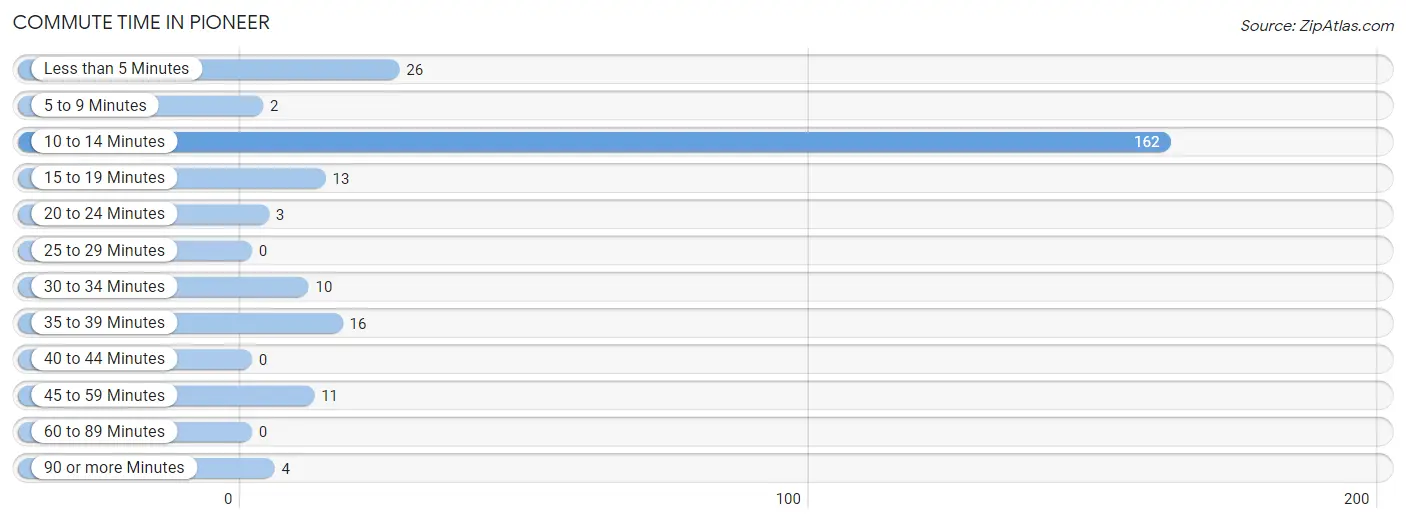
| Commute Time | # Commuters | % Commuters |
| Less than 5 Minutes | 26 | 10.5% |
| 5 to 9 Minutes | 2 | 0.8% |
| 10 to 14 Minutes | 162 | 65.6% |
| 15 to 19 Minutes | 13 | 5.3% |
| 20 to 24 Minutes | 3 | 1.2% |
| 25 to 29 Minutes | 0 | 0.0% |
| 30 to 34 Minutes | 10 | 4.1% |
| 35 to 39 Minutes | 16 | 6.5% |
| 40 to 44 Minutes | 0 | 0.0% |
| 45 to 59 Minutes | 11 | 4.4% |
| 60 to 89 Minutes | 0 | 0.0% |
| 90 or more Minutes | 4 | 1.6% |
Commute Time by Sex in Pioneer
The most common commute times in Pioneer are 10 to 14 minutes (55 commuters, 51.4%) for males and 10 to 14 minutes (107 commuters, 76.4%) for females.
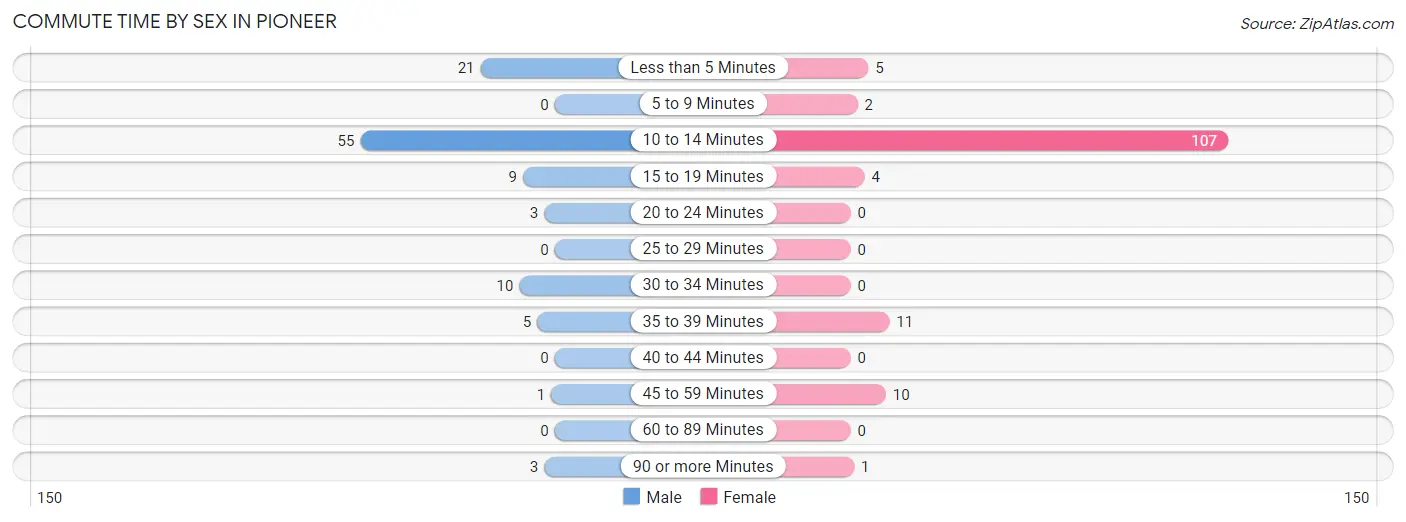
| Commute Time | Male | Female |
| Less than 5 Minutes | 21 (19.6%) | 5 (3.6%) |
| 5 to 9 Minutes | 0 (0.0%) | 2 (1.4%) |
| 10 to 14 Minutes | 55 (51.4%) | 107 (76.4%) |
| 15 to 19 Minutes | 9 (8.4%) | 4 (2.9%) |
| 20 to 24 Minutes | 3 (2.8%) | 0 (0.0%) |
| 25 to 29 Minutes | 0 (0.0%) | 0 (0.0%) |
| 30 to 34 Minutes | 10 (9.3%) | 0 (0.0%) |
| 35 to 39 Minutes | 5 (4.7%) | 11 (7.9%) |
| 40 to 44 Minutes | 0 (0.0%) | 0 (0.0%) |
| 45 to 59 Minutes | 1 (0.9%) | 10 (7.1%) |
| 60 to 89 Minutes | 0 (0.0%) | 0 (0.0%) |
| 90 or more Minutes | 3 (2.8%) | 1 (0.7%) |
Time of Departure to Work by Sex in Pioneer
The most frequent times of departure to work in Pioneer are 7:00 AM to 7:29 AM (72, 67.3%) for males and 7:30 AM to 7:59 AM (107, 76.4%) for females.
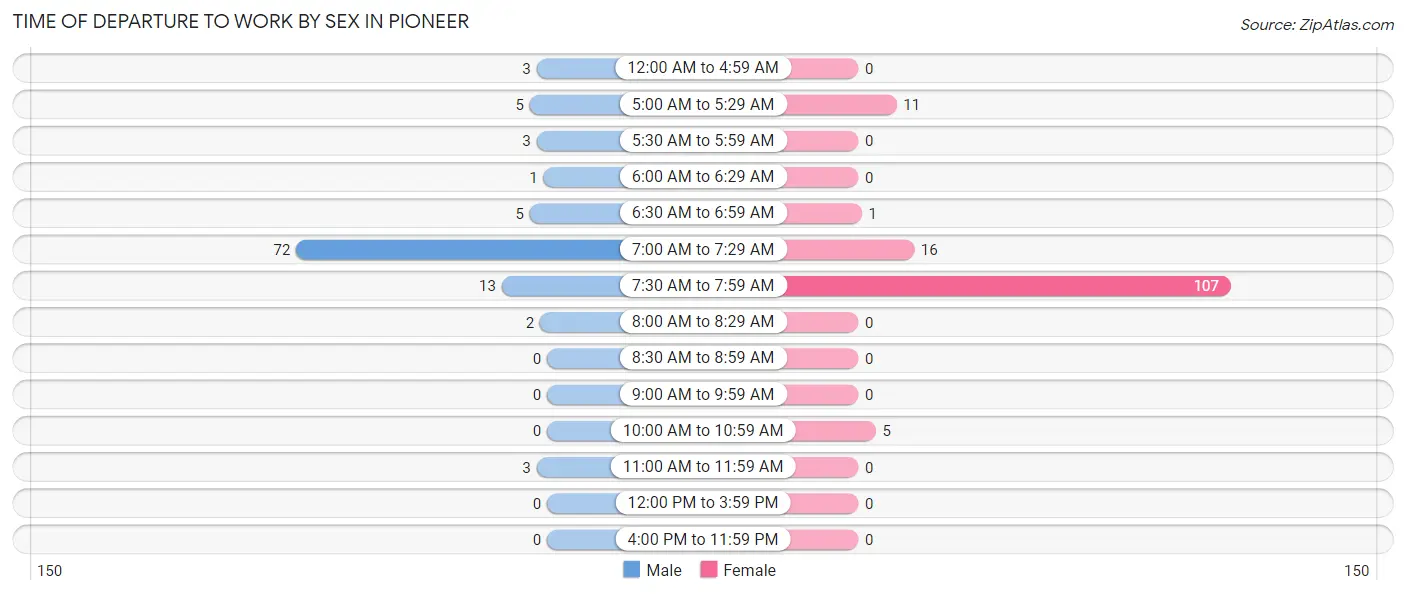
| Time of Departure | Male | Female |
| 12:00 AM to 4:59 AM | 3 (2.8%) | 0 (0.0%) |
| 5:00 AM to 5:29 AM | 5 (4.7%) | 11 (7.9%) |
| 5:30 AM to 5:59 AM | 3 (2.8%) | 0 (0.0%) |
| 6:00 AM to 6:29 AM | 1 (0.9%) | 0 (0.0%) |
| 6:30 AM to 6:59 AM | 5 (4.7%) | 1 (0.7%) |
| 7:00 AM to 7:29 AM | 72 (67.3%) | 16 (11.4%) |
| 7:30 AM to 7:59 AM | 13 (12.1%) | 107 (76.4%) |
| 8:00 AM to 8:29 AM | 2 (1.9%) | 0 (0.0%) |
| 8:30 AM to 8:59 AM | 0 (0.0%) | 0 (0.0%) |
| 9:00 AM to 9:59 AM | 0 (0.0%) | 0 (0.0%) |
| 10:00 AM to 10:59 AM | 0 (0.0%) | 5 (3.6%) |
| 11:00 AM to 11:59 AM | 3 (2.8%) | 0 (0.0%) |
| 12:00 PM to 3:59 PM | 0 (0.0%) | 0 (0.0%) |
| 4:00 PM to 11:59 PM | 0 (0.0%) | 0 (0.0%) |
| Total | 107 (100.0%) | 140 (100.0%) |
Housing Occupancy in Pioneer
Occupancy by Ownership in Pioneer
Of the total 140 dwellings in Pioneer, owner-occupied units account for 54 (38.6%), while renter-occupied units make up 86 (61.4%).
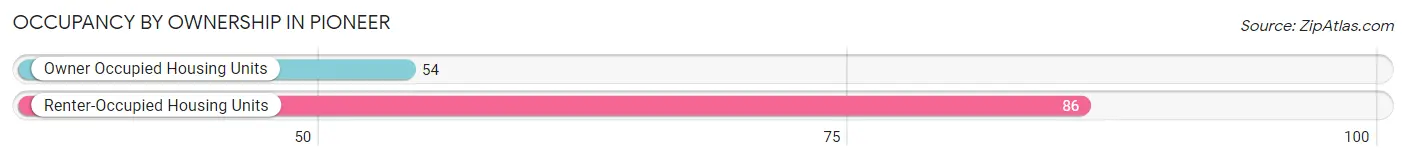
| Occupancy | # Housing Units | % Housing Units |
| Owner Occupied Housing Units | 54 | 38.6% |
| Renter-Occupied Housing Units | 86 | 61.4% |
| Total Occupied Housing Units | 140 | 100.0% |
Occupancy by Household Size in Pioneer
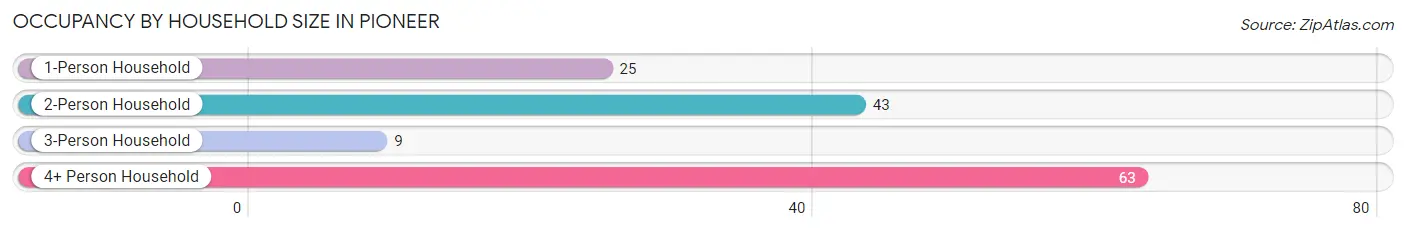
| Household Size | # Housing Units | % Housing Units |
| 1-Person Household | 25 | 17.9% |
| 2-Person Household | 43 | 30.7% |
| 3-Person Household | 9 | 6.4% |
| 4+ Person Household | 63 | 45.0% |
| Total Housing Units | 140 | 100.0% |
Occupancy by Ownership by Household Size in Pioneer
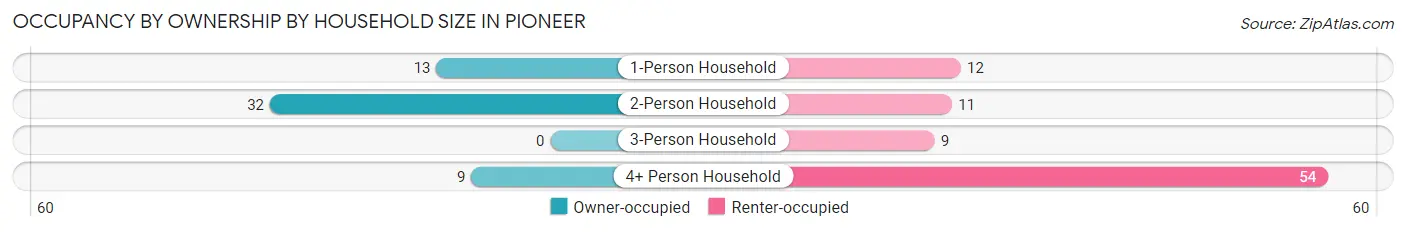
| Household Size | Owner-occupied | Renter-occupied |
| 1-Person Household | 13 (52.0%) | 12 (48.0%) |
| 2-Person Household | 32 (74.4%) | 11 (25.6%) |
| 3-Person Household | 0 (0.0%) | 9 (100.0%) |
| 4+ Person Household | 9 (14.3%) | 54 (85.7%) |
| Total Housing Units | 54 (38.6%) | 86 (61.4%) |
Occupancy by Educational Attainment in Pioneer
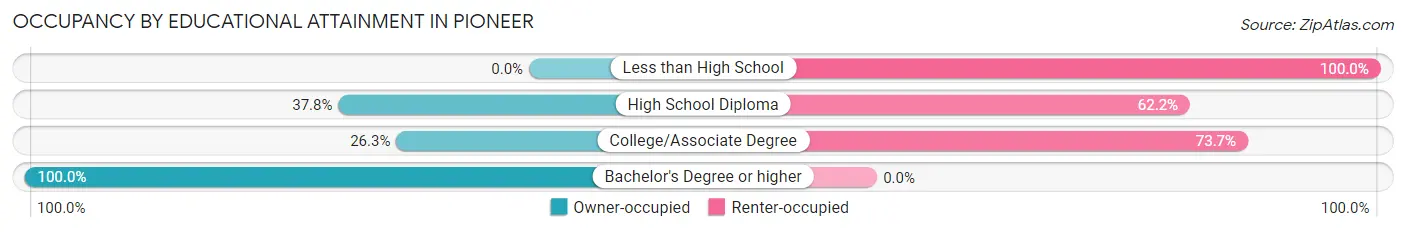
| Household Size | Owner-occupied | Renter-occupied |
| Less than High School | 0 (0.0%) | 7 (100.0%) |
| High School Diploma | 31 (37.8%) | 51 (62.2%) |
| College/Associate Degree | 10 (26.3%) | 28 (73.7%) |
| Bachelor's Degree or higher | 13 (100.0%) | 0 (0.0%) |
Occupancy by Age of Householder in Pioneer
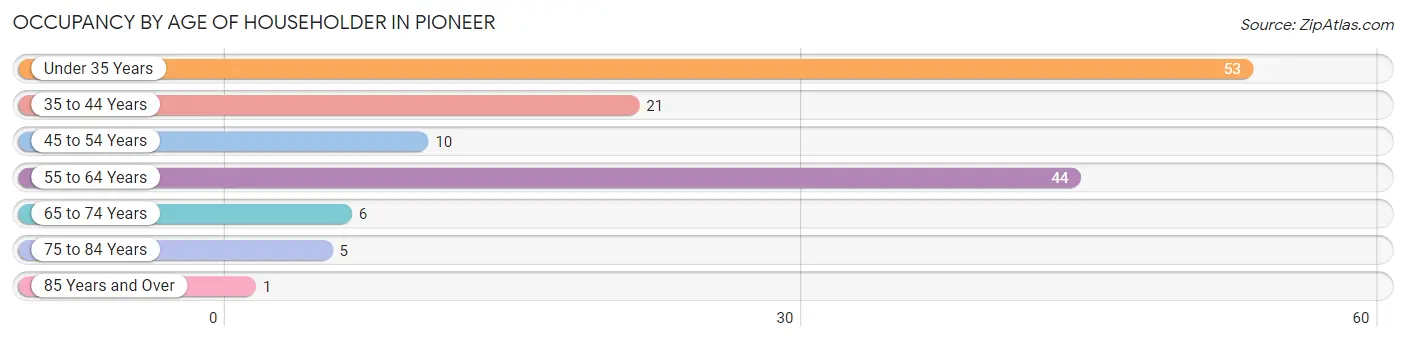
| Age Bracket | # Households | % Households |
| Under 35 Years | 53 | 37.9% |
| 35 to 44 Years | 21 | 15.0% |
| 45 to 54 Years | 10 | 7.1% |
| 55 to 64 Years | 44 | 31.4% |
| 65 to 74 Years | 6 | 4.3% |
| 75 to 84 Years | 5 | 3.6% |
| 85 Years and Over | 1 | 0.7% |
| Total | 140 | 100.0% |
Housing Finances in Pioneer
Median Income by Occupancy in Pioneer
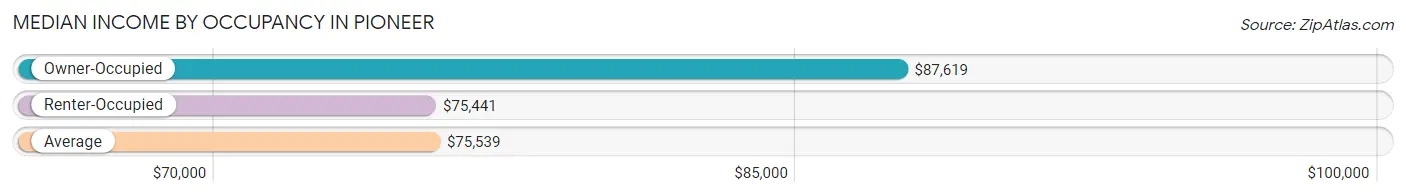
| Occupancy Type | # Households | Median Income |
| Owner-Occupied | 54 (38.6%) | $87,619 |
| Renter-Occupied | 86 (61.4%) | $75,441 |
| Average | 140 (100.0%) | $75,539 |
Occupancy by Householder Income Bracket in Pioneer
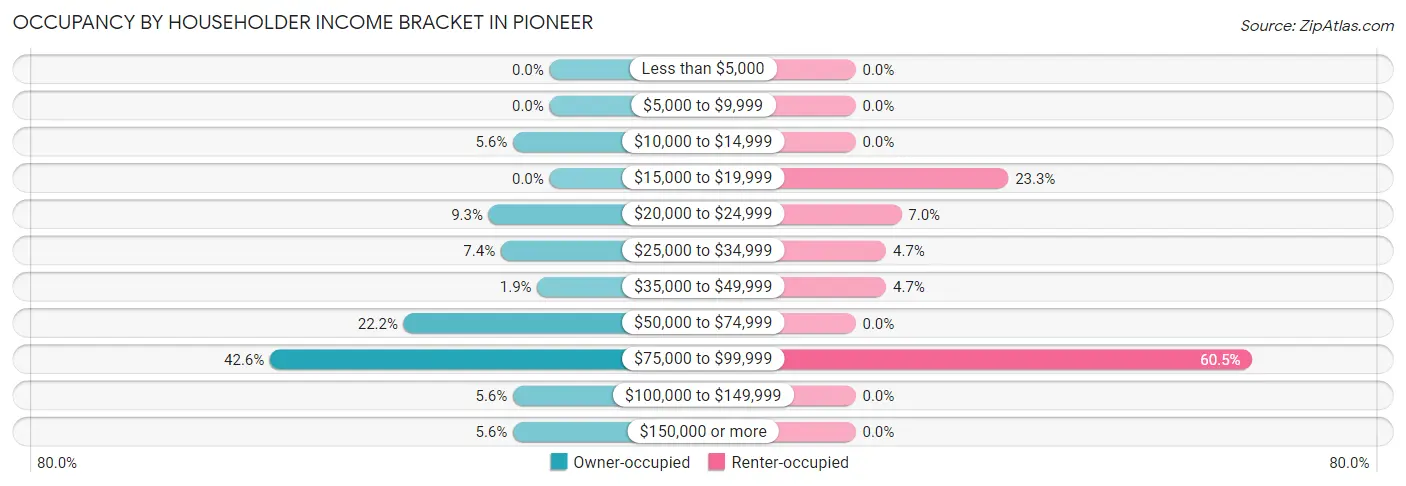
| Income Bracket | Owner-occupied | Renter-occupied |
| Less than $5,000 | 0 (0.0%) | 0 (0.0%) |
| $5,000 to $9,999 | 0 (0.0%) | 0 (0.0%) |
| $10,000 to $14,999 | 3 (5.6%) | 0 (0.0%) |
| $15,000 to $19,999 | 0 (0.0%) | 20 (23.3%) |
| $20,000 to $24,999 | 5 (9.3%) | 6 (7.0%) |
| $25,000 to $34,999 | 4 (7.4%) | 4 (4.6%) |
| $35,000 to $49,999 | 1 (1.8%) | 4 (4.6%) |
| $50,000 to $74,999 | 12 (22.2%) | 0 (0.0%) |
| $75,000 to $99,999 | 23 (42.6%) | 52 (60.5%) |
| $100,000 to $149,999 | 3 (5.6%) | 0 (0.0%) |
| $150,000 or more | 3 (5.6%) | 0 (0.0%) |
| Total | 54 (100.0%) | 86 (100.0%) |
Monthly Housing Cost Tiers in Pioneer
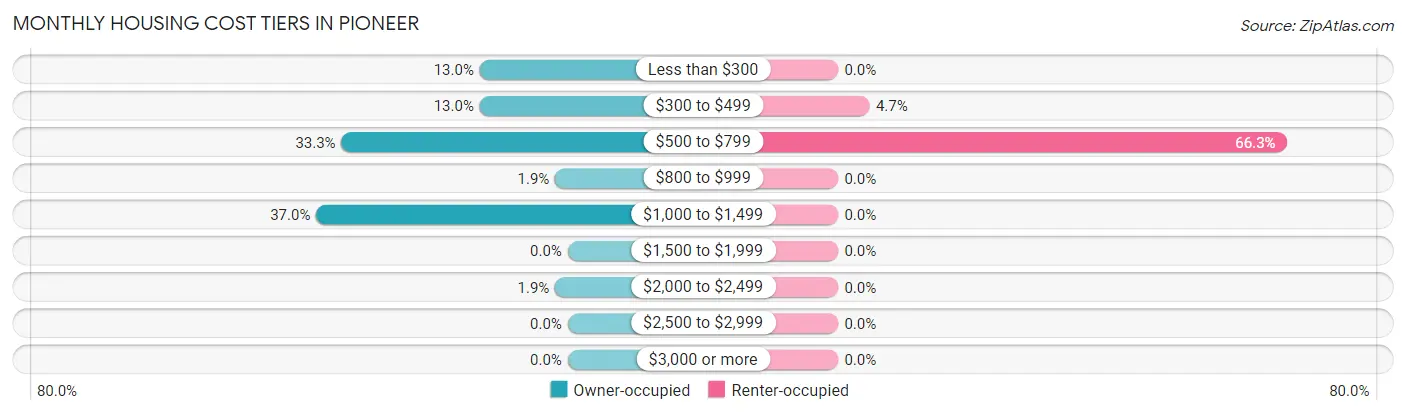
| Monthly Cost | Owner-occupied | Renter-occupied |
| Less than $300 | 7 (13.0%) | 0 (0.0%) |
| $300 to $499 | 7 (13.0%) | 4 (4.6%) |
| $500 to $799 | 18 (33.3%) | 57 (66.3%) |
| $800 to $999 | 1 (1.8%) | 0 (0.0%) |
| $1,000 to $1,499 | 20 (37.0%) | 0 (0.0%) |
| $1,500 to $1,999 | 0 (0.0%) | 0 (0.0%) |
| $2,000 to $2,499 | 1 (1.8%) | 0 (0.0%) |
| $2,500 to $2,999 | 0 (0.0%) | 0 (0.0%) |
| $3,000 or more | 0 (0.0%) | 0 (0.0%) |
| Total | 54 (100.0%) | 86 (100.0%) |
Physical Housing Characteristics in Pioneer
Housing Structures in Pioneer
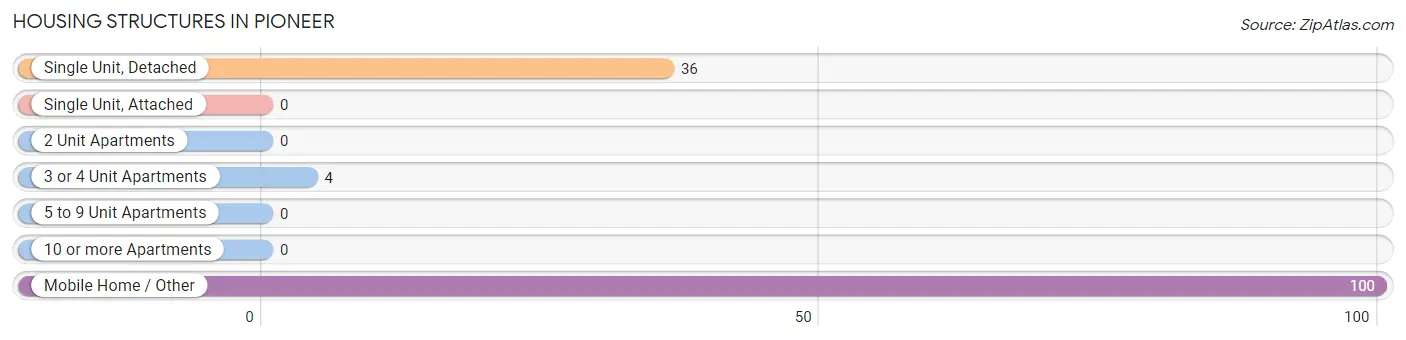
| Structure Type | # Housing Units | % Housing Units |
| Single Unit, Detached | 36 | 25.7% |
| Single Unit, Attached | 0 | 0.0% |
| 2 Unit Apartments | 0 | 0.0% |
| 3 or 4 Unit Apartments | 4 | 2.9% |
| 5 to 9 Unit Apartments | 0 | 0.0% |
| 10 or more Apartments | 0 | 0.0% |
| Mobile Home / Other | 100 | 71.4% |
| Total | 140 | 100.0% |
Housing Structures by Occupancy in Pioneer
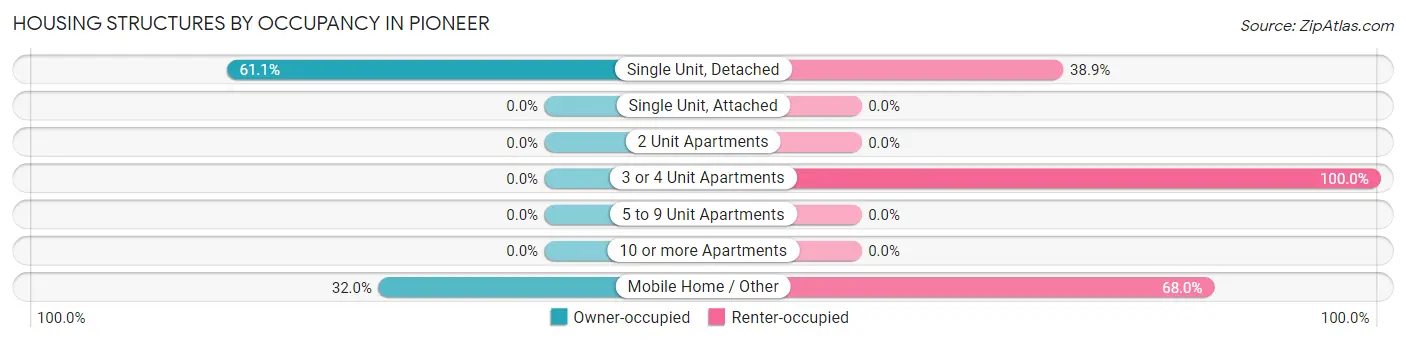
| Structure Type | Owner-occupied | Renter-occupied |
| Single Unit, Detached | 22 (61.1%) | 14 (38.9%) |
| Single Unit, Attached | 0 (0.0%) | 0 (0.0%) |
| 2 Unit Apartments | 0 (0.0%) | 0 (0.0%) |
| 3 or 4 Unit Apartments | 0 (0.0%) | 4 (100.0%) |
| 5 to 9 Unit Apartments | 0 (0.0%) | 0 (0.0%) |
| 10 or more Apartments | 0 (0.0%) | 0 (0.0%) |
| Mobile Home / Other | 32 (32.0%) | 68 (68.0%) |
| Total | 54 (38.6%) | 86 (61.4%) |
Housing Structures by Number of Rooms in Pioneer
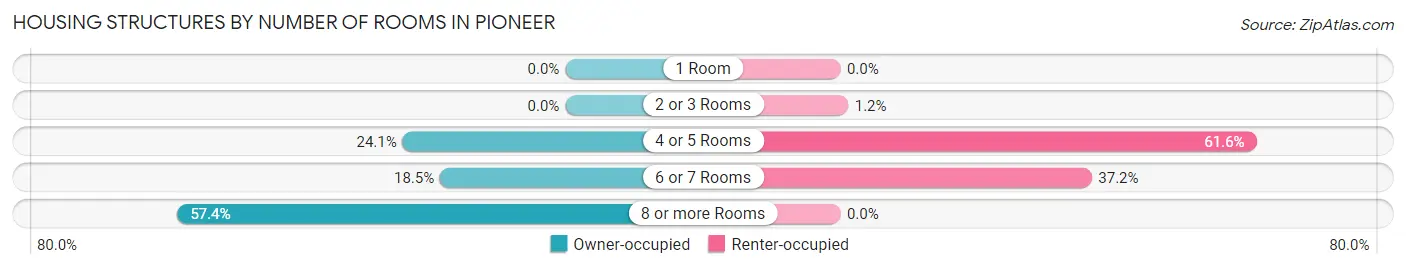
| Number of Rooms | Owner-occupied | Renter-occupied |
| 1 Room | 0 (0.0%) | 0 (0.0%) |
| 2 or 3 Rooms | 0 (0.0%) | 1 (1.2%) |
| 4 or 5 Rooms | 13 (24.1%) | 53 (61.6%) |
| 6 or 7 Rooms | 10 (18.5%) | 32 (37.2%) |
| 8 or more Rooms | 31 (57.4%) | 0 (0.0%) |
| Total | 54 (100.0%) | 86 (100.0%) |
Housing Structure by Heating Type in Pioneer
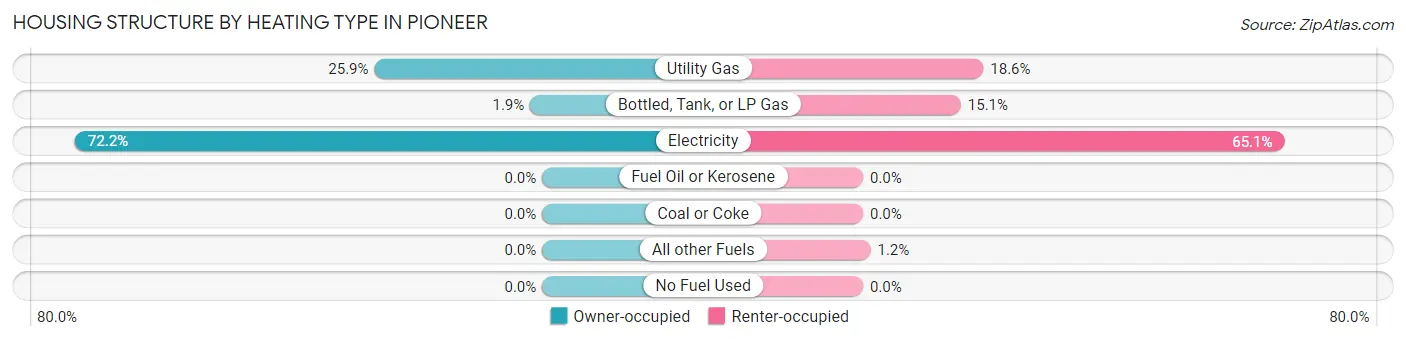
| Heating Type | Owner-occupied | Renter-occupied |
| Utility Gas | 14 (25.9%) | 16 (18.6%) |
| Bottled, Tank, or LP Gas | 1 (1.8%) | 13 (15.1%) |
| Electricity | 39 (72.2%) | 56 (65.1%) |
| Fuel Oil or Kerosene | 0 (0.0%) | 0 (0.0%) |
| Coal or Coke | 0 (0.0%) | 0 (0.0%) |
| All other Fuels | 0 (0.0%) | 1 (1.2%) |
| No Fuel Used | 0 (0.0%) | 0 (0.0%) |
| Total | 54 (100.0%) | 86 (100.0%) |
Household Vehicle Usage in Pioneer
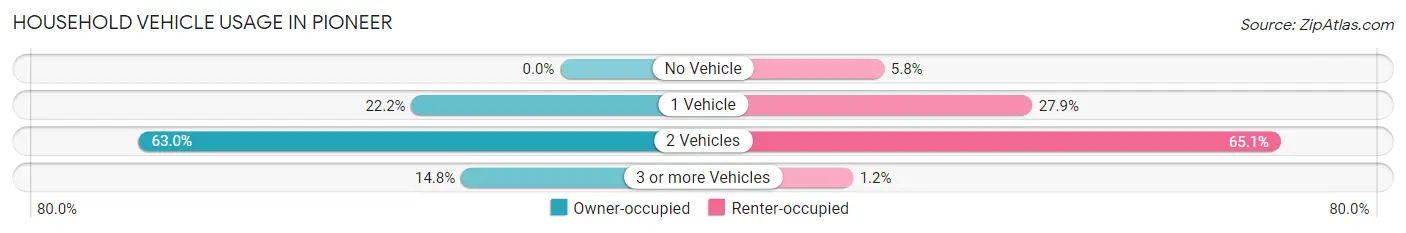
| Vehicles per Household | Owner-occupied | Renter-occupied |
| No Vehicle | 0 (0.0%) | 5 (5.8%) |
| 1 Vehicle | 12 (22.2%) | 24 (27.9%) |
| 2 Vehicles | 34 (63.0%) | 56 (65.1%) |
| 3 or more Vehicles | 8 (14.8%) | 1 (1.2%) |
| Total | 54 (100.0%) | 86 (100.0%) |
Real Estate & Mortgages in Pioneer
Real Estate and Mortgage Overview in Pioneer
| Characteristic | Without Mortgage | With Mortgage |
| Housing Units | 16 | 38 |
| Median Property Value | $56,700 | $90,500 |
| Median Household Income | - | - |
| Monthly Housing Costs | $317 | $0 |
| Real Estate Taxes | - | - |
Property Value by Mortgage Status in Pioneer
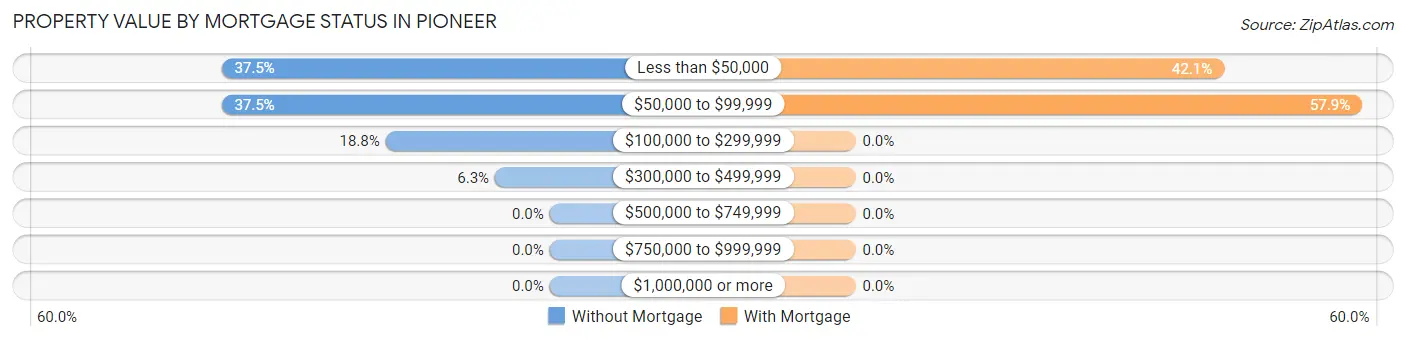
| Property Value | Without Mortgage | With Mortgage |
| Less than $50,000 | 6 (37.5%) | 16 (42.1%) |
| $50,000 to $99,999 | 6 (37.5%) | 22 (57.9%) |
| $100,000 to $299,999 | 3 (18.8%) | 0 (0.0%) |
| $300,000 to $499,999 | 1 (6.2%) | 0 (0.0%) |
| $500,000 to $749,999 | 0 (0.0%) | 0 (0.0%) |
| $750,000 to $999,999 | 0 (0.0%) | 0 (0.0%) |
| $1,000,000 or more | 0 (0.0%) | 0 (0.0%) |
| Total | 16 (100.0%) | 38 (100.0%) |
Household Income by Mortgage Status in Pioneer
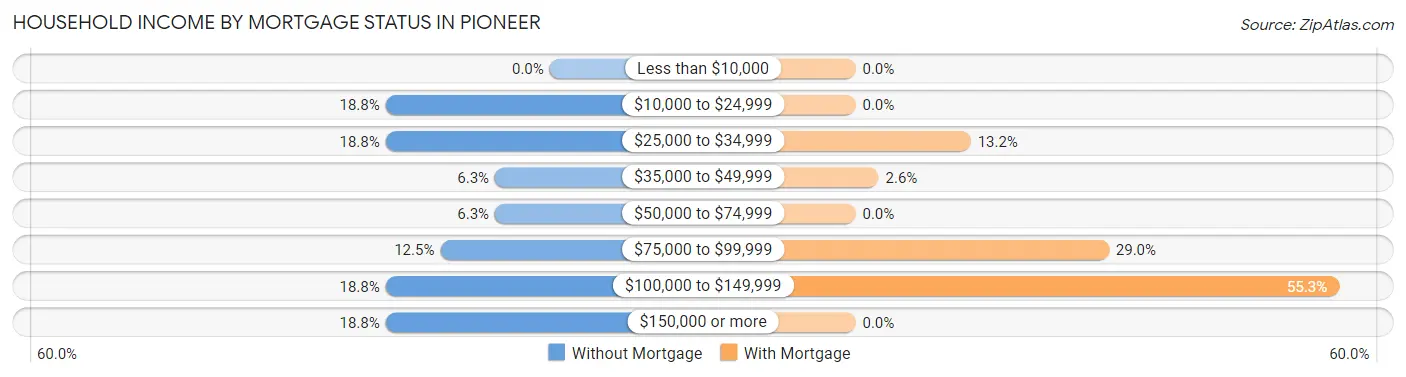
| Household Income | Without Mortgage | With Mortgage |
| Less than $10,000 | 0 (0.0%) | 0 (0.0%) |
| $10,000 to $24,999 | 3 (18.8%) | 0 (0.0%) |
| $25,000 to $34,999 | 3 (18.8%) | 5 (13.2%) |
| $35,000 to $49,999 | 1 (6.2%) | 1 (2.6%) |
| $50,000 to $74,999 | 1 (6.2%) | 0 (0.0%) |
| $75,000 to $99,999 | 2 (12.5%) | 11 (28.9%) |
| $100,000 to $149,999 | 3 (18.8%) | 21 (55.3%) |
| $150,000 or more | 3 (18.8%) | 0 (0.0%) |
| Total | 16 (100.0%) | 38 (100.0%) |
Property Value to Household Income Ratio in Pioneer
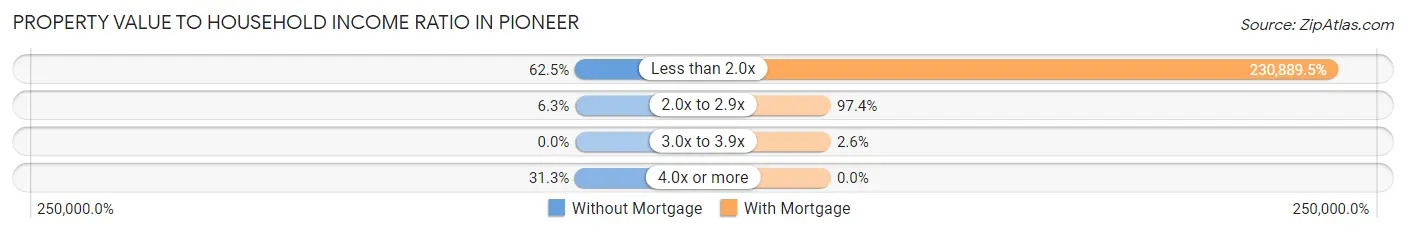
| Value-to-Income Ratio | Without Mortgage | With Mortgage |
| Less than 2.0x | 10 (62.5%) | 87,738 (230,889.5%) |
| 2.0x to 2.9x | 1 (6.2%) | 37 (97.4%) |
| 3.0x to 3.9x | 0 (0.0%) | 1 (2.6%) |
| 4.0x or more | 5 (31.2%) | 0 (0.0%) |
| Total | 16 (100.0%) | 38 (100.0%) |
Real Estate Taxes by Mortgage Status in Pioneer
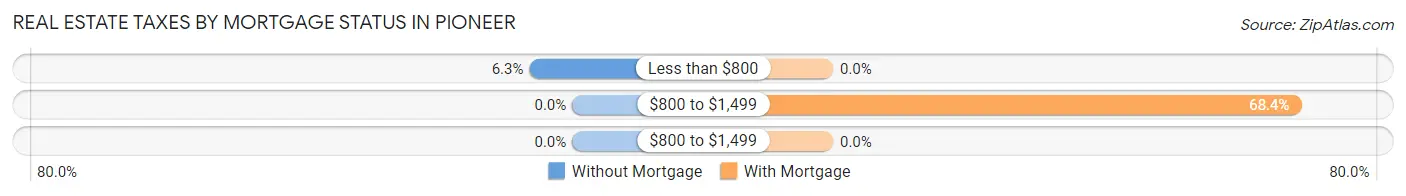
| Property Taxes | Without Mortgage | With Mortgage |
| Less than $800 | 1 (6.2%) | 0 (0.0%) |
| $800 to $1,499 | 0 (0.0%) | 26 (68.4%) |
| $800 to $1,499 | 0 (0.0%) | 0 (0.0%) |
| Total | 16 (100.0%) | 38 (100.0%) |
Health & Disability in Pioneer
Health Insurance Coverage by Age in Pioneer
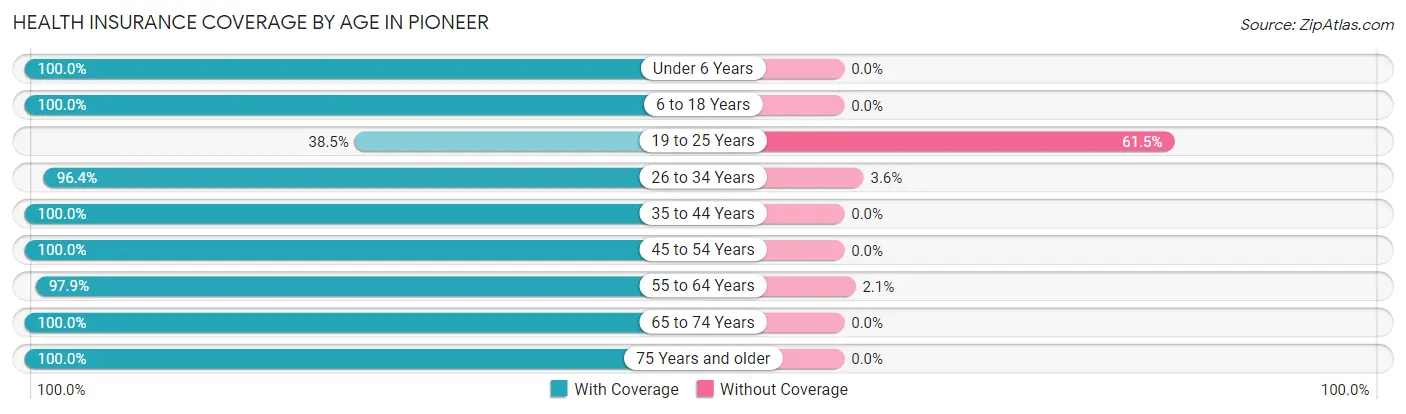
| Age Bracket | With Coverage | Without Coverage |
| Under 6 Years | 71 (100.0%) | 0 (0.0%) |
| 6 to 18 Years | 104 (100.0%) | 0 (0.0%) |
| 19 to 25 Years | 5 (38.5%) | 8 (61.5%) |
| 26 to 34 Years | 161 (96.4%) | 6 (3.6%) |
| 35 to 44 Years | 42 (100.0%) | 0 (0.0%) |
| 45 to 54 Years | 24 (100.0%) | 0 (0.0%) |
| 55 to 64 Years | 47 (97.9%) | 1 (2.1%) |
| 65 to 74 Years | 12 (100.0%) | 0 (0.0%) |
| 75 Years and older | 8 (100.0%) | 0 (0.0%) |
| Total | 474 (96.9%) | 15 (3.1%) |
Health Insurance Coverage by Citizenship Status in Pioneer
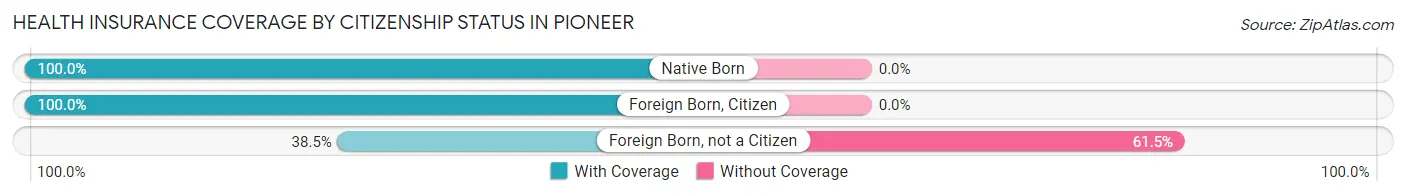
| Citizenship Status | With Coverage | Without Coverage |
| Native Born | 71 (100.0%) | 0 (0.0%) |
| Foreign Born, Citizen | 104 (100.0%) | 0 (0.0%) |
| Foreign Born, not a Citizen | 5 (38.5%) | 8 (61.5%) |
Health Insurance Coverage by Household Income in Pioneer
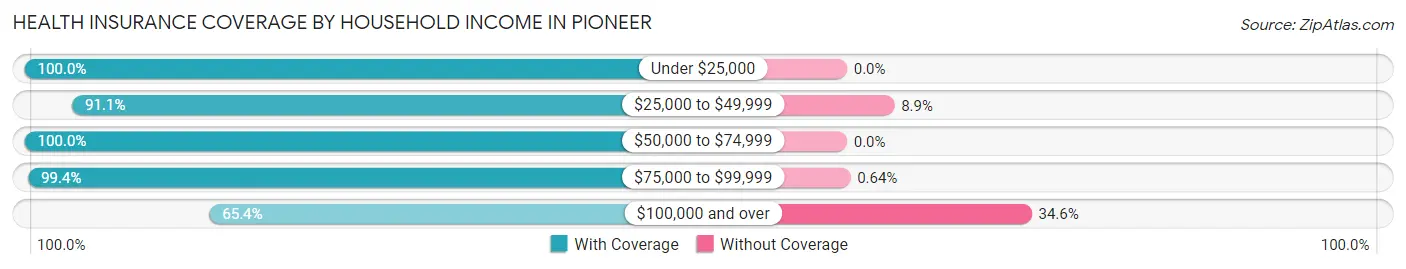
| Household Income | With Coverage | Without Coverage |
| Under $25,000 | 70 (100.0%) | 0 (0.0%) |
| $25,000 to $49,999 | 41 (91.1%) | 4 (8.9%) |
| $50,000 to $74,999 | 36 (100.0%) | 0 (0.0%) |
| $75,000 to $99,999 | 310 (99.4%) | 2 (0.6%) |
| $100,000 and over | 17 (65.4%) | 9 (34.6%) |
Public vs Private Health Insurance Coverage by Age in Pioneer
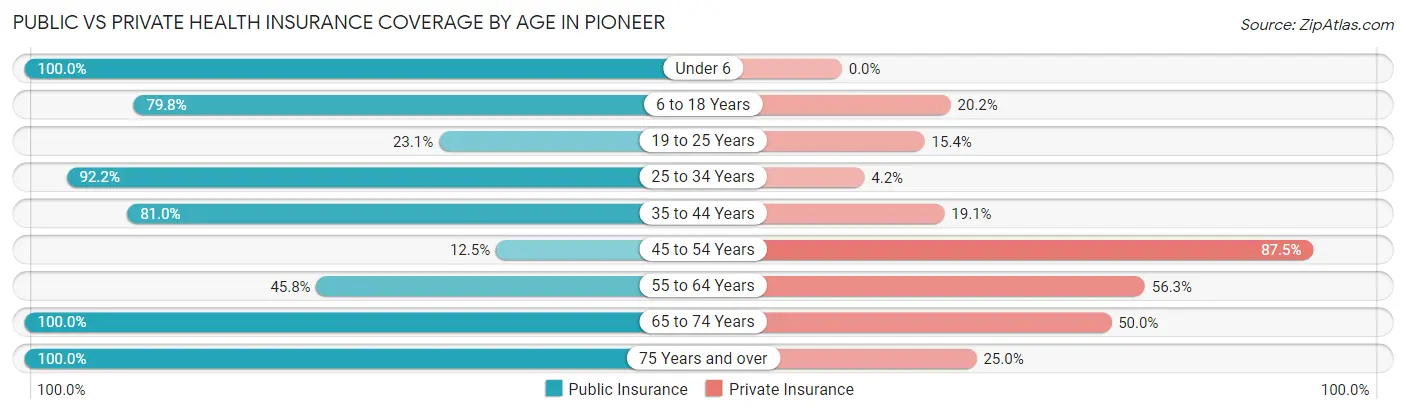
| Age Bracket | Public Insurance | Private Insurance |
| Under 6 | 71 (100.0%) | 0 (0.0%) |
| 6 to 18 Years | 83 (79.8%) | 21 (20.2%) |
| 19 to 25 Years | 3 (23.1%) | 2 (15.4%) |
| 25 to 34 Years | 154 (92.2%) | 7 (4.2%) |
| 35 to 44 Years | 34 (80.9%) | 8 (19.1%) |
| 45 to 54 Years | 3 (12.5%) | 21 (87.5%) |
| 55 to 64 Years | 22 (45.8%) | 27 (56.2%) |
| 65 to 74 Years | 12 (100.0%) | 6 (50.0%) |
| 75 Years and over | 8 (100.0%) | 2 (25.0%) |
| Total | 390 (79.7%) | 94 (19.2%) |
Disability Status by Sex by Age in Pioneer
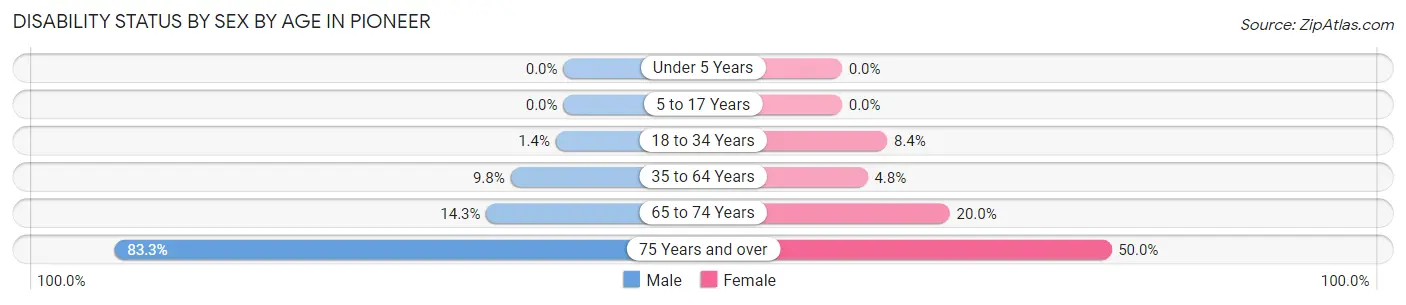
| Age Bracket | Male | Female |
| Under 5 Years | 0 (0.0%) | 0 (0.0%) |
| 5 to 17 Years | 0 (0.0%) | 0 (0.0%) |
| 18 to 34 Years | 1 (1.4%) | 10 (8.4%) |
| 35 to 64 Years | 5 (9.8%) | 3 (4.8%) |
| 65 to 74 Years | 1 (14.3%) | 1 (20.0%) |
| 75 Years and over | 5 (83.3%) | 1 (50.0%) |
Disability Class by Sex by Age in Pioneer
Disability Class: Hearing Difficulty
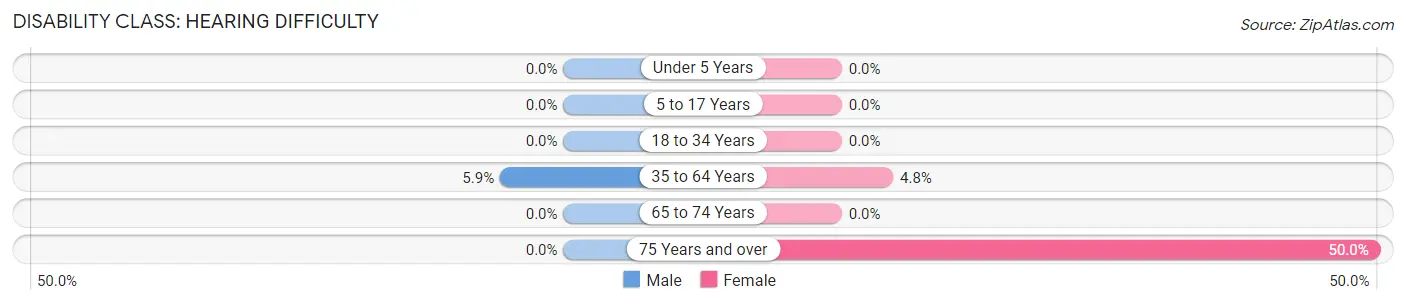
| Age Bracket | Male | Female |
| Under 5 Years | 0 (0.0%) | 0 (0.0%) |
| 5 to 17 Years | 0 (0.0%) | 0 (0.0%) |
| 18 to 34 Years | 0 (0.0%) | 0 (0.0%) |
| 35 to 64 Years | 3 (5.9%) | 3 (4.8%) |
| 65 to 74 Years | 0 (0.0%) | 0 (0.0%) |
| 75 Years and over | 0 (0.0%) | 1 (50.0%) |
Disability Class: Vision Difficulty
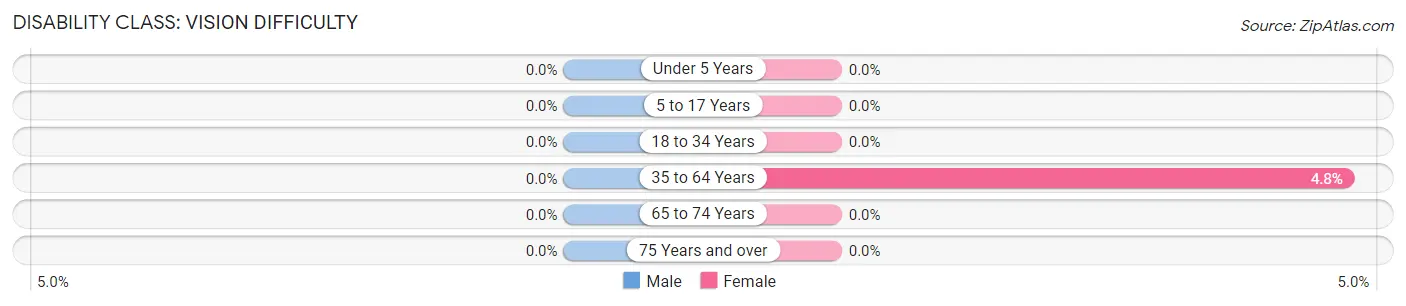
| Age Bracket | Male | Female |
| Under 5 Years | 0 (0.0%) | 0 (0.0%) |
| 5 to 17 Years | 0 (0.0%) | 0 (0.0%) |
| 18 to 34 Years | 0 (0.0%) | 0 (0.0%) |
| 35 to 64 Years | 0 (0.0%) | 3 (4.8%) |
| 65 to 74 Years | 0 (0.0%) | 0 (0.0%) |
| 75 Years and over | 0 (0.0%) | 0 (0.0%) |
Disability Class: Cognitive Difficulty
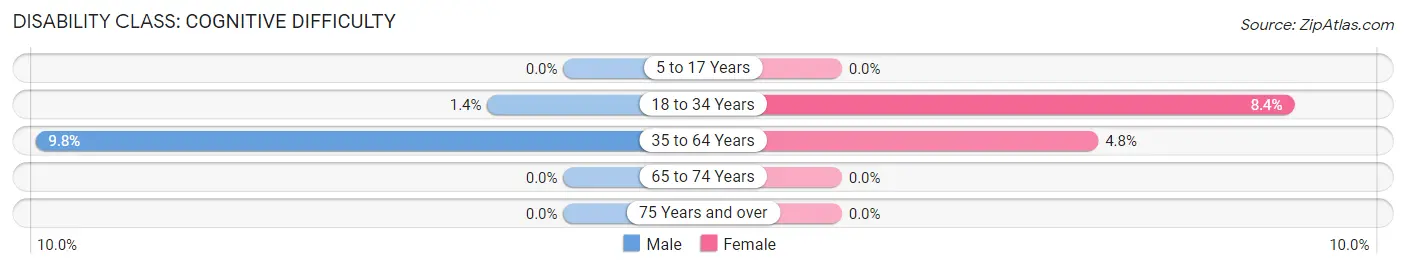
| Age Bracket | Male | Female |
| 5 to 17 Years | 0 (0.0%) | 0 (0.0%) |
| 18 to 34 Years | 1 (1.4%) | 10 (8.4%) |
| 35 to 64 Years | 5 (9.8%) | 3 (4.8%) |
| 65 to 74 Years | 0 (0.0%) | 0 (0.0%) |
| 75 Years and over | 0 (0.0%) | 0 (0.0%) |
Disability Class: Ambulatory Difficulty
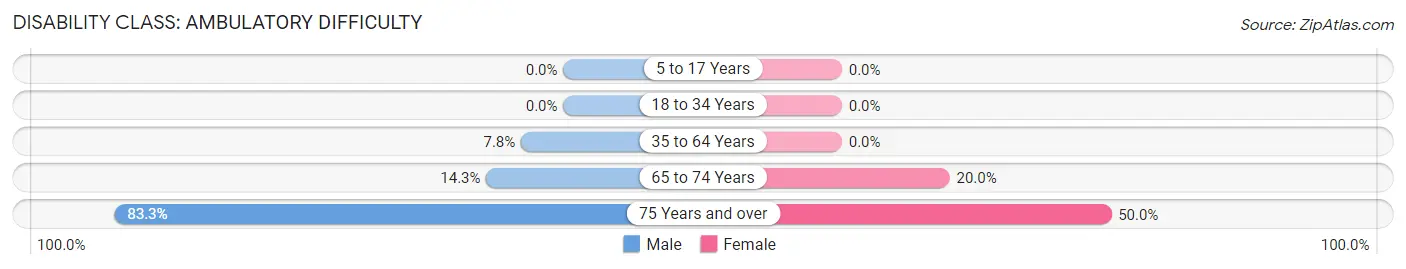
| Age Bracket | Male | Female |
| 5 to 17 Years | 0 (0.0%) | 0 (0.0%) |
| 18 to 34 Years | 0 (0.0%) | 0 (0.0%) |
| 35 to 64 Years | 4 (7.8%) | 0 (0.0%) |
| 65 to 74 Years | 1 (14.3%) | 1 (20.0%) |
| 75 Years and over | 5 (83.3%) | 1 (50.0%) |
Disability Class: Self-Care Difficulty
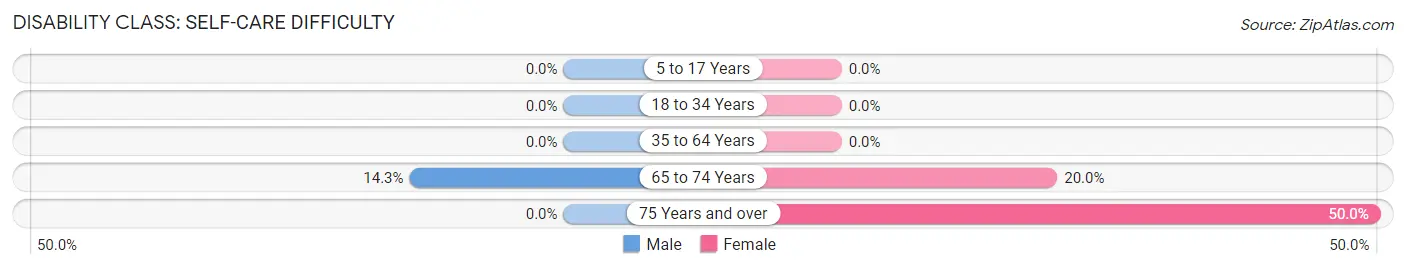
| Age Bracket | Male | Female |
| 5 to 17 Years | 0 (0.0%) | 0 (0.0%) |
| 18 to 34 Years | 0 (0.0%) | 0 (0.0%) |
| 35 to 64 Years | 0 (0.0%) | 0 (0.0%) |
| 65 to 74 Years | 1 (14.3%) | 1 (20.0%) |
| 75 Years and over | 0 (0.0%) | 1 (50.0%) |
Technology Access in Pioneer
Computing Device Access in Pioneer
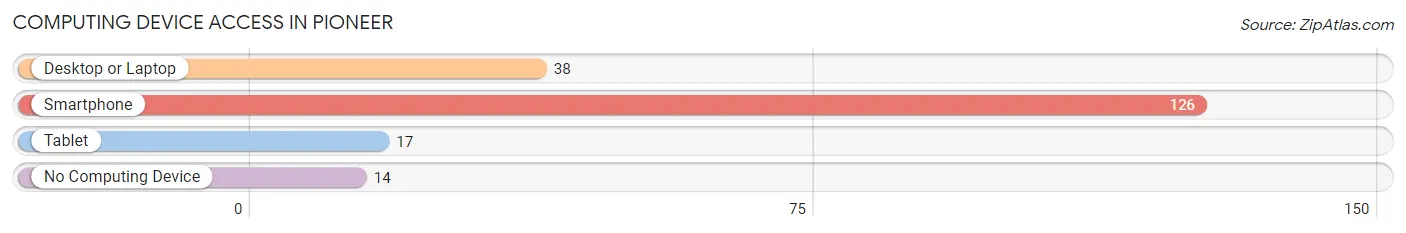
| Device Type | # Households | % Households |
| Desktop or Laptop | 38 | 27.1% |
| Smartphone | 126 | 90.0% |
| Tablet | 17 | 12.1% |
| No Computing Device | 14 | 10.0% |
| Total | 140 | 100.0% |
Internet Access in Pioneer
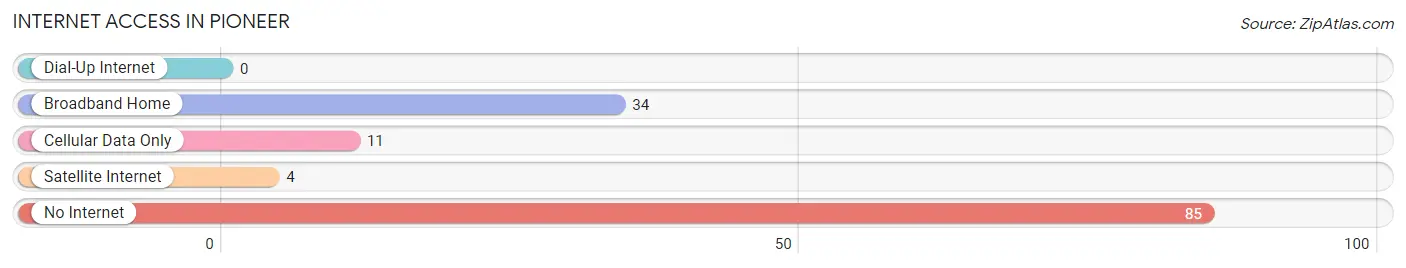
| Internet Type | # Households | % Households |
| Dial-Up Internet | 0 | 0.0% |
| Broadband Home | 34 | 24.3% |
| Cellular Data Only | 11 | 7.9% |
| Satellite Internet | 4 | 2.9% |
| No Internet | 85 | 60.7% |
| Total | 140 | 100.0% |
Pioneer Summary
Pioneer is a small town located in the state of Louisiana, in the United States. It is situated in the northern part of the state, in the parish of Tensas. The town has a population of approximately 1,000 people, and is located on the banks of the Mississippi River.
History
Pioneer was founded in 1837 by a group of settlers from the nearby town of St. Joseph. The settlers were looking for a place to settle and start a new life, and they chose the area around the Mississippi River. The town was named after the first settler, John Pioneer.
The town grew quickly, and by the mid-1800s, it had become a thriving community. It was home to a variety of businesses, including a sawmill, a gristmill, a cotton gin, and a general store. The town also had a school, a post office, and a church.
In the late 1800s, the town began to decline. The sawmill and gristmill closed, and the cotton gin was destroyed by a flood. The population began to dwindle, and by the early 1900s, the town was nearly abandoned.
In the mid-1900s, the town began to experience a revival. The population began to grow again, and new businesses opened. The town also began to attract tourists, who came to enjoy the natural beauty of the area.
Geography
Pioneer is located in the northern part of Louisiana, in the parish of Tensas. It is situated on the banks of the Mississippi River, and is surrounded by a variety of natural features, including forests, swamps, and wetlands. The town is located approximately 30 miles south of the city of Natchez, Mississippi.
The climate in Pioneer is humid subtropical, with hot, humid summers and mild winters. The average annual temperature is around 70 degrees Fahrenheit, and the average annual precipitation is around 50 inches.
Economy
The economy of Pioneer is largely based on agriculture and tourism. The town is home to a variety of farms, which produce a variety of crops, including corn, soybeans, cotton, and wheat. The town also has a number of tourist attractions, including a historic district, a museum, and a variety of outdoor activities.
Demographics
As of the 2010 census, the population of Pioneer was 1,000 people. The racial makeup of the town was 95.2% White, 2.2% African American, 0.7% Native American, 0.3% Asian, and 1.6% from other races. The median household income was $30,000, and the median family income was $35,000.
Conclusion
Pioneer is a small town located in the northern part of Louisiana, in the parish of Tensas. It has a population of approximately 1,000 people, and is situated on the banks of the Mississippi River. The town has a long history, and has experienced a revival in recent years. The economy of Pioneer is largely based on agriculture and tourism, and the town is home to a variety of farms and tourist attractions. The population of Pioneer is mostly White, with a small percentage of African American, Native American, and Asian residents.
Common Questions
What is Per Capita Income in Pioneer?
Per Capita income in Pioneer is $23,026.
What is the Median Family Income in Pioneer?
Median Family Income in Pioneer is $76,201.
What is the Median Household income in Pioneer?
Median Household Income in Pioneer is $75,539.
What is Income or Wage Gap in Pioneer?
Income or Wage Gap in Pioneer is 66.3%.
Women in Pioneer earn 33.7 cents for every dollar earned by a man.
What is Inequality or Gini Index in Pioneer?
Inequality or Gini Index in Pioneer is 0.27.
What is the Total Population of Pioneer?
Total Population of Pioneer is 489.
What is the Total Male Population of Pioneer?
Total Male Population of Pioneer is 155.
What is the Total Female Population of Pioneer?
Total Female Population of Pioneer is 334.
What is the Ratio of Males per 100 Females in Pioneer?
There are 46.41 Males per 100 Females in Pioneer.
What is the Ratio of Females per 100 Males in Pioneer?
There are 215.48 Females per 100 Males in Pioneer.
What is the Median Population Age in Pioneer?
Median Population Age in Pioneer is 28.4 Years.
What is the Average Family Size in Pioneer
Average Family Size in Pioneer is 4.1 People.
What is the Average Household Size in Pioneer
Average Household Size in Pioneer is 3.5 People.
How Large is the Labor Force in Pioneer?
There are 251 People in the Labor Forcein in Pioneer.
What is the Percentage of People in the Labor Force in Pioneer?
76.5% of People are in the Labor Force in Pioneer.
What is the Unemployment Rate in Pioneer?
Unemployment Rate in Pioneer is 0.8%.