Oil City, LA Map & Demographics
Oil City Map
Oil City Overview
$15,425
PER CAPITA INCOME
$18,790
AVG HOUSEHOLD INCOME
15.9%
WAGE / INCOME GAP [ % ]
84.1¢/ $1
WAGE / INCOME GAP [ $ ]
0.50
INEQUALITY / GINI INDEX
1,093
TOTAL POPULATION
544
MALE POPULATION
549
FEMALE POPULATION
99.09
MALES / 100 FEMALES
100.92
FEMALES / 100 MALES
32.7
MEDIAN AGE
3.0
AVG FAMILY SIZE
2.1
AVG HOUSEHOLD SIZE
459
LABOR FORCE [ PEOPLE ]
55.0%
PERCENT IN LABOR FORCE
12.9%
UNEMPLOYMENT RATE
Oil City Zip Codes
Oil City Area Codes
Income in Oil City
Income Overview in Oil City
| Characteristic | Number | Measure |
| Per Capita Income | 1,093 | $15,425 |
| Median Family Income | 239 | $0 |
| Mean Family Income | 239 | $36,651 |
| Median Household Income | 518 | $18,790 |
| Mean Household Income | 518 | $31,381 |
| Income Deficit | 239 | $0 |
| Wage / Income Gap (%) | 1,093 | 15.88% |
| Wage / Income Gap ($) | 1,093 | 84.12¢ per $1 |
| Gini / Inequality Index | 1,093 | 0.50 |
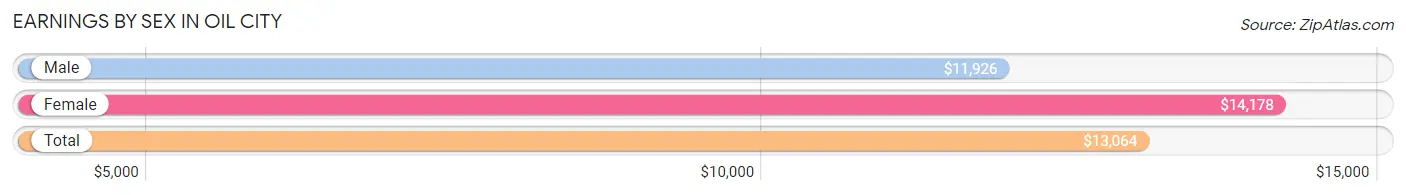
Earnings by Sex in Oil City
Average Earnings in Oil City are $13,064, $11,926 for men and $14,178 for women, a difference of 15.9%.
| Sex | Number | Average Earnings |
| Male | 226 (48.2%) | $11,926 |
| Female | 243 (51.8%) | $14,178 |
| Total | 469 (100.0%) | $13,064 |
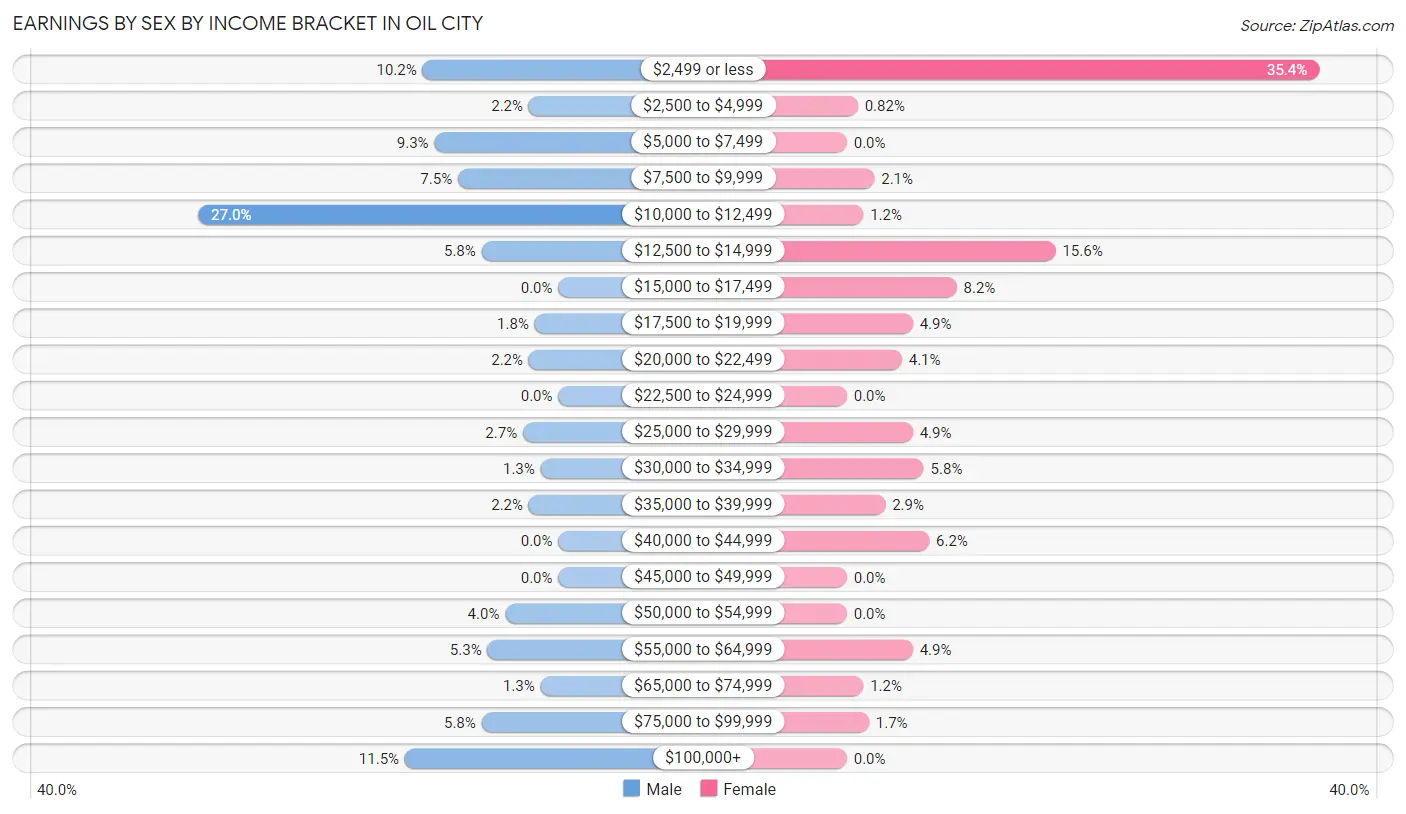
Earnings by Sex by Income Bracket in Oil City
The most common earnings brackets in Oil City are $10,000 to $12,499 for men (61 | 27.0%) and $2,499 or less for women (86 | 35.4%).
| Income | Male | Female |
| $2,499 or less | 23 (10.2%) | 86 (35.4%) |
| $2,500 to $4,999 | 5 (2.2%) | 2 (0.8%) |
| $5,000 to $7,499 | 21 (9.3%) | 0 (0.0%) |
| $7,500 to $9,999 | 17 (7.5%) | 5 (2.1%) |
| $10,000 to $12,499 | 61 (27.0%) | 3 (1.2%) |
| $12,500 to $14,999 | 13 (5.8%) | 38 (15.6%) |
| $15,000 to $17,499 | 0 (0.0%) | 20 (8.2%) |
| $17,500 to $19,999 | 4 (1.8%) | 12 (4.9%) |
| $20,000 to $22,499 | 5 (2.2%) | 10 (4.1%) |
| $22,500 to $24,999 | 0 (0.0%) | 0 (0.0%) |
| $25,000 to $29,999 | 6 (2.6%) | 12 (4.9%) |
| $30,000 to $34,999 | 3 (1.3%) | 14 (5.8%) |
| $35,000 to $39,999 | 5 (2.2%) | 7 (2.9%) |
| $40,000 to $44,999 | 0 (0.0%) | 15 (6.2%) |
| $45,000 to $49,999 | 0 (0.0%) | 0 (0.0%) |
| $50,000 to $54,999 | 9 (4.0%) | 0 (0.0%) |
| $55,000 to $64,999 | 12 (5.3%) | 12 (4.9%) |
| $65,000 to $74,999 | 3 (1.3%) | 3 (1.2%) |
| $75,000 to $99,999 | 13 (5.8%) | 4 (1.7%) |
| $100,000+ | 26 (11.5%) | 0 (0.0%) |
| Total | 226 (100.0%) | 243 (100.0%) |
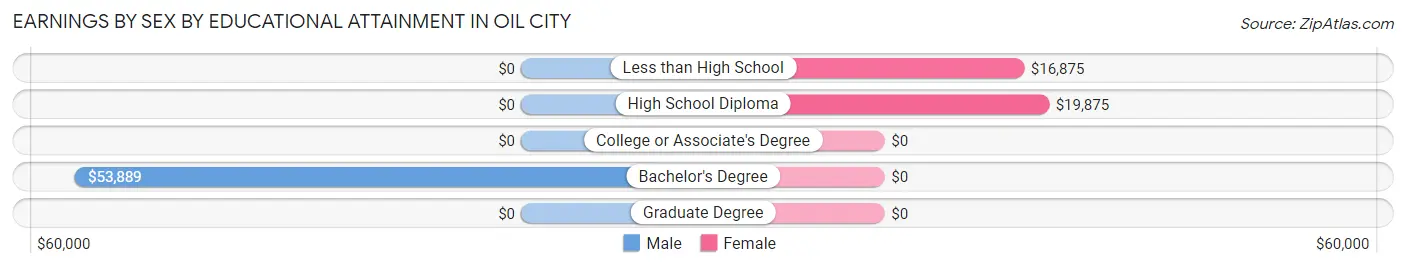
Earnings by Sex by Educational Attainment in Oil City
Average earnings in Oil City are $52,778 for men and $16,188 for women, a difference of 69.3%. Men with an educational attainment of bachelor's degree enjoy the highest average annual earnings of $53,889, while those with bachelor's degree education earn the least with $53,889. Women with an educational attainment of high school diploma earn the most with the average annual earnings of $19,875, while those with less than high school education have the smallest earnings of $16,875.
| Educational Attainment | Male Income | Female Income |
| Less than High School | - | - |
| High School Diploma | - | - |
| College or Associate's Degree | - | - |
| Bachelor's Degree | $53,889 | $0 |
| Graduate Degree | - | - |
| Total | $52,778 | $16,188 |
Family Income in Oil City
Family Income Brackets in Oil City
According to the Oil City family income data, there are 70 families falling into the $10,000 to $14,999 income range, which is the most common income bracket and makes up 29.3% of all families.
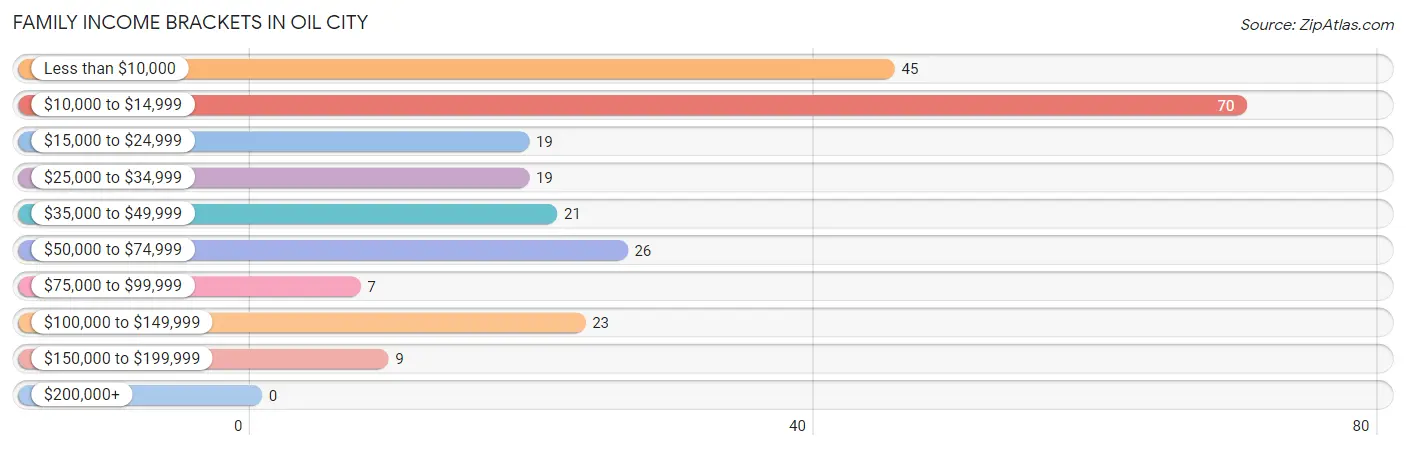
| Income Bracket | # Families | % Families |
| Less than $10,000 | 45 | 18.8% |
| $10,000 to $14,999 | 70 | 29.3% |
| $15,000 to $24,999 | 19 | 7.9% |
| $25,000 to $34,999 | 19 | 7.9% |
| $35,000 to $49,999 | 21 | 8.8% |
| $50,000 to $74,999 | 26 | 10.9% |
| $75,000 to $99,999 | 7 | 2.9% |
| $100,000 to $149,999 | 23 | 9.6% |
| $150,000 to $199,999 | 9 | 3.8% |
| $200,000+ | 0 | 0.0% |
Family Income by Famaliy Size in Oil City
3-person families (31 | 13.0%) account for the highest median family income in Oil City with $102,721 per family, while 3-person families (31 | 13.0%) have the highest median income of $34,240 per family member.
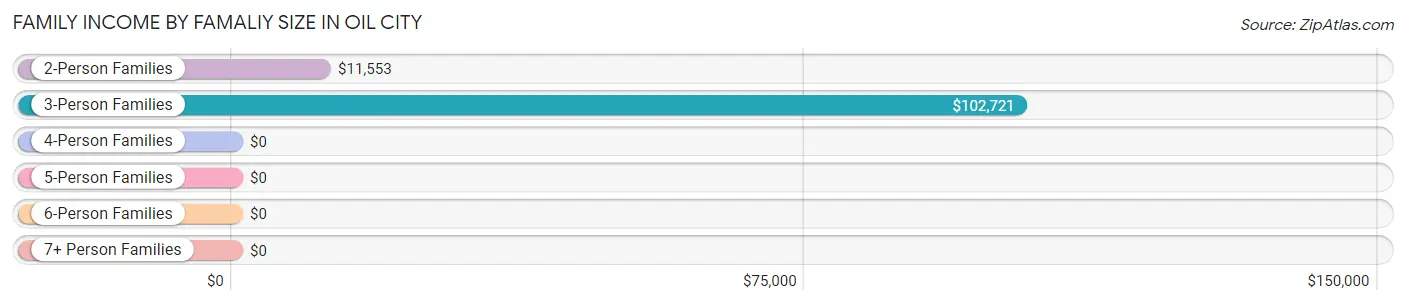
| Income Bracket | # Families | Median Income |
| 2-Person Families | 172 (72.0%) | $11,553 |
| 3-Person Families | 31 (13.0%) | $102,721 |
| 4-Person Families | 11 (4.6%) | $0 |
| 5-Person Families | 5 (2.1%) | $0 |
| 6-Person Families | 16 (6.7%) | $0 |
| 7+ Person Families | 4 (1.7%) | $0 |
| Total | 239 (100.0%) | $0 |
Family Income by Number of Earners in Oil City

| Number of Earners | # Families | Median Income |
| No Earners | 36 (15.1%) | $23,409 |
| 1 Earner | 161 (67.4%) | $0 |
| 2 Earners | 37 (15.5%) | $0 |
| 3+ Earners | 5 (2.1%) | $0 |
| Total | 239 (100.0%) | $0 |
Household Income in Oil City
Household Income Brackets in Oil City
With 142 households falling in the category, the $10,000 to $14,999 income range is the most frequent in Oil City, accounting for 27.4% of all households.
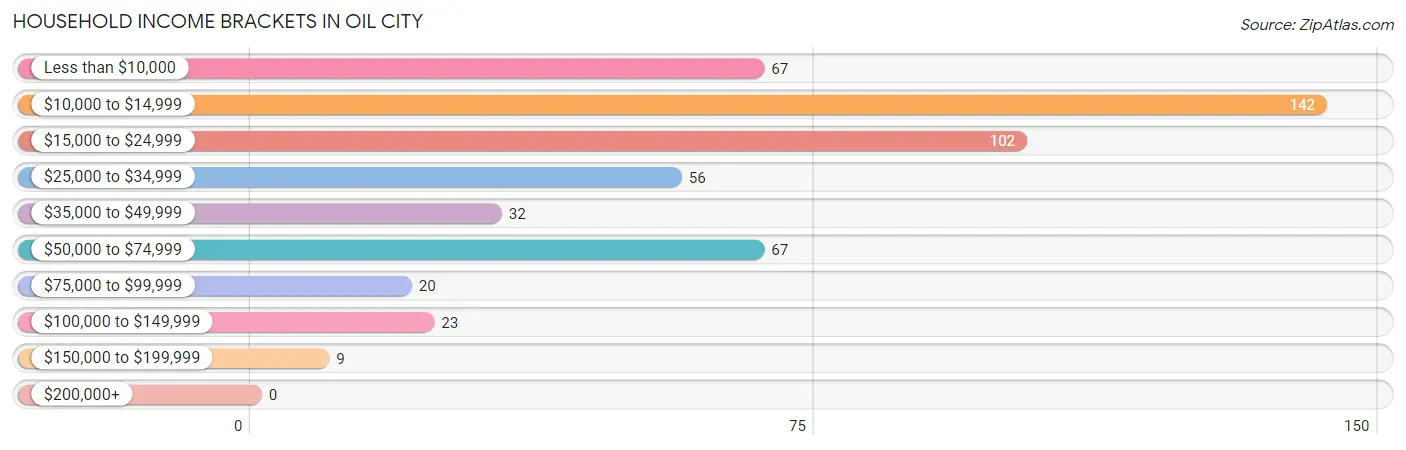
| Income Bracket | # Households | % Households |
| Less than $10,000 | 67 | 12.9% |
| $10,000 to $14,999 | 142 | 27.4% |
| $15,000 to $24,999 | 102 | 19.7% |
| $25,000 to $34,999 | 56 | 10.8% |
| $35,000 to $49,999 | 32 | 6.2% |
| $50,000 to $74,999 | 67 | 12.9% |
| $75,000 to $99,999 | 20 | 3.9% |
| $100,000 to $149,999 | 23 | 4.4% |
| $150,000 to $199,999 | 9 | 1.7% |
| $200,000+ | 0 | 0.0% |
Household Income by Householder Age in Oil City
The median household income in Oil City is $18,790, with the highest median household income of $25,357 found in the 25 to 44 years age bracket for the primary householder. A total of 128 households (24.7%) fall into this category. Meanwhile, the 15 to 24 years age bracket for the primary householder has the lowest median household income of $0, with 61 households (11.8%) in this group.
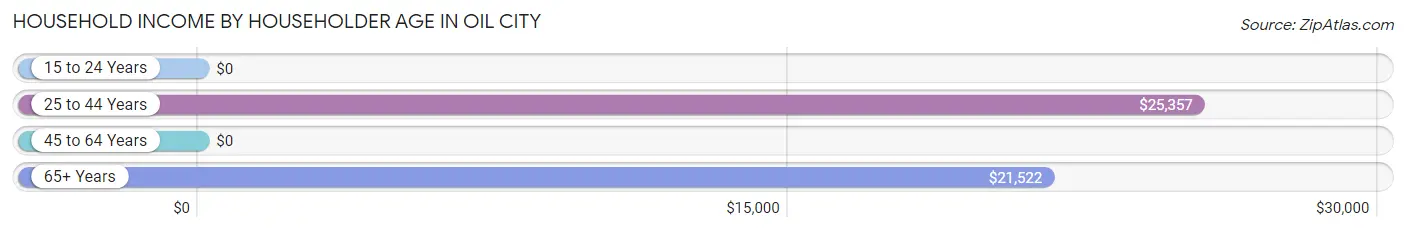
| Income Bracket | # Households | Median Income |
| 15 to 24 Years | 61 (11.8%) | $0 |
| 25 to 44 Years | 128 (24.7%) | $25,357 |
| 45 to 64 Years | 209 (40.4%) | $0 |
| 65+ Years | 120 (23.2%) | $21,522 |
| Total | 518 (100.0%) | $18,790 |
Poverty in Oil City
Income Below Poverty by Sex and Age in Oil City
With 50.9% poverty level for males and 48.3% for females among the residents of Oil City, 18 to 24 year old males and 5 year old females are the most vulnerable to poverty, with 90 males (92.8%) and 10 females (100.0%) in their respective age groups living below the poverty level.
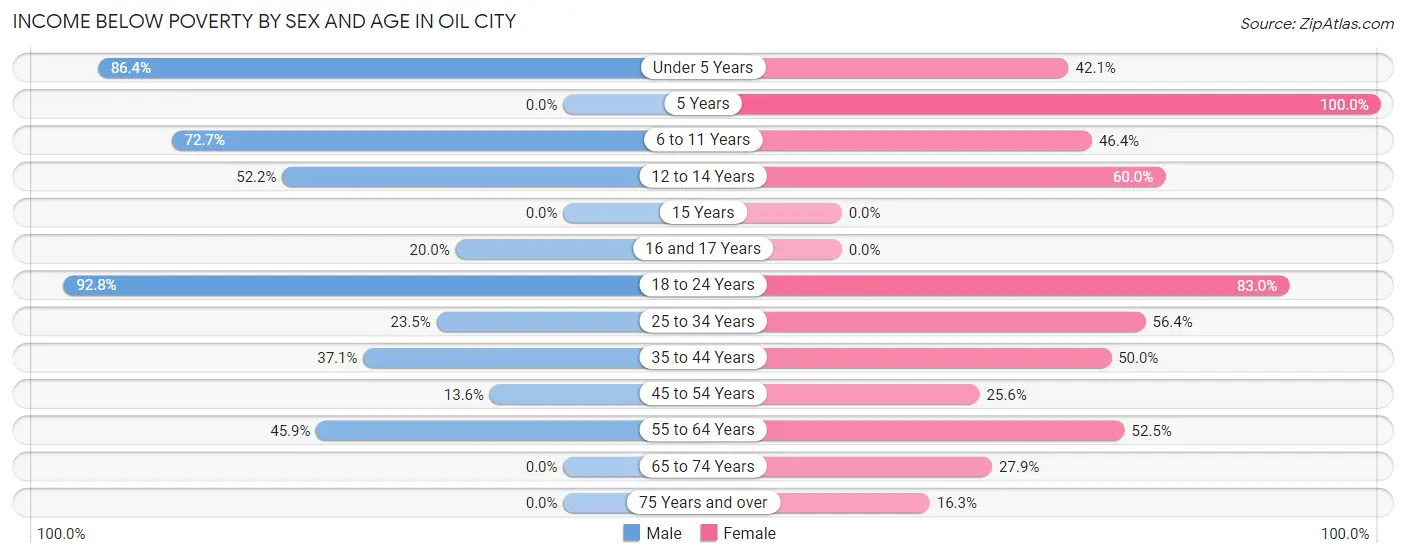
| Age Bracket | Male | Female |
| Under 5 Years | 70 (86.4%) | 8 (42.1%) |
| 5 Years | 0 (0.0%) | 10 (100.0%) |
| 6 to 11 Years | 8 (72.7%) | 26 (46.4%) |
| 12 to 14 Years | 12 (52.2%) | 21 (60.0%) |
| 15 Years | 0 (0.0%) | 0 (0.0%) |
| 16 and 17 Years | 5 (20.0%) | 0 (0.0%) |
| 18 to 24 Years | 90 (92.8%) | 44 (83.0%) |
| 25 to 34 Years | 12 (23.5%) | 53 (56.4%) |
| 35 to 44 Years | 13 (37.1%) | 9 (50.0%) |
| 45 to 54 Years | 3 (13.6%) | 11 (25.6%) |
| 55 to 64 Years | 61 (45.9%) | 63 (52.5%) |
| 65 to 74 Years | 0 (0.0%) | 12 (27.9%) |
| 75 Years and over | 0 (0.0%) | 8 (16.3%) |
| Total | 274 (50.9%) | 265 (48.3%) |
Income Above Poverty by Sex and Age in Oil City
According to the poverty statistics in Oil City, males aged 5 years and females aged 15 years are the age groups that are most secure financially, with 100.0% of males and 100.0% of females in these age groups living above the poverty line.
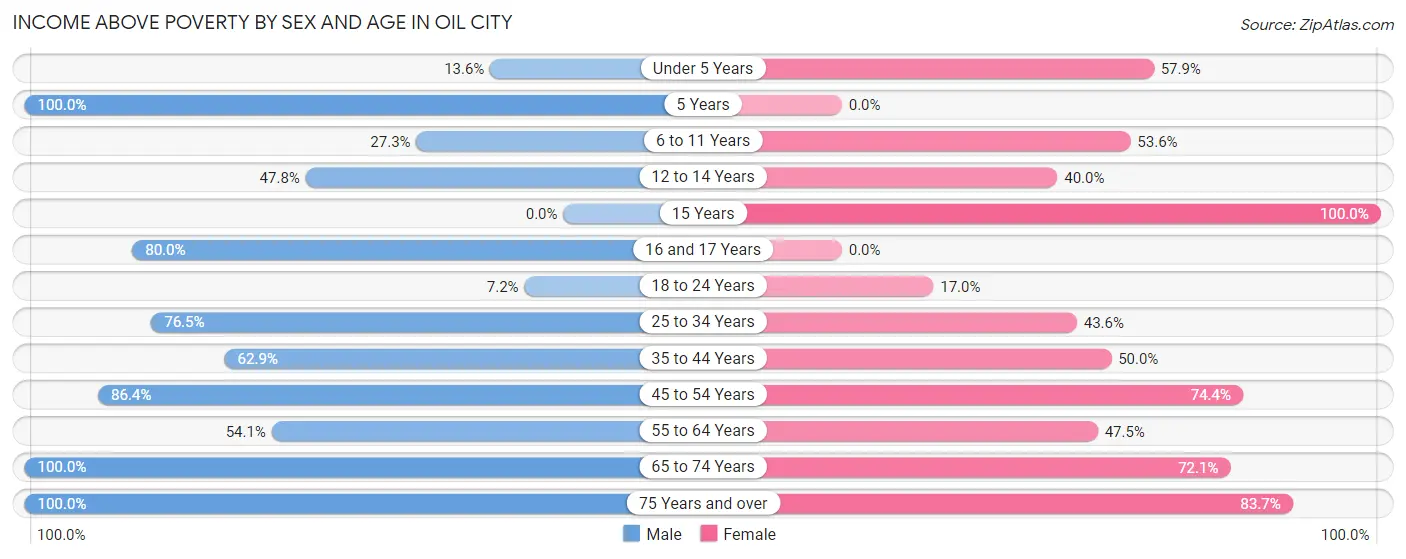
| Age Bracket | Male | Female |
| Under 5 Years | 11 (13.6%) | 11 (57.9%) |
| 5 Years | 8 (100.0%) | 0 (0.0%) |
| 6 to 11 Years | 3 (27.3%) | 30 (53.6%) |
| 12 to 14 Years | 11 (47.8%) | 14 (40.0%) |
| 15 Years | 0 (0.0%) | 9 (100.0%) |
| 16 and 17 Years | 20 (80.0%) | 0 (0.0%) |
| 18 to 24 Years | 7 (7.2%) | 9 (17.0%) |
| 25 to 34 Years | 39 (76.5%) | 41 (43.6%) |
| 35 to 44 Years | 22 (62.9%) | 9 (50.0%) |
| 45 to 54 Years | 19 (86.4%) | 32 (74.4%) |
| 55 to 64 Years | 72 (54.1%) | 57 (47.5%) |
| 65 to 74 Years | 27 (100.0%) | 31 (72.1%) |
| 75 Years and over | 25 (100.0%) | 41 (83.7%) |
| Total | 264 (49.1%) | 284 (51.7%) |
Income Below Poverty Among Married-Couple Families in Oil City
The poverty statistics for married-couple families in Oil City show that 14.5% or 11 of the total 76 families live below the poverty line. Families with 3 or 4 children have the highest poverty rate of 50.0%, comprising of 8 families. On the other hand, families with 1 or 2 children have the lowest poverty rate of 0.0%, which includes 0 families.
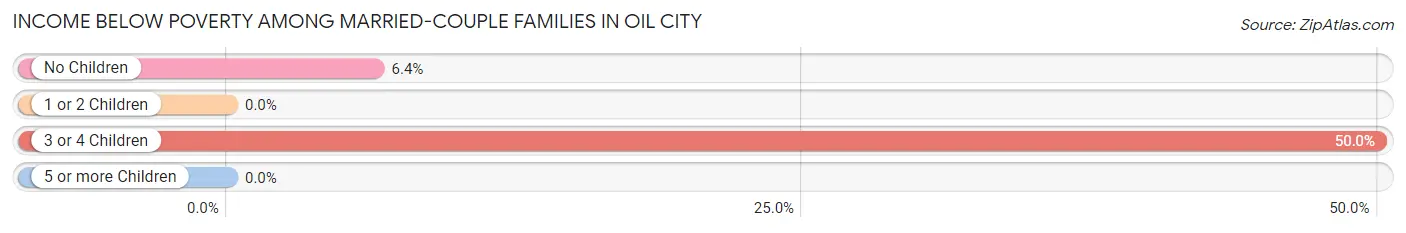
| Children | Above Poverty | Below Poverty |
| No Children | 44 (93.6%) | 3 (6.4%) |
| 1 or 2 Children | 9 (100.0%) | 0 (0.0%) |
| 3 or 4 Children | 8 (50.0%) | 8 (50.0%) |
| 5 or more Children | 4 (100.0%) | 0 (0.0%) |
| Total | 65 (85.5%) | 11 (14.5%) |
Income Below Poverty Among Single-Parent Households in Oil City
According to the poverty data in Oil City, 90.7% or 68 single-father households and 67.0% or 59 single-mother households are living below the poverty line. Among single-father households, those with 1 or 2 children have the highest poverty rate, with 65 households (95.6%) experiencing poverty. Likewise, among single-mother households, those with 1 or 2 children have the highest poverty rate, with 49 households (92.4%) falling below the poverty line.
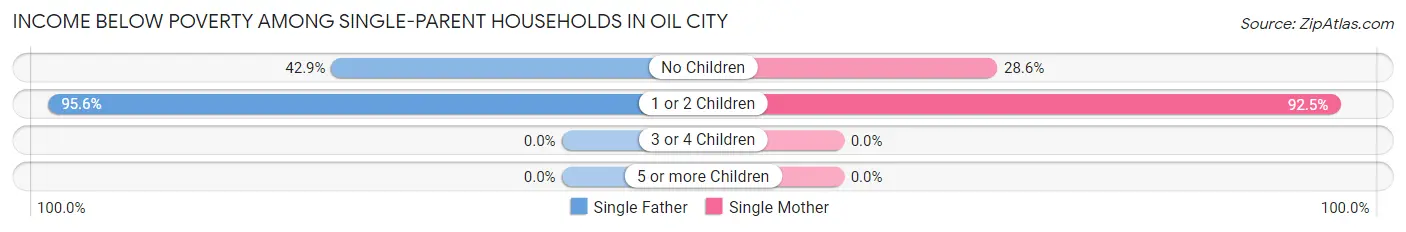
| Children | Single Father | Single Mother |
| No Children | 3 (42.9%) | 10 (28.6%) |
| 1 or 2 Children | 65 (95.6%) | 49 (92.4%) |
| 3 or 4 Children | 0 (0.0%) | 0 (0.0%) |
| 5 or more Children | 0 (0.0%) | 0 (0.0%) |
| Total | 68 (90.7%) | 59 (67.0%) |
Income Below Poverty Among Married-Couple vs Single-Parent Households in Oil City
The poverty data for Oil City shows that 11 of the married-couple family households (14.5%) and 127 of the single-parent households (77.9%) are living below the poverty level. Within the married-couple family households, those with 3 or 4 children have the highest poverty rate, with 8 households (50.0%) falling below the poverty line. Among the single-parent households, those with 1 or 2 children have the highest poverty rate, with 114 household (94.2%) living below poverty.
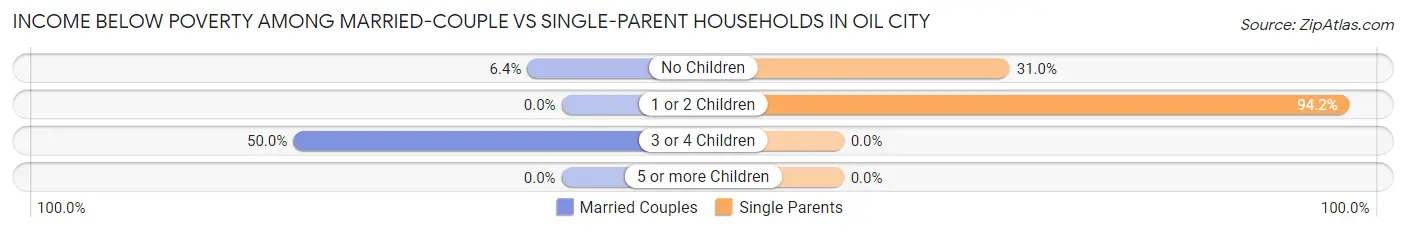
| Children | Married-Couple Families | Single-Parent Households |
| No Children | 3 (6.4%) | 13 (30.9%) |
| 1 or 2 Children | 0 (0.0%) | 114 (94.2%) |
| 3 or 4 Children | 8 (50.0%) | 0 (0.0%) |
| 5 or more Children | 0 (0.0%) | 0 (0.0%) |
| Total | 11 (14.5%) | 127 (77.9%) |
Race in Oil City
The most populous races in Oil City are Black / African American (511 | 46.8%), White / Caucasian (413 | 37.8%), and Two or more Races (159 | 14.5%).
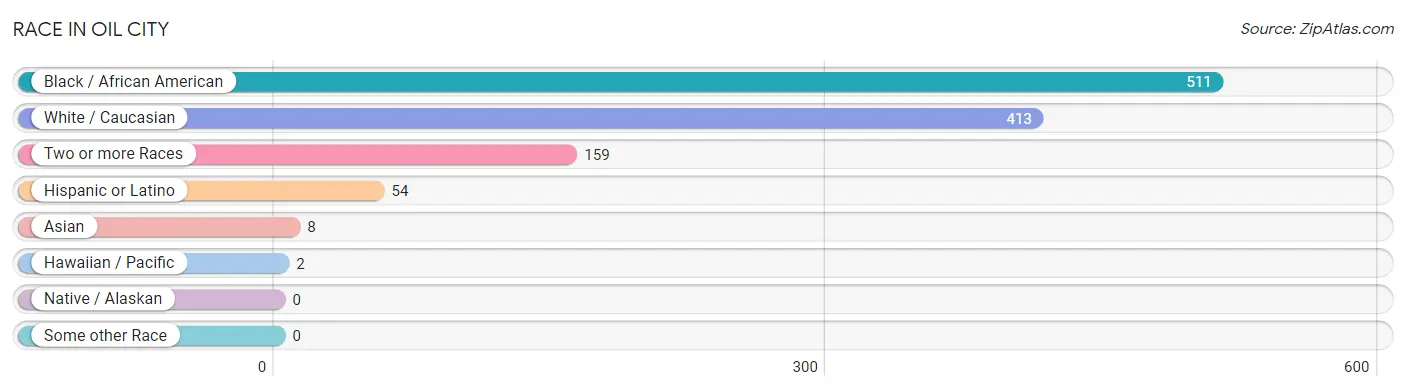
| Race | # Population | % Population |
| Asian | 8 | 0.7% |
| Black / African American | 511 | 46.8% |
| Hawaiian / Pacific | 2 | 0.2% |
| Hispanic or Latino | 54 | 4.9% |
| Native / Alaskan | 0 | 0.0% |
| White / Caucasian | 413 | 37.8% |
| Two or more Races | 159 | 14.5% |
| Some other Race | 0 | 0.0% |
| Total | 1,093 | 100.0% |
Ancestry in Oil City
The most populous ancestries reported in Oil City are American (73 | 6.7%), Central American (33 | 3.0%), Nicaraguan (33 | 3.0%), Nigerian (33 | 3.0%), and Subsaharan African (33 | 3.0%), together accounting for 18.8% of all Oil City residents.
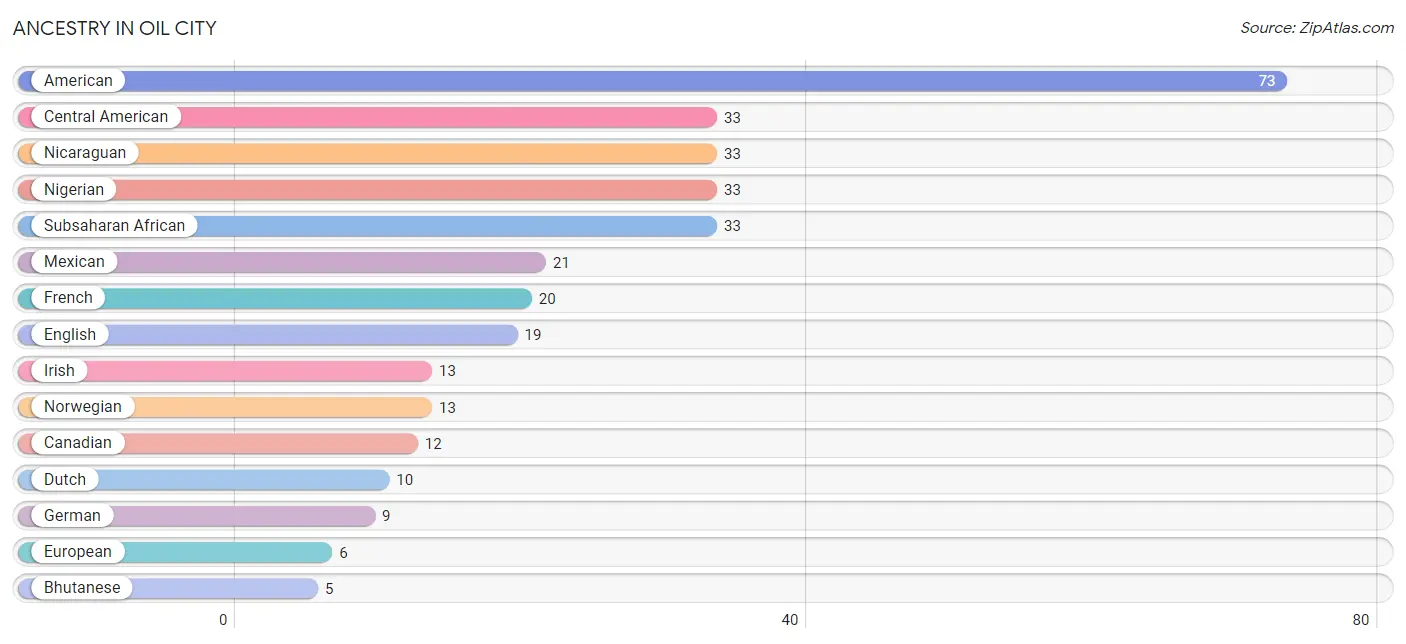
| Ancestry | # Population | % Population |
| American | 73 | 6.7% |
| Arab | 2 | 0.2% |
| Bhutanese | 5 | 0.5% |
| Canadian | 12 | 1.1% |
| Central American | 33 | 3.0% |
| Cherokee | 4 | 0.4% |
| Dutch | 10 | 0.9% |
| English | 19 | 1.7% |
| European | 6 | 0.5% |
| French | 20 | 1.8% |
| German | 9 | 0.8% |
| Irish | 13 | 1.2% |
| Italian | 3 | 0.3% |
| Mexican | 21 | 1.9% |
| Moroccan | 2 | 0.2% |
| Native Hawaiian | 2 | 0.2% |
| Nicaraguan | 33 | 3.0% |
| Nigerian | 33 | 3.0% |
| Norwegian | 13 | 1.2% |
| Scotch-Irish | 3 | 0.3% |
| Subsaharan African | 33 | 3.0% |
| Thai | 3 | 0.3% | View All 22 Rows |
Immigrants in Oil City
The most numerous immigrant groups reported in Oil City came from Canada (12 | 1.1%), Central America (11 | 1.0%), Latin America (11 | 1.0%), Mexico (6 | 0.5%), and Nicaragua (5 | 0.5%), together accounting for 4.1% of all Oil City residents.
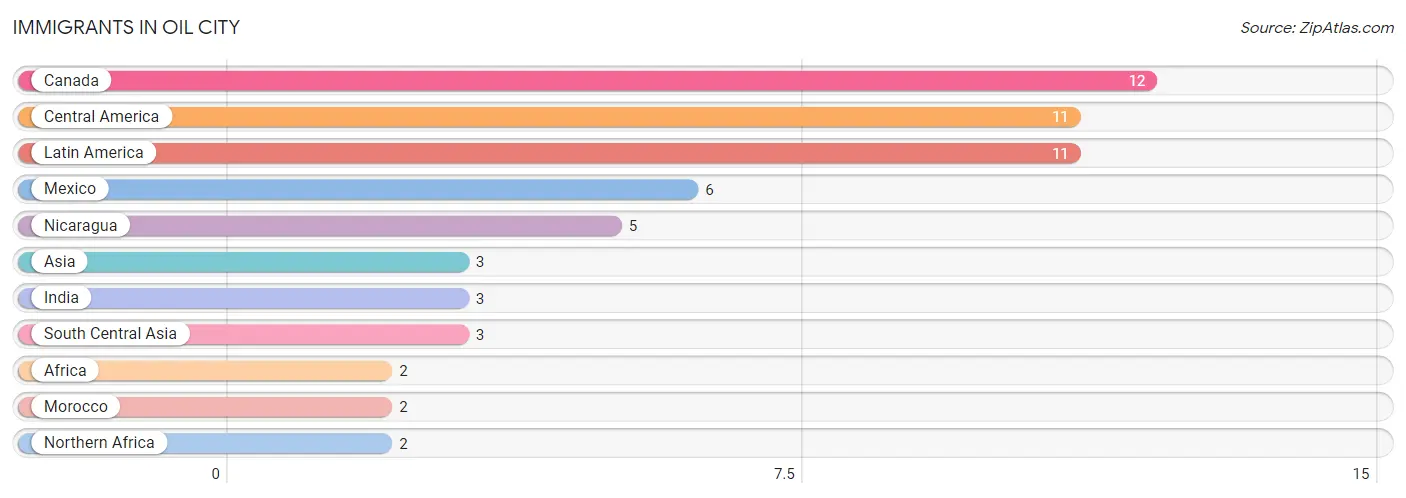
| Immigration Origin | # Population | % Population |
| Africa | 2 | 0.2% |
| Asia | 3 | 0.3% |
| Canada | 12 | 1.1% |
| Central America | 11 | 1.0% |
| India | 3 | 0.3% |
| Latin America | 11 | 1.0% |
| Mexico | 6 | 0.5% |
| Morocco | 2 | 0.2% |
| Nicaragua | 5 | 0.5% |
| Northern Africa | 2 | 0.2% |
| South Central Asia | 3 | 0.3% | View All 11 Rows |
Sex and Age in Oil City
Sex and Age in Oil City
The most populous age groups in Oil City are 20 to 24 Years (90 | 16.5%) for men and 25 to 29 Years (71 | 12.9%) for women.
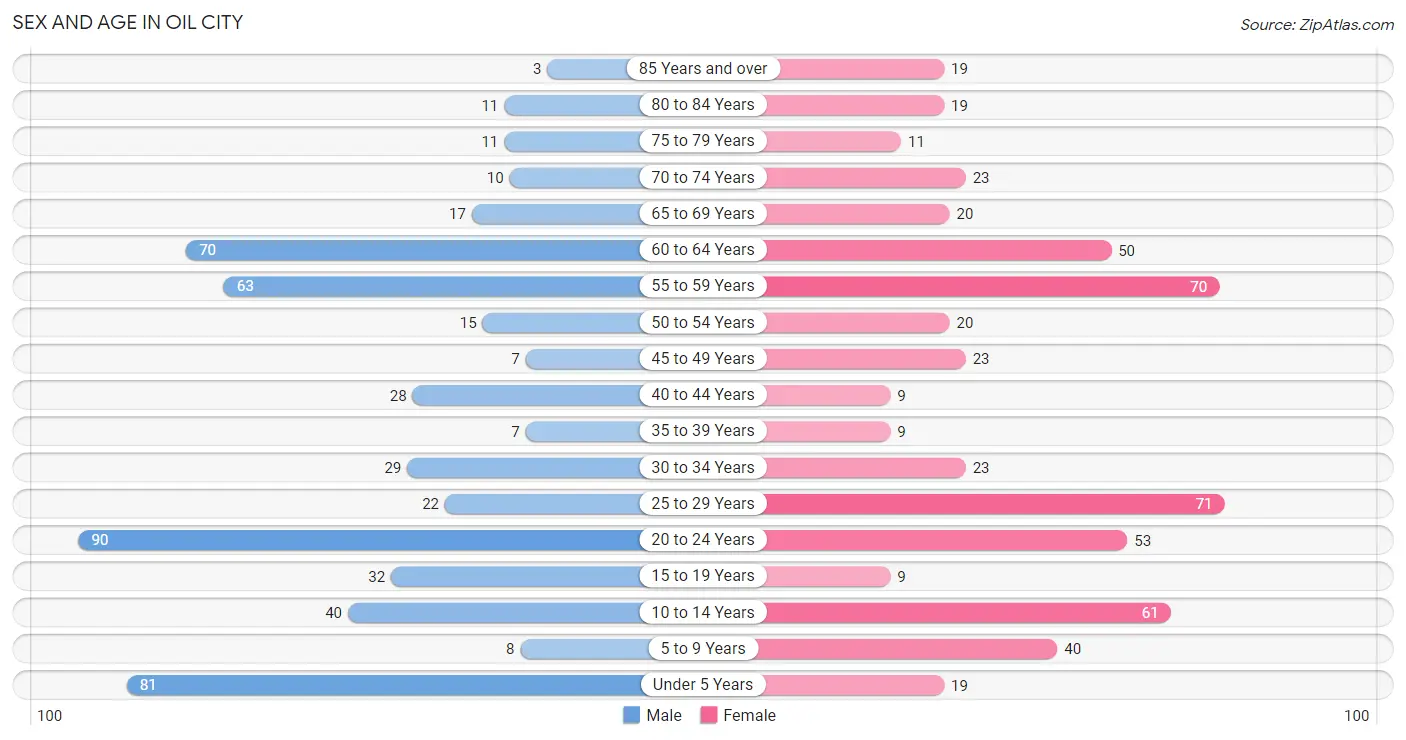
| Age Bracket | Male | Female |
| Under 5 Years | 81 (14.9%) | 19 (3.5%) |
| 5 to 9 Years | 8 (1.5%) | 40 (7.3%) |
| 10 to 14 Years | 40 (7.3%) | 61 (11.1%) |
| 15 to 19 Years | 32 (5.9%) | 9 (1.6%) |
| 20 to 24 Years | 90 (16.5%) | 53 (9.7%) |
| 25 to 29 Years | 22 (4.0%) | 71 (12.9%) |
| 30 to 34 Years | 29 (5.3%) | 23 (4.2%) |
| 35 to 39 Years | 7 (1.3%) | 9 (1.6%) |
| 40 to 44 Years | 28 (5.1%) | 9 (1.6%) |
| 45 to 49 Years | 7 (1.3%) | 23 (4.2%) |
| 50 to 54 Years | 15 (2.8%) | 20 (3.6%) |
| 55 to 59 Years | 63 (11.6%) | 70 (12.8%) |
| 60 to 64 Years | 70 (12.9%) | 50 (9.1%) |
| 65 to 69 Years | 17 (3.1%) | 20 (3.6%) |
| 70 to 74 Years | 10 (1.8%) | 23 (4.2%) |
| 75 to 79 Years | 11 (2.0%) | 11 (2.0%) |
| 80 to 84 Years | 11 (2.0%) | 19 (3.5%) |
| 85 Years and over | 3 (0.5%) | 19 (3.5%) |
| Total | 544 (100.0%) | 549 (100.0%) |
Families and Households in Oil City
Median Family Size in Oil City
The median family size in Oil City is 2.96 persons per family, with married-couple families (76 | 31.8%) accounting for the largest median family size of 4.32 persons per family. On the other hand, single male/father families (75 | 31.4%) represent the smallest median family size with 2.24 persons per family.
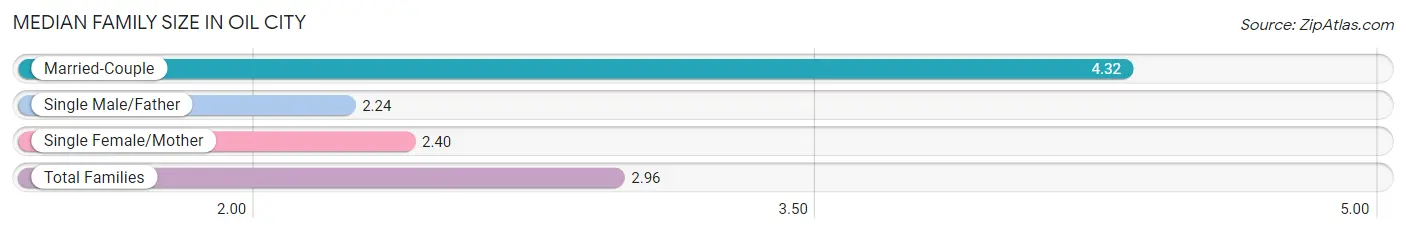
| Family Type | # Families | Family Size |
| Married-Couple | 76 (31.8%) | 4.32 |
| Single Male/Father | 75 (31.4%) | 2.24 |
| Single Female/Mother | 88 (36.8%) | 2.40 |
| Total Families | 239 (100.0%) | 2.96 |
Median Household Size in Oil City
The median household size in Oil City is 2.11 persons per household, with married-couple households (76 | 14.7%) accounting for the largest median household size of 4.46 persons per household. non-family households (279 | 53.9%) represent the smallest median household size with 1.18 persons per household.
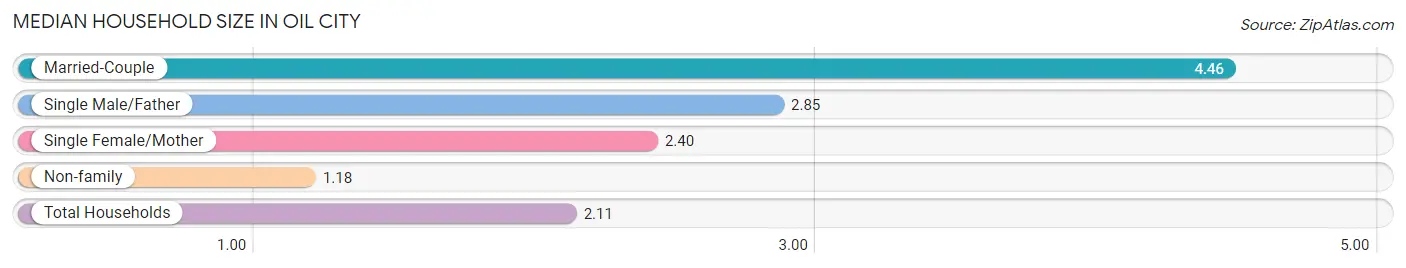
| Household Type | # Households | Household Size |
| Married-Couple | 76 (14.7%) | 4.46 |
| Single Male/Father | 75 (14.5%) | 2.85 |
| Single Female/Mother | 88 (17.0%) | 2.40 |
| Non-family | 279 (53.9%) | 1.18 |
| Total Households | 518 (100.0%) | 2.11 |
Household Size by Marriage Status in Oil City
Out of a total of 518 households in Oil City, 239 (46.1%) are family households, while 279 (53.9%) are nonfamily households. The most numerous type of family households are 2-person households, comprising 108, and the most common type of nonfamily households are 1-person households, comprising 246.
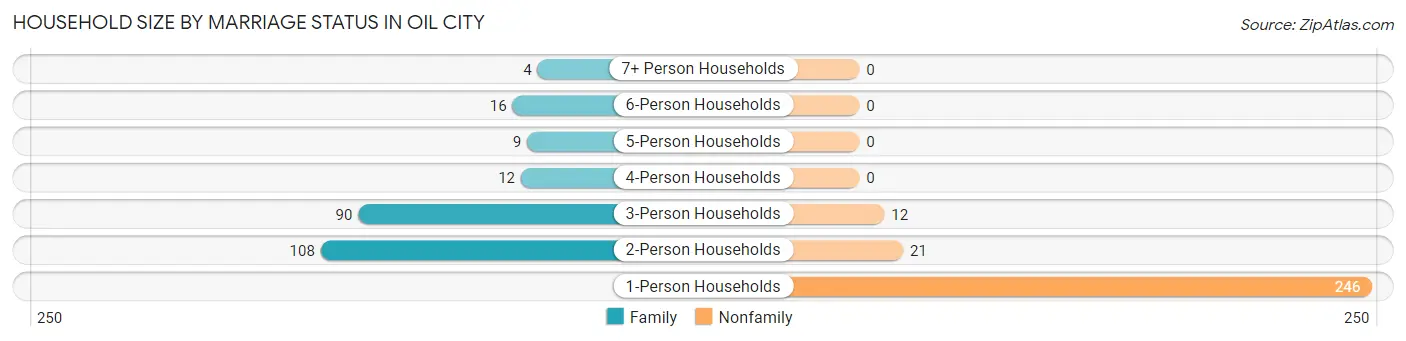
| Household Size | Family Households | Nonfamily Households |
| 1-Person Households | - | 246 (47.5%) |
| 2-Person Households | 108 (20.8%) | 21 (4.1%) |
| 3-Person Households | 90 (17.4%) | 12 (2.3%) |
| 4-Person Households | 12 (2.3%) | 0 (0.0%) |
| 5-Person Households | 9 (1.7%) | 0 (0.0%) |
| 6-Person Households | 16 (3.1%) | 0 (0.0%) |
| 7+ Person Households | 4 (0.8%) | 0 (0.0%) |
| Total | 239 (46.1%) | 279 (53.9%) |
Female Fertility in Oil City
Fertility by Age in Oil City
Average fertility rate in Oil City is 243.0 births per 1,000 women. Women in the age bracket of 15 to 19 years have the highest fertility rate with 556.0 births per 1,000 women. Women in the age bracket of 20 to 34 years acount for 89.8% of all women with births.
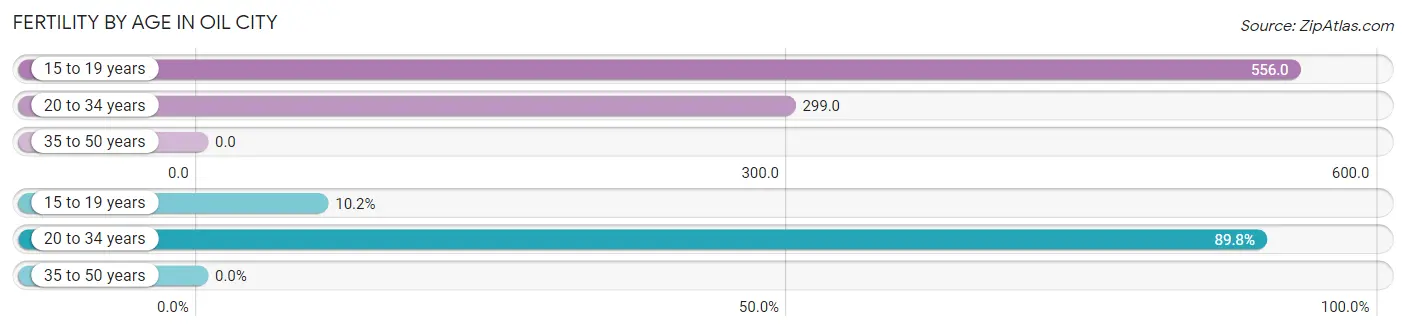
| Age Bracket | Women with Births | Births / 1,000 Women |
| 15 to 19 years | 5 (10.2%) | 556.0 |
| 20 to 34 years | 44 (89.8%) | 299.0 |
| 35 to 50 years | 0 (0.0%) | 0.0 |
| Total | 49 (100.0%) | 243.0 |
Fertility by Age by Marriage Status in Oil City
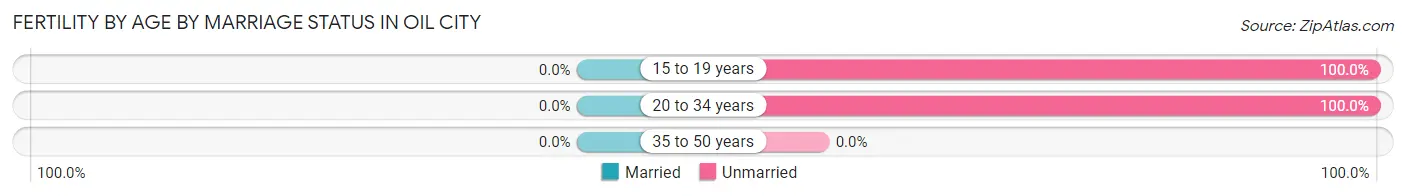
| Age Bracket | Married | Unmarried |
| 15 to 19 years | 0 (0.0%) | 5 (100.0%) |
| 20 to 34 years | 0 (0.0%) | 44 (100.0%) |
| 35 to 50 years | 0 (0.0%) | 0 (0.0%) |
| Total | 0 (0.0%) | 49 (100.0%) |
Fertility by Education in Oil City
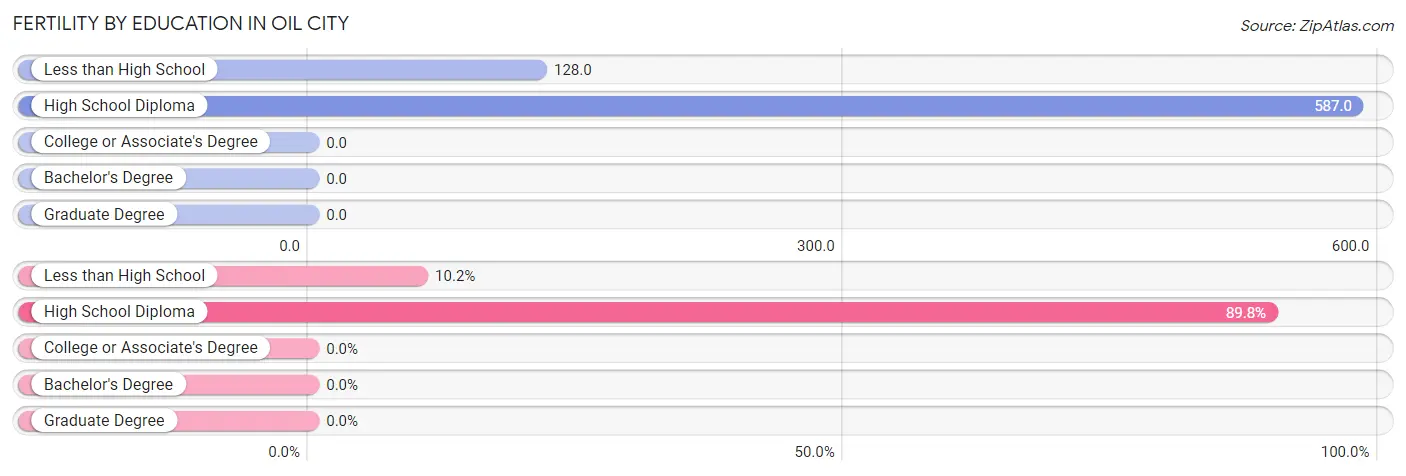
| Educational Attainment | Women with Births | Births / 1,000 Women |
| Less than High School | 5 (10.2%) | 128.0 |
| High School Diploma | 44 (89.8%) | 587.0 |
| College or Associate's Degree | 0 (0.0%) | 0.0 |
| Bachelor's Degree | 0 (0.0%) | 0.0 |
| Graduate Degree | 0 (0.0%) | 0.0 |
| Total | 49 (100.0%) | 243.0 |
Fertility by Education by Marriage Status in Oil City
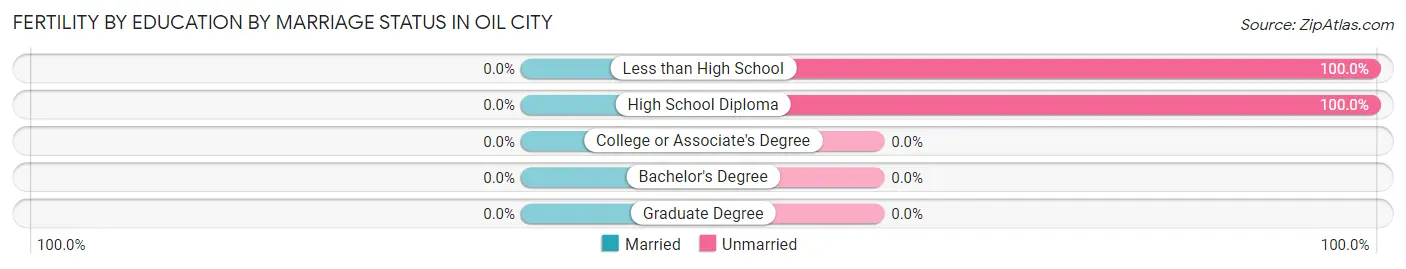
| Educational Attainment | Married | Unmarried |
| Less than High School | 0 (0.0%) | 5 (100.0%) |
| High School Diploma | 0 (0.0%) | 44 (100.0%) |
| College or Associate's Degree | 0 (0.0%) | 0 (0.0%) |
| Bachelor's Degree | 0 (0.0%) | 0 (0.0%) |
| Graduate Degree | 0 (0.0%) | 0 (0.0%) |
| Total | 0 (0.0%) | 49 (100.0%) |
Employment Characteristics in Oil City
Employment by Class of Employer in Oil City
Among the 367 employed individuals in Oil City, private company employees (270 | 73.6%), self-employed (not incorporated) (58 | 15.8%), and not-for-profit organizations (21 | 5.7%) make up the most common classes of employment.
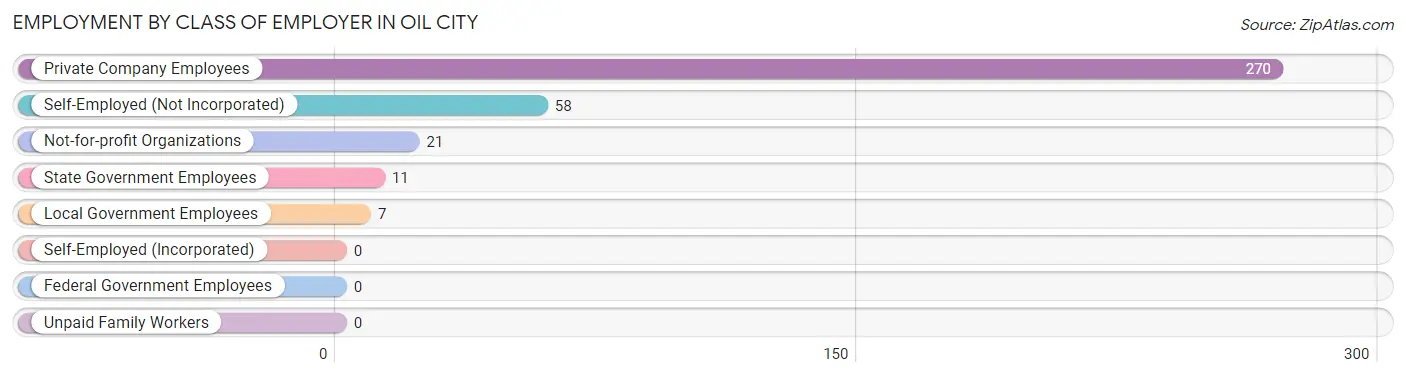
| Employer Class | # Employees | % Employees |
| Private Company Employees | 270 | 73.6% |
| Self-Employed (Incorporated) | 0 | 0.0% |
| Self-Employed (Not Incorporated) | 58 | 15.8% |
| Not-for-profit Organizations | 21 | 5.7% |
| Local Government Employees | 7 | 1.9% |
| State Government Employees | 11 | 3.0% |
| Federal Government Employees | 0 | 0.0% |
| Unpaid Family Workers | 0 | 0.0% |
| Total | 367 | 100.0% |
Employment Status by Age in Oil City
According to the labor force statistics for Oil City, out of the total population over 16 years of age (835), 55.0% or 459 individuals are in the labor force, with 12.9% or 59 of them unemployed. The age group with the highest labor force participation rate is 30 to 34 years, with 92.3% or 48 individuals in the labor force. Within the labor force, the 20 to 24 years age range has the highest percentage of unemployed individuals, with 39.8% or 49 of them being unemployed.
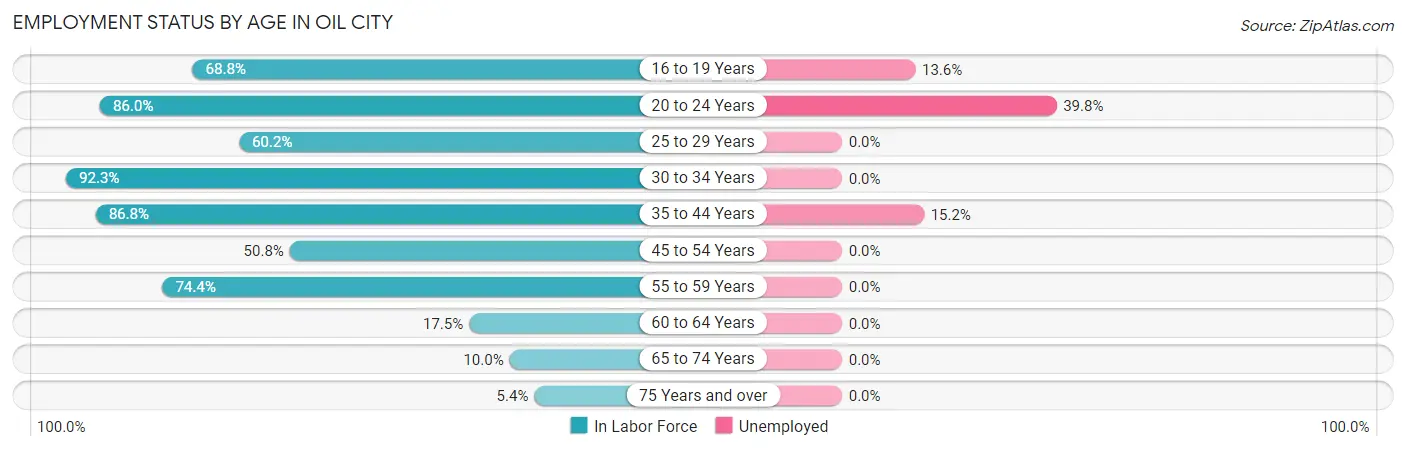
| Age Bracket | In Labor Force | Unemployed |
| 16 to 19 Years | 22 (68.8%) | 3 (13.6%) |
| 20 to 24 Years | 123 (86.0%) | 49 (39.8%) |
| 25 to 29 Years | 56 (60.2%) | 0 (0.0%) |
| 30 to 34 Years | 48 (92.3%) | 0 (0.0%) |
| 35 to 44 Years | 46 (86.8%) | 7 (15.2%) |
| 45 to 54 Years | 33 (50.8%) | 0 (0.0%) |
| 55 to 59 Years | 99 (74.4%) | 0 (0.0%) |
| 60 to 64 Years | 21 (17.5%) | 0 (0.0%) |
| 65 to 74 Years | 7 (10.0%) | 0 (0.0%) |
| 75 Years and over | 4 (5.4%) | 0 (0.0%) |
| Total | 459 (55.0%) | 59 (12.9%) |
Employment Status by Educational Attainment in Oil City
According to labor force statistics for Oil City, 58.7% of individuals (303) out of the total population between 25 and 64 years of age (516) are in the labor force, with 2.3% or 7 of them being unemployed. The group with the highest labor force participation rate are those with the educational attainment of less than high school, with 62.2% or 46 individuals in the labor force. Within the labor force, individuals with high school diploma education have the highest percentage of unemployment, with 7.8% or 7 of them being unemployed.
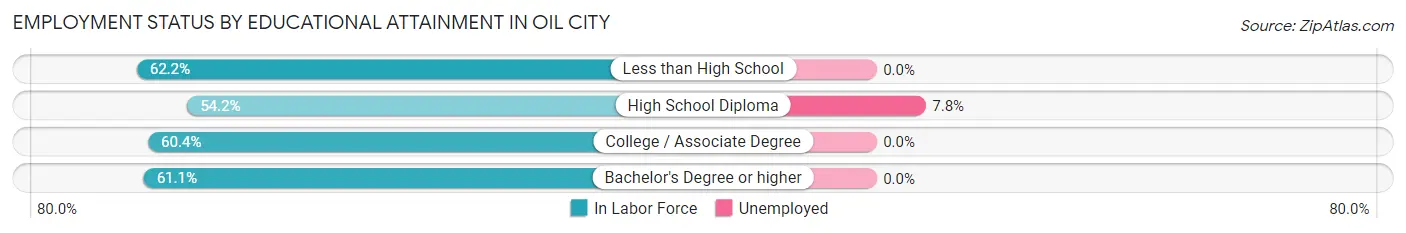
| Educational Attainment | In Labor Force | Unemployed |
| Less than High School | 46 (62.2%) | 0 (0.0%) |
| High School Diploma | 90 (54.2%) | 13 (7.8%) |
| College / Associate Degree | 145 (60.4%) | 0 (0.0%) |
| Bachelor's Degree or higher | 22 (61.1%) | 0 (0.0%) |
| Total | 303 (58.7%) | 12 (2.3%) |
Employment Occupations by Sex in Oil City
Management, Business, Science and Arts Occupations
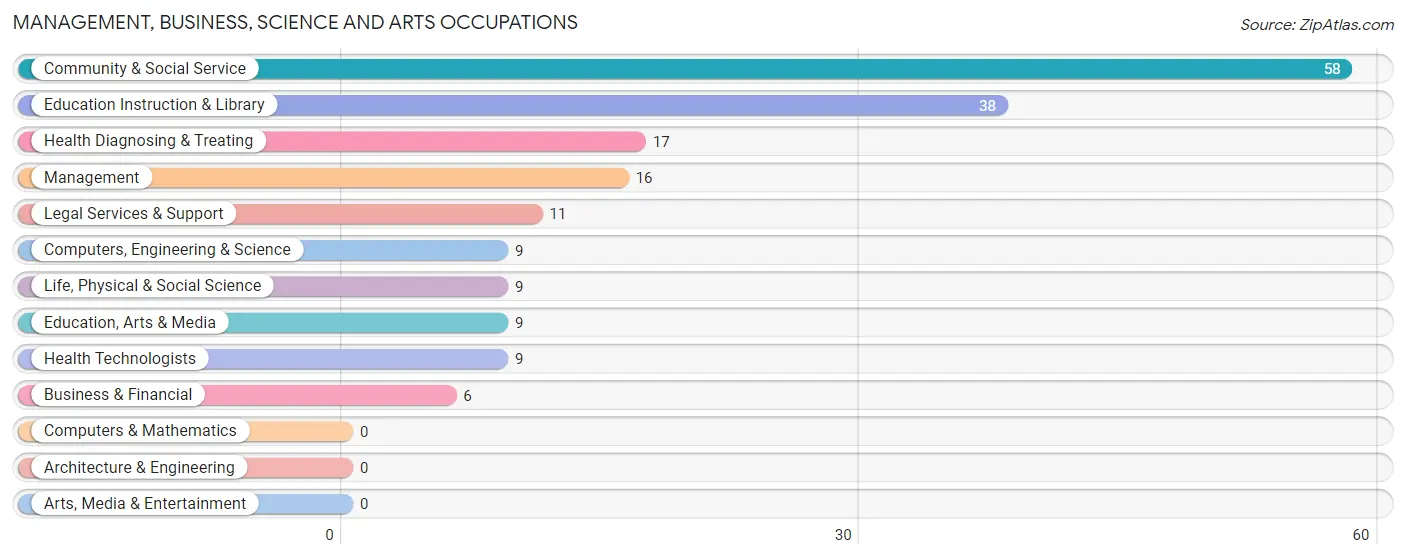
The most common Management, Business, Science and Arts occupations in Oil City are Community & Social Service (58 | 14.5%), Education Instruction & Library (38 | 9.5%), Health Diagnosing & Treating (17 | 4.3%), Management (16 | 4.0%), and Legal Services & Support (11 | 2.8%).
Management, Business, Science and Arts Occupations by Sex
Within the Management, Business, Science and Arts occupations in Oil City, the most male-oriented occupations are Computers, Engineering & Science (100.0%), Life, Physical & Social Science (100.0%), and Health Technologists (55.6%), while the most female-oriented occupations are Business & Financial (100.0%), Legal Services & Support (100.0%), and Education Instruction & Library (100.0%).
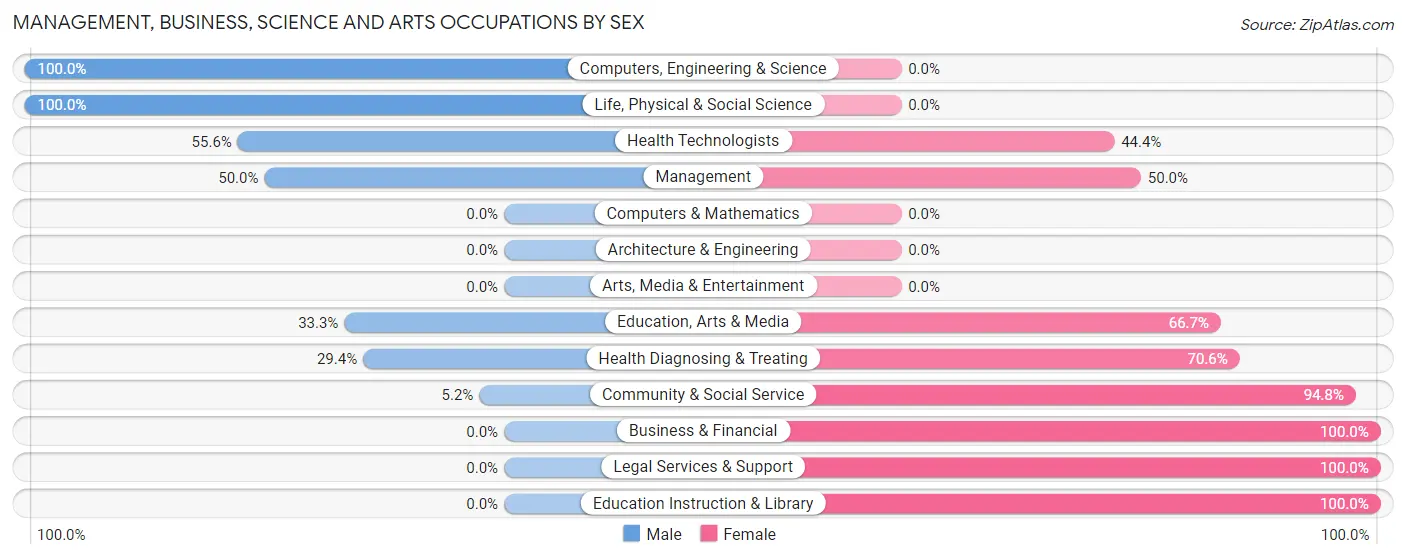
| Occupation | Male | Female |
| Management | 8 (50.0%) | 8 (50.0%) |
| Business & Financial | 0 (0.0%) | 6 (100.0%) |
| Computers, Engineering & Science | 9 (100.0%) | 0 (0.0%) |
| Computers & Mathematics | 0 (0.0%) | 0 (0.0%) |
| Architecture & Engineering | 0 (0.0%) | 0 (0.0%) |
| Life, Physical & Social Science | 9 (100.0%) | 0 (0.0%) |
| Community & Social Service | 3 (5.2%) | 55 (94.8%) |
| Education, Arts & Media | 3 (33.3%) | 6 (66.7%) |
| Legal Services & Support | 0 (0.0%) | 11 (100.0%) |
| Education Instruction & Library | 0 (0.0%) | 38 (100.0%) |
| Arts, Media & Entertainment | 0 (0.0%) | 0 (0.0%) |
| Health Diagnosing & Treating | 5 (29.4%) | 12 (70.6%) |
| Health Technologists | 5 (55.6%) | 4 (44.4%) |
| Total (Category) | 25 (23.6%) | 81 (76.4%) |
| Total (Overall) | 215 (53.7%) | 185 (46.3%) |
Services Occupations
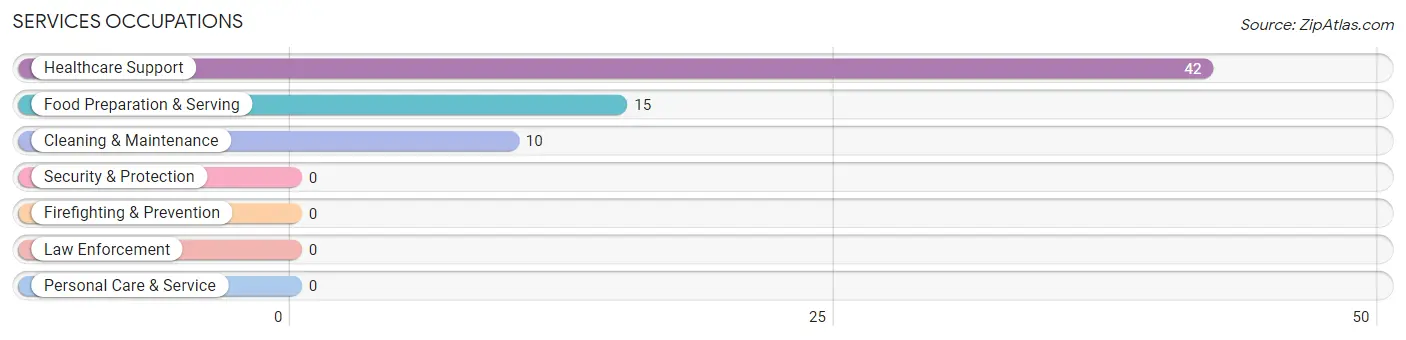
The most common Services occupations in Oil City are Healthcare Support (42 | 10.5%), Food Preparation & Serving (15 | 3.7%), and Cleaning & Maintenance (10 | 2.5%).
Services Occupations by Sex
Within the Services occupations in Oil City, the most male-oriented occupations are Food Preparation & Serving (100.0%), and Cleaning & Maintenance (80.0%), while the most female-oriented occupations are Healthcare Support (100.0%), and Cleaning & Maintenance (20.0%).
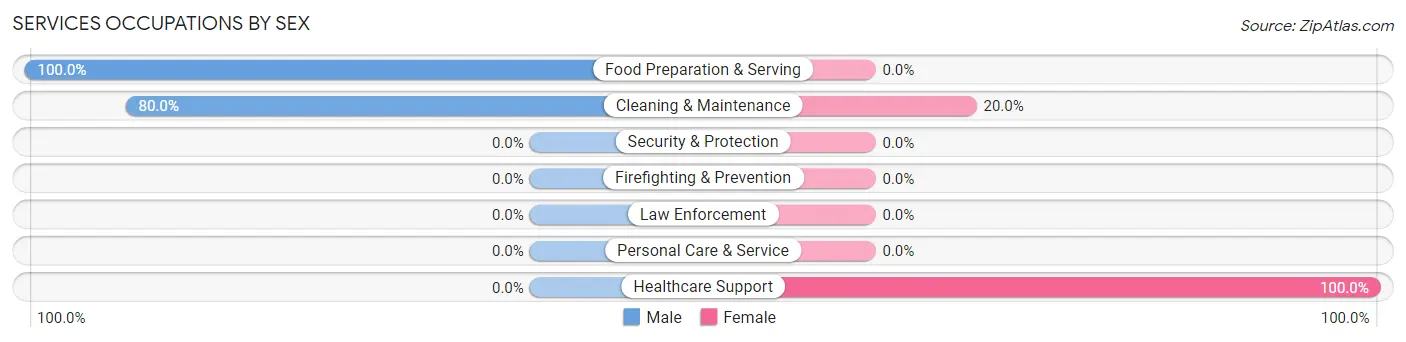
| Occupation | Male | Female |
| Healthcare Support | 0 (0.0%) | 42 (100.0%) |
| Security & Protection | 0 (0.0%) | 0 (0.0%) |
| Firefighting & Prevention | 0 (0.0%) | 0 (0.0%) |
| Law Enforcement | 0 (0.0%) | 0 (0.0%) |
| Food Preparation & Serving | 15 (100.0%) | 0 (0.0%) |
| Cleaning & Maintenance | 8 (80.0%) | 2 (20.0%) |
| Personal Care & Service | 0 (0.0%) | 0 (0.0%) |
| Total (Category) | 23 (34.3%) | 44 (65.7%) |
| Total (Overall) | 215 (53.7%) | 185 (46.3%) |
Sales and Office Occupations
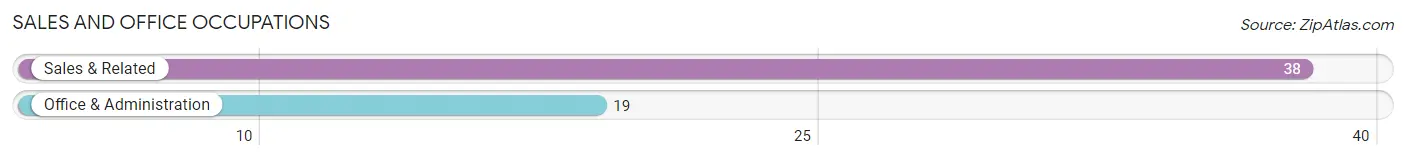
The most common Sales and Office occupations in Oil City are Sales & Related (38 | 9.5%), and Office & Administration (19 | 4.8%).
Sales and Office Occupations by Sex
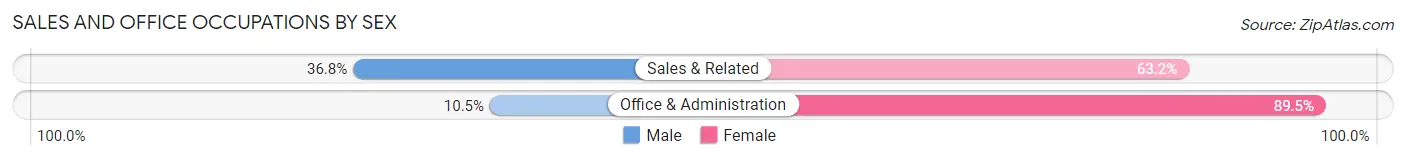
| Occupation | Male | Female |
| Sales & Related | 14 (36.8%) | 24 (63.2%) |
| Office & Administration | 2 (10.5%) | 17 (89.5%) |
| Total (Category) | 16 (28.1%) | 41 (71.9%) |
| Total (Overall) | 215 (53.7%) | 185 (46.3%) |
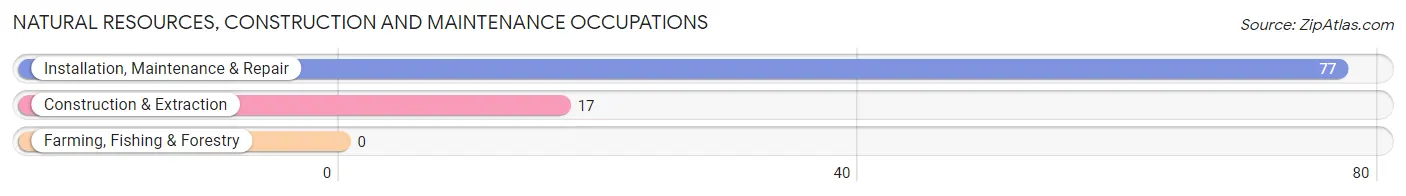
Natural Resources, Construction and Maintenance Occupations
The most common Natural Resources, Construction and Maintenance occupations in Oil City are Installation, Maintenance & Repair (77 | 19.3%), and Construction & Extraction (17 | 4.3%).
Natural Resources, Construction and Maintenance Occupations by Sex
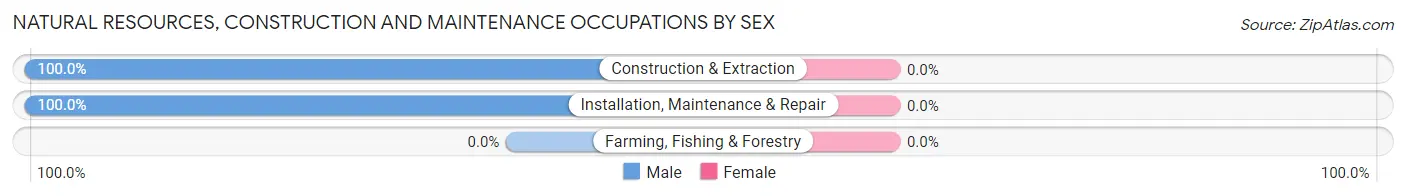
| Occupation | Male | Female |
| Farming, Fishing & Forestry | 0 (0.0%) | 0 (0.0%) |
| Construction & Extraction | 17 (100.0%) | 0 (0.0%) |
| Installation, Maintenance & Repair | 77 (100.0%) | 0 (0.0%) |
| Total (Category) | 94 (100.0%) | 0 (0.0%) |
| Total (Overall) | 215 (53.7%) | 185 (46.3%) |
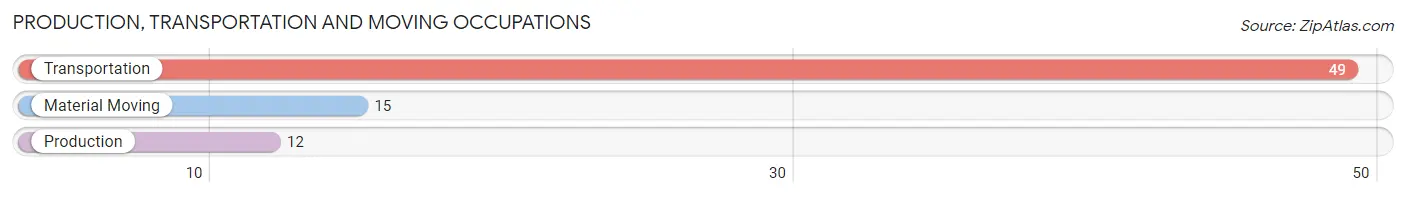
Production, Transportation and Moving Occupations
The most common Production, Transportation and Moving occupations in Oil City are Transportation (49 | 12.2%), Material Moving (15 | 3.7%), and Production (12 | 3.0%).
Production, Transportation and Moving Occupations by Sex
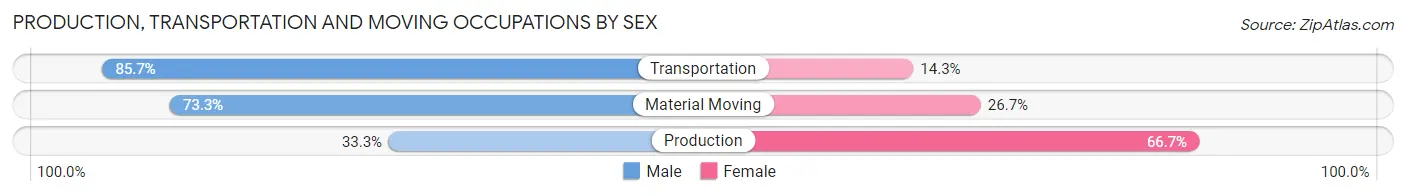
| Occupation | Male | Female |
| Production | 4 (33.3%) | 8 (66.7%) |
| Transportation | 42 (85.7%) | 7 (14.3%) |
| Material Moving | 11 (73.3%) | 4 (26.7%) |
| Total (Category) | 57 (75.0%) | 19 (25.0%) |
| Total (Overall) | 215 (53.7%) | 185 (46.3%) |
Employment Industries by Sex in Oil City
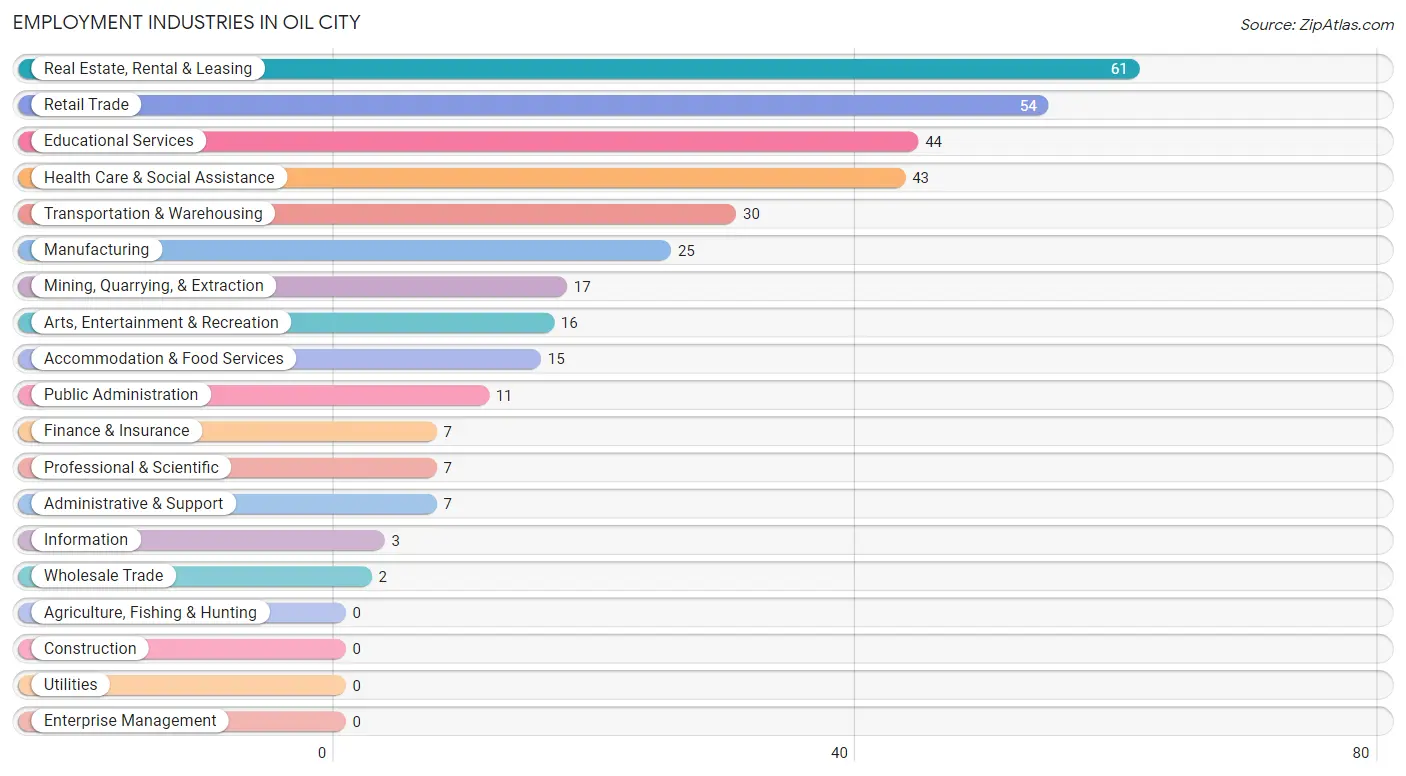
Employment Industries in Oil City
The major employment industries in Oil City include Real Estate, Rental & Leasing (61 | 15.2%), Retail Trade (54 | 13.5%), Educational Services (44 | 11.0%), Health Care & Social Assistance (43 | 10.7%), and Transportation & Warehousing (30 | 7.5%).
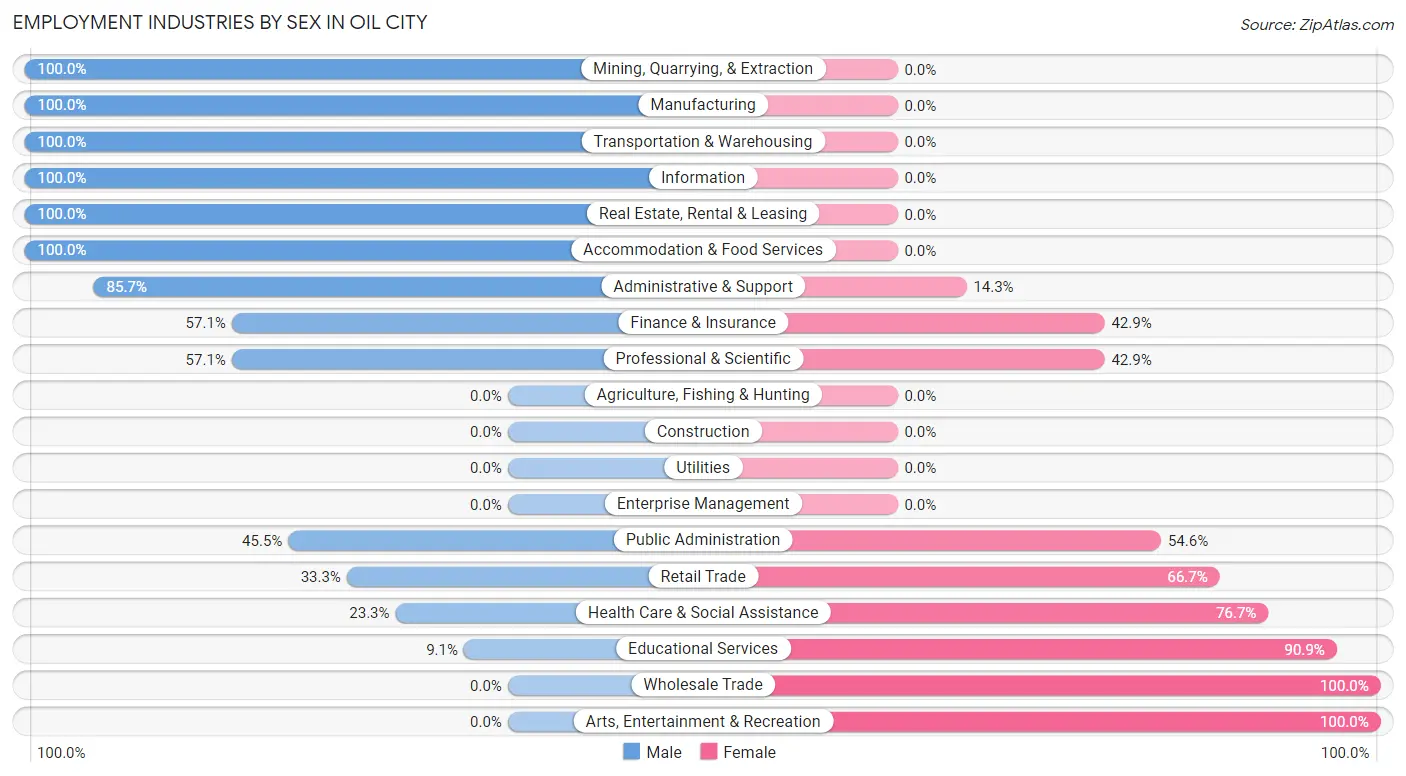
Employment Industries by Sex in Oil City
The Oil City industries that see more men than women are Mining, Quarrying, & Extraction (100.0%), Manufacturing (100.0%), and Transportation & Warehousing (100.0%), whereas the industries that tend to have a higher number of women are Wholesale Trade (100.0%), Arts, Entertainment & Recreation (100.0%), and Educational Services (90.9%).
| Industry | Male | Female |
| Agriculture, Fishing & Hunting | 0 (0.0%) | 0 (0.0%) |
| Mining, Quarrying, & Extraction | 17 (100.0%) | 0 (0.0%) |
| Construction | 0 (0.0%) | 0 (0.0%) |
| Manufacturing | 25 (100.0%) | 0 (0.0%) |
| Wholesale Trade | 0 (0.0%) | 2 (100.0%) |
| Retail Trade | 18 (33.3%) | 36 (66.7%) |
| Transportation & Warehousing | 30 (100.0%) | 0 (0.0%) |
| Utilities | 0 (0.0%) | 0 (0.0%) |
| Information | 3 (100.0%) | 0 (0.0%) |
| Finance & Insurance | 4 (57.1%) | 3 (42.9%) |
| Real Estate, Rental & Leasing | 61 (100.0%) | 0 (0.0%) |
| Professional & Scientific | 4 (57.1%) | 3 (42.9%) |
| Enterprise Management | 0 (0.0%) | 0 (0.0%) |
| Administrative & Support | 6 (85.7%) | 1 (14.3%) |
| Educational Services | 4 (9.1%) | 40 (90.9%) |
| Health Care & Social Assistance | 10 (23.3%) | 33 (76.7%) |
| Arts, Entertainment & Recreation | 0 (0.0%) | 16 (100.0%) |
| Accommodation & Food Services | 15 (100.0%) | 0 (0.0%) |
| Public Administration | 5 (45.5%) | 6 (54.5%) |
| Total | 215 (53.7%) | 185 (46.3%) |
Education in Oil City
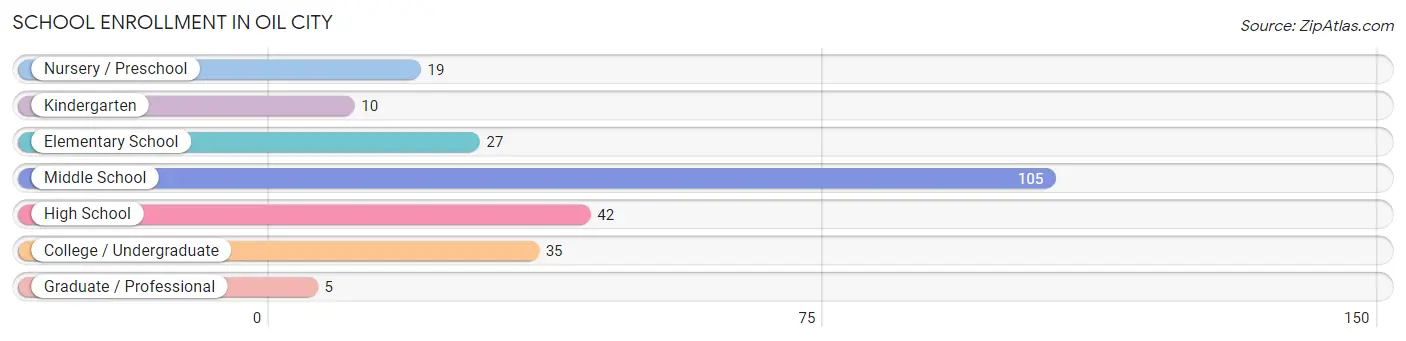
School Enrollment in Oil City
The most common levels of schooling among the 243 students in Oil City are middle school (105 | 43.2%), high school (42 | 17.3%), and college / undergraduate (35 | 14.4%).
| School Level | # Students | % Students |
| Nursery / Preschool | 19 | 7.8% |
| Kindergarten | 10 | 4.1% |
| Elementary School | 27 | 11.1% |
| Middle School | 105 | 43.2% |
| High School | 42 | 17.3% |
| College / Undergraduate | 35 | 14.4% |
| Graduate / Professional | 5 | 2.1% |
| Total | 243 | 100.0% |
School Enrollment by Age by Funding Source in Oil City
Out of a total of 243 students who are enrolled in schools in Oil City, 6 (2.5%) attend a private institution, while the remaining 237 (97.5%) are enrolled in public schools. The age group of 15 to 17 year olds has the highest likelihood of being enrolled in private schools, with 6 (17.6% in the age bracket) enrolled. Conversely, the age group of 3 to 4 year olds has the lowest likelihood of being enrolled in a private school, with 11 (100.0% in the age bracket) attending a public institution.
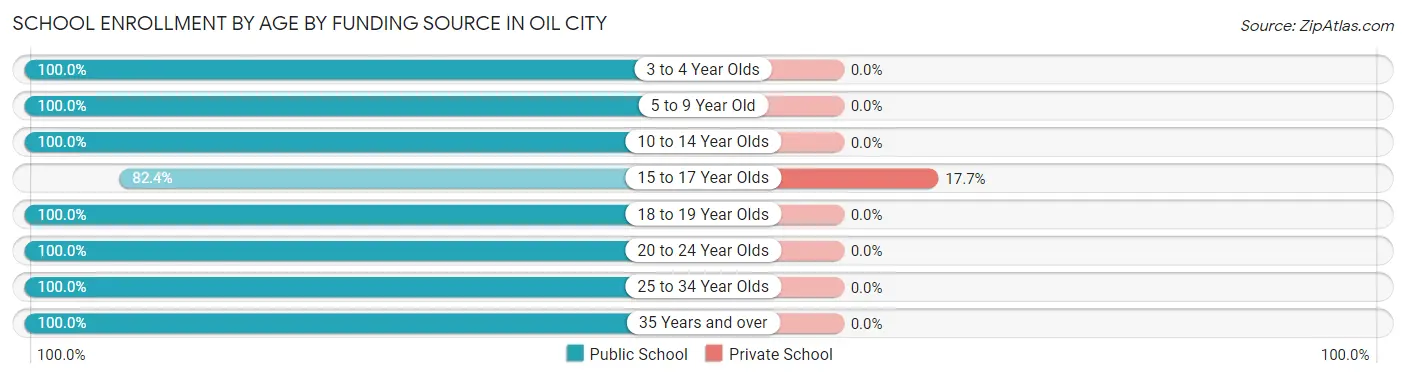
| Age Bracket | Public School | Private School |
| 3 to 4 Year Olds | 11 (100.0%) | 0 (0.0%) |
| 5 to 9 Year Old | 48 (100.0%) | 0 (0.0%) |
| 10 to 14 Year Olds | 101 (100.0%) | 0 (0.0%) |
| 15 to 17 Year Olds | 28 (82.4%) | 6 (17.6%) |
| 18 to 19 Year Olds | 7 (100.0%) | 0 (0.0%) |
| 20 to 24 Year Olds | 9 (100.0%) | 0 (0.0%) |
| 25 to 34 Year Olds | 22 (100.0%) | 0 (0.0%) |
| 35 Years and over | 11 (100.0%) | 0 (0.0%) |
| Total | 237 (97.5%) | 6 (2.5%) |
Educational Attainment by Field of Study in Oil City
Science & technology (14 | 21.9%), liberal arts & history (11 | 17.2%), business (10 | 15.6%), literature & languages (10 | 15.6%), and bio, nature & agricultural (9 | 14.1%) are the most common fields of study among 64 individuals in Oil City who have obtained a bachelor's degree or higher.
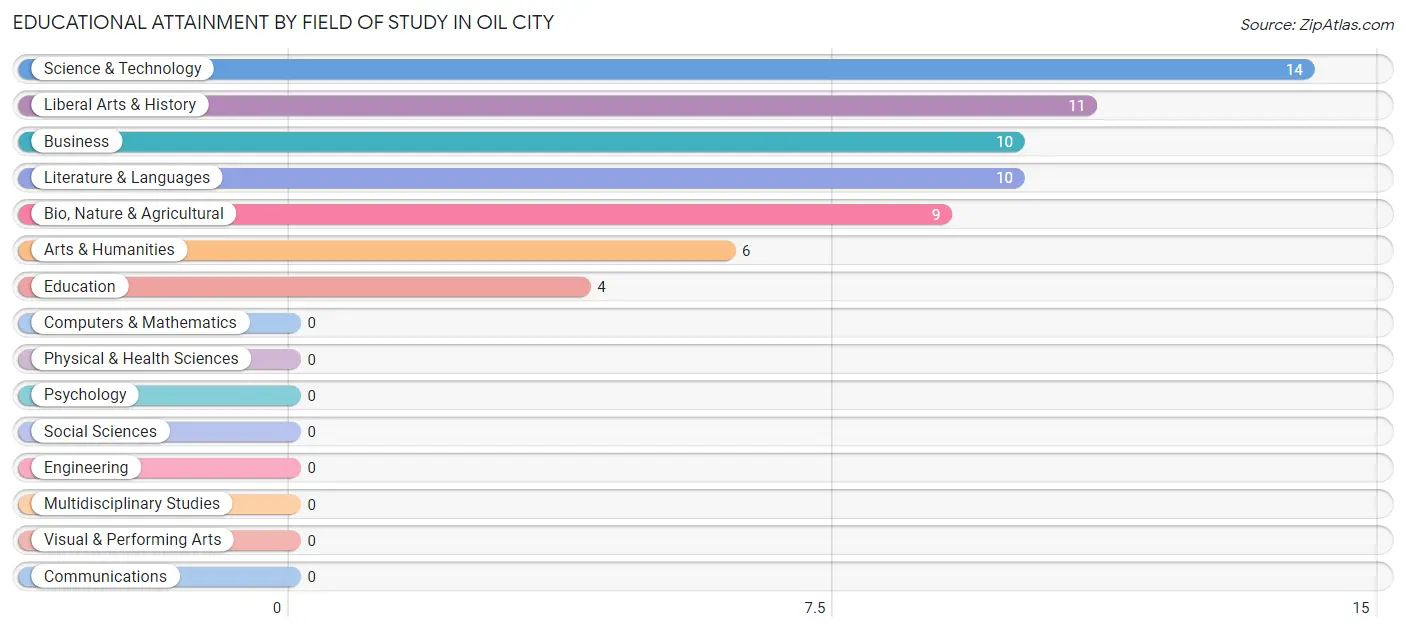
| Field of Study | # Graduates | % Graduates |
| Computers & Mathematics | 0 | 0.0% |
| Bio, Nature & Agricultural | 9 | 14.1% |
| Physical & Health Sciences | 0 | 0.0% |
| Psychology | 0 | 0.0% |
| Social Sciences | 0 | 0.0% |
| Engineering | 0 | 0.0% |
| Multidisciplinary Studies | 0 | 0.0% |
| Science & Technology | 14 | 21.9% |
| Business | 10 | 15.6% |
| Education | 4 | 6.2% |
| Literature & Languages | 10 | 15.6% |
| Liberal Arts & History | 11 | 17.2% |
| Visual & Performing Arts | 0 | 0.0% |
| Communications | 0 | 0.0% |
| Arts & Humanities | 6 | 9.4% |
| Total | 64 | 100.0% |
Transportation & Commute in Oil City
Vehicle Availability by Sex in Oil City
The most prevalent vehicle ownership categories in Oil City are males with 2 vehicles (64, accounting for 29.8%) and females with 2 vehicles (39, making up 42.1%).
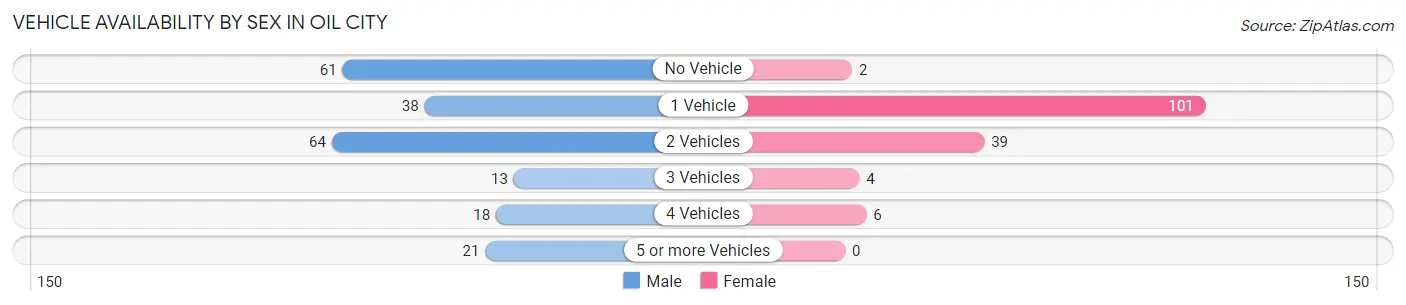
| Vehicles Available | Male | Female |
| No Vehicle | 61 (28.4%) | 2 (1.3%) |
| 1 Vehicle | 38 (17.7%) | 101 (66.4%) |
| 2 Vehicles | 64 (29.8%) | 39 (25.7%) |
| 3 Vehicles | 13 (6.0%) | 4 (2.6%) |
| 4 Vehicles | 18 (8.4%) | 6 (4.0%) |
| 5 or more Vehicles | 21 (9.8%) | 0 (0.0%) |
| Total | 215 (100.0%) | 152 (100.0%) |
Commute Time in Oil City
The most frequently occuring commute durations in Oil City are 5 to 9 minutes (106 commuters, 29.3%), 45 to 59 minutes (75 commuters, 20.7%), and 15 to 19 minutes (40 commuters, 11.1%).
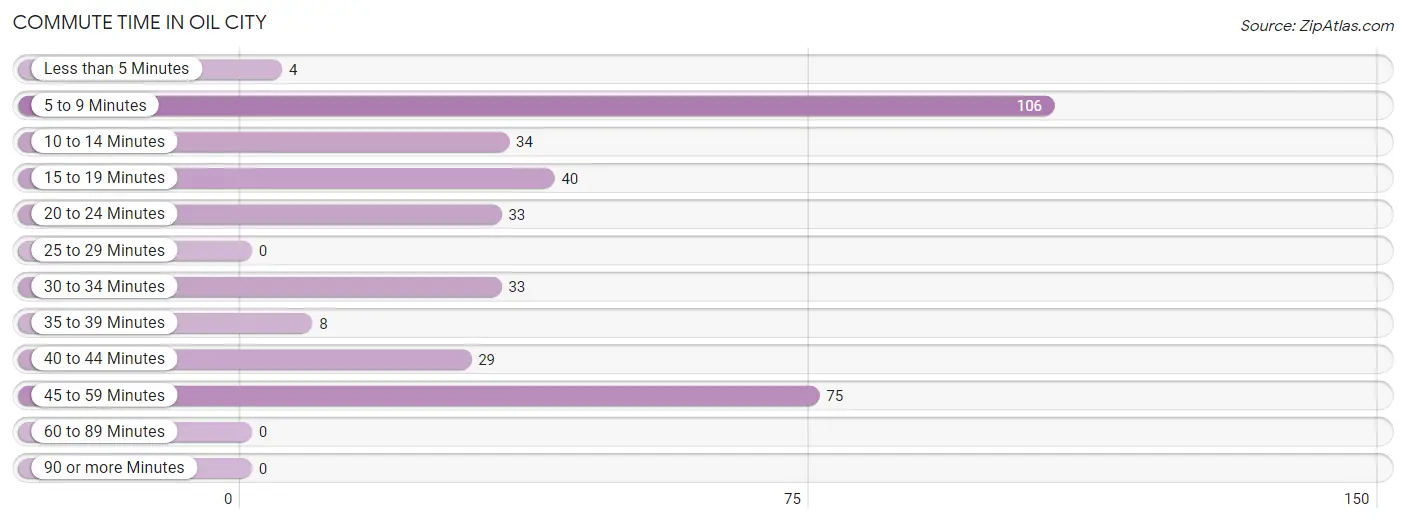
| Commute Time | # Commuters | % Commuters |
| Less than 5 Minutes | 4 | 1.1% |
| 5 to 9 Minutes | 106 | 29.3% |
| 10 to 14 Minutes | 34 | 9.4% |
| 15 to 19 Minutes | 40 | 11.1% |
| 20 to 24 Minutes | 33 | 9.1% |
| 25 to 29 Minutes | 0 | 0.0% |
| 30 to 34 Minutes | 33 | 9.1% |
| 35 to 39 Minutes | 8 | 2.2% |
| 40 to 44 Minutes | 29 | 8.0% |
| 45 to 59 Minutes | 75 | 20.7% |
| 60 to 89 Minutes | 0 | 0.0% |
| 90 or more Minutes | 0 | 0.0% |
Commute Time by Sex in Oil City
The most common commute times in Oil City are 5 to 9 minutes (89 commuters, 42.4%) for males and 45 to 59 minutes (53 commuters, 34.9%) for females.
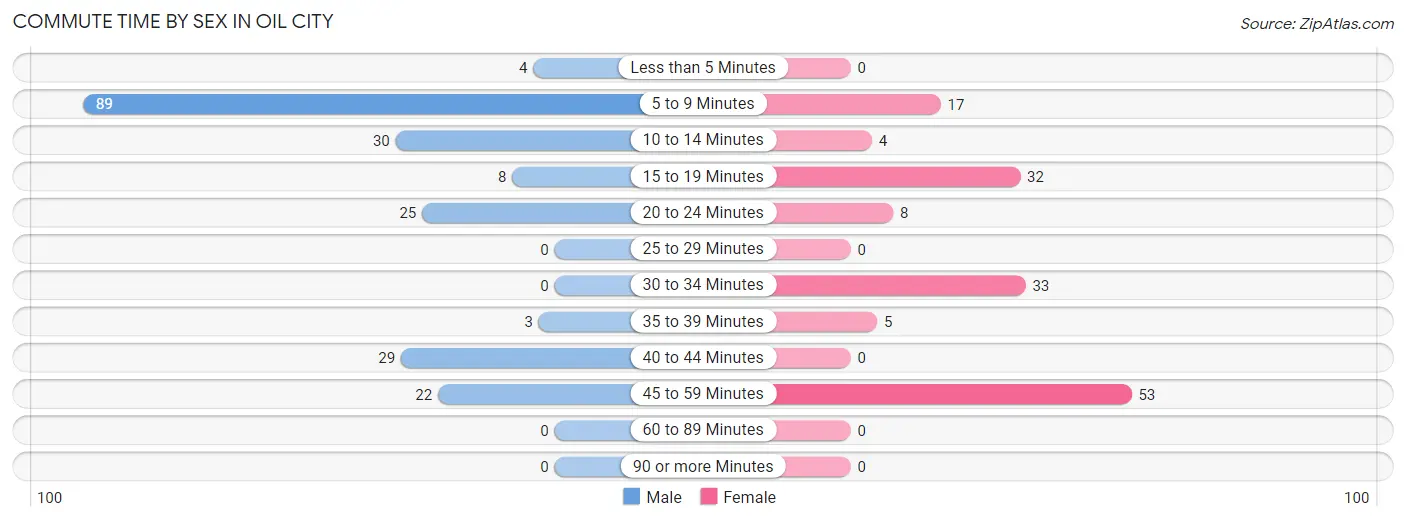
| Commute Time | Male | Female |
| Less than 5 Minutes | 4 (1.9%) | 0 (0.0%) |
| 5 to 9 Minutes | 89 (42.4%) | 17 (11.2%) |
| 10 to 14 Minutes | 30 (14.3%) | 4 (2.6%) |
| 15 to 19 Minutes | 8 (3.8%) | 32 (21.0%) |
| 20 to 24 Minutes | 25 (11.9%) | 8 (5.3%) |
| 25 to 29 Minutes | 0 (0.0%) | 0 (0.0%) |
| 30 to 34 Minutes | 0 (0.0%) | 33 (21.7%) |
| 35 to 39 Minutes | 3 (1.4%) | 5 (3.3%) |
| 40 to 44 Minutes | 29 (13.8%) | 0 (0.0%) |
| 45 to 59 Minutes | 22 (10.5%) | 53 (34.9%) |
| 60 to 89 Minutes | 0 (0.0%) | 0 (0.0%) |
| 90 or more Minutes | 0 (0.0%) | 0 (0.0%) |
Time of Departure to Work by Sex in Oil City
The most frequent times of departure to work in Oil City are 7:30 AM to 7:59 AM (68, 32.4%) for males and 4:00 PM to 11:59 PM (46, 30.3%) for females.
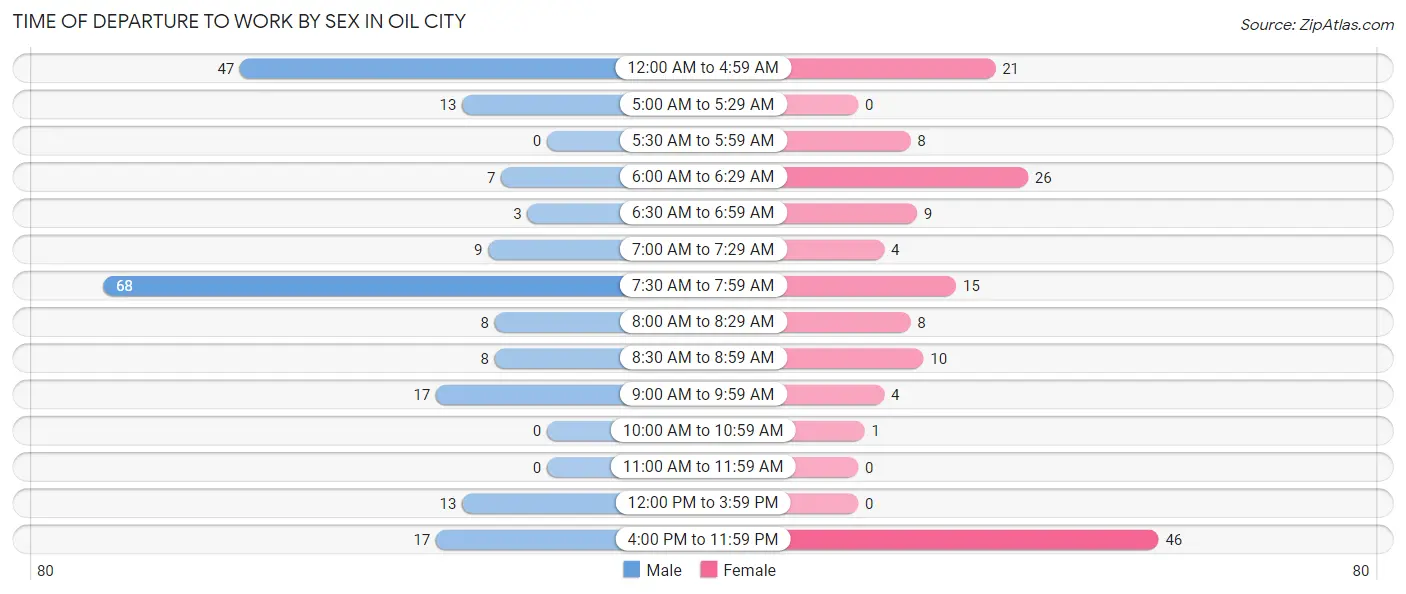
| Time of Departure | Male | Female |
| 12:00 AM to 4:59 AM | 47 (22.4%) | 21 (13.8%) |
| 5:00 AM to 5:29 AM | 13 (6.2%) | 0 (0.0%) |
| 5:30 AM to 5:59 AM | 0 (0.0%) | 8 (5.3%) |
| 6:00 AM to 6:29 AM | 7 (3.3%) | 26 (17.1%) |
| 6:30 AM to 6:59 AM | 3 (1.4%) | 9 (5.9%) |
| 7:00 AM to 7:29 AM | 9 (4.3%) | 4 (2.6%) |
| 7:30 AM to 7:59 AM | 68 (32.4%) | 15 (9.9%) |
| 8:00 AM to 8:29 AM | 8 (3.8%) | 8 (5.3%) |
| 8:30 AM to 8:59 AM | 8 (3.8%) | 10 (6.6%) |
| 9:00 AM to 9:59 AM | 17 (8.1%) | 4 (2.6%) |
| 10:00 AM to 10:59 AM | 0 (0.0%) | 1 (0.7%) |
| 11:00 AM to 11:59 AM | 0 (0.0%) | 0 (0.0%) |
| 12:00 PM to 3:59 PM | 13 (6.2%) | 0 (0.0%) |
| 4:00 PM to 11:59 PM | 17 (8.1%) | 46 (30.3%) |
| Total | 210 (100.0%) | 152 (100.0%) |
Housing Occupancy in Oil City
Occupancy by Ownership in Oil City
Of the total 518 dwellings in Oil City, owner-occupied units account for 199 (38.4%), while renter-occupied units make up 319 (61.6%).
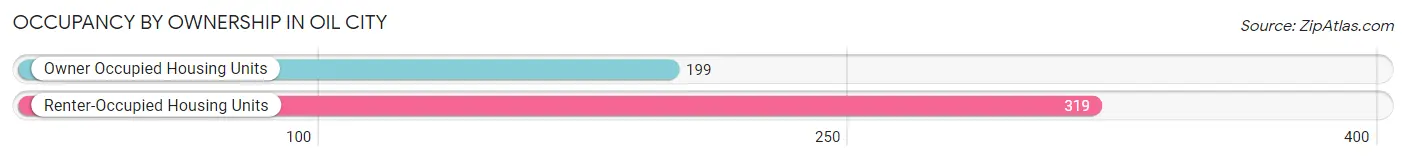
| Occupancy | # Housing Units | % Housing Units |
| Owner Occupied Housing Units | 199 | 38.4% |
| Renter-Occupied Housing Units | 319 | 61.6% |
| Total Occupied Housing Units | 518 | 100.0% |
Occupancy by Household Size in Oil City
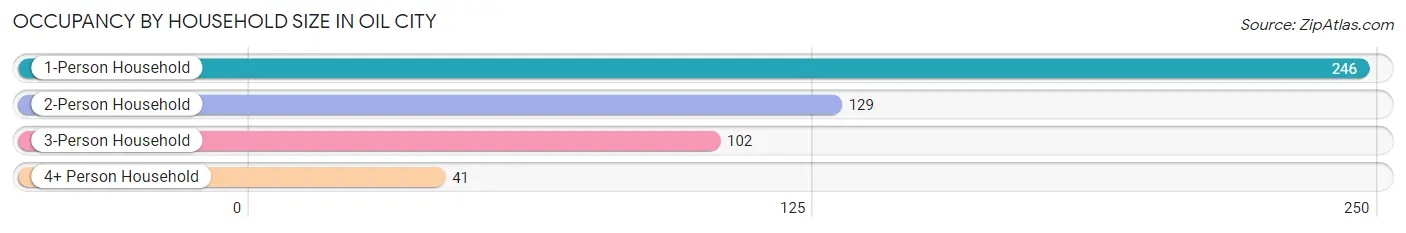
| Household Size | # Housing Units | % Housing Units |
| 1-Person Household | 246 | 47.5% |
| 2-Person Household | 129 | 24.9% |
| 3-Person Household | 102 | 19.7% |
| 4+ Person Household | 41 | 7.9% |
| Total Housing Units | 518 | 100.0% |
Occupancy by Ownership by Household Size in Oil City
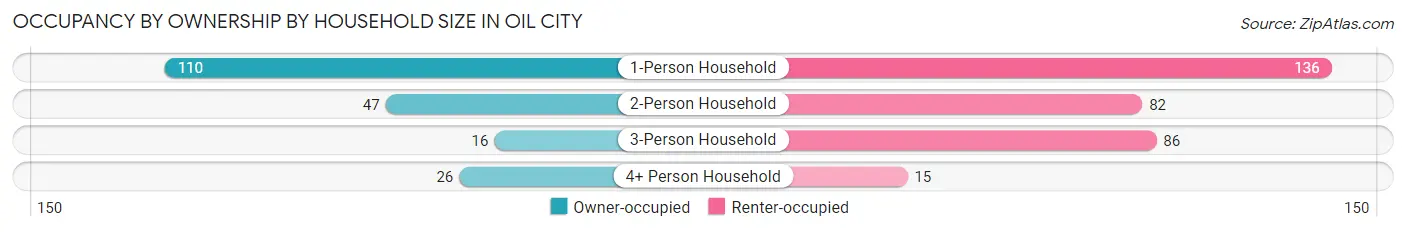
| Household Size | Owner-occupied | Renter-occupied |
| 1-Person Household | 110 (44.7%) | 136 (55.3%) |
| 2-Person Household | 47 (36.4%) | 82 (63.6%) |
| 3-Person Household | 16 (15.7%) | 86 (84.3%) |
| 4+ Person Household | 26 (63.4%) | 15 (36.6%) |
| Total Housing Units | 199 (38.4%) | 319 (61.6%) |
Occupancy by Educational Attainment in Oil City
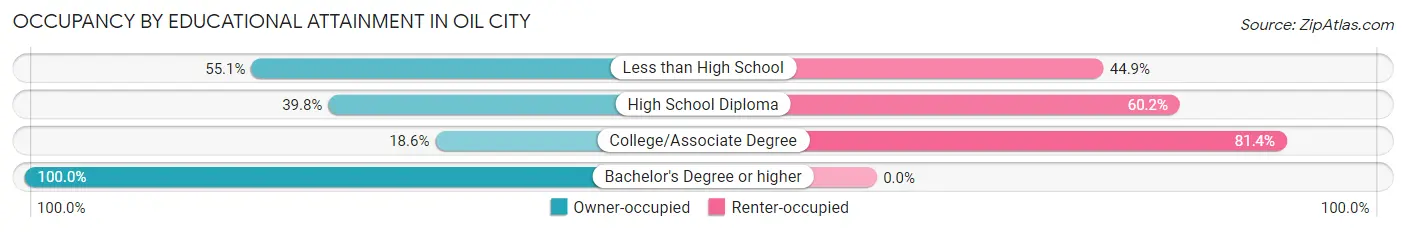
| Household Size | Owner-occupied | Renter-occupied |
| Less than High School | 49 (55.1%) | 40 (44.9%) |
| High School Diploma | 86 (39.8%) | 130 (60.2%) |
| College/Associate Degree | 34 (18.6%) | 149 (81.4%) |
| Bachelor's Degree or higher | 30 (100.0%) | 0 (0.0%) |
Occupancy by Age of Householder in Oil City
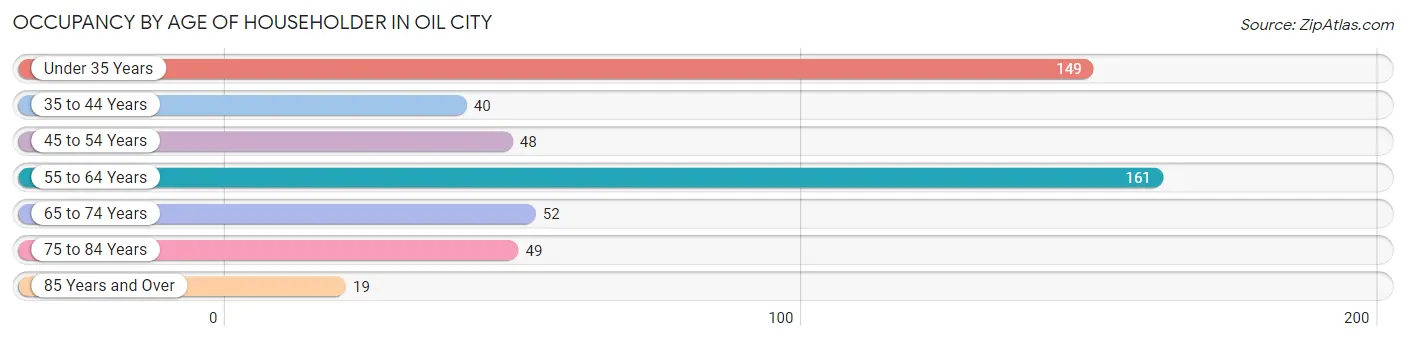
| Age Bracket | # Households | % Households |
| Under 35 Years | 149 | 28.8% |
| 35 to 44 Years | 40 | 7.7% |
| 45 to 54 Years | 48 | 9.3% |
| 55 to 64 Years | 161 | 31.1% |
| 65 to 74 Years | 52 | 10.0% |
| 75 to 84 Years | 49 | 9.5% |
| 85 Years and Over | 19 | 3.7% |
| Total | 518 | 100.0% |
Housing Finances in Oil City
Median Income by Occupancy in Oil City
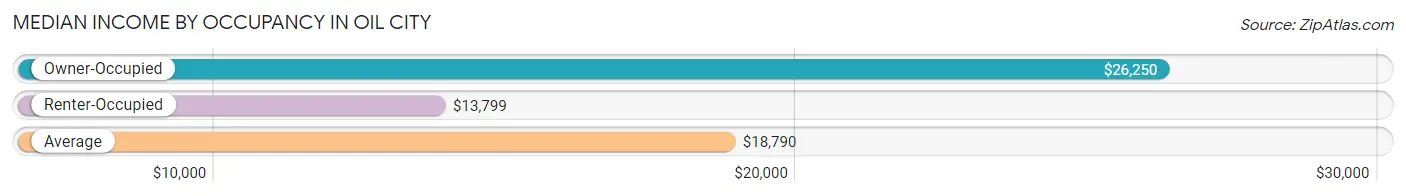
| Occupancy Type | # Households | Median Income |
| Owner-Occupied | 199 (38.4%) | $26,250 |
| Renter-Occupied | 319 (61.6%) | $13,799 |
| Average | 518 (100.0%) | $18,790 |
Occupancy by Householder Income Bracket in Oil City

| Income Bracket | Owner-occupied | Renter-occupied |
| Less than $5,000 | 3 (1.5%) | 59 (18.5%) |
| $5,000 to $9,999 | 5 (2.5%) | 0 (0.0%) |
| $10,000 to $14,999 | 17 (8.5%) | 125 (39.2%) |
| $15,000 to $19,999 | 49 (24.6%) | 16 (5.0%) |
| $20,000 to $24,999 | 23 (11.6%) | 14 (4.4%) |
| $25,000 to $34,999 | 17 (8.5%) | 39 (12.2%) |
| $35,000 to $49,999 | 15 (7.5%) | 17 (5.3%) |
| $50,000 to $74,999 | 40 (20.1%) | 27 (8.5%) |
| $75,000 to $99,999 | 15 (7.5%) | 5 (1.6%) |
| $100,000 to $149,999 | 6 (3.0%) | 17 (5.3%) |
| $150,000 or more | 9 (4.5%) | 0 (0.0%) |
| Total | 199 (100.0%) | 319 (100.0%) |
Monthly Housing Cost Tiers in Oil City
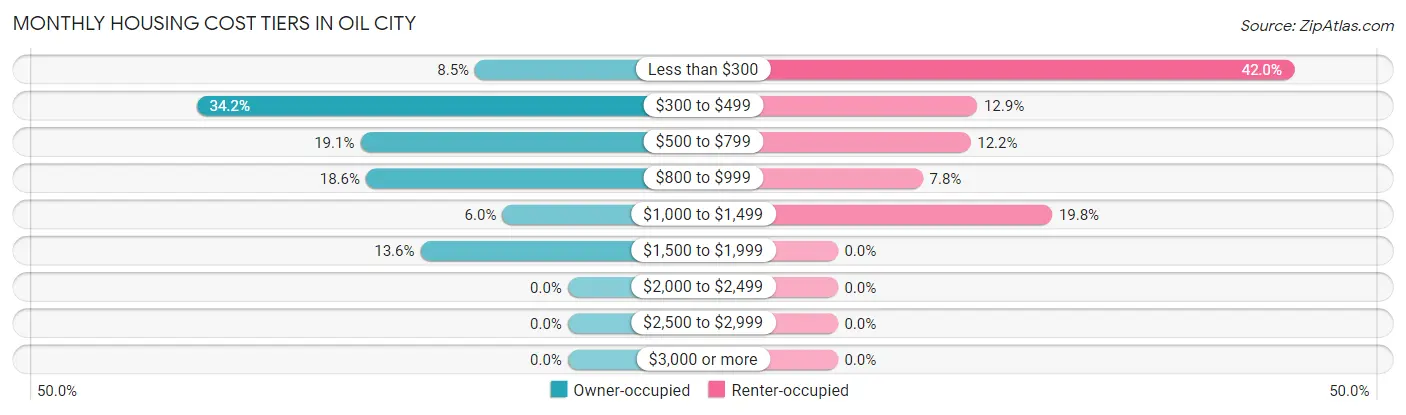
| Monthly Cost | Owner-occupied | Renter-occupied |
| Less than $300 | 17 (8.5%) | 134 (42.0%) |
| $300 to $499 | 68 (34.2%) | 41 (12.9%) |
| $500 to $799 | 38 (19.1%) | 39 (12.2%) |
| $800 to $999 | 37 (18.6%) | 25 (7.8%) |
| $1,000 to $1,499 | 12 (6.0%) | 63 (19.8%) |
| $1,500 to $1,999 | 27 (13.6%) | 0 (0.0%) |
| $2,000 to $2,499 | 0 (0.0%) | 0 (0.0%) |
| $2,500 to $2,999 | 0 (0.0%) | 0 (0.0%) |
| $3,000 or more | 0 (0.0%) | 0 (0.0%) |
| Total | 199 (100.0%) | 319 (100.0%) |
Physical Housing Characteristics in Oil City
Housing Structures in Oil City
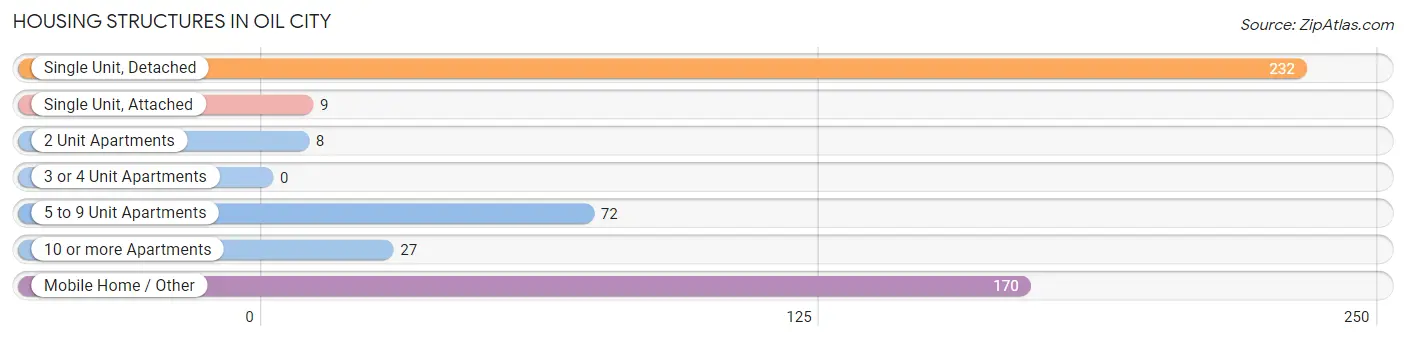
| Structure Type | # Housing Units | % Housing Units |
| Single Unit, Detached | 232 | 44.8% |
| Single Unit, Attached | 9 | 1.7% |
| 2 Unit Apartments | 8 | 1.5% |
| 3 or 4 Unit Apartments | 0 | 0.0% |
| 5 to 9 Unit Apartments | 72 | 13.9% |
| 10 or more Apartments | 27 | 5.2% |
| Mobile Home / Other | 170 | 32.8% |
| Total | 518 | 100.0% |
Housing Structures by Occupancy in Oil City
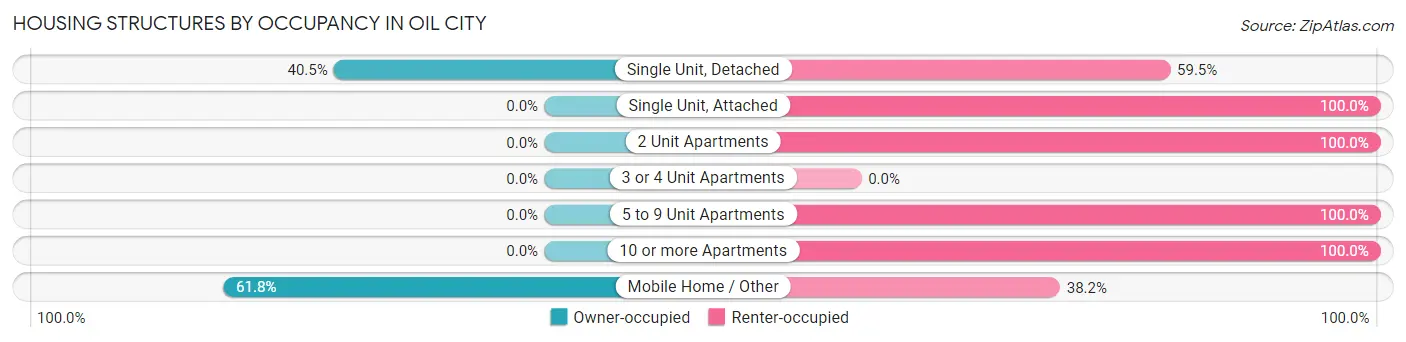
| Structure Type | Owner-occupied | Renter-occupied |
| Single Unit, Detached | 94 (40.5%) | 138 (59.5%) |
| Single Unit, Attached | 0 (0.0%) | 9 (100.0%) |
| 2 Unit Apartments | 0 (0.0%) | 8 (100.0%) |
| 3 or 4 Unit Apartments | 0 (0.0%) | 0 (0.0%) |
| 5 to 9 Unit Apartments | 0 (0.0%) | 72 (100.0%) |
| 10 or more Apartments | 0 (0.0%) | 27 (100.0%) |
| Mobile Home / Other | 105 (61.8%) | 65 (38.2%) |
| Total | 199 (38.4%) | 319 (61.6%) |
Housing Structures by Number of Rooms in Oil City
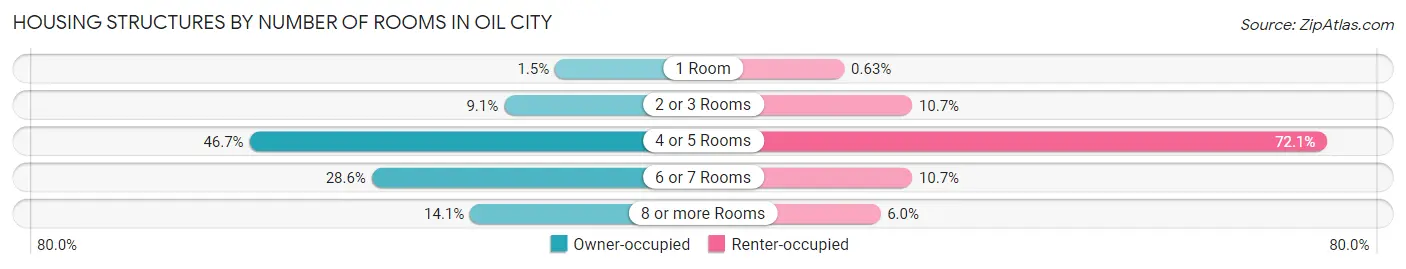
| Number of Rooms | Owner-occupied | Renter-occupied |
| 1 Room | 3 (1.5%) | 2 (0.6%) |
| 2 or 3 Rooms | 18 (9.0%) | 34 (10.7%) |
| 4 or 5 Rooms | 93 (46.7%) | 230 (72.1%) |
| 6 or 7 Rooms | 57 (28.6%) | 34 (10.7%) |
| 8 or more Rooms | 28 (14.1%) | 19 (6.0%) |
| Total | 199 (100.0%) | 319 (100.0%) |
Housing Structure by Heating Type in Oil City
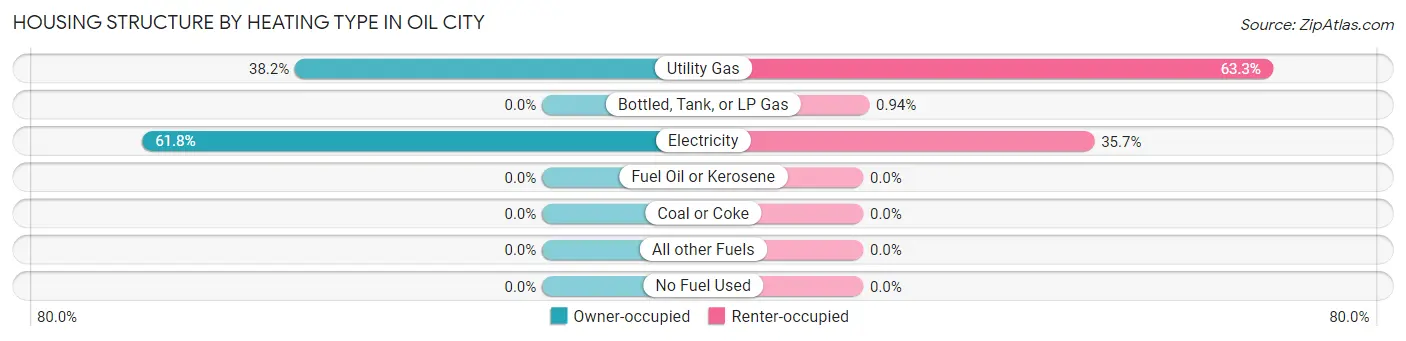
| Heating Type | Owner-occupied | Renter-occupied |
| Utility Gas | 76 (38.2%) | 202 (63.3%) |
| Bottled, Tank, or LP Gas | 0 (0.0%) | 3 (0.9%) |
| Electricity | 123 (61.8%) | 114 (35.7%) |
| Fuel Oil or Kerosene | 0 (0.0%) | 0 (0.0%) |
| Coal or Coke | 0 (0.0%) | 0 (0.0%) |
| All other Fuels | 0 (0.0%) | 0 (0.0%) |
| No Fuel Used | 0 (0.0%) | 0 (0.0%) |
| Total | 199 (100.0%) | 319 (100.0%) |
Household Vehicle Usage in Oil City
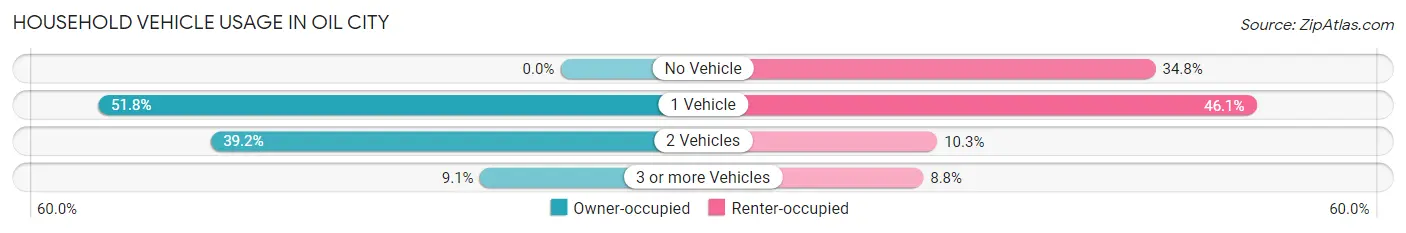
| Vehicles per Household | Owner-occupied | Renter-occupied |
| No Vehicle | 0 (0.0%) | 111 (34.8%) |
| 1 Vehicle | 103 (51.8%) | 147 (46.1%) |
| 2 Vehicles | 78 (39.2%) | 33 (10.3%) |
| 3 or more Vehicles | 18 (9.0%) | 28 (8.8%) |
| Total | 199 (100.0%) | 319 (100.0%) |
Real Estate & Mortgages in Oil City
Real Estate and Mortgage Overview in Oil City
| Characteristic | Without Mortgage | With Mortgage |
| Housing Units | 109 | 90 |
| Median Property Value | $69,600 | $50,000 |
| Median Household Income | $28,594 | $0 |
| Monthly Housing Costs | $414 | $0 |
| Real Estate Taxes | $294 | $41 |
Property Value by Mortgage Status in Oil City
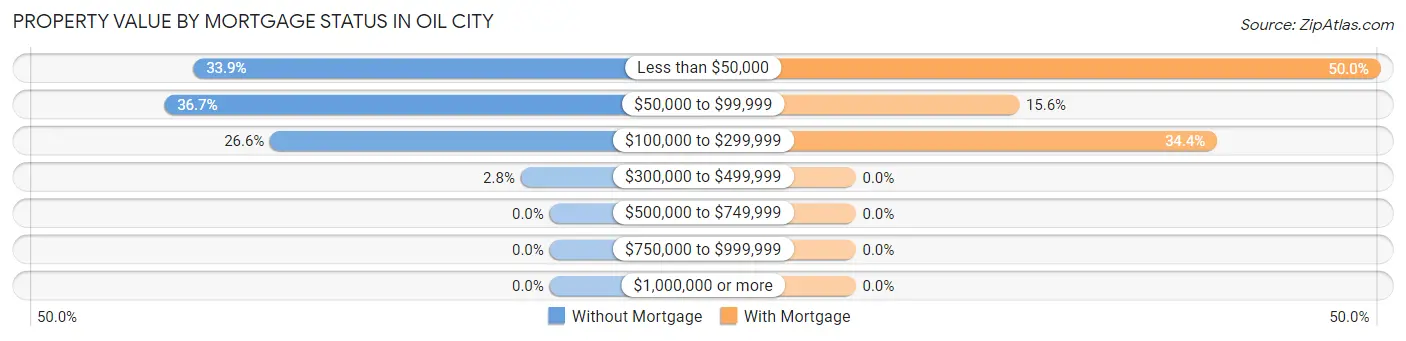
| Property Value | Without Mortgage | With Mortgage |
| Less than $50,000 | 37 (33.9%) | 45 (50.0%) |
| $50,000 to $99,999 | 40 (36.7%) | 14 (15.6%) |
| $100,000 to $299,999 | 29 (26.6%) | 31 (34.4%) |
| $300,000 to $499,999 | 3 (2.8%) | 0 (0.0%) |
| $500,000 to $749,999 | 0 (0.0%) | 0 (0.0%) |
| $750,000 to $999,999 | 0 (0.0%) | 0 (0.0%) |
| $1,000,000 or more | 0 (0.0%) | 0 (0.0%) |
| Total | 109 (100.0%) | 90 (100.0%) |
Household Income by Mortgage Status in Oil City
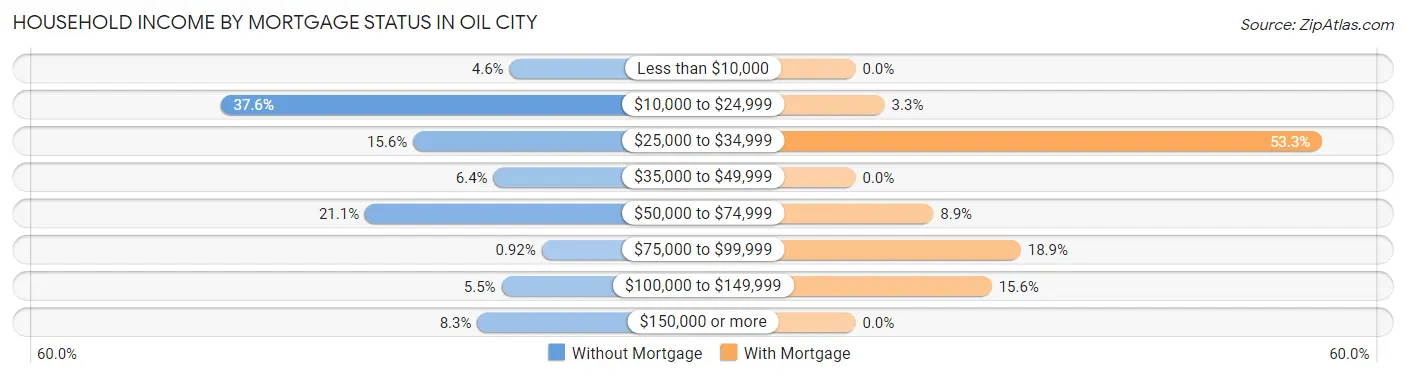
| Household Income | Without Mortgage | With Mortgage |
| Less than $10,000 | 5 (4.6%) | 0 (0.0%) |
| $10,000 to $24,999 | 41 (37.6%) | 3 (3.3%) |
| $25,000 to $34,999 | 17 (15.6%) | 48 (53.3%) |
| $35,000 to $49,999 | 7 (6.4%) | 0 (0.0%) |
| $50,000 to $74,999 | 23 (21.1%) | 8 (8.9%) |
| $75,000 to $99,999 | 1 (0.9%) | 17 (18.9%) |
| $100,000 to $149,999 | 6 (5.5%) | 14 (15.6%) |
| $150,000 or more | 9 (8.3%) | 0 (0.0%) |
| Total | 109 (100.0%) | 90 (100.0%) |
Property Value to Household Income Ratio in Oil City
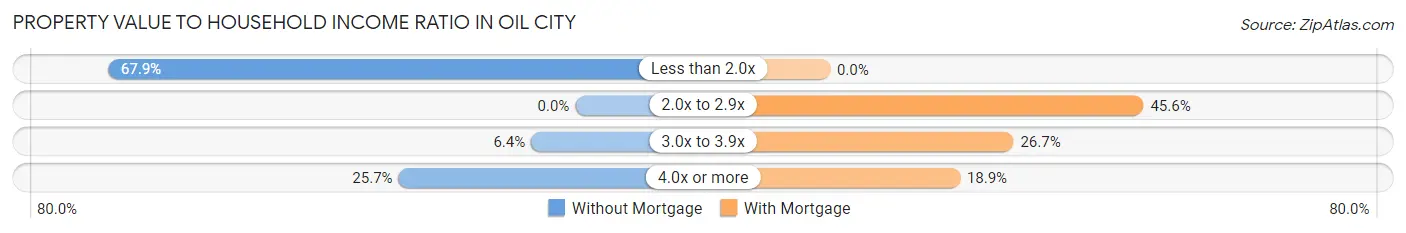
| Value-to-Income Ratio | Without Mortgage | With Mortgage |
| Less than 2.0x | 74 (67.9%) | 0 (0.0%) |
| 2.0x to 2.9x | 0 (0.0%) | 41 (45.6%) |
| 3.0x to 3.9x | 7 (6.4%) | 24 (26.7%) |
| 4.0x or more | 28 (25.7%) | 17 (18.9%) |
| Total | 109 (100.0%) | 90 (100.0%) |
Real Estate Taxes by Mortgage Status in Oil City
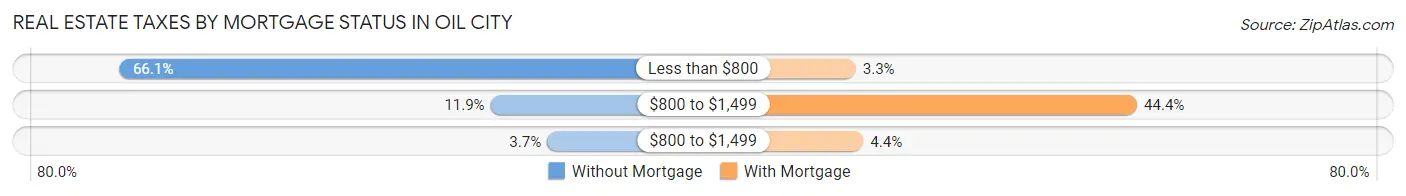
| Property Taxes | Without Mortgage | With Mortgage |
| Less than $800 | 72 (66.1%) | 3 (3.3%) |
| $800 to $1,499 | 13 (11.9%) | 40 (44.4%) |
| $800 to $1,499 | 4 (3.7%) | 4 (4.4%) |
| Total | 109 (100.0%) | 90 (100.0%) |
Health & Disability in Oil City
Health Insurance Coverage by Age in Oil City
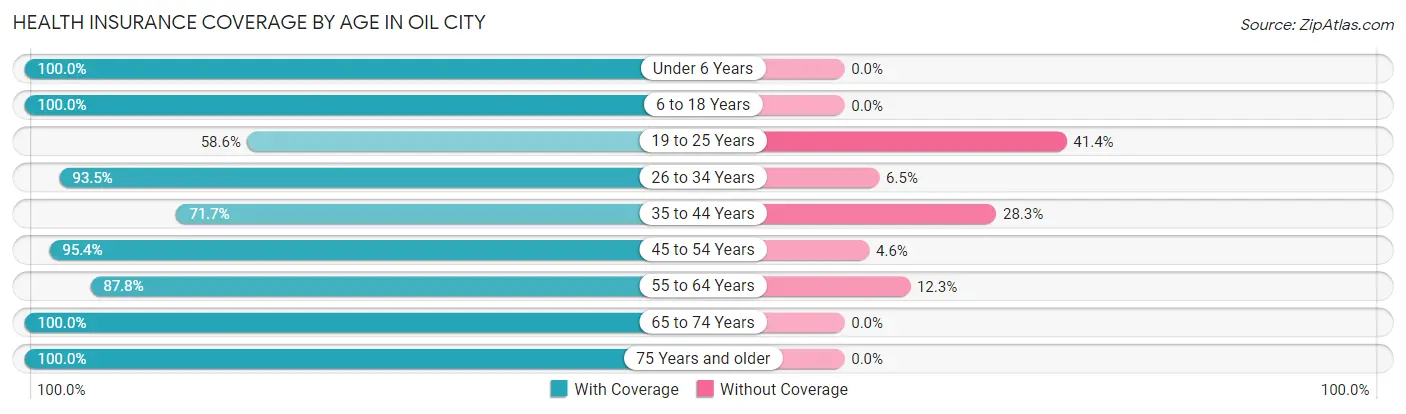
| Age Bracket | With Coverage | Without Coverage |
| Under 6 Years | 118 (100.0%) | 0 (0.0%) |
| 6 to 18 Years | 168 (100.0%) | 0 (0.0%) |
| 19 to 25 Years | 99 (58.6%) | 70 (41.4%) |
| 26 to 34 Years | 115 (93.5%) | 8 (6.5%) |
| 35 to 44 Years | 38 (71.7%) | 15 (28.3%) |
| 45 to 54 Years | 62 (95.4%) | 3 (4.6%) |
| 55 to 64 Years | 222 (87.7%) | 31 (12.2%) |
| 65 to 74 Years | 70 (100.0%) | 0 (0.0%) |
| 75 Years and older | 74 (100.0%) | 0 (0.0%) |
| Total | 966 (88.4%) | 127 (11.6%) |
Health Insurance Coverage by Citizenship Status in Oil City

| Citizenship Status | With Coverage | Without Coverage |
| Native Born | 118 (100.0%) | 0 (0.0%) |
| Foreign Born, Citizen | 168 (100.0%) | 0 (0.0%) |
| Foreign Born, not a Citizen | 99 (58.6%) | 70 (41.4%) |
Health Insurance Coverage by Household Income in Oil City
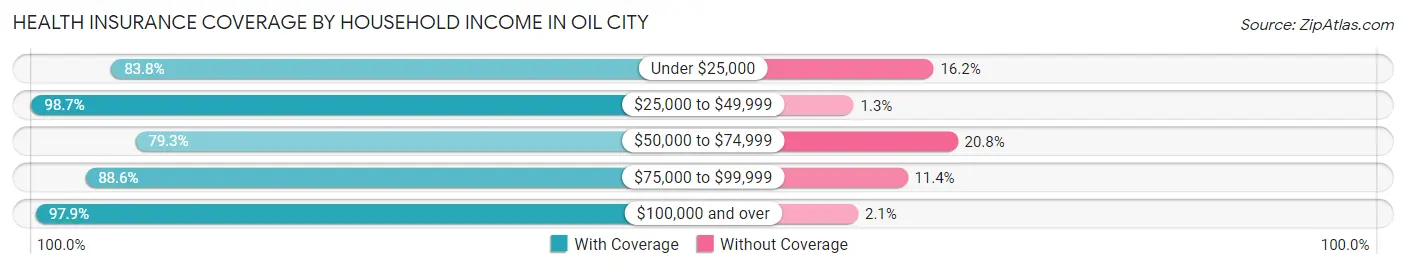
| Household Income | With Coverage | Without Coverage |
| Under $25,000 | 428 (83.8%) | 83 (16.2%) |
| $25,000 to $49,999 | 234 (98.7%) | 3 (1.3%) |
| $50,000 to $74,999 | 126 (79.2%) | 33 (20.7%) |
| $75,000 to $99,999 | 39 (88.6%) | 5 (11.4%) |
| $100,000 and over | 139 (97.9%) | 3 (2.1%) |
Public vs Private Health Insurance Coverage by Age in Oil City
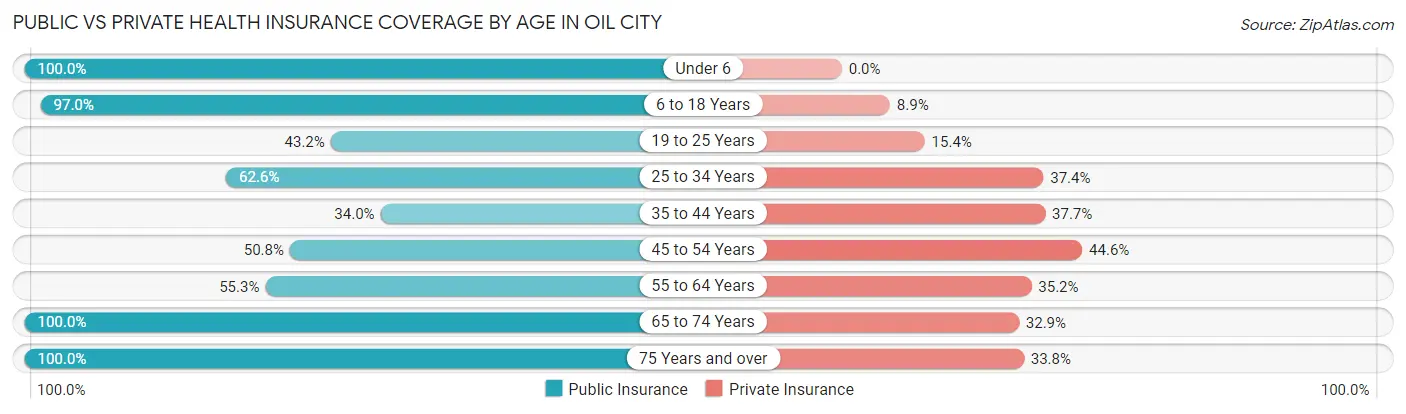
| Age Bracket | Public Insurance | Private Insurance |
| Under 6 | 118 (100.0%) | 0 (0.0%) |
| 6 to 18 Years | 163 (97.0%) | 15 (8.9%) |
| 19 to 25 Years | 73 (43.2%) | 26 (15.4%) |
| 25 to 34 Years | 77 (62.6%) | 46 (37.4%) |
| 35 to 44 Years | 18 (34.0%) | 20 (37.7%) |
| 45 to 54 Years | 33 (50.8%) | 29 (44.6%) |
| 55 to 64 Years | 140 (55.3%) | 89 (35.2%) |
| 65 to 74 Years | 70 (100.0%) | 23 (32.9%) |
| 75 Years and over | 74 (100.0%) | 25 (33.8%) |
| Total | 766 (70.1%) | 273 (25.0%) |
Disability Status by Sex by Age in Oil City
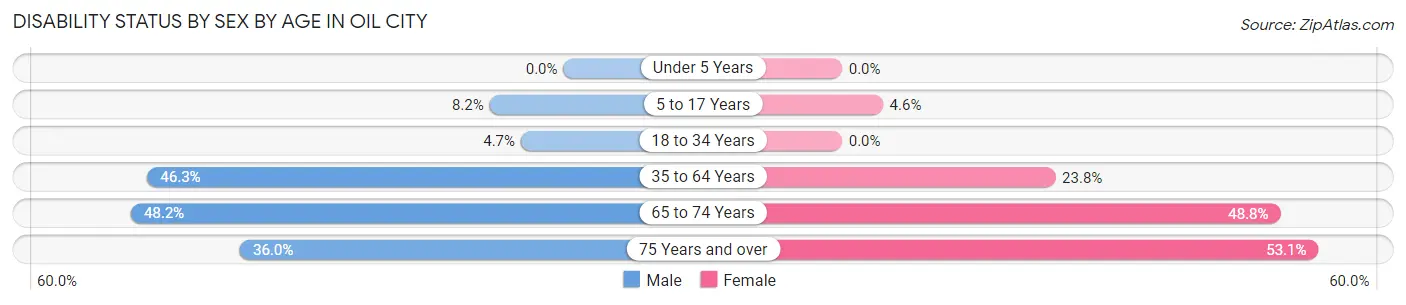
| Age Bracket | Male | Female |
| Under 5 Years | 0 (0.0%) | 0 (0.0%) |
| 5 to 17 Years | 6 (8.2%) | 5 (4.5%) |
| 18 to 34 Years | 7 (4.7%) | 0 (0.0%) |
| 35 to 64 Years | 88 (46.3%) | 43 (23.8%) |
| 65 to 74 Years | 13 (48.1%) | 21 (48.8%) |
| 75 Years and over | 9 (36.0%) | 26 (53.1%) |
Disability Class by Sex by Age in Oil City
Disability Class: Hearing Difficulty
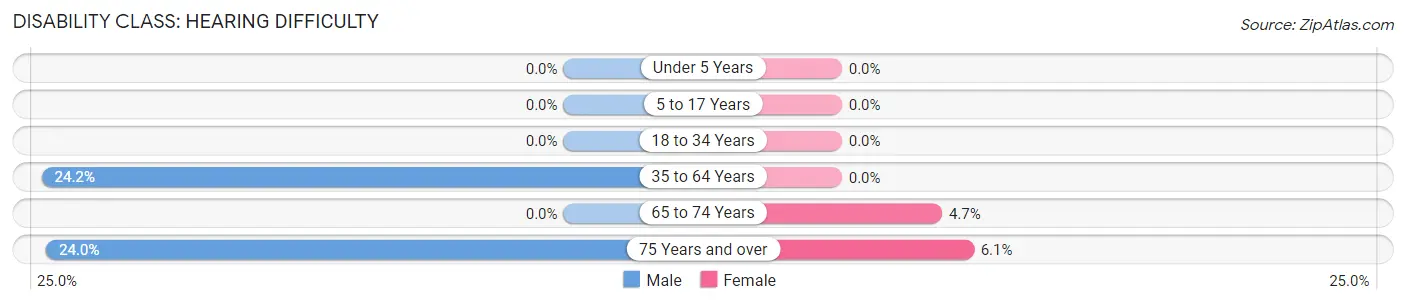
| Age Bracket | Male | Female |
| Under 5 Years | 0 (0.0%) | 0 (0.0%) |
| 5 to 17 Years | 0 (0.0%) | 0 (0.0%) |
| 18 to 34 Years | 0 (0.0%) | 0 (0.0%) |
| 35 to 64 Years | 46 (24.2%) | 0 (0.0%) |
| 65 to 74 Years | 0 (0.0%) | 2 (4.6%) |
| 75 Years and over | 6 (24.0%) | 3 (6.1%) |
Disability Class: Vision Difficulty
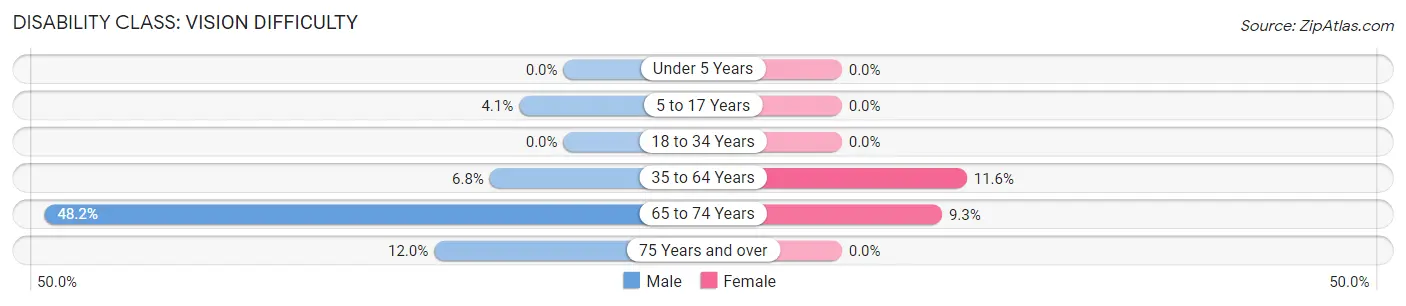
| Age Bracket | Male | Female |
| Under 5 Years | 0 (0.0%) | 0 (0.0%) |
| 5 to 17 Years | 3 (4.1%) | 0 (0.0%) |
| 18 to 34 Years | 0 (0.0%) | 0 (0.0%) |
| 35 to 64 Years | 13 (6.8%) | 21 (11.6%) |
| 65 to 74 Years | 13 (48.1%) | 4 (9.3%) |
| 75 Years and over | 3 (12.0%) | 0 (0.0%) |
Disability Class: Cognitive Difficulty
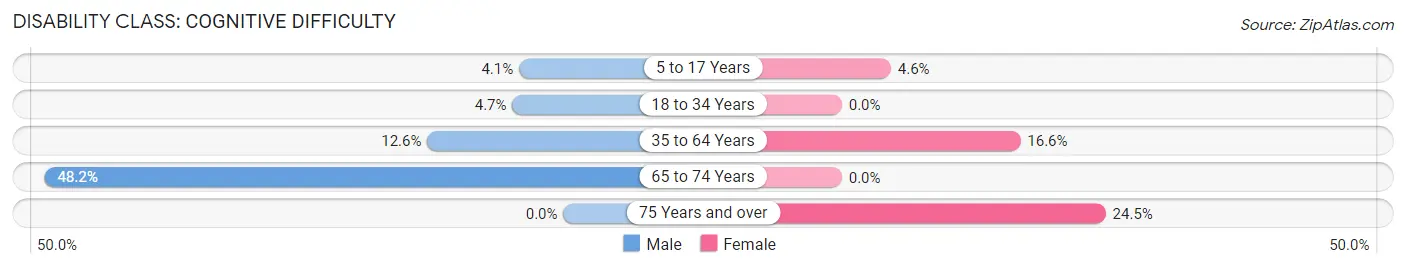
| Age Bracket | Male | Female |
| 5 to 17 Years | 3 (4.1%) | 5 (4.5%) |
| 18 to 34 Years | 7 (4.7%) | 0 (0.0%) |
| 35 to 64 Years | 24 (12.6%) | 30 (16.6%) |
| 65 to 74 Years | 13 (48.1%) | 0 (0.0%) |
| 75 Years and over | 0 (0.0%) | 12 (24.5%) |
Disability Class: Ambulatory Difficulty
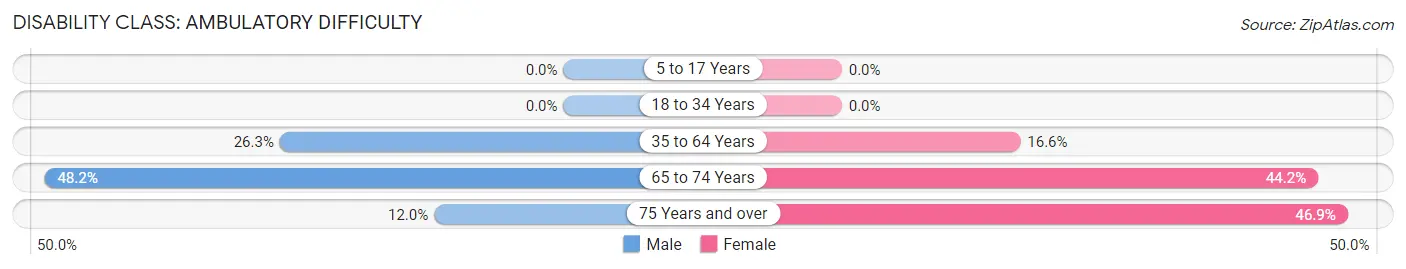
| Age Bracket | Male | Female |
| 5 to 17 Years | 0 (0.0%) | 0 (0.0%) |
| 18 to 34 Years | 0 (0.0%) | 0 (0.0%) |
| 35 to 64 Years | 50 (26.3%) | 30 (16.6%) |
| 65 to 74 Years | 13 (48.1%) | 19 (44.2%) |
| 75 Years and over | 3 (12.0%) | 23 (46.9%) |
Disability Class: Self-Care Difficulty
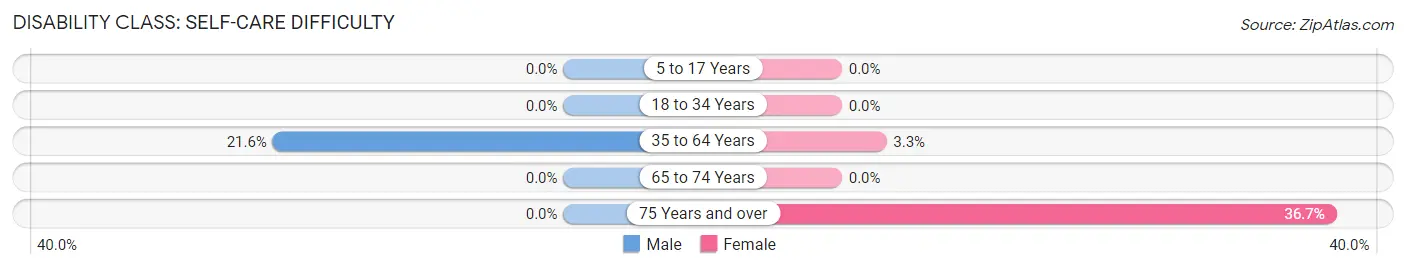
| Age Bracket | Male | Female |
| 5 to 17 Years | 0 (0.0%) | 0 (0.0%) |
| 18 to 34 Years | 0 (0.0%) | 0 (0.0%) |
| 35 to 64 Years | 41 (21.6%) | 6 (3.3%) |
| 65 to 74 Years | 0 (0.0%) | 0 (0.0%) |
| 75 Years and over | 0 (0.0%) | 18 (36.7%) |
Technology Access in Oil City
Computing Device Access in Oil City
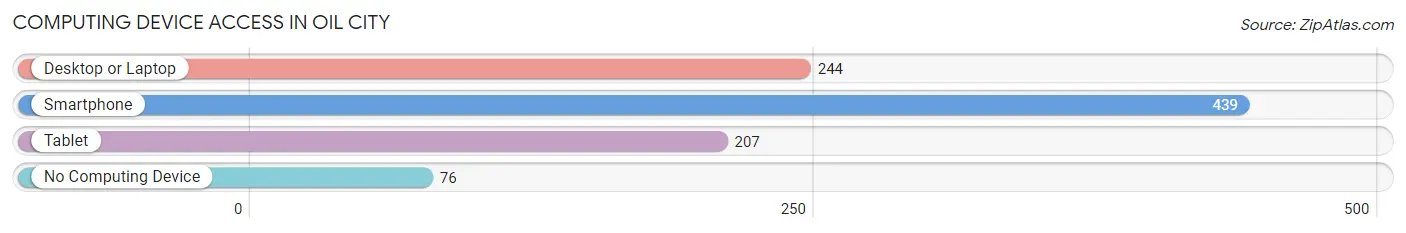
| Device Type | # Households | % Households |
| Desktop or Laptop | 244 | 47.1% |
| Smartphone | 439 | 84.8% |
| Tablet | 207 | 40.0% |
| No Computing Device | 76 | 14.7% |
| Total | 518 | 100.0% |
Internet Access in Oil City
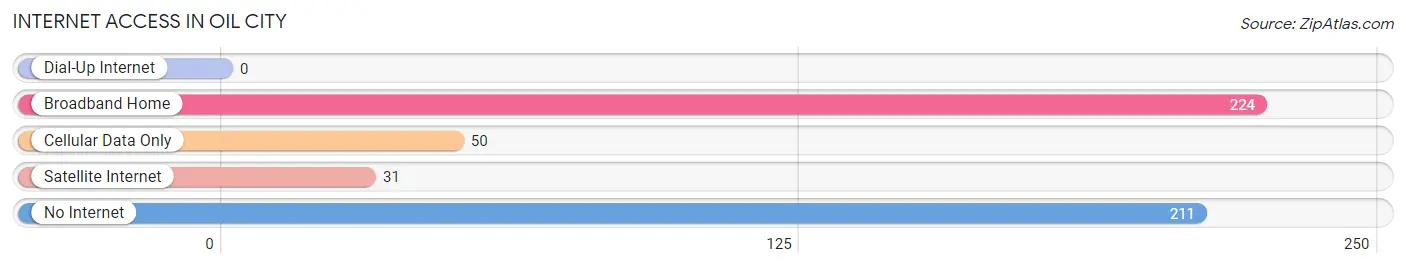
| Internet Type | # Households | % Households |
| Dial-Up Internet | 0 | 0.0% |
| Broadband Home | 224 | 43.2% |
| Cellular Data Only | 50 | 9.7% |
| Satellite Internet | 31 | 6.0% |
| No Internet | 211 | 40.7% |
| Total | 518 | 100.0% |
Oil City Summary
City of Oil City Louisiana
Oil City, Louisiana is a small town located in Caddo Parish, Louisiana. It is situated on the banks of the Red River, approximately 20 miles south of Shreveport. The town was founded in 1883 and was originally known as Oil City Station. It was named after the oil industry that was booming in the area at the time. The town has a population of 1,845 as of the 2010 census.
History
Oil City was founded in 1883 by the Oil City Land and Improvement Company. The company was formed by a group of investors who wanted to capitalize on the oil boom that was occurring in the area. The town was originally known as Oil City Station and was located on the Texas and Pacific Railway. The town was incorporated in 1885 and the first mayor was elected in 1886.
The town grew rapidly in the late 19th century due to the oil industry. Oil City was home to several oil refineries and other related businesses. The town also had a large lumber industry, which provided jobs for many of the town’s residents.
In the early 20th century, the oil industry began to decline and the town’s economy shifted to agriculture. The town’s population began to decline as well, and by the 1950s, the population had dropped to just over 1,000.
Geography
Oil City is located in Caddo Parish, Louisiana. It is situated on the banks of the Red River, approximately 20 miles south of Shreveport. The town is located in the northwest corner of the parish and is bordered by the towns of Vivian, Hosston, and Ida.
The town has a total area of 1.3 square miles, all of which is land. The terrain is mostly flat with some rolling hills. The town is located in a humid subtropical climate zone and experiences hot, humid summers and mild winters.
Economy
Oil City’s economy is largely based on agriculture. The town is home to several farms that produce cotton, soybeans, corn, and other crops. The town also has a small manufacturing sector, which produces furniture, clothing, and other goods.
The town also has a small tourism industry. The town is home to several historic sites, including the Oil City Museum and the Oil City Historic District. The town also has several parks and recreational areas, including the Oil City Park and the Oil City Nature Trail.
Demographics
As of the 2010 census, Oil City had a population of 1,845. The racial makeup of the town was 79.3% White, 17.2% African American, 0.7% Native American, 0.3% Asian, 0.1% Pacific Islander, and 2.4% from other races. Hispanic or Latino of any race were 2.7% of the population.
The median household income in Oil City was $31,250, and the median family income was $37,500. The per capita income for the town was $15,945. About 17.2% of the population was below the poverty line.
Conclusion
Oil City, Louisiana is a small town located in Caddo Parish, Louisiana. It was founded in 1883 and was originally known as Oil City Station. The town has a population of 1,845 as of the 2010 census. The town’s economy is largely based on agriculture and manufacturing. The town also has a small tourism industry. The racial makeup of the town is 79.3% White, 17.2% African American, 0.7% Native American, 0.3% Asian, 0.1% Pacific Islander, and 2.4% from other races. The median household income in Oil City was $31,250, and the median family income was $37,500.
Common Questions
What is Per Capita Income in Oil City?
Per Capita income in Oil City is $15,425.
What is the Median Household income in Oil City?
Median Household Income in Oil City is $18,790.
What is Income or Wage Gap in Oil City?
Income or Wage Gap in Oil City is 15.9%.
Women in Oil City earn 84.1 cents for every dollar earned by a man.
What is Inequality or Gini Index in Oil City?
Inequality or Gini Index in Oil City is 0.50.
What is the Total Population of Oil City?
Total Population of Oil City is 1,093.
What is the Total Male Population of Oil City?
Total Male Population of Oil City is 544.
What is the Total Female Population of Oil City?
Total Female Population of Oil City is 549.
What is the Ratio of Males per 100 Females in Oil City?
There are 99.09 Males per 100 Females in Oil City.
What is the Ratio of Females per 100 Males in Oil City?
There are 100.92 Females per 100 Males in Oil City.
What is the Median Population Age in Oil City?
Median Population Age in Oil City is 32.7 Years.
What is the Average Family Size in Oil City
Average Family Size in Oil City is 3.0 People.
What is the Average Household Size in Oil City
Average Household Size in Oil City is 2.1 People.
How Large is the Labor Force in Oil City?
There are 459 People in the Labor Forcein in Oil City.
What is the Percentage of People in the Labor Force in Oil City?
55.0% of People are in the Labor Force in Oil City.
What is the Unemployment Rate in Oil City?
Unemployment Rate in Oil City is 12.9%.