Oak Ridge, LA Map & Demographics
Oak Ridge Map
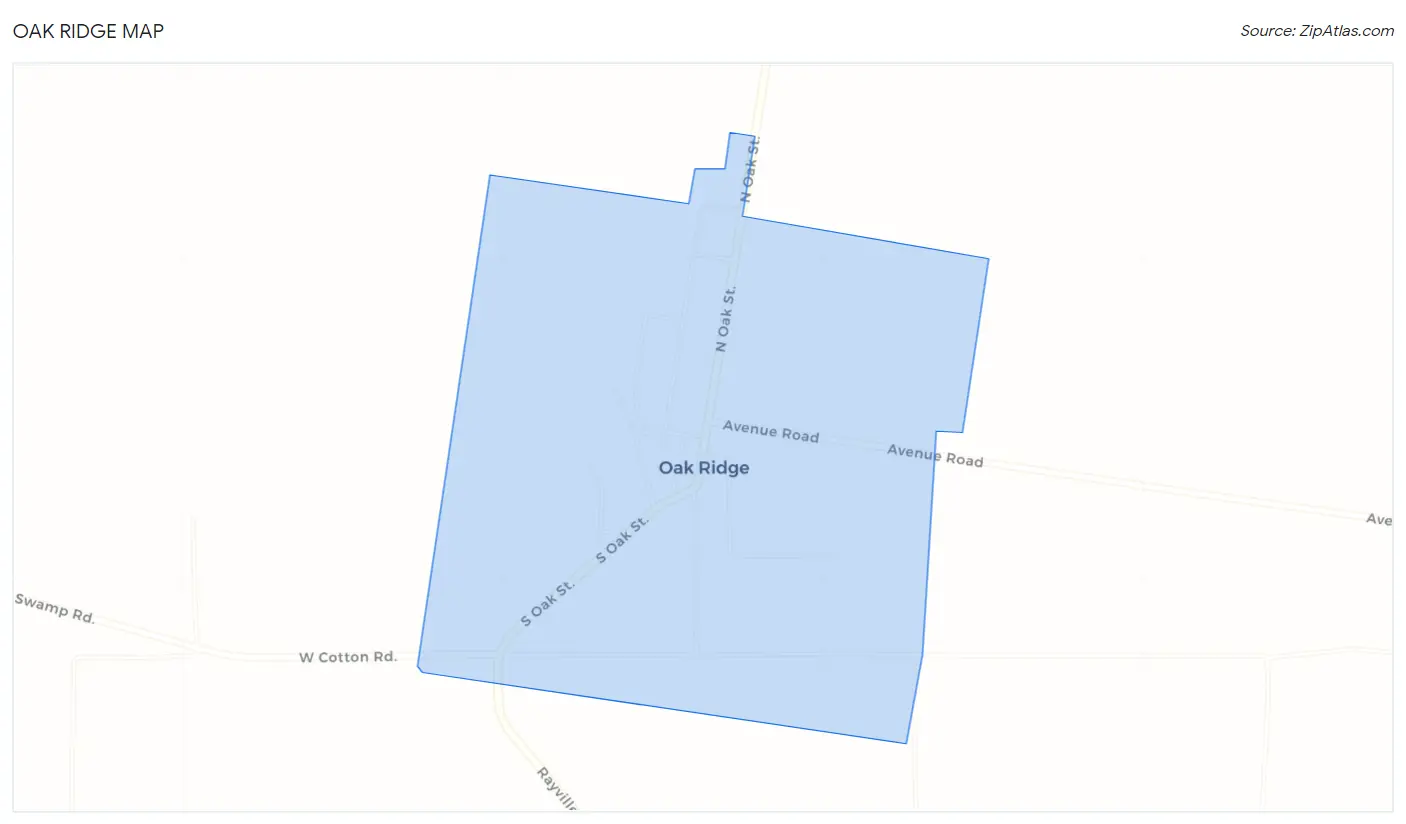
Oak Ridge Overview
$31,215
PER CAPITA INCOME
$102,500
AVG FAMILY INCOME
0.52
INEQUALITY / GINI INDEX
89
TOTAL POPULATION
59
MALE POPULATION
30
FEMALE POPULATION
196.67
MALES / 100 FEMALES
50.85
FEMALES / 100 MALES
58.3
MEDIAN AGE
4.8
AVG FAMILY SIZE
2.0
AVG HOUSEHOLD SIZE
47
LABOR FORCE [ PEOPLE ]
56.6%
PERCENT IN LABOR FORCE
Oak Ridge Zip Codes
Oak Ridge Area Codes
Income in Oak Ridge
Income Overview in Oak Ridge
| Characteristic | Number | Measure |
| Per Capita Income | 89 | $31,215 |
| Median Family Income | 12 | $102,500 |
| Mean Family Income | 12 | $124,742 |
| Median Household Income | 44 | $0 |
| Mean Household Income | 44 | $51,457 |
| Income Deficit | 12 | $0 |
| Wage / Income Gap (%) | 89 | 0.00% |
| Wage / Income Gap ($) | 89 | 100.00¢ per $1 |
| Gini / Inequality Index | 89 | 0.52 |
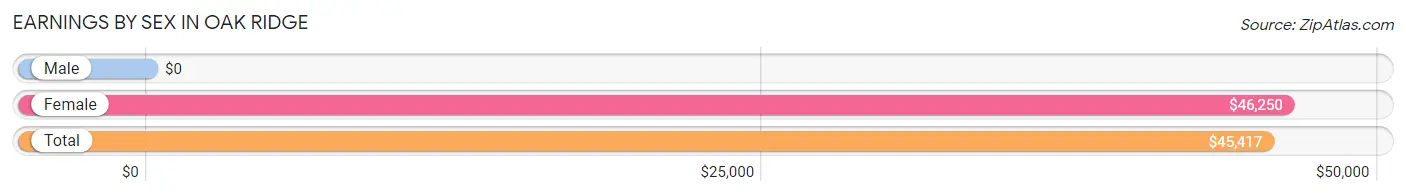
Earnings by Sex in Oak Ridge
| Sex | Number | Average Earnings |
| Male | 34 (72.3%) | $0 |
| Female | 13 (27.7%) | $46,250 |
| Total | 47 (100.0%) | $45,417 |
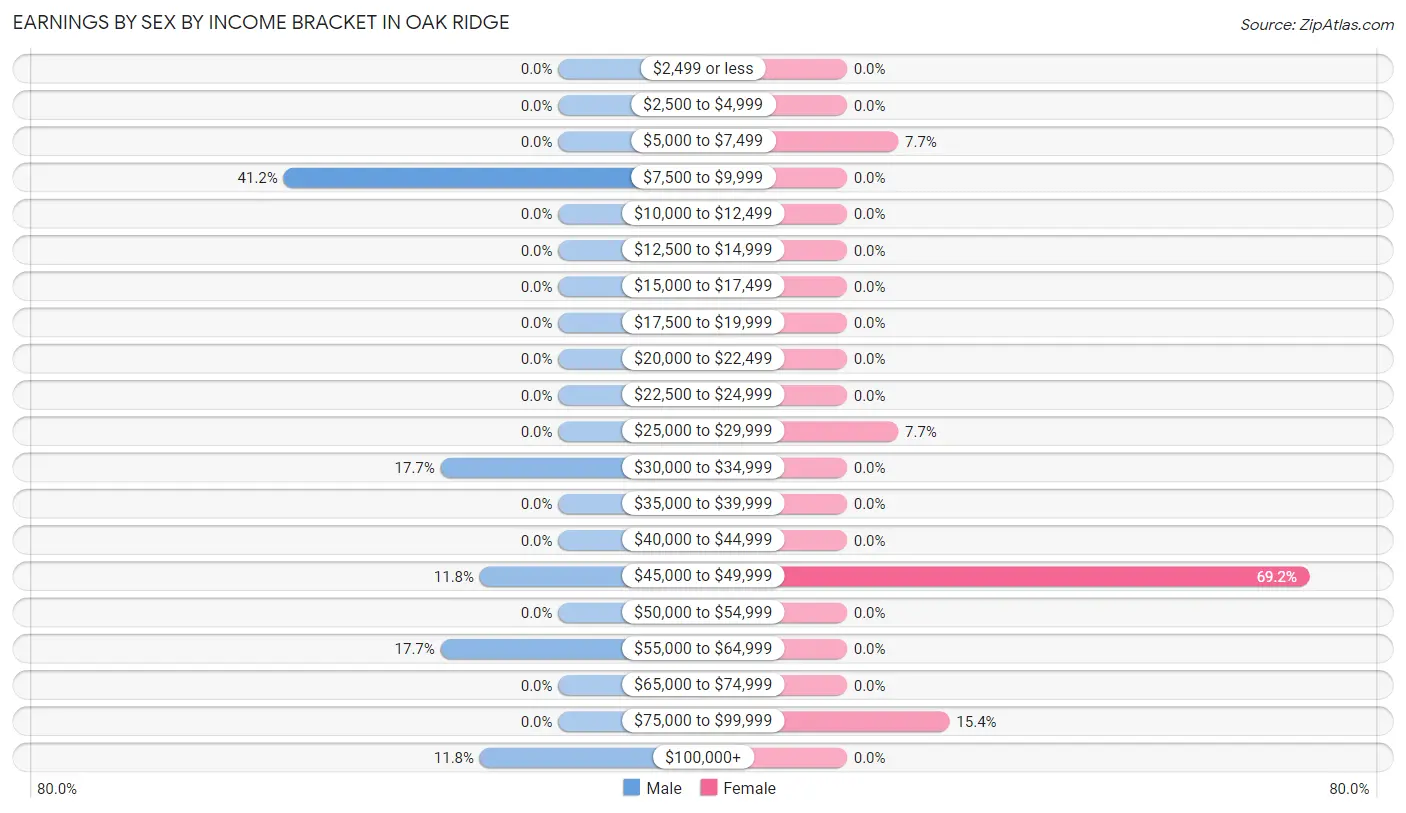
Earnings by Sex by Income Bracket in Oak Ridge
The most common earnings brackets in Oak Ridge are $7,500 to $9,999 for men (14 | 41.2%) and $45,000 to $49,999 for women (9 | 69.2%).
| Income | Male | Female |
| $2,499 or less | 0 (0.0%) | 0 (0.0%) |
| $2,500 to $4,999 | 0 (0.0%) | 0 (0.0%) |
| $5,000 to $7,499 | 0 (0.0%) | 1 (7.7%) |
| $7,500 to $9,999 | 14 (41.2%) | 0 (0.0%) |
| $10,000 to $12,499 | 0 (0.0%) | 0 (0.0%) |
| $12,500 to $14,999 | 0 (0.0%) | 0 (0.0%) |
| $15,000 to $17,499 | 0 (0.0%) | 0 (0.0%) |
| $17,500 to $19,999 | 0 (0.0%) | 0 (0.0%) |
| $20,000 to $22,499 | 0 (0.0%) | 0 (0.0%) |
| $22,500 to $24,999 | 0 (0.0%) | 0 (0.0%) |
| $25,000 to $29,999 | 0 (0.0%) | 1 (7.7%) |
| $30,000 to $34,999 | 6 (17.6%) | 0 (0.0%) |
| $35,000 to $39,999 | 0 (0.0%) | 0 (0.0%) |
| $40,000 to $44,999 | 0 (0.0%) | 0 (0.0%) |
| $45,000 to $49,999 | 4 (11.8%) | 9 (69.2%) |
| $50,000 to $54,999 | 0 (0.0%) | 0 (0.0%) |
| $55,000 to $64,999 | 6 (17.6%) | 0 (0.0%) |
| $65,000 to $74,999 | 0 (0.0%) | 0 (0.0%) |
| $75,000 to $99,999 | 0 (0.0%) | 2 (15.4%) |
| $100,000+ | 4 (11.8%) | 0 (0.0%) |
| Total | 34 (100.0%) | 13 (100.0%) |
Earnings by Sex by Educational Attainment in Oak Ridge
| Educational Attainment | Male Income | Female Income |
| Less than High School | - | - |
| High School Diploma | - | - |
| College or Associate's Degree | - | - |
| Bachelor's Degree | - | - |
| Graduate Degree | - | - |
| Total | - | - |
Family Income in Oak Ridge
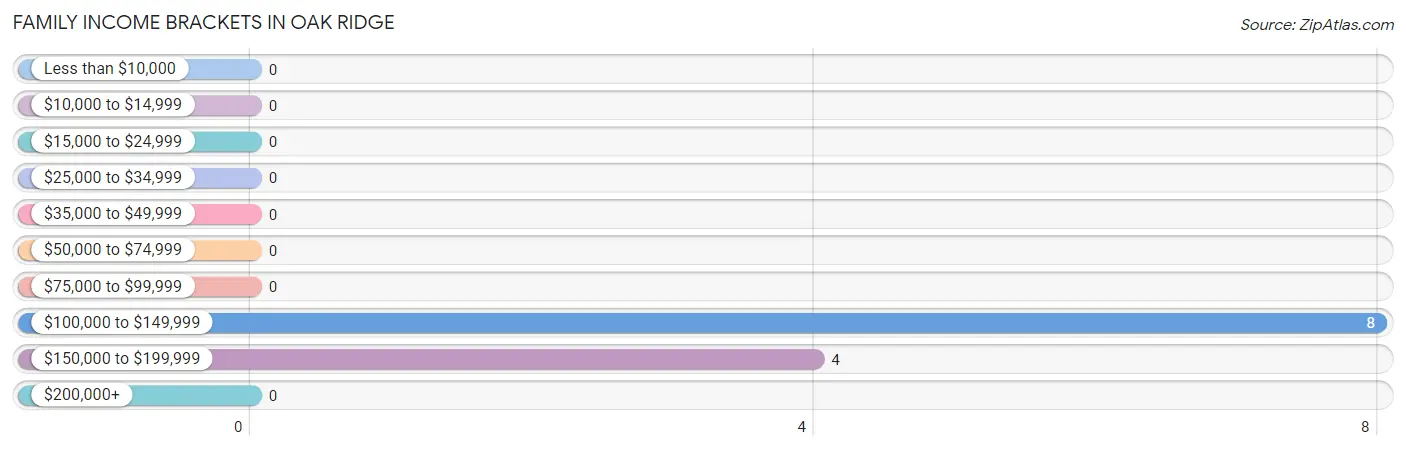
Family Income Brackets in Oak Ridge
According to the Oak Ridge family income data, there are 8 families falling into the $100,000 to $149,999 income range, which is the most common income bracket and makes up 66.7% of all families.
| Income Bracket | # Families | % Families |
| Less than $10,000 | 0 | 0.0% |
| $10,000 to $14,999 | 0 | 0.0% |
| $15,000 to $24,999 | 0 | 0.0% |
| $25,000 to $34,999 | 0 | 0.0% |
| $35,000 to $49,999 | 0 | 0.0% |
| $50,000 to $74,999 | 0 | 0.0% |
| $75,000 to $99,999 | 0 | 0.0% |
| $100,000 to $149,999 | 8 | 66.7% |
| $150,000 to $199,999 | 4 | 33.3% |
| $200,000+ | 0 | 0.0% |
Family Income by Famaliy Size in Oak Ridge
| Income Bracket | # Families | Median Income |
| 2-Person Families | 2 (16.7%) | $0 |
| 3-Person Families | 4 (33.3%) | $0 |
| 4-Person Families | 0 (0.0%) | $0 |
| 5-Person Families | 6 (50.0%) | $0 |
| 6-Person Families | 0 (0.0%) | $0 |
| 7+ Person Families | 0 (0.0%) | $0 |
| Total | 12 (100.0%) | $102,500 |
Family Income by Number of Earners in Oak Ridge
| Number of Earners | # Families | Median Income |
| No Earners | 1 (8.3%) | $0 |
| 1 Earner | 4 (33.3%) | $0 |
| 2 Earners | 6 (50.0%) | $0 |
| 3+ Earners | 1 (8.3%) | $0 |
| Total | 12 (100.0%) | $102,500 |
Household Income in Oak Ridge
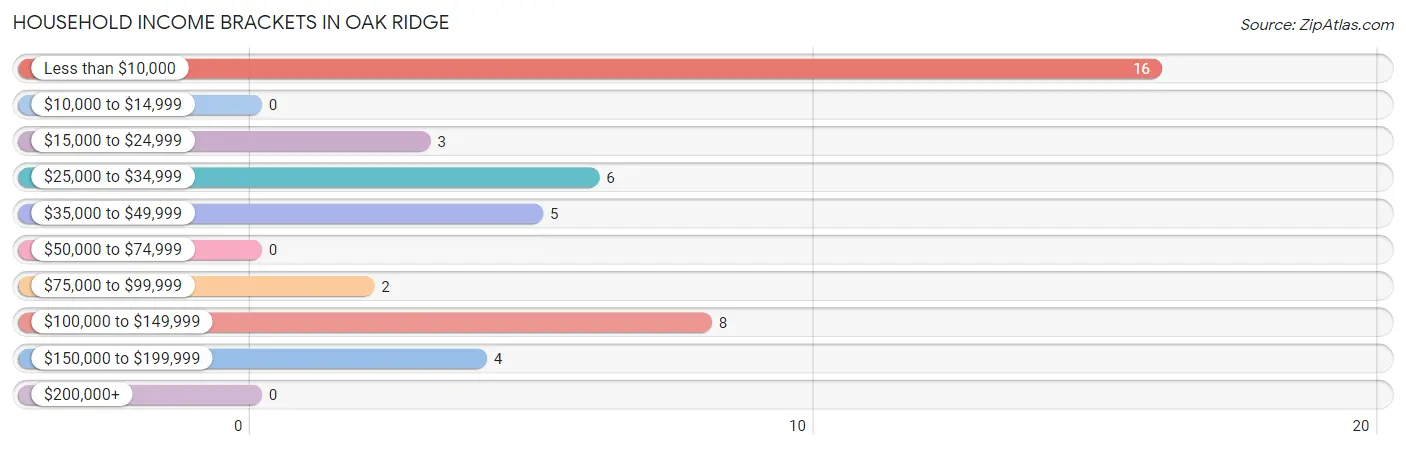
Household Income Brackets in Oak Ridge
With 16 households falling in the category, the less than $10,000 income range is the most frequent in Oak Ridge, accounting for 36.4% of all households.
| Income Bracket | # Households | % Households |
| Less than $10,000 | 16 | 36.4% |
| $10,000 to $14,999 | 0 | 0.0% |
| $15,000 to $24,999 | 3 | 6.8% |
| $25,000 to $34,999 | 6 | 13.6% |
| $35,000 to $49,999 | 5 | 11.4% |
| $50,000 to $74,999 | 0 | 0.0% |
| $75,000 to $99,999 | 2 | 4.5% |
| $100,000 to $149,999 | 8 | 18.2% |
| $150,000 to $199,999 | 4 | 9.1% |
| $200,000+ | 0 | 0.0% |
Household Income by Householder Age in Oak Ridge
The median household income in Oak Ridge is $0, with the highest median household income of $100,208 found in the 45 to 64 years age bracket for the primary householder. A total of 11 households (25.0%) fall into this category.
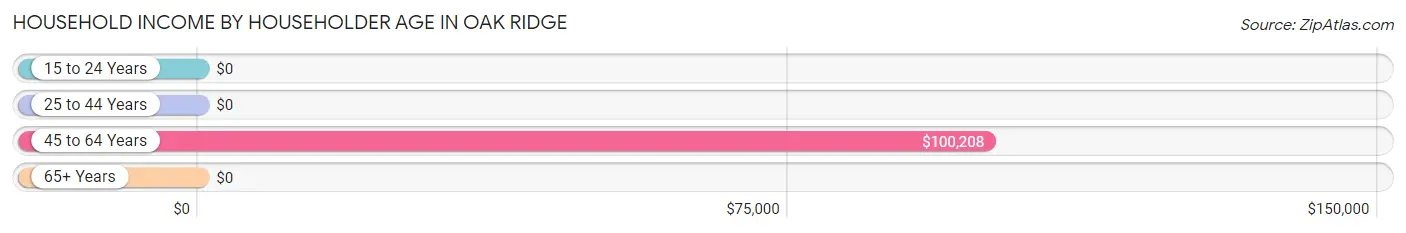
| Income Bracket | # Households | Median Income |
| 15 to 24 Years | 0 (0.0%) | $0 |
| 25 to 44 Years | 18 (40.9%) | $0 |
| 45 to 64 Years | 11 (25.0%) | $100,208 |
| 65+ Years | 15 (34.1%) | $0 |
| Total | 44 (100.0%) | $0 |
Poverty in Oak Ridge
Income Below Poverty by Sex and Age in Oak Ridge
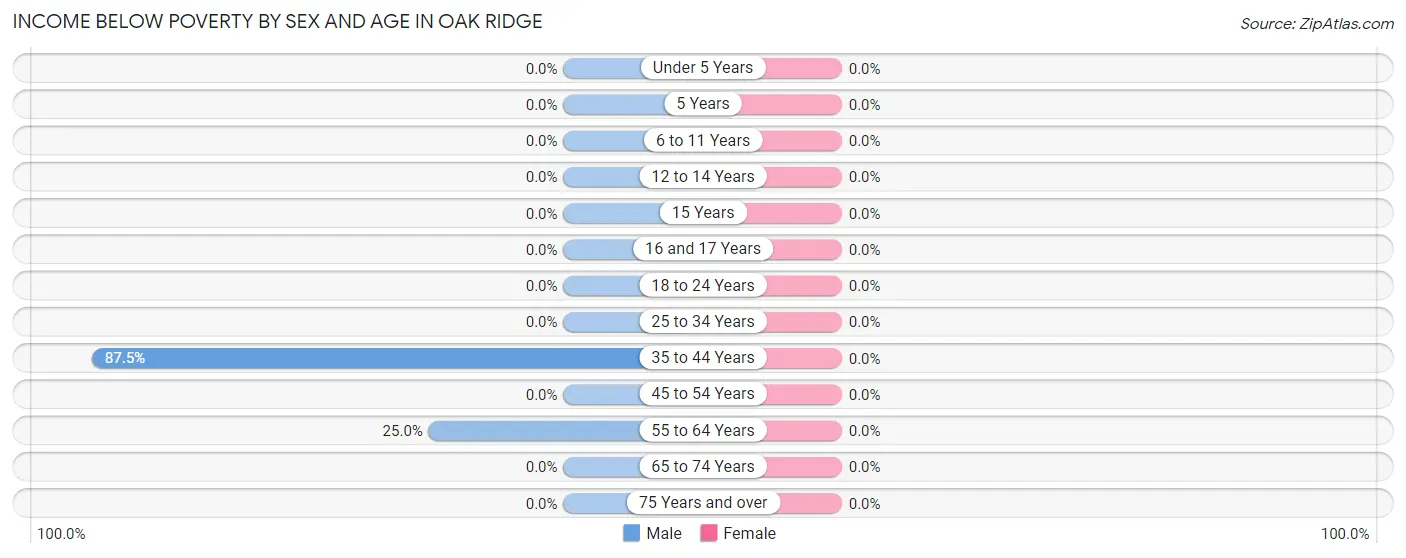
| Age Bracket | Male | Female |
| Under 5 Years | 0 (0.0%) | 0 (0.0%) |
| 5 Years | 0 (0.0%) | 0 (0.0%) |
| 6 to 11 Years | 0 (0.0%) | 0 (0.0%) |
| 12 to 14 Years | 0 (0.0%) | 0 (0.0%) |
| 15 Years | 0 (0.0%) | 0 (0.0%) |
| 16 and 17 Years | 0 (0.0%) | 0 (0.0%) |
| 18 to 24 Years | 0 (0.0%) | 0 (0.0%) |
| 25 to 34 Years | 0 (0.0%) | 0 (0.0%) |
| 35 to 44 Years | 14 (87.5%) | 0 (0.0%) |
| 45 to 54 Years | 0 (0.0%) | 0 (0.0%) |
| 55 to 64 Years | 2 (25.0%) | 0 (0.0%) |
| 65 to 74 Years | 0 (0.0%) | 0 (0.0%) |
| 75 Years and over | 0 (0.0%) | 0 (0.0%) |
| Total | 16 (27.1%) | 0 (0.0%) |
Income Above Poverty by Sex and Age in Oak Ridge
According to the poverty statistics in Oak Ridge, males aged 16 and 17 years and females aged 6 to 11 years are the age groups that are most secure financially, with 100.0% of males and 100.0% of females in these age groups living above the poverty line.
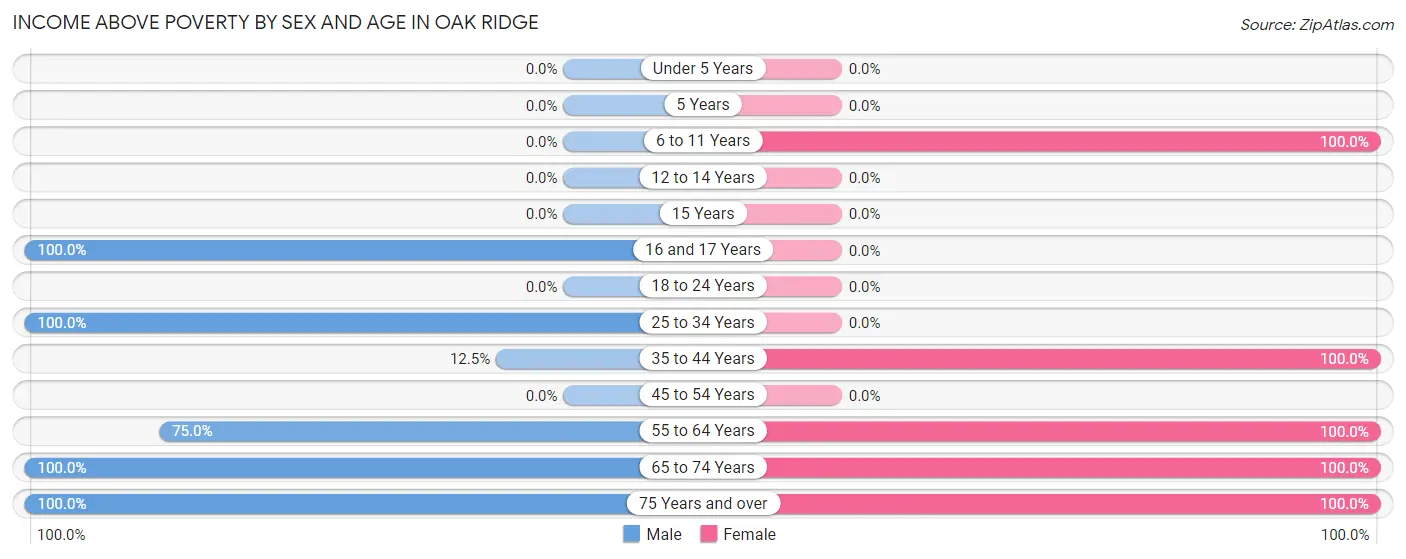
| Age Bracket | Male | Female |
| Under 5 Years | 0 (0.0%) | 0 (0.0%) |
| 5 Years | 0 (0.0%) | 0 (0.0%) |
| 6 to 11 Years | 0 (0.0%) | 6 (100.0%) |
| 12 to 14 Years | 0 (0.0%) | 0 (0.0%) |
| 15 Years | 0 (0.0%) | 0 (0.0%) |
| 16 and 17 Years | 3 (100.0%) | 0 (0.0%) |
| 18 to 24 Years | 0 (0.0%) | 0 (0.0%) |
| 25 to 34 Years | 4 (100.0%) | 0 (0.0%) |
| 35 to 44 Years | 2 (12.5%) | 9 (100.0%) |
| 45 to 54 Years | 0 (0.0%) | 0 (0.0%) |
| 55 to 64 Years | 6 (75.0%) | 8 (100.0%) |
| 65 to 74 Years | 8 (100.0%) | 5 (100.0%) |
| 75 Years and over | 20 (100.0%) | 2 (100.0%) |
| Total | 43 (72.9%) | 30 (100.0%) |
Income Below Poverty Among Married-Couple Families in Oak Ridge
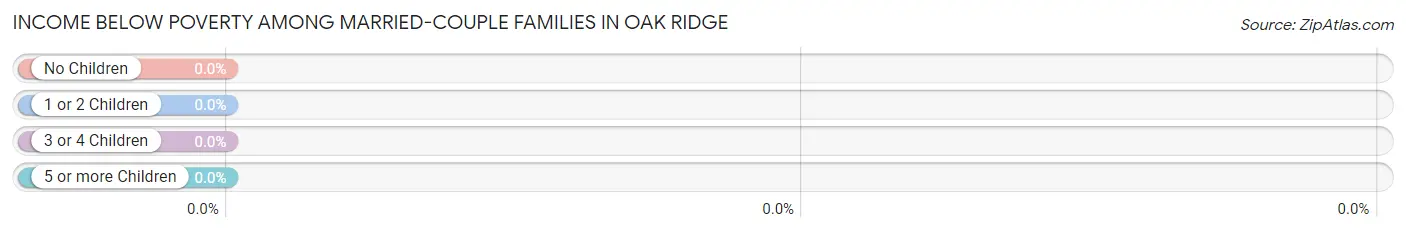
| Children | Above Poverty | Below Poverty |
| No Children | 6 (100.0%) | 0 (0.0%) |
| 1 or 2 Children | 6 (100.0%) | 0 (0.0%) |
| 3 or 4 Children | 0 (0.0%) | 0 (0.0%) |
| 5 or more Children | 0 (0.0%) | 0 (0.0%) |
| Total | 12 (100.0%) | 0 (0.0%) |
Income Below Poverty Among Single-Parent Households in Oak Ridge
| Children | Single Father | Single Mother |
| No Children | 0 (0.0%) | 0 (0.0%) |
| 1 or 2 Children | 0 (0.0%) | 0 (0.0%) |
| 3 or 4 Children | 0 (0.0%) | 0 (0.0%) |
| 5 or more Children | 0 (0.0%) | 0 (0.0%) |
| Total | 0 (0.0%) | 0 (0.0%) |
Income Below Poverty Among Married-Couple vs Single-Parent Households in Oak Ridge
| Children | Married-Couple Families | Single-Parent Households |
| No Children | 0 (0.0%) | 0 (0.0%) |
| 1 or 2 Children | 0 (0.0%) | 0 (0.0%) |
| 3 or 4 Children | 0 (0.0%) | 0 (0.0%) |
| 5 or more Children | 0 (0.0%) | 0 (0.0%) |
| Total | 0 (0.0%) | 0 (0.0%) |
Race in Oak Ridge
The most populous races in Oak Ridge are White / Caucasian (62 | 69.7%), Black / African American (20 | 22.5%), and Two or more Races (7 | 7.9%).
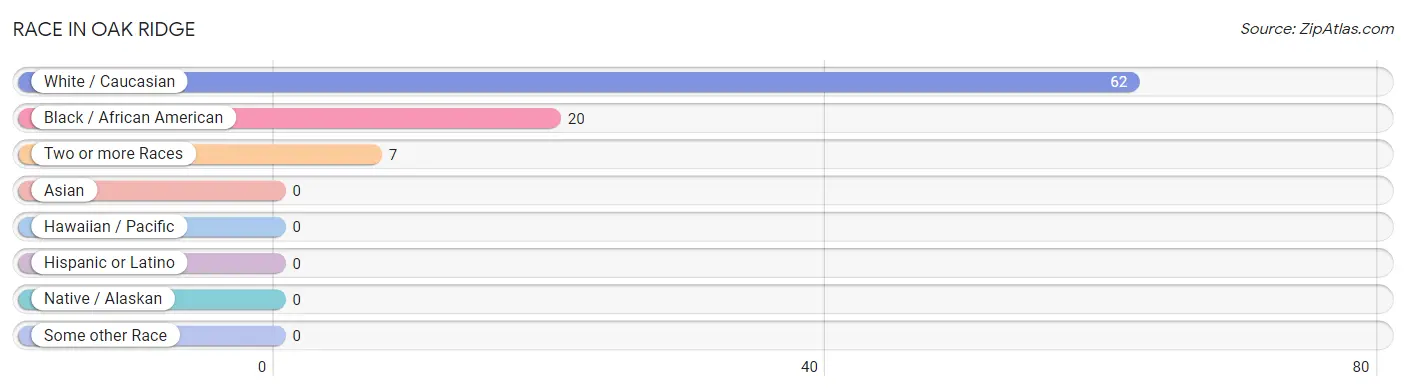
| Race | # Population | % Population |
| Asian | 0 | 0.0% |
| Black / African American | 20 | 22.5% |
| Hawaiian / Pacific | 0 | 0.0% |
| Hispanic or Latino | 0 | 0.0% |
| Native / Alaskan | 0 | 0.0% |
| White / Caucasian | 62 | 69.7% |
| Two or more Races | 7 | 7.9% |
| Some other Race | 0 | 0.0% |
| Total | 89 | 100.0% |
Ancestry in Oak Ridge
The most populous ancestries reported in Oak Ridge are French (25 | 28.1%), American (19 | 21.3%), English (6 | 6.7%), Irish (4 | 4.5%), and Scottish (2 | 2.2%), together accounting for 62.9% of all Oak Ridge residents.
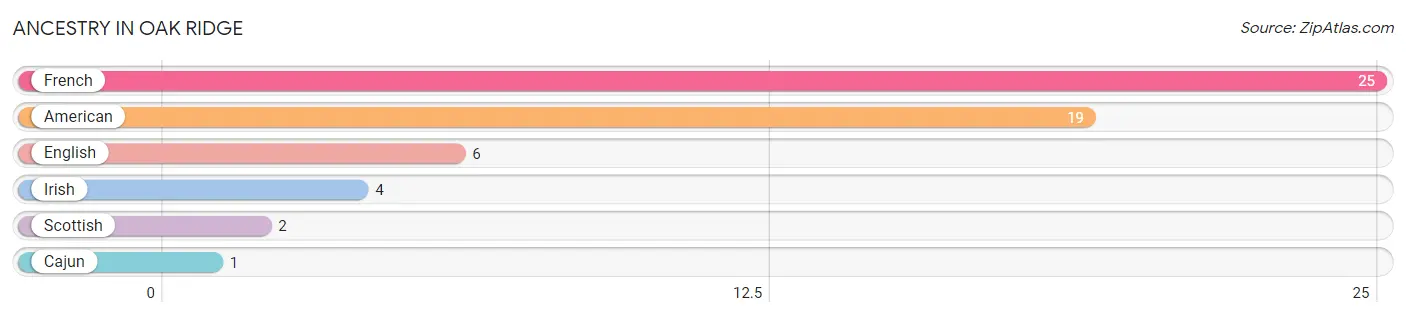
| Ancestry | # Population | % Population |
| American | 19 | 21.3% |
| Cajun | 1 | 1.1% |
| English | 6 | 6.7% |
| French | 25 | 28.1% |
| Irish | 4 | 4.5% |
| Scottish | 2 | 2.2% | View All 6 Rows |
Immigrants in Oak Ridge

| Immigration Origin | # Population | % Population | View All 0 Rows |
Sex and Age in Oak Ridge
Sex and Age in Oak Ridge
The most populous age groups in Oak Ridge are 85 Years and over (15 | 25.4%) for men and 35 to 39 Years (9 | 30.0%) for women.
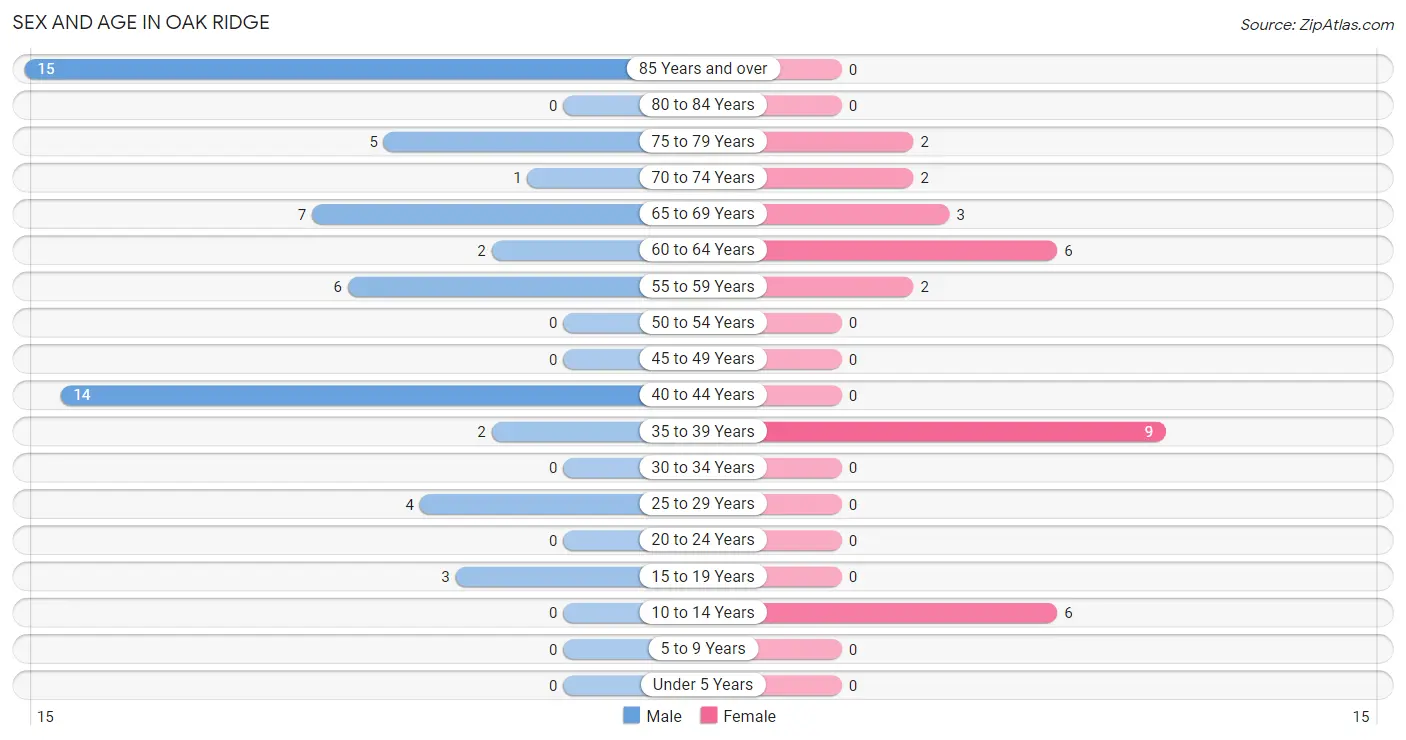
| Age Bracket | Male | Female |
| Under 5 Years | 0 (0.0%) | 0 (0.0%) |
| 5 to 9 Years | 0 (0.0%) | 0 (0.0%) |
| 10 to 14 Years | 0 (0.0%) | 6 (20.0%) |
| 15 to 19 Years | 3 (5.1%) | 0 (0.0%) |
| 20 to 24 Years | 0 (0.0%) | 0 (0.0%) |
| 25 to 29 Years | 4 (6.8%) | 0 (0.0%) |
| 30 to 34 Years | 0 (0.0%) | 0 (0.0%) |
| 35 to 39 Years | 2 (3.4%) | 9 (30.0%) |
| 40 to 44 Years | 14 (23.7%) | 0 (0.0%) |
| 45 to 49 Years | 0 (0.0%) | 0 (0.0%) |
| 50 to 54 Years | 0 (0.0%) | 0 (0.0%) |
| 55 to 59 Years | 6 (10.2%) | 2 (6.7%) |
| 60 to 64 Years | 2 (3.4%) | 6 (20.0%) |
| 65 to 69 Years | 7 (11.9%) | 3 (10.0%) |
| 70 to 74 Years | 1 (1.7%) | 2 (6.7%) |
| 75 to 79 Years | 5 (8.5%) | 2 (6.7%) |
| 80 to 84 Years | 0 (0.0%) | 0 (0.0%) |
| 85 Years and over | 15 (25.4%) | 0 (0.0%) |
| Total | 59 (100.0%) | 30 (100.0%) |
Families and Households in Oak Ridge
Median Family Size in Oak Ridge
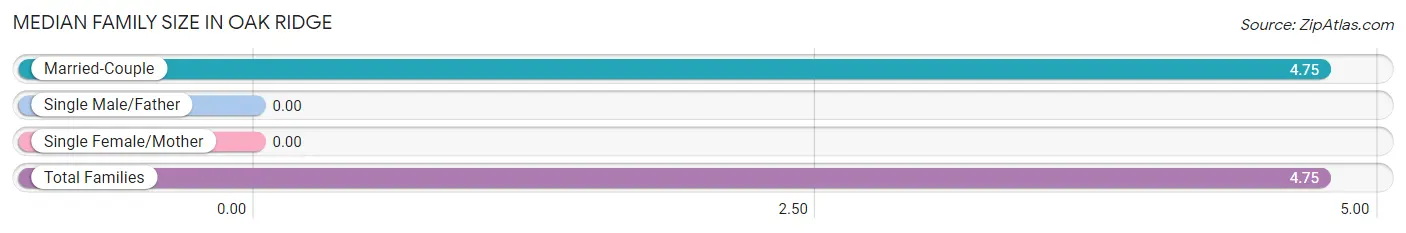
| Family Type | # Families | Family Size |
| Married-Couple | 12 (100.0%) | 4.75 |
| Single Male/Father | 0 (0.0%) | - |
| Single Female/Mother | 0 (0.0%) | - |
| Total Families | 12 (100.0%) | 4.75 |
Median Household Size in Oak Ridge
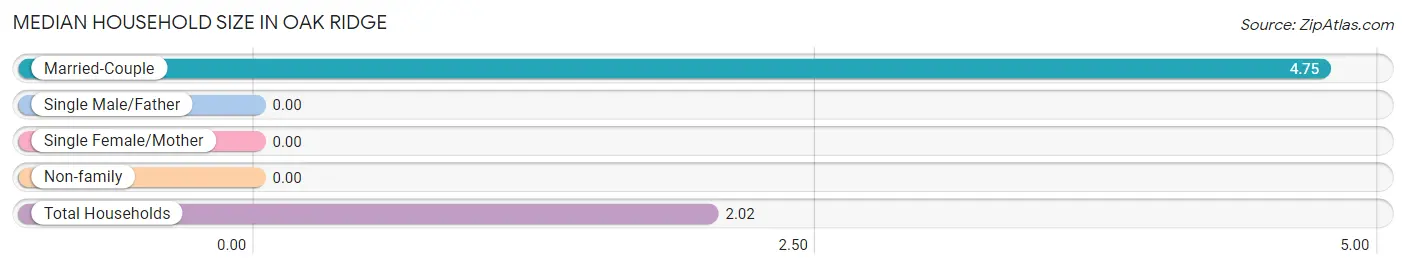
| Household Type | # Households | Household Size |
| Married-Couple | 12 (27.3%) | 4.75 |
| Single Male/Father | 0 (0.0%) | - |
| Single Female/Mother | 0 (0.0%) | - |
| Non-family | 32 (72.7%) | - |
| Total Households | 44 (100.0%) | 2.02 |
Household Size by Marriage Status in Oak Ridge
Out of a total of 44 households in Oak Ridge, 12 (27.3%) are family households, while 32 (72.7%) are nonfamily households. The most numerous type of family households are 5-person households, comprising 6, and the most common type of nonfamily households are 1-person households, comprising 32.
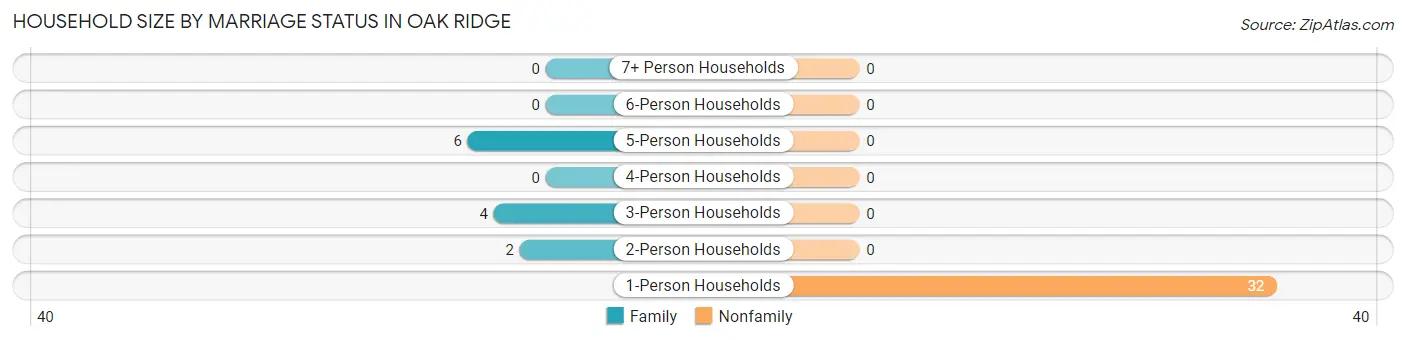
| Household Size | Family Households | Nonfamily Households |
| 1-Person Households | - | 32 (72.7%) |
| 2-Person Households | 2 (4.5%) | 0 (0.0%) |
| 3-Person Households | 4 (9.1%) | 0 (0.0%) |
| 4-Person Households | 0 (0.0%) | 0 (0.0%) |
| 5-Person Households | 6 (13.6%) | 0 (0.0%) |
| 6-Person Households | 0 (0.0%) | 0 (0.0%) |
| 7+ Person Households | 0 (0.0%) | 0 (0.0%) |
| Total | 12 (27.3%) | 32 (72.7%) |
Female Fertility in Oak Ridge
Fertility by Age in Oak Ridge
| Age Bracket | Women with Births | Births / 1,000 Women |
| 15 to 19 years | 0 (0.0%) | 0.0 |
| 20 to 34 years | 0 (0.0%) | 0.0 |
| 35 to 50 years | 0 (0.0%) | 0.0 |
| Total | 0 (0.0%) | 0.0 |
Fertility by Age by Marriage Status in Oak Ridge
| Age Bracket | Married | Unmarried |
| 15 to 19 years | 0 (0.0%) | 0 (0.0%) |
| 20 to 34 years | 0 (0.0%) | 0 (0.0%) |
| 35 to 50 years | 0 (0.0%) | 0 (0.0%) |
| Total | 0 (0.0%) | 0 (0.0%) |
Fertility by Education in Oak Ridge
| Educational Attainment | Women with Births | Births / 1,000 Women |
| Less than High School | 0 (0.0%) | 0.0 |
| High School Diploma | 0 (0.0%) | 0.0 |
| College or Associate's Degree | 0 (0.0%) | 0.0 |
| Bachelor's Degree | 0 (0.0%) | 0.0 |
| Graduate Degree | 0 (0.0%) | 0.0 |
| Total | 0 (0.0%) | 0.0 |
Fertility by Education by Marriage Status in Oak Ridge
| Educational Attainment | Married | Unmarried |
| Less than High School | 0 (0.0%) | 0 (0.0%) |
| High School Diploma | 0 (0.0%) | 0 (0.0%) |
| College or Associate's Degree | 0 (0.0%) | 0 (0.0%) |
| Bachelor's Degree | 0 (0.0%) | 0 (0.0%) |
| Graduate Degree | 0 (0.0%) | 0 (0.0%) |
| Total | 0 (0.0%) | 0 (0.0%) |
Employment Characteristics in Oak Ridge
Employment by Class of Employer in Oak Ridge
Among the 47 employed individuals in Oak Ridge, private company employees (28 | 59.6%), not-for-profit organizations (10 | 21.3%), and state government employees (6 | 12.8%) make up the most common classes of employment.
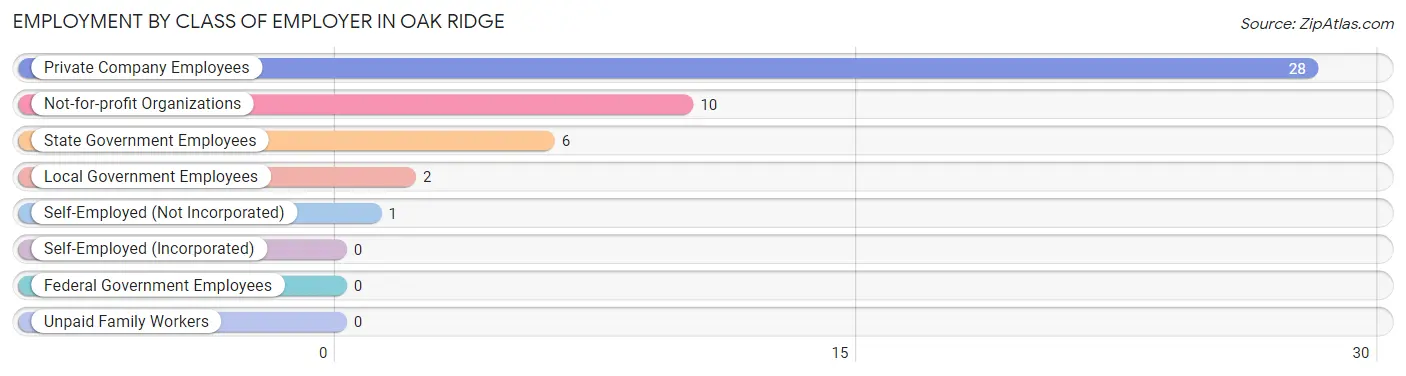
| Employer Class | # Employees | % Employees |
| Private Company Employees | 28 | 59.6% |
| Self-Employed (Incorporated) | 0 | 0.0% |
| Self-Employed (Not Incorporated) | 1 | 2.1% |
| Not-for-profit Organizations | 10 | 21.3% |
| Local Government Employees | 2 | 4.3% |
| State Government Employees | 6 | 12.8% |
| Federal Government Employees | 0 | 0.0% |
| Unpaid Family Workers | 0 | 0.0% |
| Total | 47 | 100.0% |
Employment Status by Age in Oak Ridge
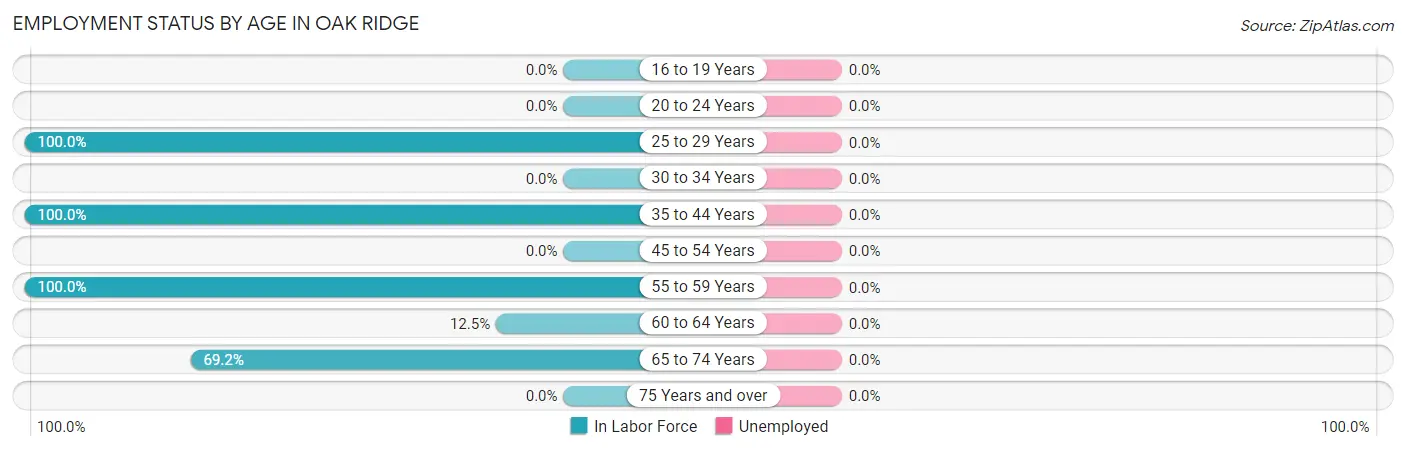
| Age Bracket | In Labor Force | Unemployed |
| 16 to 19 Years | 0 (0.0%) | 0 (0.0%) |
| 20 to 24 Years | 0 (0.0%) | 0 (0.0%) |
| 25 to 29 Years | 4 (100.0%) | 0 (0.0%) |
| 30 to 34 Years | 0 (0.0%) | 0 (0.0%) |
| 35 to 44 Years | 25 (100.0%) | 0 (0.0%) |
| 45 to 54 Years | 0 (0.0%) | 0 (0.0%) |
| 55 to 59 Years | 8 (100.0%) | 0 (0.0%) |
| 60 to 64 Years | 1 (12.5%) | 0 (0.0%) |
| 65 to 74 Years | 9 (69.2%) | 0 (0.0%) |
| 75 Years and over | 0 (0.0%) | 0 (0.0%) |
| Total | 47 (56.6%) | 0 (0.0%) |
Employment Status by Educational Attainment in Oak Ridge
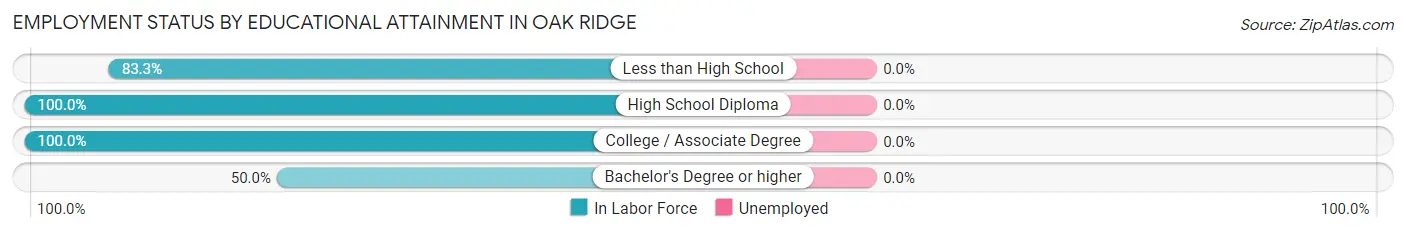
| Educational Attainment | In Labor Force | Unemployed |
| Less than High School | 25 (83.3%) | 0 (0.0%) |
| High School Diploma | 6 (100.0%) | 0 (0.0%) |
| College / Associate Degree | 5 (100.0%) | 0 (0.0%) |
| Bachelor's Degree or higher | 2 (50.0%) | 0 (0.0%) |
| Total | 38 (84.4%) | 0 (0.0%) |
Employment Occupations by Sex in Oak Ridge
Management, Business, Science and Arts Occupations
The most common Management, Business, Science and Arts occupations in Oak Ridge are Community & Social Service (14 | 29.8%), Education, Arts & Media (11 | 23.4%), Management (8 | 17.0%), Education Instruction & Library (2 | 4.3%), and Arts, Media & Entertainment (1 | 2.1%).
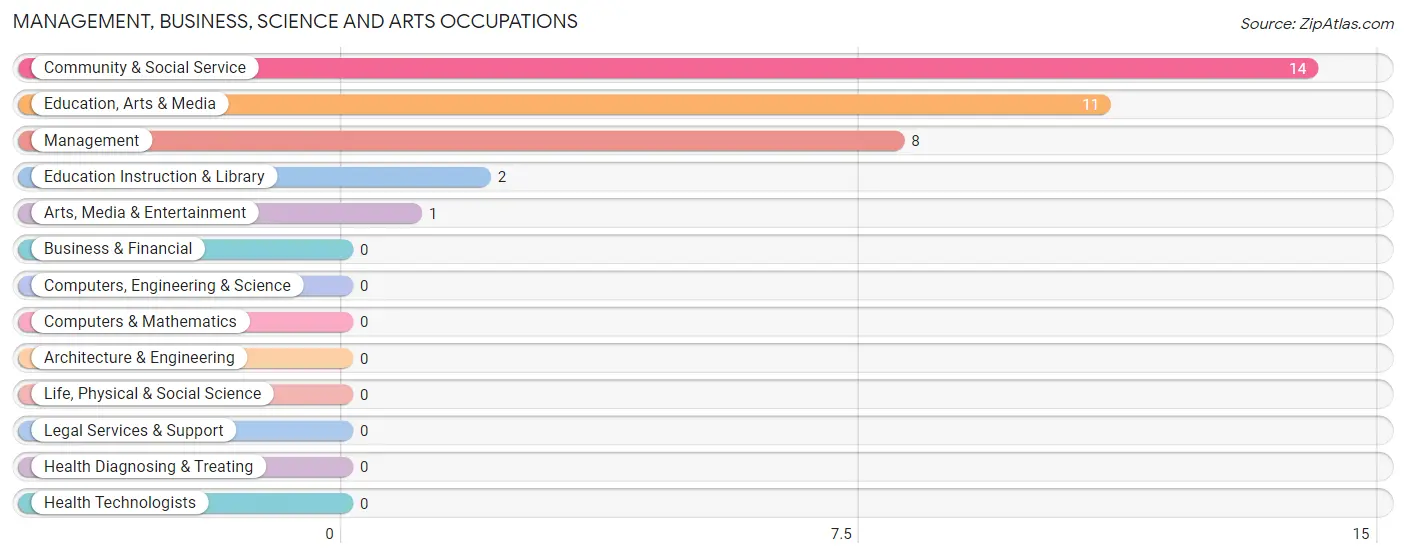
Management, Business, Science and Arts Occupations by Sex
Within the Management, Business, Science and Arts occupations in Oak Ridge, the most male-oriented occupations are Management (100.0%), Education Instruction & Library (100.0%), and Community & Social Service (14.3%), while the most female-oriented occupations are Education, Arts & Media (100.0%), Arts, Media & Entertainment (100.0%), and Community & Social Service (85.7%).
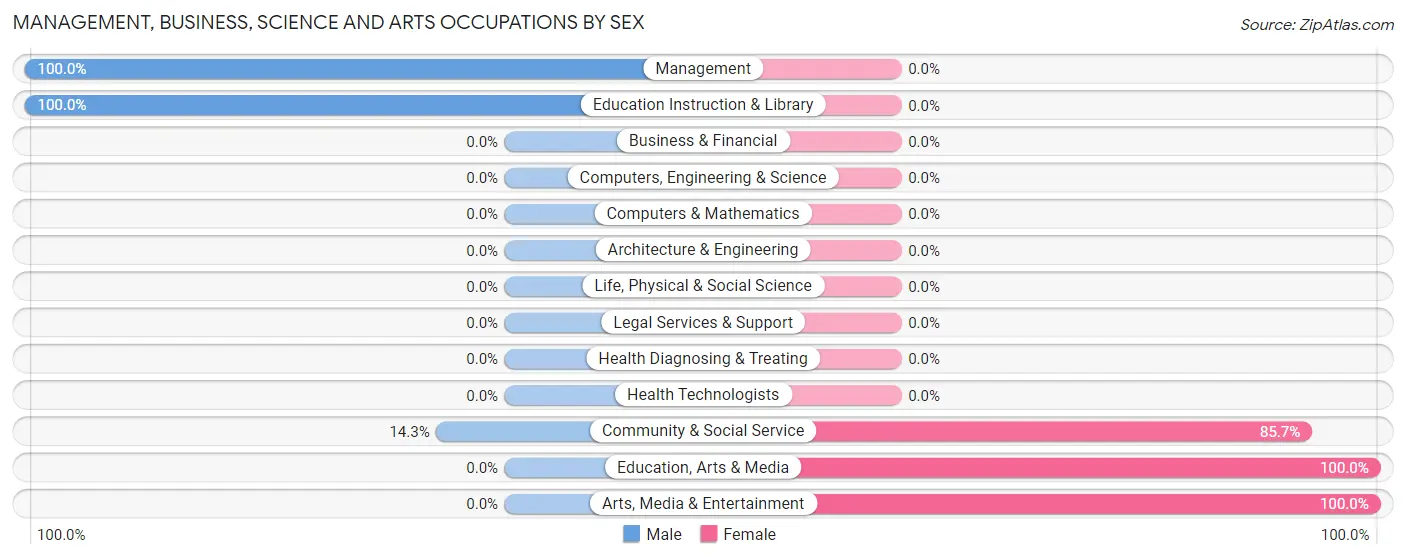
| Occupation | Male | Female |
| Management | 8 (100.0%) | 0 (0.0%) |
| Business & Financial | 0 (0.0%) | 0 (0.0%) |
| Computers, Engineering & Science | 0 (0.0%) | 0 (0.0%) |
| Computers & Mathematics | 0 (0.0%) | 0 (0.0%) |
| Architecture & Engineering | 0 (0.0%) | 0 (0.0%) |
| Life, Physical & Social Science | 0 (0.0%) | 0 (0.0%) |
| Community & Social Service | 2 (14.3%) | 12 (85.7%) |
| Education, Arts & Media | 0 (0.0%) | 11 (100.0%) |
| Legal Services & Support | 0 (0.0%) | 0 (0.0%) |
| Education Instruction & Library | 2 (100.0%) | 0 (0.0%) |
| Arts, Media & Entertainment | 0 (0.0%) | 1 (100.0%) |
| Health Diagnosing & Treating | 0 (0.0%) | 0 (0.0%) |
| Health Technologists | 0 (0.0%) | 0 (0.0%) |
| Total (Category) | 10 (45.5%) | 12 (54.5%) |
| Total (Overall) | 34 (72.3%) | 13 (27.7%) |
Services Occupations
The most common Services occupations in Oak Ridge are Security & Protection (1 | 2.1%), and Firefighting & Prevention (1 | 2.1%).
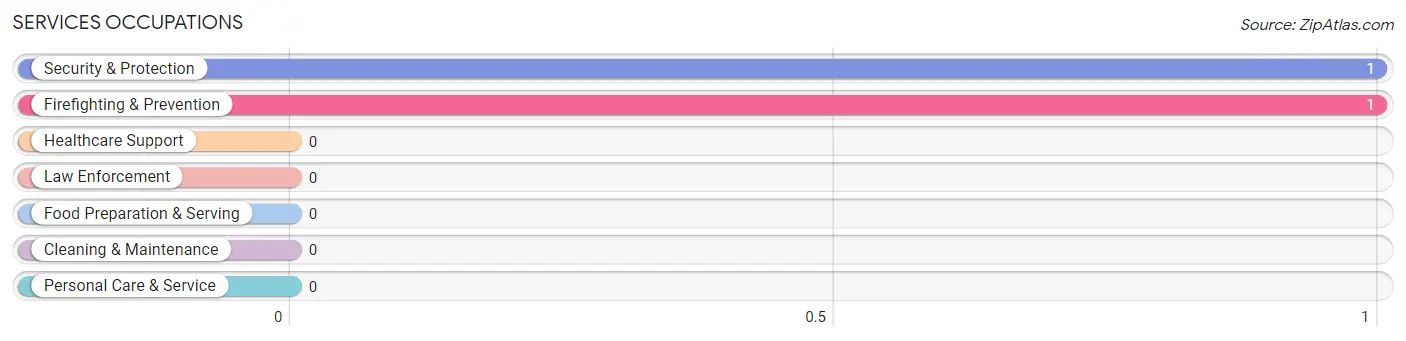
Services Occupations by Sex
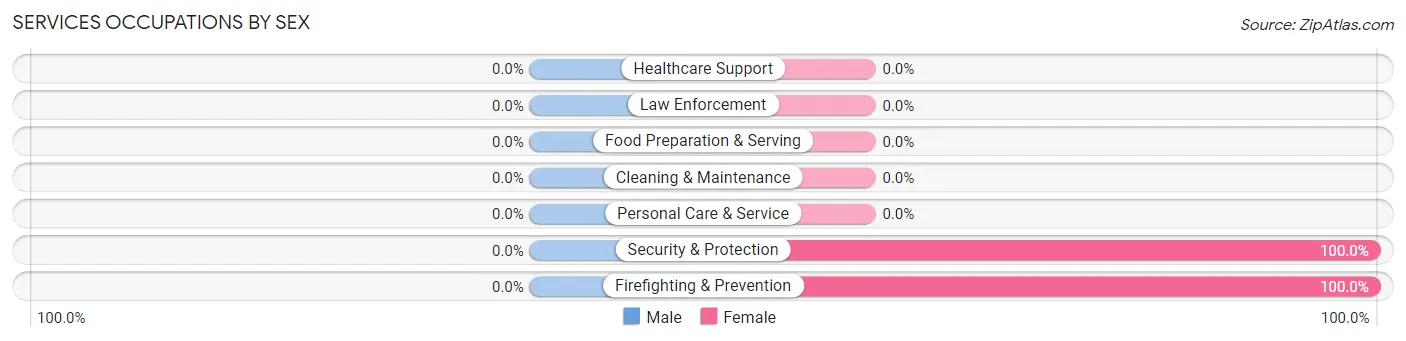
| Occupation | Male | Female |
| Healthcare Support | 0 (0.0%) | 0 (0.0%) |
| Security & Protection | 0 (0.0%) | 1 (100.0%) |
| Firefighting & Prevention | 0 (0.0%) | 1 (100.0%) |
| Law Enforcement | 0 (0.0%) | 0 (0.0%) |
| Food Preparation & Serving | 0 (0.0%) | 0 (0.0%) |
| Cleaning & Maintenance | 0 (0.0%) | 0 (0.0%) |
| Personal Care & Service | 0 (0.0%) | 0 (0.0%) |
| Total (Category) | 0 (0.0%) | 1 (100.0%) |
| Total (Overall) | 34 (72.3%) | 13 (27.7%) |
Sales and Office Occupations
The most common Sales and Office occupations in Oak Ridge are Sales & Related (6 | 12.8%), and Office & Administration (4 | 8.5%).
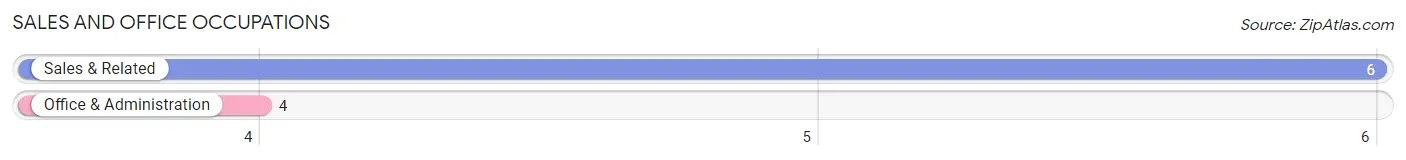
Sales and Office Occupations by Sex

| Occupation | Male | Female |
| Sales & Related | 6 (100.0%) | 0 (0.0%) |
| Office & Administration | 4 (100.0%) | 0 (0.0%) |
| Total (Category) | 10 (100.0%) | 0 (0.0%) |
| Total (Overall) | 34 (72.3%) | 13 (27.7%) |
Natural Resources, Construction and Maintenance Occupations
The most common Natural Resources, Construction and Maintenance occupations in Oak Ridge are , and Farming, Fishing & Forestry (14 | 29.8%).
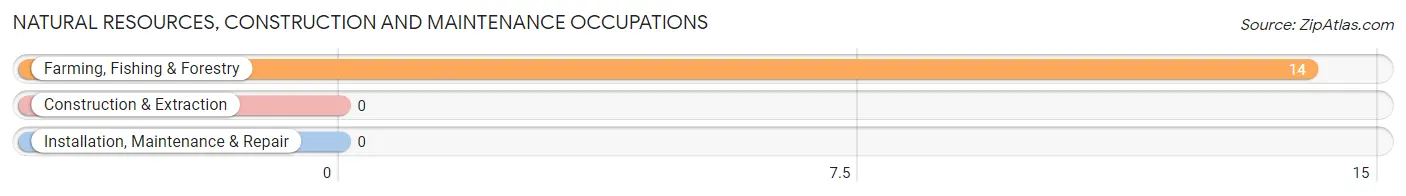
Natural Resources, Construction and Maintenance Occupations by Sex

| Occupation | Male | Female |
| Farming, Fishing & Forestry | 14 (100.0%) | 0 (0.0%) |
| Construction & Extraction | 0 (0.0%) | 0 (0.0%) |
| Installation, Maintenance & Repair | 0 (0.0%) | 0 (0.0%) |
| Total (Category) | 14 (100.0%) | 0 (0.0%) |
| Total (Overall) | 34 (72.3%) | 13 (27.7%) |
Production, Transportation and Moving Occupations
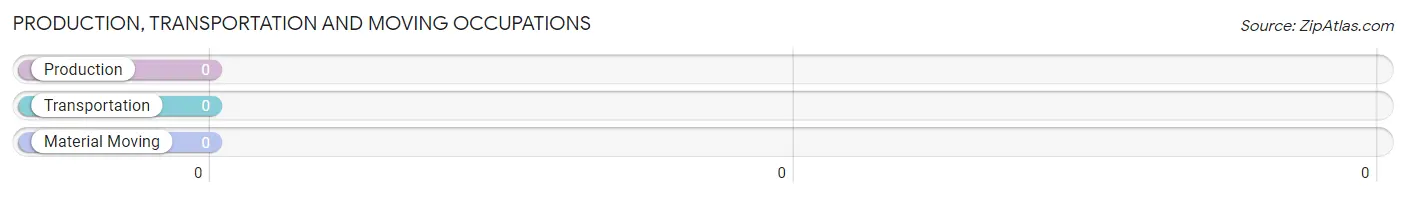
Production, Transportation and Moving Occupations by Sex
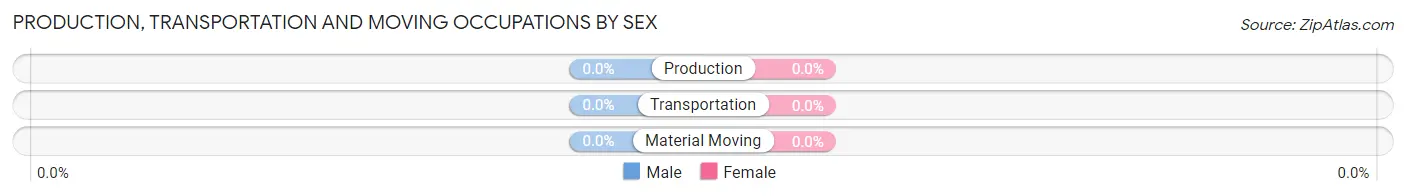
| Occupation | Male | Female |
| Production | 0 (0.0%) | 0 (0.0%) |
| Transportation | 0 (0.0%) | 0 (0.0%) |
| Material Moving | 0 (0.0%) | 0 (0.0%) |
| Total (Category) | 0 (0.0%) | 0 (0.0%) |
| Total (Overall) | 34 (72.3%) | 13 (27.7%) |
Employment Industries by Sex in Oak Ridge
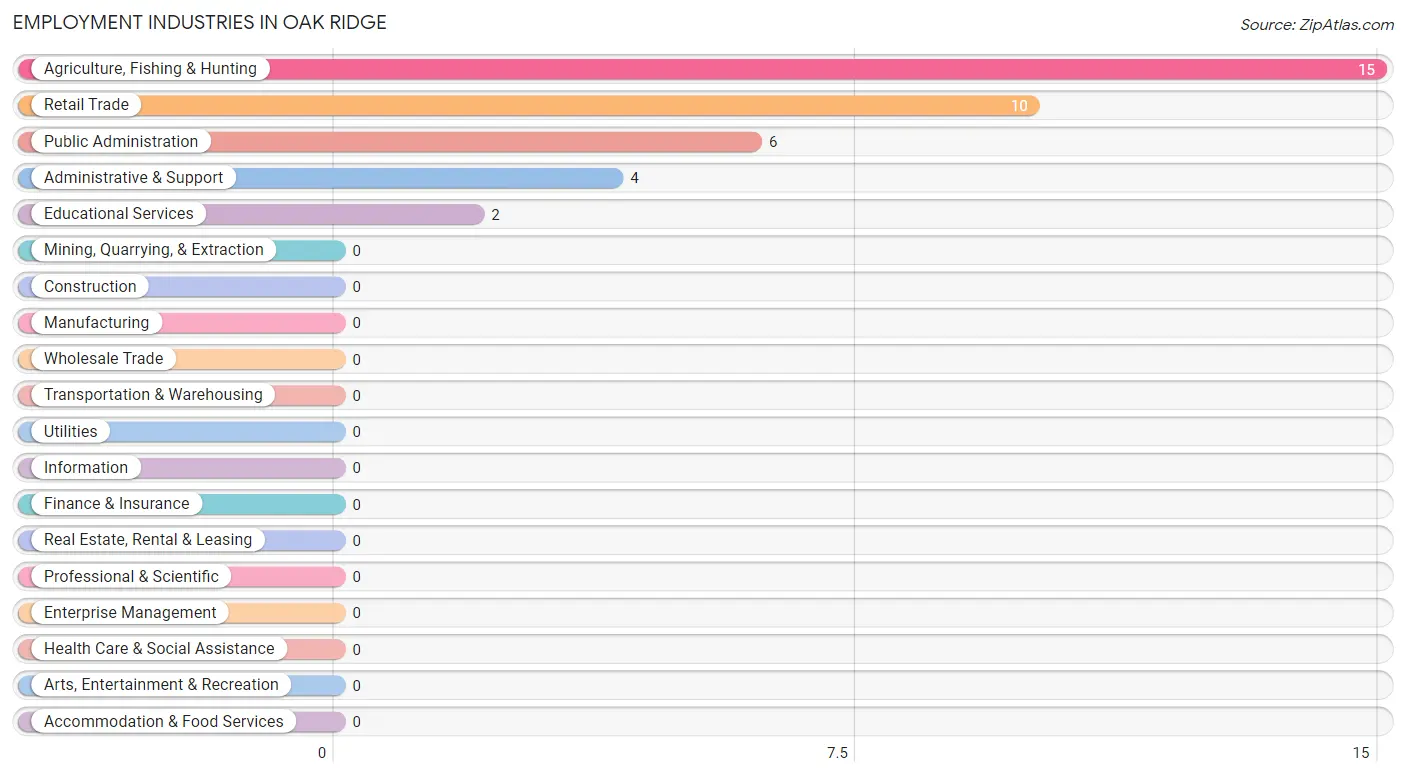
Employment Industries in Oak Ridge
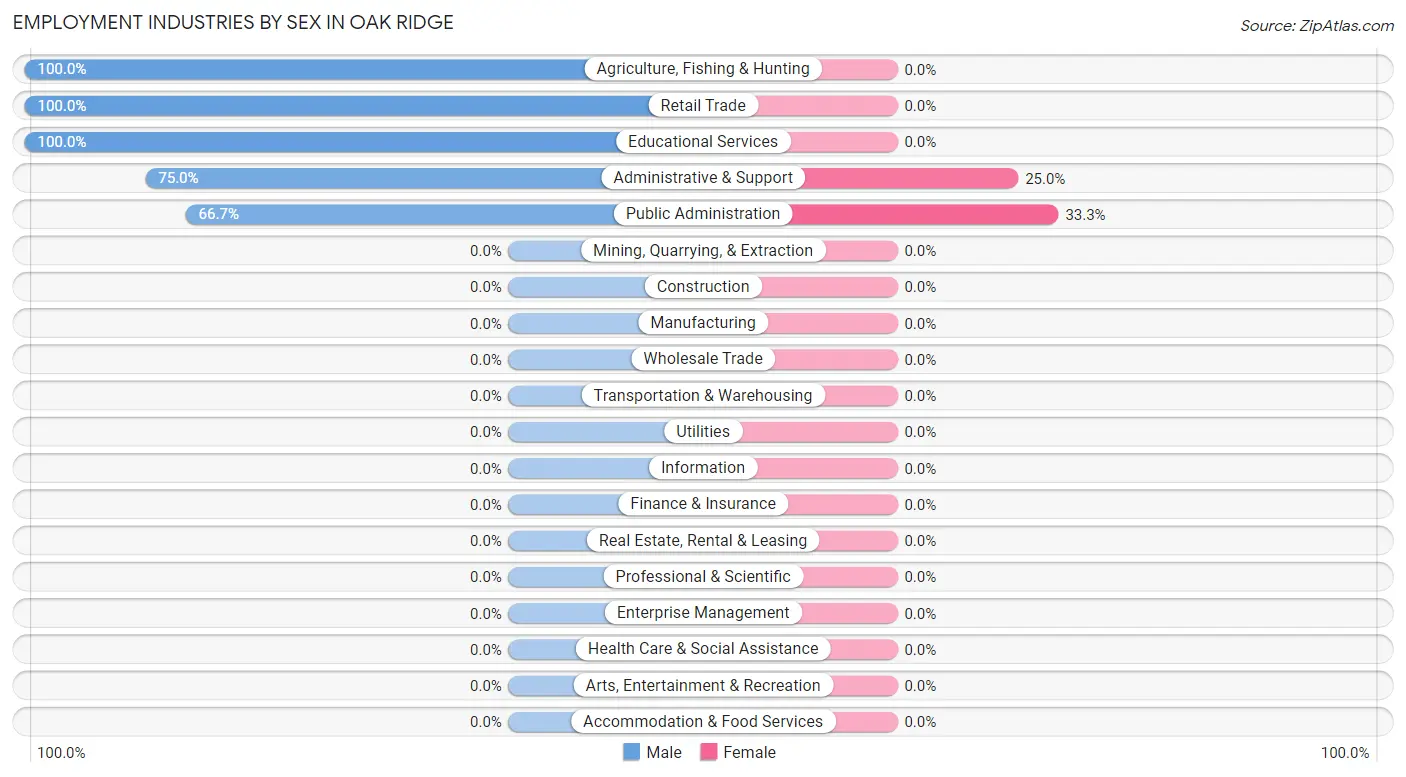
The major employment industries in Oak Ridge include Agriculture, Fishing & Hunting (15 | 31.9%), Retail Trade (10 | 21.3%), Public Administration (6 | 12.8%), Administrative & Support (4 | 8.5%), and Educational Services (2 | 4.3%).
Employment Industries by Sex in Oak Ridge
The Oak Ridge industries that see more men than women are Agriculture, Fishing & Hunting (100.0%), Retail Trade (100.0%), and Educational Services (100.0%), whereas the industries that tend to have a higher number of women are Public Administration (33.3%), and Administrative & Support (25.0%).
| Industry | Male | Female |
| Agriculture, Fishing & Hunting | 15 (100.0%) | 0 (0.0%) |
| Mining, Quarrying, & Extraction | 0 (0.0%) | 0 (0.0%) |
| Construction | 0 (0.0%) | 0 (0.0%) |
| Manufacturing | 0 (0.0%) | 0 (0.0%) |
| Wholesale Trade | 0 (0.0%) | 0 (0.0%) |
| Retail Trade | 10 (100.0%) | 0 (0.0%) |
| Transportation & Warehousing | 0 (0.0%) | 0 (0.0%) |
| Utilities | 0 (0.0%) | 0 (0.0%) |
| Information | 0 (0.0%) | 0 (0.0%) |
| Finance & Insurance | 0 (0.0%) | 0 (0.0%) |
| Real Estate, Rental & Leasing | 0 (0.0%) | 0 (0.0%) |
| Professional & Scientific | 0 (0.0%) | 0 (0.0%) |
| Enterprise Management | 0 (0.0%) | 0 (0.0%) |
| Administrative & Support | 3 (75.0%) | 1 (25.0%) |
| Educational Services | 2 (100.0%) | 0 (0.0%) |
| Health Care & Social Assistance | 0 (0.0%) | 0 (0.0%) |
| Arts, Entertainment & Recreation | 0 (0.0%) | 0 (0.0%) |
| Accommodation & Food Services | 0 (0.0%) | 0 (0.0%) |
| Public Administration | 4 (66.7%) | 2 (33.3%) |
| Total | 34 (72.3%) | 13 (27.7%) |
Education in Oak Ridge
School Enrollment in Oak Ridge
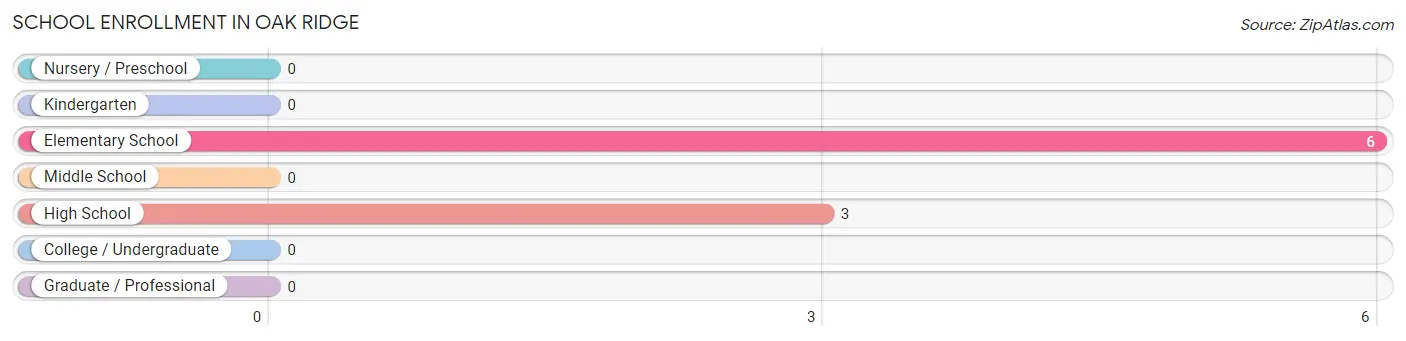
The most common levels of schooling among the 9 students in Oak Ridge are elementary school (6 | 66.7%), and high school (3 | 33.3%).
| School Level | # Students | % Students |
| Nursery / Preschool | 0 | 0.0% |
| Kindergarten | 0 | 0.0% |
| Elementary School | 6 | 66.7% |
| Middle School | 0 | 0.0% |
| High School | 3 | 33.3% |
| College / Undergraduate | 0 | 0.0% |
| Graduate / Professional | 0 | 0.0% |
| Total | 9 | 100.0% |
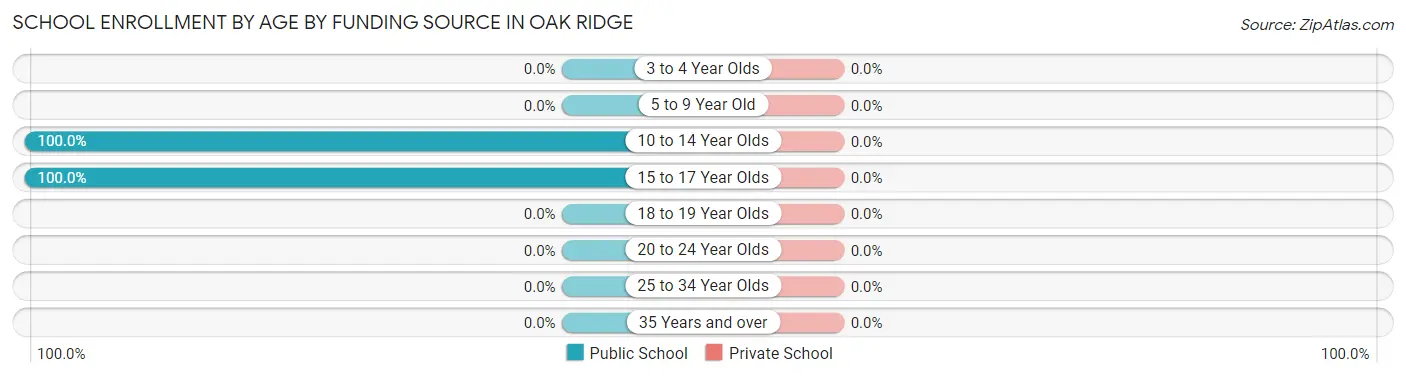
School Enrollment by Age by Funding Source in Oak Ridge
| Age Bracket | Public School | Private School |
| 3 to 4 Year Olds | 0 (0.0%) | 0 (0.0%) |
| 5 to 9 Year Old | 0 (0.0%) | 0 (0.0%) |
| 10 to 14 Year Olds | 6 (100.0%) | 0 (0.0%) |
| 15 to 17 Year Olds | 3 (100.0%) | 0 (0.0%) |
| 18 to 19 Year Olds | 0 (0.0%) | 0 (0.0%) |
| 20 to 24 Year Olds | 0 (0.0%) | 0 (0.0%) |
| 25 to 34 Year Olds | 0 (0.0%) | 0 (0.0%) |
| 35 Years and over | 0 (0.0%) | 0 (0.0%) |
| Total | 9 (100.0%) | 0 (0.0%) |
Educational Attainment by Field of Study in Oak Ridge
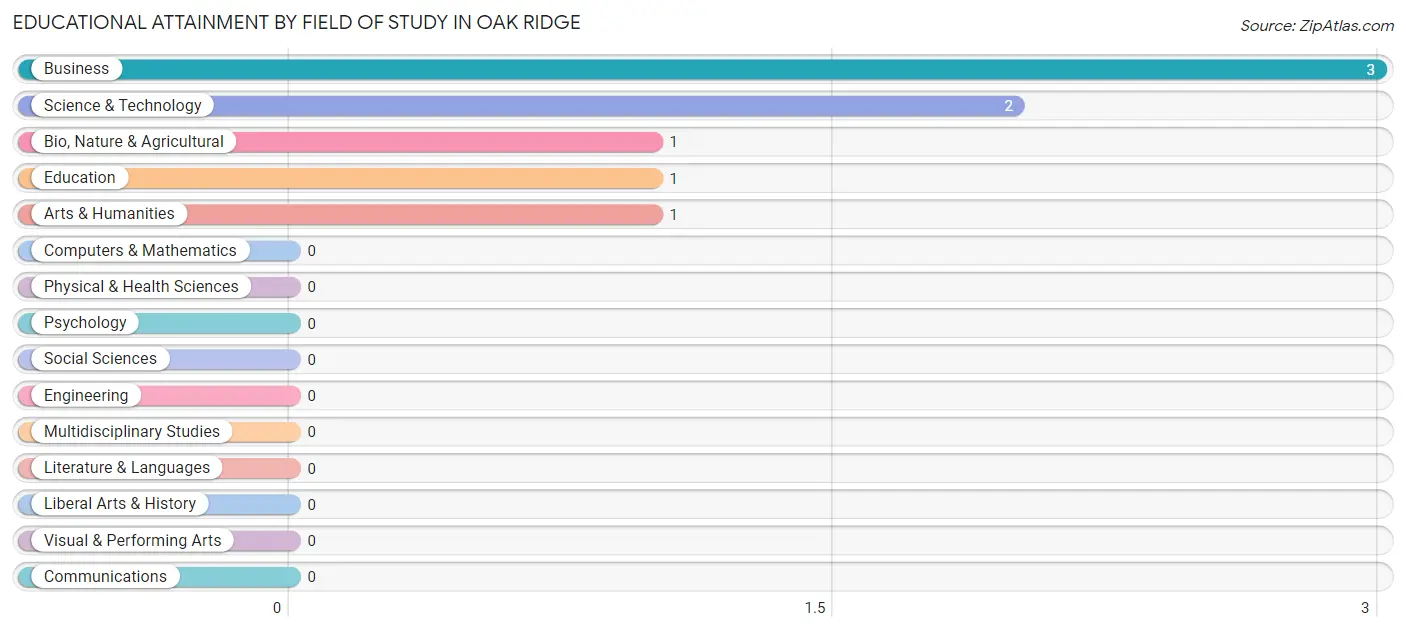
Business (3 | 37.5%), science & technology (2 | 25.0%), bio, nature & agricultural (1 | 12.5%), education (1 | 12.5%), and arts & humanities (1 | 12.5%) are the most common fields of study among 8 individuals in Oak Ridge who have obtained a bachelor's degree or higher.
| Field of Study | # Graduates | % Graduates |
| Computers & Mathematics | 0 | 0.0% |
| Bio, Nature & Agricultural | 1 | 12.5% |
| Physical & Health Sciences | 0 | 0.0% |
| Psychology | 0 | 0.0% |
| Social Sciences | 0 | 0.0% |
| Engineering | 0 | 0.0% |
| Multidisciplinary Studies | 0 | 0.0% |
| Science & Technology | 2 | 25.0% |
| Business | 3 | 37.5% |
| Education | 1 | 12.5% |
| Literature & Languages | 0 | 0.0% |
| Liberal Arts & History | 0 | 0.0% |
| Visual & Performing Arts | 0 | 0.0% |
| Communications | 0 | 0.0% |
| Arts & Humanities | 1 | 12.5% |
| Total | 8 | 100.0% |
Transportation & Commute in Oak Ridge
Vehicle Availability by Sex in Oak Ridge
The most prevalent vehicle ownership categories in Oak Ridge are males with 1 vehicle (18, accounting for 52.9%) and females with 1 vehicle (3, making up 138.5%).
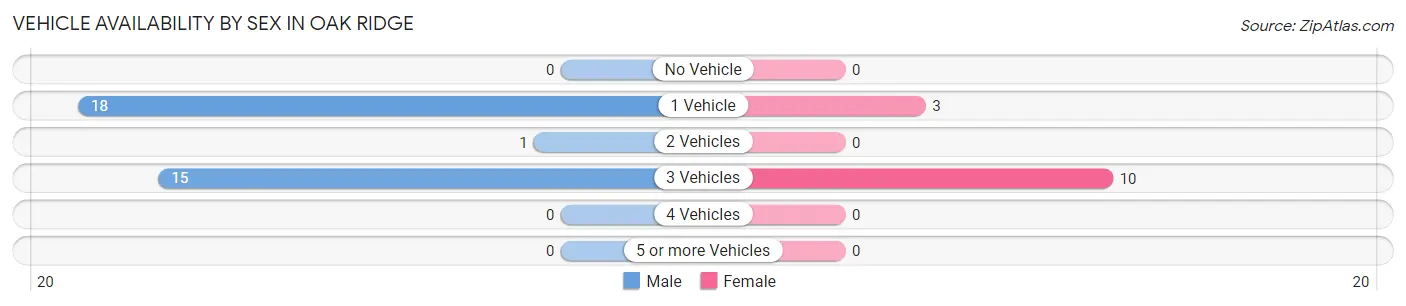
| Vehicles Available | Male | Female |
| No Vehicle | 0 (0.0%) | 0 (0.0%) |
| 1 Vehicle | 18 (52.9%) | 3 (23.1%) |
| 2 Vehicles | 1 (2.9%) | 0 (0.0%) |
| 3 Vehicles | 15 (44.1%) | 10 (76.9%) |
| 4 Vehicles | 0 (0.0%) | 0 (0.0%) |
| 5 or more Vehicles | 0 (0.0%) | 0 (0.0%) |
| Total | 34 (100.0%) | 13 (100.0%) |
Commute Time in Oak Ridge
The most frequently occuring commute durations in Oak Ridge are 5 to 9 minutes (15 commuters, 34.9%), 10 to 14 minutes (9 commuters, 20.9%), and 40 to 44 minutes (6 commuters, 14.0%).
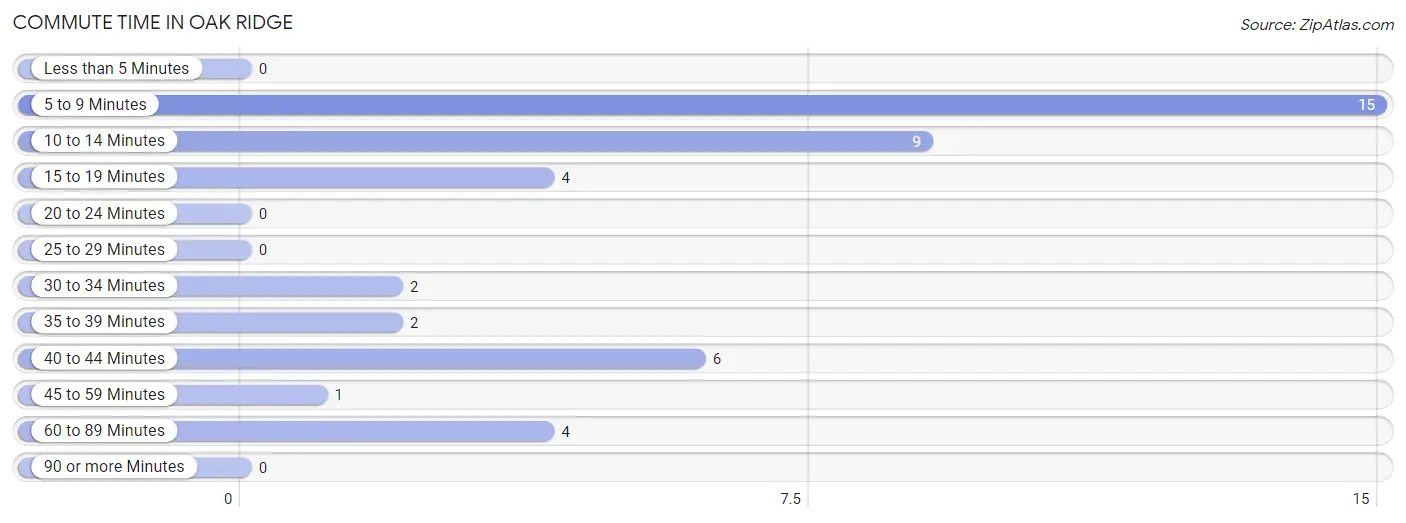
| Commute Time | # Commuters | % Commuters |
| Less than 5 Minutes | 0 | 0.0% |
| 5 to 9 Minutes | 15 | 34.9% |
| 10 to 14 Minutes | 9 | 20.9% |
| 15 to 19 Minutes | 4 | 9.3% |
| 20 to 24 Minutes | 0 | 0.0% |
| 25 to 29 Minutes | 0 | 0.0% |
| 30 to 34 Minutes | 2 | 4.6% |
| 35 to 39 Minutes | 2 | 4.6% |
| 40 to 44 Minutes | 6 | 14.0% |
| 45 to 59 Minutes | 1 | 2.3% |
| 60 to 89 Minutes | 4 | 9.3% |
| 90 or more Minutes | 0 | 0.0% |
Commute Time by Sex in Oak Ridge
The most common commute times in Oak Ridge are 5 to 9 minutes (14 commuters, 46.7%) for males and 10 to 14 minutes (9 commuters, 69.2%) for females.
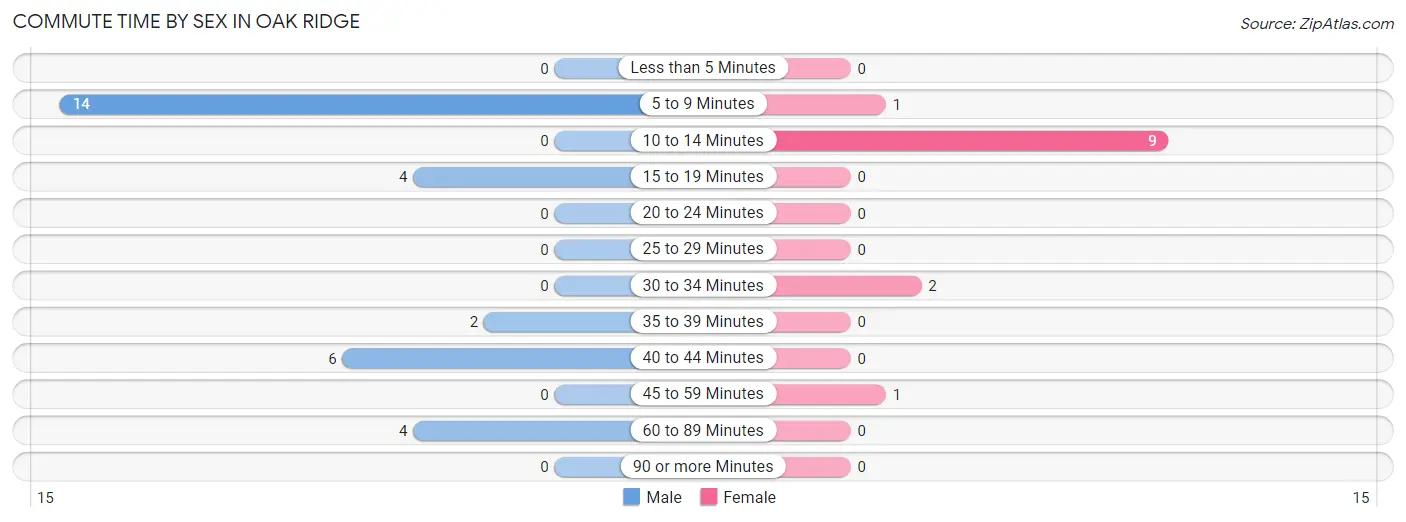
| Commute Time | Male | Female |
| Less than 5 Minutes | 0 (0.0%) | 0 (0.0%) |
| 5 to 9 Minutes | 14 (46.7%) | 1 (7.7%) |
| 10 to 14 Minutes | 0 (0.0%) | 9 (69.2%) |
| 15 to 19 Minutes | 4 (13.3%) | 0 (0.0%) |
| 20 to 24 Minutes | 0 (0.0%) | 0 (0.0%) |
| 25 to 29 Minutes | 0 (0.0%) | 0 (0.0%) |
| 30 to 34 Minutes | 0 (0.0%) | 2 (15.4%) |
| 35 to 39 Minutes | 2 (6.7%) | 0 (0.0%) |
| 40 to 44 Minutes | 6 (20.0%) | 0 (0.0%) |
| 45 to 59 Minutes | 0 (0.0%) | 1 (7.7%) |
| 60 to 89 Minutes | 4 (13.3%) | 0 (0.0%) |
| 90 or more Minutes | 0 (0.0%) | 0 (0.0%) |
Time of Departure to Work by Sex in Oak Ridge
The most frequent times of departure to work in Oak Ridge are 6:00 AM to 6:29 AM (14, 46.7%) for males and 9:00 AM to 9:59 AM (10, 76.9%) for females.
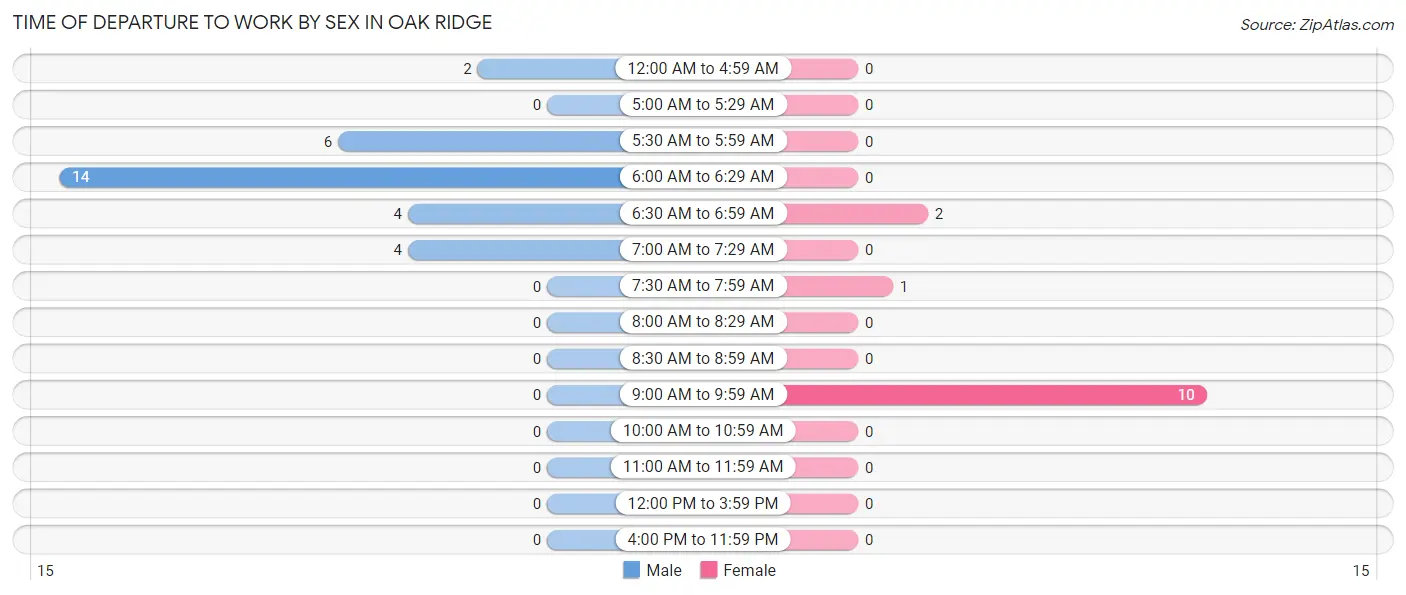
| Time of Departure | Male | Female |
| 12:00 AM to 4:59 AM | 2 (6.7%) | 0 (0.0%) |
| 5:00 AM to 5:29 AM | 0 (0.0%) | 0 (0.0%) |
| 5:30 AM to 5:59 AM | 6 (20.0%) | 0 (0.0%) |
| 6:00 AM to 6:29 AM | 14 (46.7%) | 0 (0.0%) |
| 6:30 AM to 6:59 AM | 4 (13.3%) | 2 (15.4%) |
| 7:00 AM to 7:29 AM | 4 (13.3%) | 0 (0.0%) |
| 7:30 AM to 7:59 AM | 0 (0.0%) | 1 (7.7%) |
| 8:00 AM to 8:29 AM | 0 (0.0%) | 0 (0.0%) |
| 8:30 AM to 8:59 AM | 0 (0.0%) | 0 (0.0%) |
| 9:00 AM to 9:59 AM | 0 (0.0%) | 10 (76.9%) |
| 10:00 AM to 10:59 AM | 0 (0.0%) | 0 (0.0%) |
| 11:00 AM to 11:59 AM | 0 (0.0%) | 0 (0.0%) |
| 12:00 PM to 3:59 PM | 0 (0.0%) | 0 (0.0%) |
| 4:00 PM to 11:59 PM | 0 (0.0%) | 0 (0.0%) |
| Total | 30 (100.0%) | 13 (100.0%) |
Housing Occupancy in Oak Ridge
Occupancy by Ownership in Oak Ridge
Of the total 44 dwellings in Oak Ridge, owner-occupied units account for 26 (59.1%), while renter-occupied units make up 18 (40.9%).
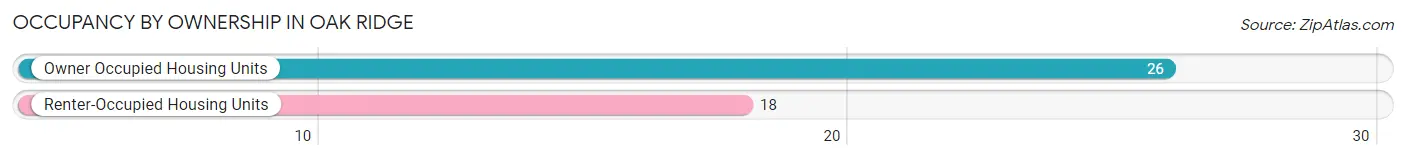
| Occupancy | # Housing Units | % Housing Units |
| Owner Occupied Housing Units | 26 | 59.1% |
| Renter-Occupied Housing Units | 18 | 40.9% |
| Total Occupied Housing Units | 44 | 100.0% |
Occupancy by Household Size in Oak Ridge
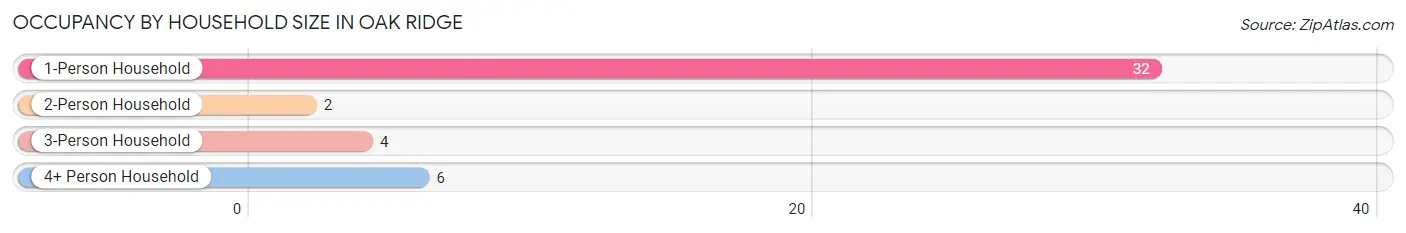
| Household Size | # Housing Units | % Housing Units |
| 1-Person Household | 32 | 72.7% |
| 2-Person Household | 2 | 4.5% |
| 3-Person Household | 4 | 9.1% |
| 4+ Person Household | 6 | 13.6% |
| Total Housing Units | 44 | 100.0% |
Occupancy by Ownership by Household Size in Oak Ridge
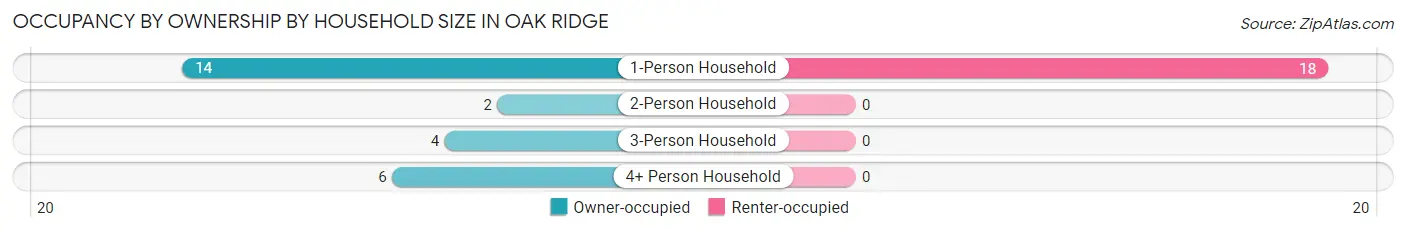
| Household Size | Owner-occupied | Renter-occupied |
| 1-Person Household | 14 (43.8%) | 18 (56.2%) |
| 2-Person Household | 2 (100.0%) | 0 (0.0%) |
| 3-Person Household | 4 (100.0%) | 0 (0.0%) |
| 4+ Person Household | 6 (100.0%) | 0 (0.0%) |
| Total Housing Units | 26 (59.1%) | 18 (40.9%) |
Occupancy by Educational Attainment in Oak Ridge
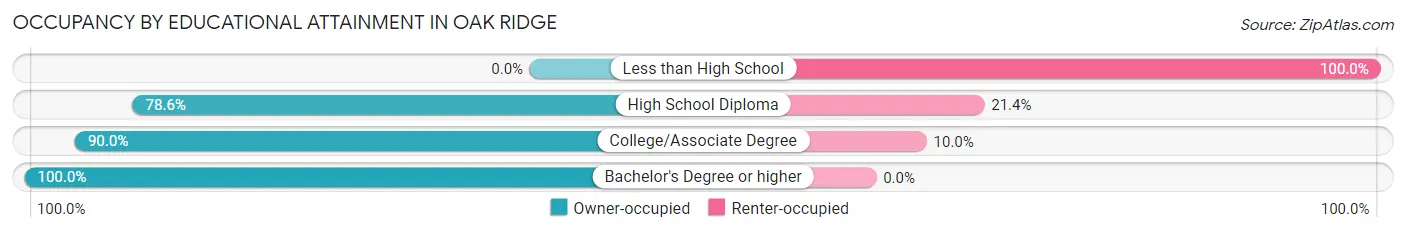
| Household Size | Owner-occupied | Renter-occupied |
| Less than High School | 0 (0.0%) | 14 (100.0%) |
| High School Diploma | 11 (78.6%) | 3 (21.4%) |
| College/Associate Degree | 9 (90.0%) | 1 (10.0%) |
| Bachelor's Degree or higher | 6 (100.0%) | 0 (0.0%) |
Occupancy by Age of Householder in Oak Ridge
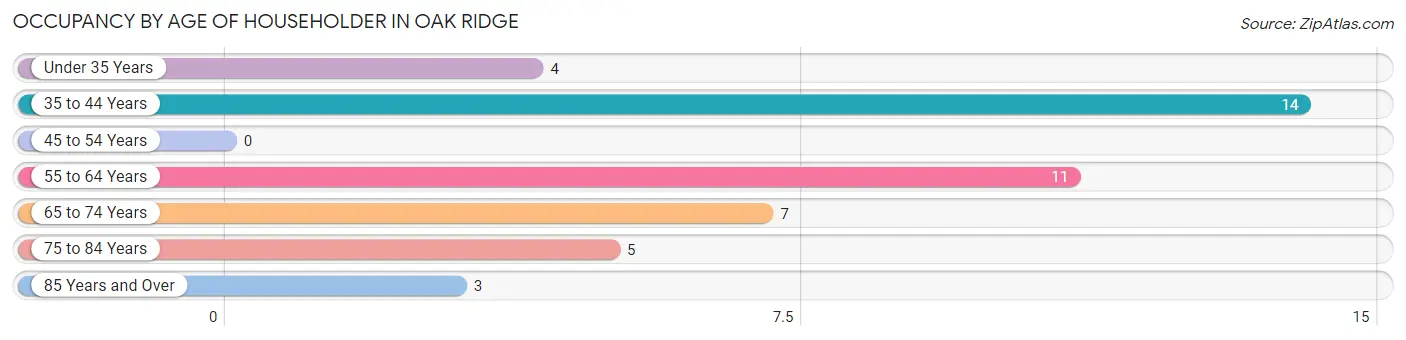
| Age Bracket | # Households | % Households |
| Under 35 Years | 4 | 9.1% |
| 35 to 44 Years | 14 | 31.8% |
| 45 to 54 Years | 0 | 0.0% |
| 55 to 64 Years | 11 | 25.0% |
| 65 to 74 Years | 7 | 15.9% |
| 75 to 84 Years | 5 | 11.4% |
| 85 Years and Over | 3 | 6.8% |
| Total | 44 | 100.0% |
Housing Finances in Oak Ridge
Median Income by Occupancy in Oak Ridge
| Occupancy Type | # Households | Median Income |
| Owner-Occupied | 26 (59.1%) | $0 |
| Renter-Occupied | 18 (40.9%) | $0 |
| Average | 44 (100.0%) | $0 |
Occupancy by Householder Income Bracket in Oak Ridge
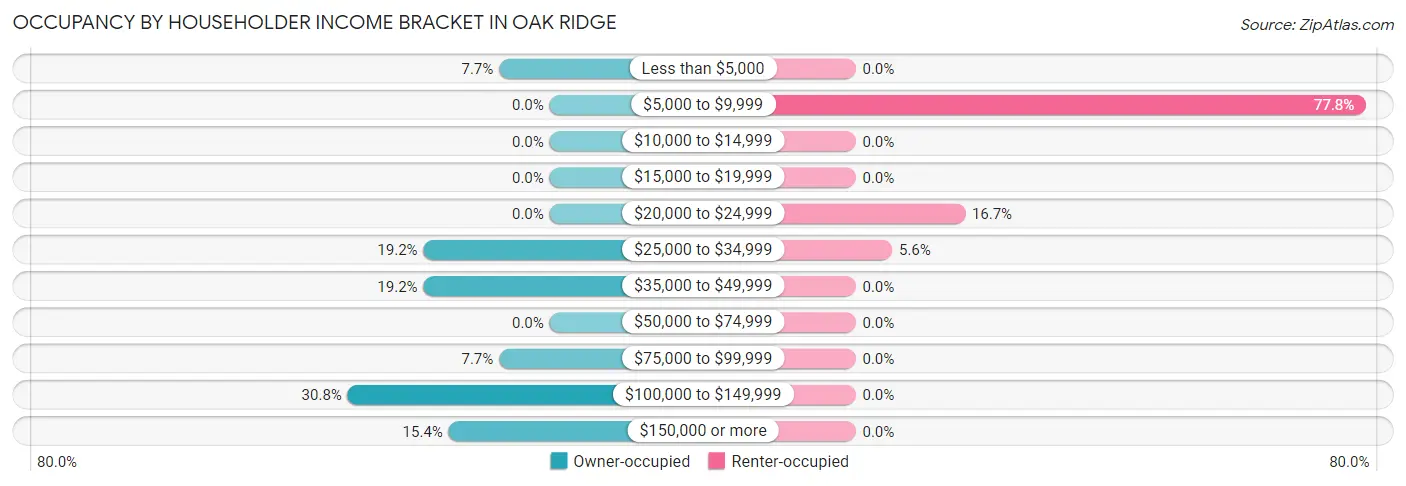
| Income Bracket | Owner-occupied | Renter-occupied |
| Less than $5,000 | 2 (7.7%) | 0 (0.0%) |
| $5,000 to $9,999 | 0 (0.0%) | 14 (77.8%) |
| $10,000 to $14,999 | 0 (0.0%) | 0 (0.0%) |
| $15,000 to $19,999 | 0 (0.0%) | 0 (0.0%) |
| $20,000 to $24,999 | 0 (0.0%) | 3 (16.7%) |
| $25,000 to $34,999 | 5 (19.2%) | 1 (5.6%) |
| $35,000 to $49,999 | 5 (19.2%) | 0 (0.0%) |
| $50,000 to $74,999 | 0 (0.0%) | 0 (0.0%) |
| $75,000 to $99,999 | 2 (7.7%) | 0 (0.0%) |
| $100,000 to $149,999 | 8 (30.8%) | 0 (0.0%) |
| $150,000 or more | 4 (15.4%) | 0 (0.0%) |
| Total | 26 (100.0%) | 18 (100.0%) |
Monthly Housing Cost Tiers in Oak Ridge
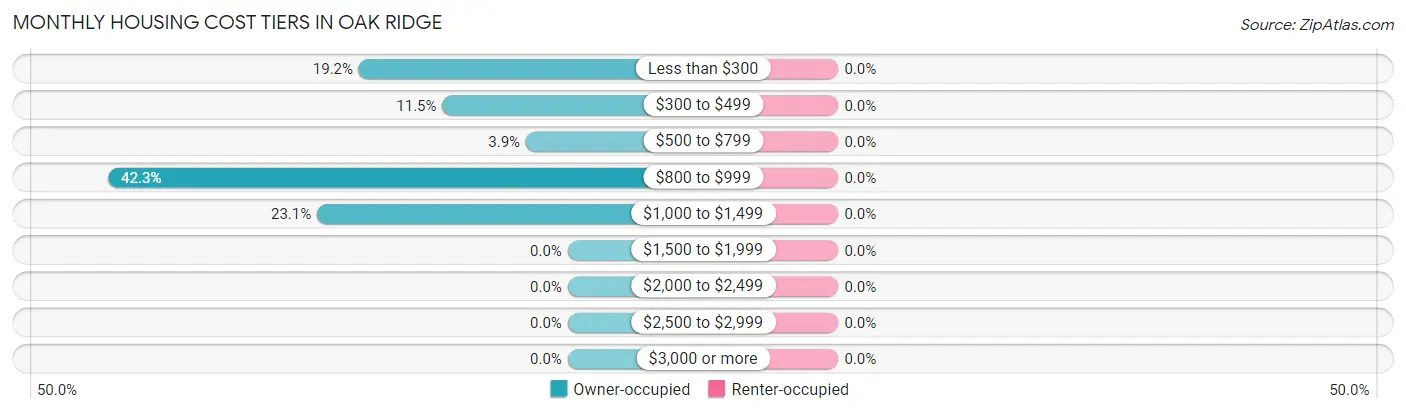
| Monthly Cost | Owner-occupied | Renter-occupied |
| Less than $300 | 5 (19.2%) | 0 (0.0%) |
| $300 to $499 | 3 (11.5%) | 0 (0.0%) |
| $500 to $799 | 1 (3.8%) | 0 (0.0%) |
| $800 to $999 | 11 (42.3%) | 0 (0.0%) |
| $1,000 to $1,499 | 6 (23.1%) | 0 (0.0%) |
| $1,500 to $1,999 | 0 (0.0%) | 0 (0.0%) |
| $2,000 to $2,499 | 0 (0.0%) | 0 (0.0%) |
| $2,500 to $2,999 | 0 (0.0%) | 0 (0.0%) |
| $3,000 or more | 0 (0.0%) | 0 (0.0%) |
| Total | 26 (100.0%) | 18 (100.0%) |
Physical Housing Characteristics in Oak Ridge
Housing Structures in Oak Ridge
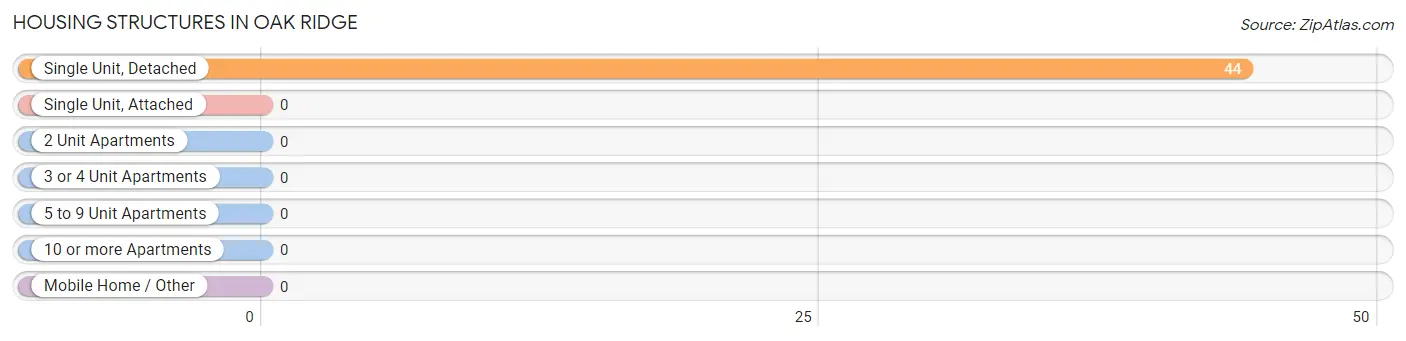
| Structure Type | # Housing Units | % Housing Units |
| Single Unit, Detached | 44 | 100.0% |
| Single Unit, Attached | 0 | 0.0% |
| 2 Unit Apartments | 0 | 0.0% |
| 3 or 4 Unit Apartments | 0 | 0.0% |
| 5 to 9 Unit Apartments | 0 | 0.0% |
| 10 or more Apartments | 0 | 0.0% |
| Mobile Home / Other | 0 | 0.0% |
| Total | 44 | 100.0% |
Housing Structures by Occupancy in Oak Ridge
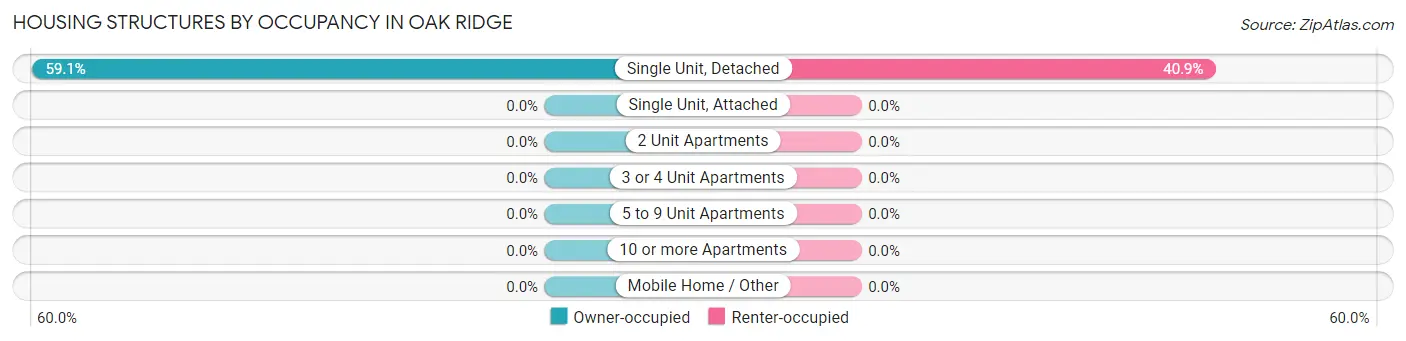
| Structure Type | Owner-occupied | Renter-occupied |
| Single Unit, Detached | 26 (59.1%) | 18 (40.9%) |
| Single Unit, Attached | 0 (0.0%) | 0 (0.0%) |
| 2 Unit Apartments | 0 (0.0%) | 0 (0.0%) |
| 3 or 4 Unit Apartments | 0 (0.0%) | 0 (0.0%) |
| 5 to 9 Unit Apartments | 0 (0.0%) | 0 (0.0%) |
| 10 or more Apartments | 0 (0.0%) | 0 (0.0%) |
| Mobile Home / Other | 0 (0.0%) | 0 (0.0%) |
| Total | 26 (59.1%) | 18 (40.9%) |
Housing Structures by Number of Rooms in Oak Ridge
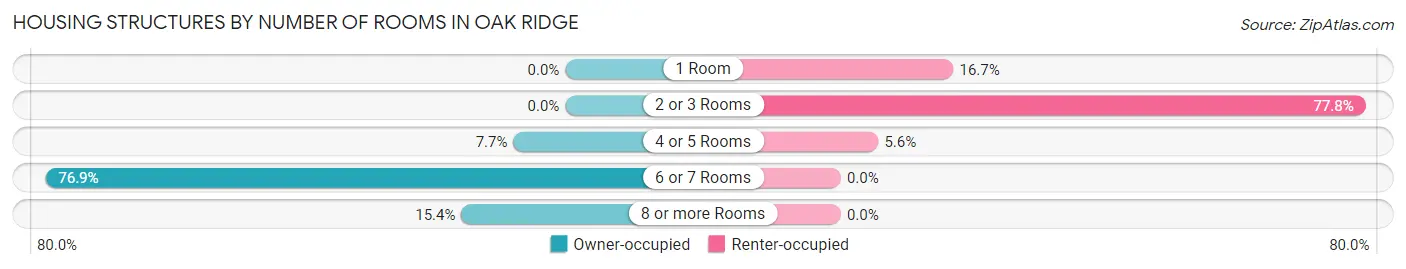
| Number of Rooms | Owner-occupied | Renter-occupied |
| 1 Room | 0 (0.0%) | 3 (16.7%) |
| 2 or 3 Rooms | 0 (0.0%) | 14 (77.8%) |
| 4 or 5 Rooms | 2 (7.7%) | 1 (5.6%) |
| 6 or 7 Rooms | 20 (76.9%) | 0 (0.0%) |
| 8 or more Rooms | 4 (15.4%) | 0 (0.0%) |
| Total | 26 (100.0%) | 18 (100.0%) |
Housing Structure by Heating Type in Oak Ridge
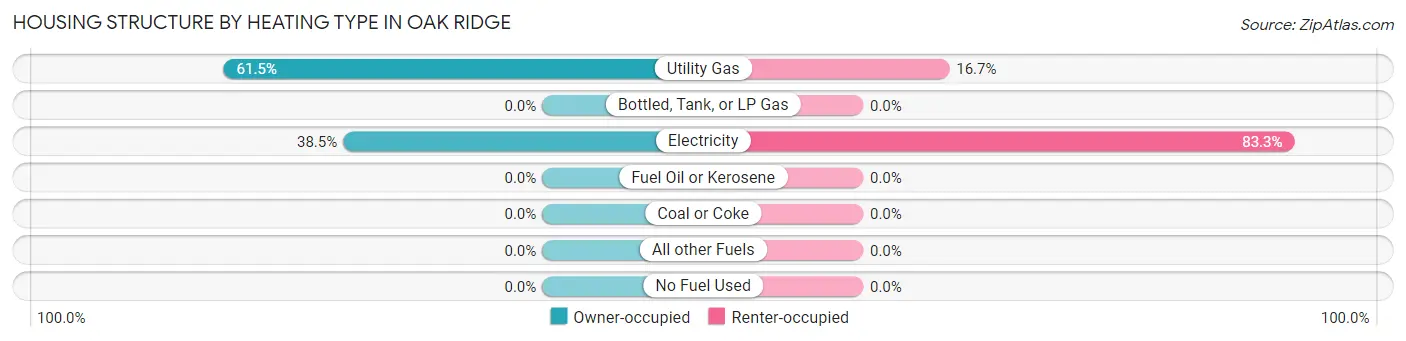
| Heating Type | Owner-occupied | Renter-occupied |
| Utility Gas | 16 (61.5%) | 3 (16.7%) |
| Bottled, Tank, or LP Gas | 0 (0.0%) | 0 (0.0%) |
| Electricity | 10 (38.5%) | 15 (83.3%) |
| Fuel Oil or Kerosene | 0 (0.0%) | 0 (0.0%) |
| Coal or Coke | 0 (0.0%) | 0 (0.0%) |
| All other Fuels | 0 (0.0%) | 0 (0.0%) |
| No Fuel Used | 0 (0.0%) | 0 (0.0%) |
| Total | 26 (100.0%) | 18 (100.0%) |
Household Vehicle Usage in Oak Ridge
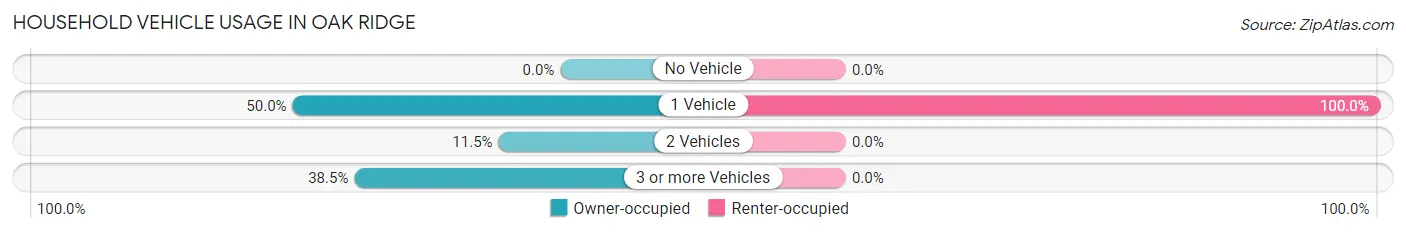
| Vehicles per Household | Owner-occupied | Renter-occupied |
| No Vehicle | 0 (0.0%) | 0 (0.0%) |
| 1 Vehicle | 13 (50.0%) | 18 (100.0%) |
| 2 Vehicles | 3 (11.5%) | 0 (0.0%) |
| 3 or more Vehicles | 10 (38.5%) | 0 (0.0%) |
| Total | 26 (100.0%) | 18 (100.0%) |
Real Estate & Mortgages in Oak Ridge
Real Estate and Mortgage Overview in Oak Ridge
| Characteristic | Without Mortgage | With Mortgage |
| Housing Units | 13 | 13 |
| Median Property Value | - | - |
| Median Household Income | - | - |
| Monthly Housing Costs | - | - |
| Real Estate Taxes | $2,200 | $4 |
Property Value by Mortgage Status in Oak Ridge
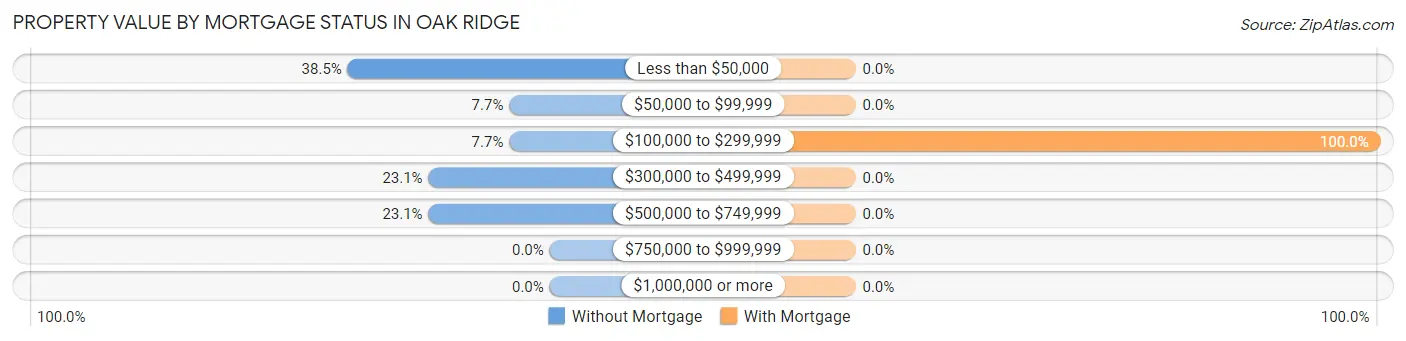
| Property Value | Without Mortgage | With Mortgage |
| Less than $50,000 | 5 (38.5%) | 0 (0.0%) |
| $50,000 to $99,999 | 1 (7.7%) | 0 (0.0%) |
| $100,000 to $299,999 | 1 (7.7%) | 13 (100.0%) |
| $300,000 to $499,999 | 3 (23.1%) | 0 (0.0%) |
| $500,000 to $749,999 | 3 (23.1%) | 0 (0.0%) |
| $750,000 to $999,999 | 0 (0.0%) | 0 (0.0%) |
| $1,000,000 or more | 0 (0.0%) | 0 (0.0%) |
| Total | 13 (100.0%) | 13 (100.0%) |
Household Income by Mortgage Status in Oak Ridge
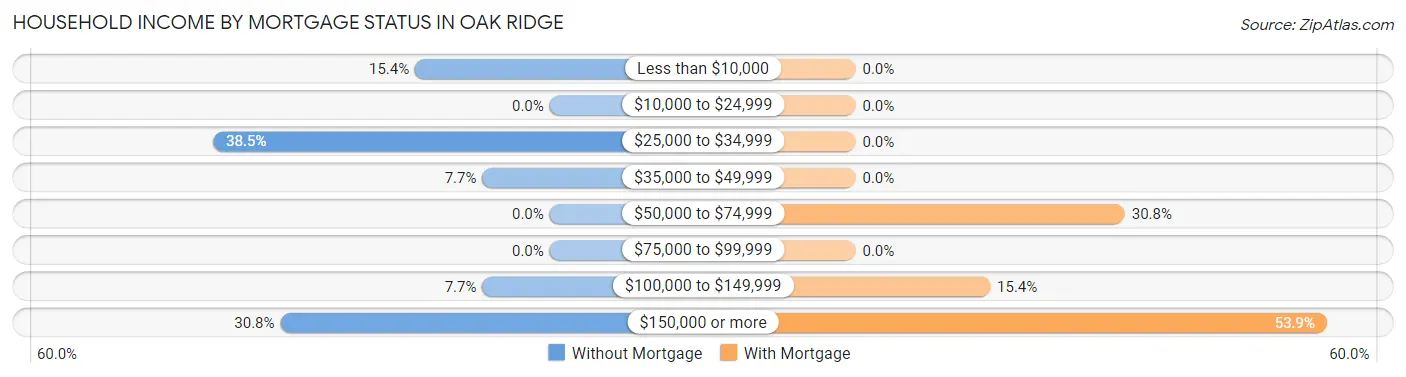
| Household Income | Without Mortgage | With Mortgage |
| Less than $10,000 | 2 (15.4%) | 0 (0.0%) |
| $10,000 to $24,999 | 0 (0.0%) | 0 (0.0%) |
| $25,000 to $34,999 | 5 (38.5%) | 0 (0.0%) |
| $35,000 to $49,999 | 1 (7.7%) | 0 (0.0%) |
| $50,000 to $74,999 | 0 (0.0%) | 4 (30.8%) |
| $75,000 to $99,999 | 0 (0.0%) | 0 (0.0%) |
| $100,000 to $149,999 | 1 (7.7%) | 2 (15.4%) |
| $150,000 or more | 4 (30.8%) | 7 (53.8%) |
| Total | 13 (100.0%) | 13 (100.0%) |
Property Value to Household Income Ratio in Oak Ridge
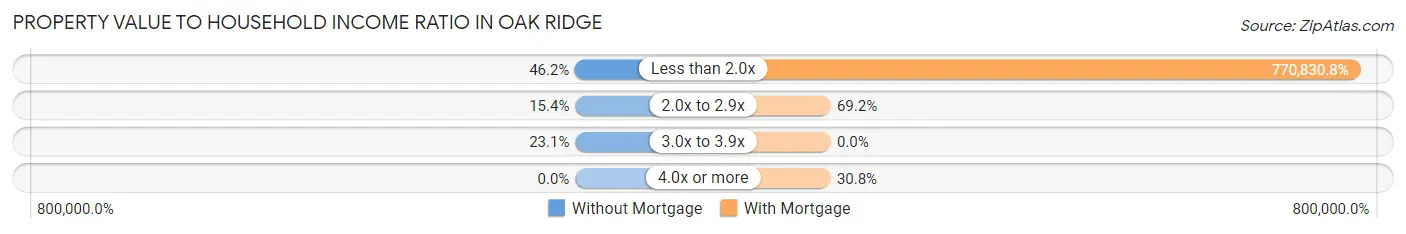
| Value-to-Income Ratio | Without Mortgage | With Mortgage |
| Less than 2.0x | 6 (46.2%) | 100,208 (770,830.8%) |
| 2.0x to 2.9x | 2 (15.4%) | 9 (69.2%) |
| 3.0x to 3.9x | 3 (23.1%) | 0 (0.0%) |
| 4.0x or more | 0 (0.0%) | 4 (30.8%) |
| Total | 13 (100.0%) | 13 (100.0%) |
Real Estate Taxes by Mortgage Status in Oak Ridge
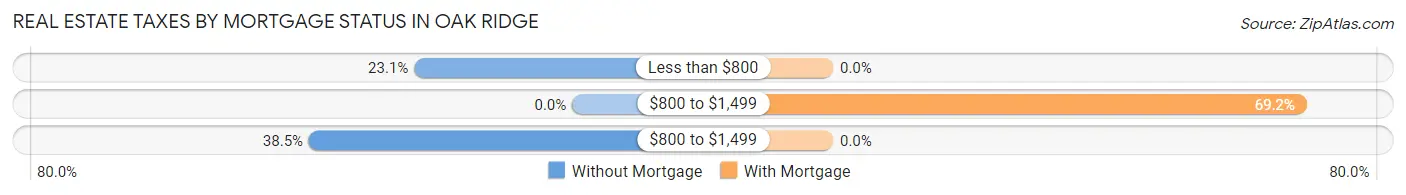
| Property Taxes | Without Mortgage | With Mortgage |
| Less than $800 | 3 (23.1%) | 0 (0.0%) |
| $800 to $1,499 | 0 (0.0%) | 9 (69.2%) |
| $800 to $1,499 | 5 (38.5%) | 0 (0.0%) |
| Total | 13 (100.0%) | 13 (100.0%) |
Health & Disability in Oak Ridge
Health Insurance Coverage by Age in Oak Ridge
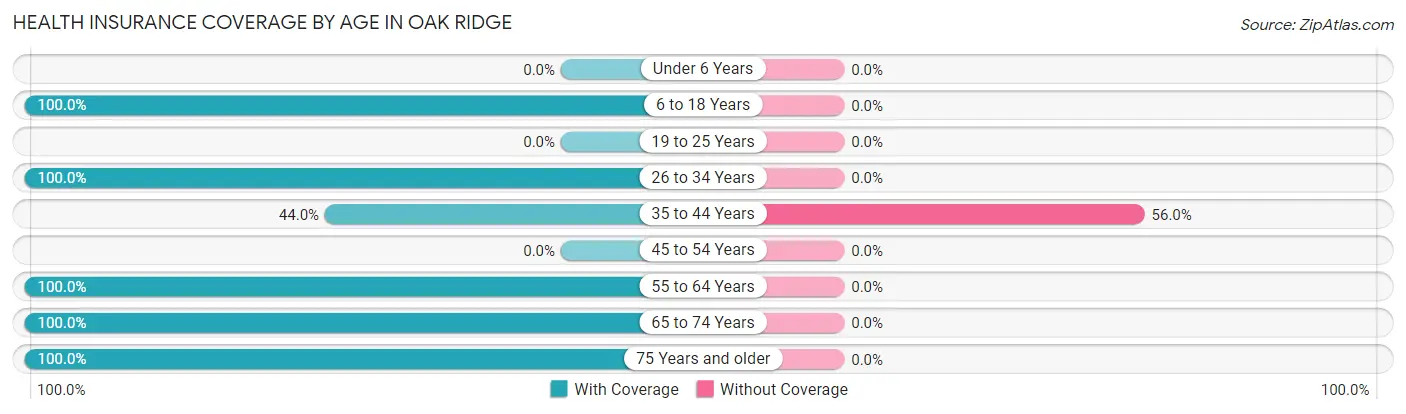
| Age Bracket | With Coverage | Without Coverage |
| Under 6 Years | 0 (0.0%) | 0 (0.0%) |
| 6 to 18 Years | 9 (100.0%) | 0 (0.0%) |
| 19 to 25 Years | 0 (0.0%) | 0 (0.0%) |
| 26 to 34 Years | 4 (100.0%) | 0 (0.0%) |
| 35 to 44 Years | 11 (44.0%) | 14 (56.0%) |
| 45 to 54 Years | 0 (0.0%) | 0 (0.0%) |
| 55 to 64 Years | 16 (100.0%) | 0 (0.0%) |
| 65 to 74 Years | 13 (100.0%) | 0 (0.0%) |
| 75 Years and older | 22 (100.0%) | 0 (0.0%) |
| Total | 75 (84.3%) | 14 (15.7%) |
Health Insurance Coverage by Citizenship Status in Oak Ridge

| Citizenship Status | With Coverage | Without Coverage |
| Native Born | 0 (0.0%) | 0 (0.0%) |
| Foreign Born, Citizen | 9 (100.0%) | 0 (0.0%) |
| Foreign Born, not a Citizen | 0 (0.0%) | 0 (0.0%) |
Health Insurance Coverage by Household Income in Oak Ridge
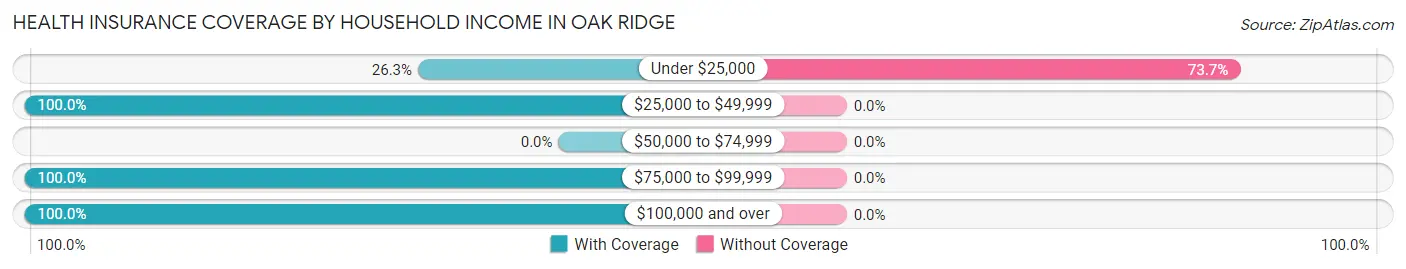
| Household Income | With Coverage | Without Coverage |
| Under $25,000 | 5 (26.3%) | 14 (73.7%) |
| $25,000 to $49,999 | 11 (100.0%) | 0 (0.0%) |
| $50,000 to $74,999 | 0 (0.0%) | 0 (0.0%) |
| $75,000 to $99,999 | 2 (100.0%) | 0 (0.0%) |
| $100,000 and over | 57 (100.0%) | 0 (0.0%) |
Public vs Private Health Insurance Coverage by Age in Oak Ridge
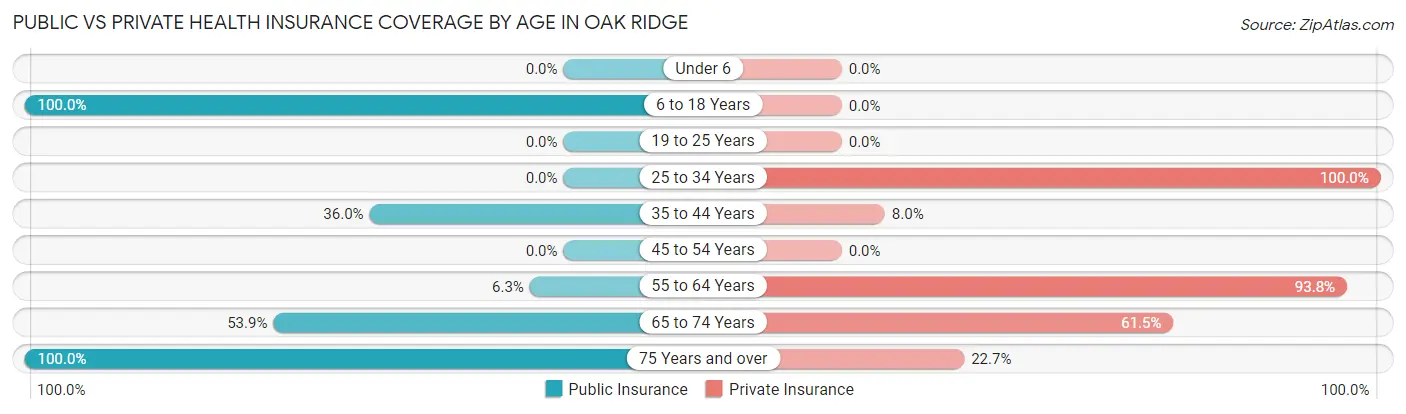
| Age Bracket | Public Insurance | Private Insurance |
| Under 6 | 0 (0.0%) | 0 (0.0%) |
| 6 to 18 Years | 9 (100.0%) | 0 (0.0%) |
| 19 to 25 Years | 0 (0.0%) | 0 (0.0%) |
| 25 to 34 Years | 0 (0.0%) | 4 (100.0%) |
| 35 to 44 Years | 9 (36.0%) | 2 (8.0%) |
| 45 to 54 Years | 0 (0.0%) | 0 (0.0%) |
| 55 to 64 Years | 1 (6.2%) | 15 (93.8%) |
| 65 to 74 Years | 7 (53.8%) | 8 (61.5%) |
| 75 Years and over | 22 (100.0%) | 5 (22.7%) |
| Total | 48 (53.9%) | 34 (38.2%) |
Disability Status by Sex by Age in Oak Ridge
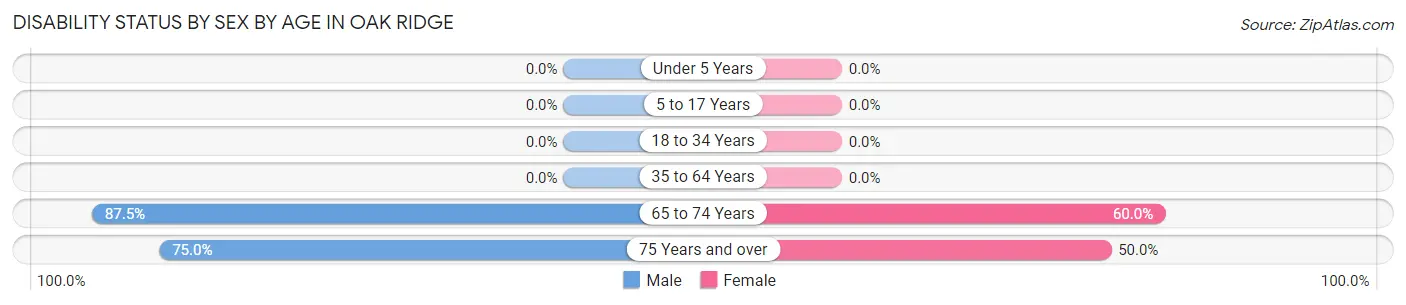
| Age Bracket | Male | Female |
| Under 5 Years | 0 (0.0%) | 0 (0.0%) |
| 5 to 17 Years | 0 (0.0%) | 0 (0.0%) |
| 18 to 34 Years | 0 (0.0%) | 0 (0.0%) |
| 35 to 64 Years | 0 (0.0%) | 0 (0.0%) |
| 65 to 74 Years | 7 (87.5%) | 3 (60.0%) |
| 75 Years and over | 15 (75.0%) | 1 (50.0%) |
Disability Class by Sex by Age in Oak Ridge
Disability Class: Hearing Difficulty
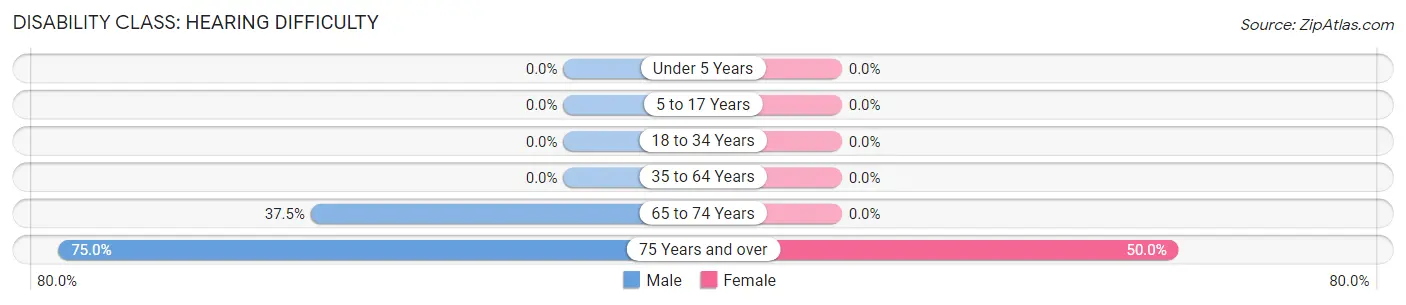
| Age Bracket | Male | Female |
| Under 5 Years | 0 (0.0%) | 0 (0.0%) |
| 5 to 17 Years | 0 (0.0%) | 0 (0.0%) |
| 18 to 34 Years | 0 (0.0%) | 0 (0.0%) |
| 35 to 64 Years | 0 (0.0%) | 0 (0.0%) |
| 65 to 74 Years | 3 (37.5%) | 0 (0.0%) |
| 75 Years and over | 15 (75.0%) | 1 (50.0%) |
Disability Class: Vision Difficulty
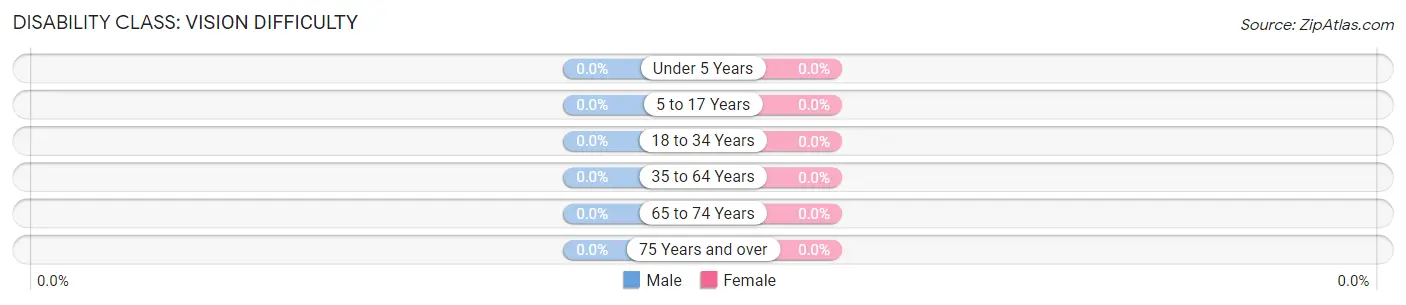
| Age Bracket | Male | Female |
| Under 5 Years | 0 (0.0%) | 0 (0.0%) |
| 5 to 17 Years | 0 (0.0%) | 0 (0.0%) |
| 18 to 34 Years | 0 (0.0%) | 0 (0.0%) |
| 35 to 64 Years | 0 (0.0%) | 0 (0.0%) |
| 65 to 74 Years | 0 (0.0%) | 0 (0.0%) |
| 75 Years and over | 0 (0.0%) | 0 (0.0%) |
Disability Class: Cognitive Difficulty
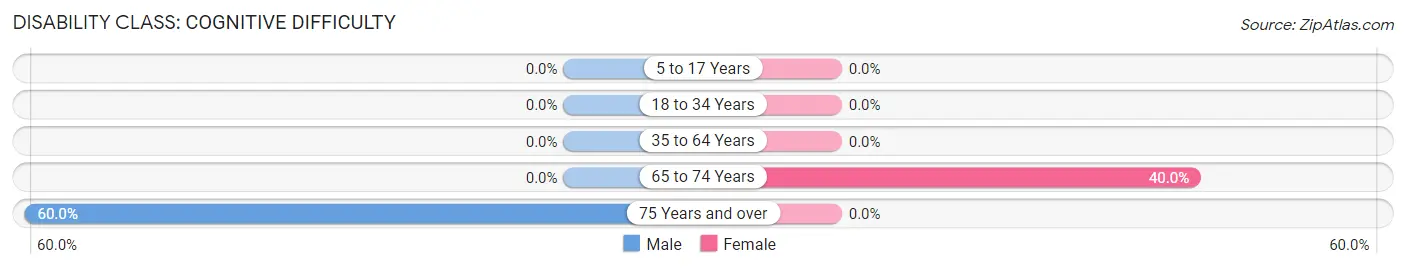
| Age Bracket | Male | Female |
| 5 to 17 Years | 0 (0.0%) | 0 (0.0%) |
| 18 to 34 Years | 0 (0.0%) | 0 (0.0%) |
| 35 to 64 Years | 0 (0.0%) | 0 (0.0%) |
| 65 to 74 Years | 0 (0.0%) | 2 (40.0%) |
| 75 Years and over | 12 (60.0%) | 0 (0.0%) |
Disability Class: Ambulatory Difficulty
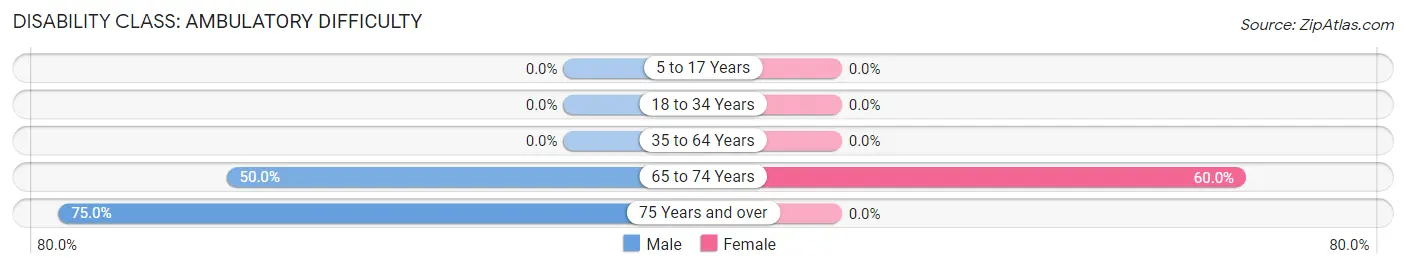
| Age Bracket | Male | Female |
| 5 to 17 Years | 0 (0.0%) | 0 (0.0%) |
| 18 to 34 Years | 0 (0.0%) | 0 (0.0%) |
| 35 to 64 Years | 0 (0.0%) | 0 (0.0%) |
| 65 to 74 Years | 4 (50.0%) | 3 (60.0%) |
| 75 Years and over | 15 (75.0%) | 0 (0.0%) |
Disability Class: Self-Care Difficulty
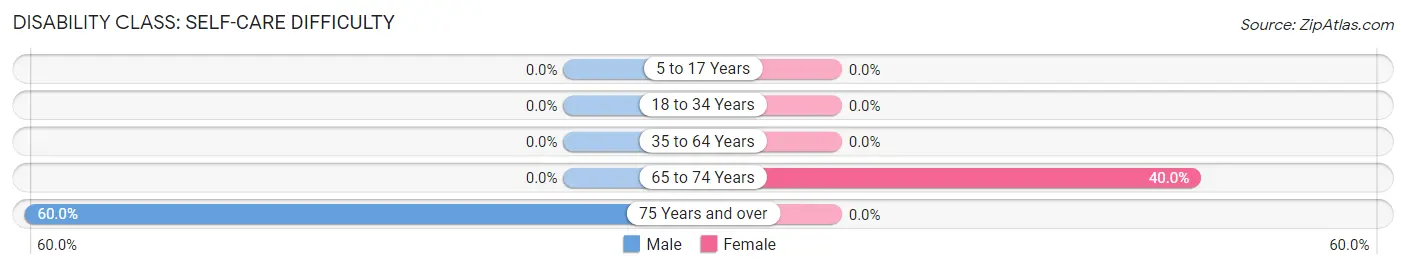
| Age Bracket | Male | Female |
| 5 to 17 Years | 0 (0.0%) | 0 (0.0%) |
| 18 to 34 Years | 0 (0.0%) | 0 (0.0%) |
| 35 to 64 Years | 0 (0.0%) | 0 (0.0%) |
| 65 to 74 Years | 0 (0.0%) | 2 (40.0%) |
| 75 Years and over | 12 (60.0%) | 0 (0.0%) |
Technology Access in Oak Ridge
Computing Device Access in Oak Ridge
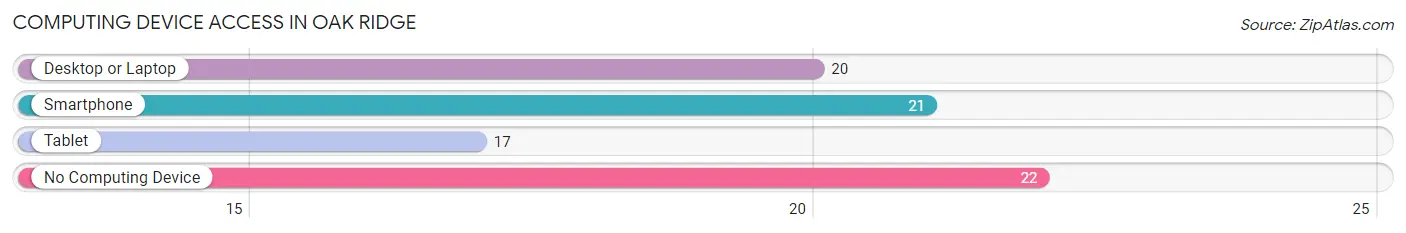
| Device Type | # Households | % Households |
| Desktop or Laptop | 20 | 45.5% |
| Smartphone | 21 | 47.7% |
| Tablet | 17 | 38.6% |
| No Computing Device | 22 | 50.0% |
| Total | 44 | 100.0% |
Internet Access in Oak Ridge
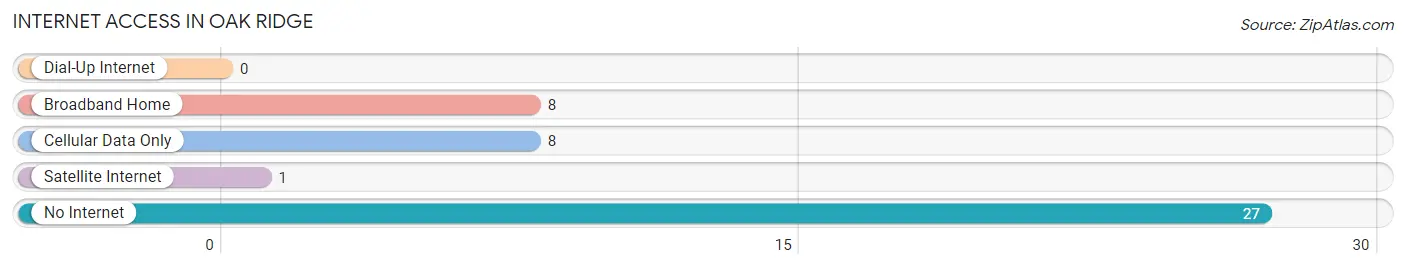
| Internet Type | # Households | % Households |
| Dial-Up Internet | 0 | 0.0% |
| Broadband Home | 8 | 18.2% |
| Cellular Data Only | 8 | 18.2% |
| Satellite Internet | 1 | 2.3% |
| No Internet | 27 | 61.4% |
| Total | 44 | 100.0% |
Oak Ridge Summary
Oak Ridge is a small unincorporated community located in the northern part of Livingston Parish, Louisiana. It is situated on the banks of the Tickfaw River, approximately 25 miles northeast of Baton Rouge. The community was founded in the early 1800s and has a population of approximately 1,000 people.
History
Oak Ridge was first settled in the early 1800s by a group of settlers from the nearby town of Springfield. The settlers were attracted to the area due to its abundance of timber and the presence of the Tickfaw River. The settlers built a small community and named it Oak Ridge.
The community grew slowly over the years and by the mid-1800s, it had become a thriving agricultural center. The town was home to several cotton plantations and a number of small businesses. In the late 1800s, the town was connected to the outside world by the railroad, which allowed for the transportation of goods and people.
In the early 1900s, the town began to experience a decline in population as many of the residents moved away in search of better opportunities. The population continued to decline until the 1950s when the town was revitalized by the construction of a new bridge over the Tickfaw River. This bridge allowed for the transportation of goods and people to and from the town.
Geography
Oak Ridge is located in the northern part of Livingston Parish, Louisiana. It is situated on the banks of the Tickfaw River, approximately 25 miles northeast of Baton Rouge. The town is surrounded by a number of small towns and communities, including Springfield, Denham Springs, and Watson.
The town is located in a rural area and is surrounded by forests and wetlands. The area is known for its abundance of wildlife, including deer, wild turkeys, and a variety of birds. The town is also home to a number of small lakes and ponds, which provide a habitat for a variety of fish and other aquatic life.
Economy
Oak Ridge is a small, rural community and the economy is largely based on agriculture. The town is home to several small farms and ranches, which produce a variety of crops, including corn, soybeans, and cotton. The town is also home to a number of small businesses, including convenience stores, restaurants, and gas stations.
The town is also home to a number of small manufacturing businesses, which produce a variety of products, including furniture, clothing, and electronics. The town is also home to a number of small service businesses, including auto repair shops, beauty salons, and dry cleaners.
Demographics
As of the 2010 census, the population of Oak Ridge was 1,000 people. The racial makeup of the town was 97.2% White, 0.7% African American, 0.3% Native American, 0.2% Asian, and 1.6% from other races. The median household income was $37,500 and the median family income was $41,250.
The town is home to a number of churches, including the Oak Ridge Baptist Church, the Oak Ridge Methodist Church, and the Oak Ridge Presbyterian Church. The town is also home to a number of schools, including the Oak Ridge Elementary School, the Oak Ridge Middle School, and the Oak Ridge High School.
Conclusion
Oak Ridge is a small, rural community located in the northern part of Livingston Parish, Louisiana. It is situated on the banks of the Tickfaw River, approximately 25 miles northeast of Baton Rouge. The town was founded in the early 1800s and has a population of approximately 1,000 people. The economy of the town is largely based on agriculture and small businesses. The racial makeup of the town is 97.2% White, 0.7% African American, 0.3% Native American, 0.2% Asian, and 1.6% from other races. The town is home to a number of churches, schools, and businesses.
Common Questions
What is Per Capita Income in Oak Ridge?
Per Capita income in Oak Ridge is $31,215.
What is the Median Family Income in Oak Ridge?
Median Family Income in Oak Ridge is $102,500.
What is Inequality or Gini Index in Oak Ridge?
Inequality or Gini Index in Oak Ridge is 0.52.
What is the Total Population of Oak Ridge?
Total Population of Oak Ridge is 89.
What is the Total Male Population of Oak Ridge?
Total Male Population of Oak Ridge is 59.
What is the Total Female Population of Oak Ridge?
Total Female Population of Oak Ridge is 30.
What is the Ratio of Males per 100 Females in Oak Ridge?
There are 196.67 Males per 100 Females in Oak Ridge.
What is the Ratio of Females per 100 Males in Oak Ridge?
There are 50.85 Females per 100 Males in Oak Ridge.
What is the Median Population Age in Oak Ridge?
Median Population Age in Oak Ridge is 58.3 Years.
What is the Average Family Size in Oak Ridge
Average Family Size in Oak Ridge is 4.8 People.
What is the Average Household Size in Oak Ridge
Average Household Size in Oak Ridge is 2.0 People.
How Large is the Labor Force in Oak Ridge?
There are 47 People in the Labor Forcein in Oak Ridge.
What is the Percentage of People in the Labor Force in Oak Ridge?
56.6% of People are in the Labor Force in Oak Ridge.